The Impact of a Reduced Rate of VAT on Restaurants - Economic Policy Division October 2009
←
→
Page content transcription
If your browser does not render page correctly, please read the page content below
The Impact of a Reduced
Rate of VAT on
Restaurants

Economic Policy Division
October 2009
II
Table of Contents

Chapter                                                                   Page

1. Scope of this Report                                                      1

 1.1 International Experience                                                2
 1.2 The VAT Rate on Restaurants in Malta                                    3

2. Country Studies on Factors affecting Tourism Demand                       4

 2.1 Malta                                                                   4
 2.2 Spain                                                                   6
 2.3 Cyprus                                                                  6
 2.4 Turkey                                                                  7
 2.5 Croatia                                                                 7
 2.6 Italy                                                                   8
 2.7 France                                                                  9
 2.8 Balearic Islands                                                        9
 2.9 Canary Islands                                                          9
 2.10 Conclusion                                                            10

3. Theoretical and Empirical Considerations                                 11

 3.1 The Price Elasticity of Demand, Market Structures and Pass Through     11
 3.2 Empirical Results                                                      12

  3.2.1 The Degree of Pass Through                                          13
  3.2.2 The Impact on Demand and Production                                 13
  3.2.3 The Impact on Employment                                            13

 3.3 Conclusion                                                             14

4. Analysing the Competitiveness Level of the Restaurant                    15
Sector

 4.1 Brief Description of the Restaurant Sector                             15
 4.2 Possible sources of Market Power                                       15
 4.3 Measurements of Market Power                                           16

  4.3.1 Observed Price Movement                                             16

 4.4 Drawing inferences about Market Competitiveness                        17

                                                                             I
5. Modelling the Reduction in VAT using SAMM 19
5.1 The Expected Impact of the Reduction in VAT 19
5.2 Limitations and Further Considerations 21
5.3 Results from the Baseline Scenario 23
5.4 The Pass Through to Final Goods Prices 26
5.5 Sensitivity of the Results to Competitors’ Strategies 27
5.6 Fiscal Sustainability 29
6. Conclusion 32
References 34
Appendix 1: MHRA Proposed Terms of Reference 35
Appendix 2: Partial Equilibrium Analysis of Tourism Earnings 38
Appendix 3: Underdeclaration of VAT 40
II1. Scope of this Report
The communication on VAT rates other than standard VAT rates which the
Commission presented to the European Parliament and the Council in 2007 concluded
that the application of reduced VAT rates to locally supplied services poses no real
detriment to the smooth functioning of the internal market and may, under certain
conditions, have positive effects in terms of job creation and of combating the
informal economy. It is therefore appropriate to allow Member States the possibility
of applying reduced VAT rates to the labour-intensive services covered by the
temporary provisions applicable until the end of 2010 as well as to restaurant and
catering services.
With respect to the supply of alcoholic and/or non-alcoholic beverages in the
framework of restaurant and catering services, it may be justified to provide a
different treatment of those beverages from the treatment provided for in the
framework of the supply of foodstuffs; it is appropriate to provide explicitly that a
Member State may include or exclude the supply of alcoholic and/or non-alcoholic
beverages when applying a reduced rate to the supply of restaurant and catering
services.
On 5 May 2009, the Council of Finance Ministers officially adopted an amendment to
the VAT Directive 2006/112/EC. This amendment is giving to all Member States the
option to apply a reduced VAT rate for restaurant services, including all types of
beverages. The new rules (Directive 2009/47/EC) were published in the Official
Journal of the EU on 9th May, and entered into force on 1st June 2009. The first
country to make use of this option was France, where the VAT rate for restaurant
services was reduced from 19.6 per cent to 5.5 per cent as from 1 July 2009. The
reduced rate is, however, not applying to alcoholic beverages. According to Ministry
of Finance statements, in France, by September 2009 around 40 per cent of restaurants
surveyed had reduced their prices, although not to the full extent of the VAT
reduction. So far, Belgium and the Czech Republic have expressed interest in the
possibility of reducing VAT on restaurants.
The VAT rate situation at EU level for the hospitality industry is as follows:
1 standard rate at no less than 15%;
1 or 2 reduced rates at no less than 5%;
Option for all Member States to apply the standard or a reduced rate to
accommodation services; and
Option for all Member States to apply the standard or a reduced rate to
restaurant services, including all types of beverages.
The aim of this report is to analyse the impact of a possible reduction in the VAT rate
on restaurants on the Maltese economy in general, the tourism industry and the effect
on various industries linked to tourism demand as well as the effect on public
finances. The terms of reference for this report are included in Annex 1.
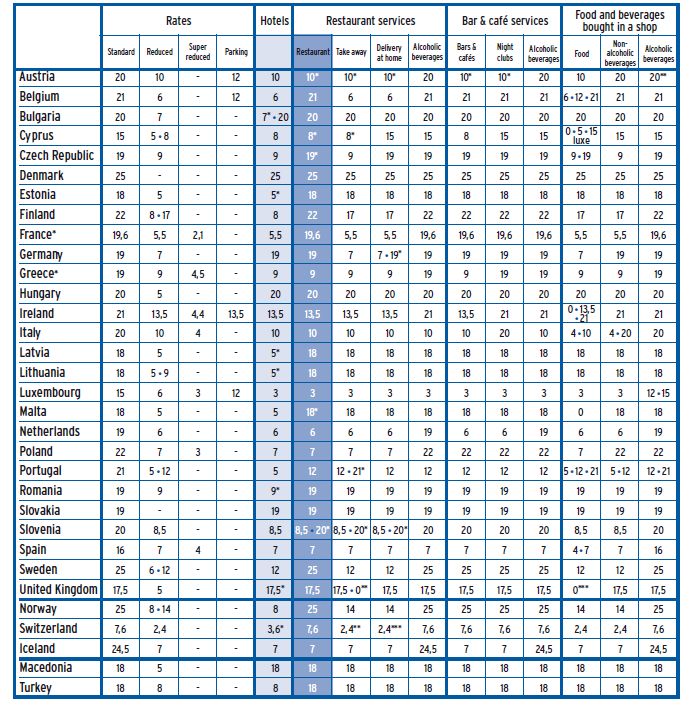
11.1 International Experience
It is worth noting that in the EU, eight Member States already charge a rate of VAT
on restaurants below 15 per cent. Included are the majority of Malta’s main
competitors in tourism which already charge a rate of VAT below 15 per cent. These
include Cyprus (8 per cent), Greece (9 per cent) and Spain (9 per cent). However,
there are a number of other southern European countries which either charge two
separate rates or charge the full rate. These include Portugal (12 per cent/ 21 per cent),
Slovenia (8.5 per cent/ 20 per cent), Italy (10 per cent) and Turkey (18 per cent).
Table 1.1: VAT rates in 2008 in European Countries
Note: In Malta 5% for pre-booked bed and breakfast, half or full-board stays in hotels when making use of the
hotel’s restaurant services.
Source: HOTREC
21.2 The VAT Rate on Restaurants in Malta
Effectively, Malta also charges a reduced rate of VAT on a proportion of expenditure
in restaurants. In Malta, accommodation services are already charged at the reduced
rate of 5 per cent where accommodation includes “bed and breakfast”, “half board” or
“full board”, as the case may be, which is included in the price of such
accommodation. According to the data of the VAT department around 44 per cent of
the tax base related to expenditure in restaurants (excluding catering) is already being
charged at the reduced rate of 5 per cent. This means that in effect, the effective
(average) tax rate applicable on the whole sector is around 12 per cent. Therefore, at a
macroeconomic level, we are effectively analysing the impact of reducing the VAT
rate from 12 per cent to 5 per cent.
Clearly, the impact of this policy or the impact of the failure to reduce the VAT rate
will depend on what Malta’s main competitors will do. In particular, since most of
Malta’s direct competitors in tourism already charge a reduced rate, a further erosion
in competitiveness is less likely if Malta does not reduce its VAT rate. This also
means that if Malta reduces its VAT rate, it will gain competitiveness. Nevertheless
the possibility that Malta’s competitors reduce their VAT rates further should be
monitored closely by Malta since it may affect Malta’s relative competitiveness.
32. Country Studies on Factors affecting Tourism Demand
Although the proposal to reduce VAT on restaurants will affect both tourism
expenditure as well as Maltese expenditure in restaurants, a significant proportion of
the positive impact is likely to arise from tourism. It was therefore deemed important
to emphasise the positive role of tourism in the economy and how the policy under
consideration could affect tourism. In particular this depends on the responsiveness of
tourism earnings to the price charged tourists in restaurants in Malta during their visit.
In this context a literature review of studies on tourism demand was considered
essential.
The literature indicates that tourists are sensitive to several economic variables.
Income in the origin country is a primary explanatory variable. A priori, according to
demand theory, positive income elasticity indicates that a commodity is normal, while
a negative value indicates that it is an inferior good. Income elasticity greater than
unity characterizes luxury goods where budget shares increase with increases in
income, while necessities, having elasticity values between zero and less than one,
experience falls in their budget shares with increases in income.
Additionally, besides being sensitive to their own income, tourists are also sensitive to
prices. Tourism demand often depends on two price elements: the cost of travel to the
destination and the cost of living in the tourist destination. Unlike many other imports,
tourism services are bought at the point of supply (destination). Consequently,
transport costs form a large proportion of the expenditure associated with this
consumption. Destination choice and the quantity of what is demanded (consumed)
are influenced by the cost of transport as well as the cost of such services.
Secondly, many international tourists include multiple destinations in their itinerary.
This has important implications for the level of demand for a given destination. For
example, higher than expected prices in one destination may result in the consumption
of fewer tourism services with compensating or offsetting amounts being consumed in
another destination. Alternatively, tourists may avoid visiting a high cost destination
altogether. Moreover, additional variables that were used occasionally are weather
indices, trade flows between countries, and special events.
2.1 Malta
An internal estimate of tourism demand for Malta using annual data points to a long
run income elasticity of 1.58 and an own-price elasticity of -1.34. In the short run the
income elasticity is estimated at 0.15 and the price elasticity is -1.09. A similar
exercise using quarterly data from 1996, allowing for seasonal factors, suggests a long
term income elasticity of 0.63 and a price elasticity of -1.13. In a structural
econometric model of the Maltese economy developed by Cordina (1996), the short-
run price elasticity of demand is measured at -1.2 and the long run price elasticity of
demand is measured at -1.9. Substituting the long run equation for bed capacity into
the long run equation for tourism earnings yields an income elasticity of 0.3.
Another study Mangion, Durbarry and Sinclair (2004) which examines UK tourism
expenditure at the level of budgeting wherein consumers allocate their expenditure
between the three Mediterranean destinations, Malta, Spain and Cyprus through the
4AIDS model, indicates that Malta appears to be the most price sensitive destination
for the UK outbound market, with an own-price elasticity of -2.54 per cent. This is
followed by Cyprus whose price elasticity is -2.27 per cent; while at -1.54 per cent
Spain is less price sensitive than the two islands. UK tourism demand for Malta is
strongly influenced by prices in Spain, the resulting cross-price elasticity being 4.12
per cent.
Additionally Spain and Cyprus’ income elasticities are estimated at around 1 per cent
with Cyprus being slightly more affected by changes in income in the UK market. The
respective elasticity values are 1.18 per cent for Cyprus, 1.09 per cent for Spain and -
0.74 per cent for Malta. The negative sign on Malta’s income elasticity implies that
Malta may be considered by the UK market as inferior since as income increases,
tourism demand for Malta declines. However, this result is not confirmed by the other
studies.
Table 2.1 Elasticity Estimates of Tourism Demand
Study Income Elasticity Price Elasticity Coefficient of
Long run Short run Long run Short run Adjustment
EPD (2003) 1.58 0.15 -1.34 -1.09 -0.43
EPD (2009) 0.63 -1.13
Cordina (1996) 0.3 -1.9 -1.2 -0.63
Mangion et al. (2004) study on UK
tourism expenditure on:
Malta -0.74 -2.54
Spain 1.09 -1.54
Cyprus 1.18 -2.27
Aslan et al. (2009) study
Turkish Study 0.060 0.040 -0.320 -0.230 0.720
Munoz (2004) study on:
Canary Islands 2.900 1.200 -1.900 -0.700 0.400
Munoz et al. (2006) study on:
Balearic Islands 2.020 0.920 -1.650 -0.760 0.500
Cyprus Economics Research Centre (2008)
Direct flight -0.77/-0.65
1.0/3.2
Indirect flight -0.24/-0.19
Croatia 3.300 5.000
Durbarry (2002) study on France's
long-run outbound tourism demand in:
UK 1.016 -1.706
Spain 1.001 -1.778
Italy 0.989 -1.857
Garin-Munoz et al. (1998) study on
tourism flows to Spain
Dynamic model 2.070 0.900 -0.240 -0.100
52.2 Spain
A study by Garin-Munoz and Perez Amaral (1998) models the foreign demand for
tourist services in Spain. The results of this study show that income, price and
exchange rate were significant in the determination of international tourist flows to
Spain. Income appears to be the single most important determinant of international
tourism demand. The estimated income elasticity is 1.41. This value above unity
confirms the hypothesis that foreign travel demand to Spain is a luxury. The estimated
price elasticity is -0.30. This suggests that this demand is price inelastic. To explore
the possibility that prices have not only an instantaneous effect but also that past
prices affect current tourist flows, the authors have estimated the same model adding
lagged price as a regressor, which turned out to be insignificant, suggesting that the
impact of prices is confined to the current period. The estimated exchange rate
elasticity is 0.50 and statistically significant. The positive sign means that a
depreciation of the exchange rate will increase the international tourist flows to Spain.
Moreover, a dynamic version of the former model with a lagged dependent variable
was also estimated. In this model the lagged dependent variable is significant with a
coefficient of 0.56 and a t-statistic of 2.40, suggesting the possible existence of
dynamics. The rest of the coefficients lose some significance and according to the
authors should be interpreted as short-run elasticities. The long-run elasticities, more
comparable to those of the static model were 2.07 for the income elasticity, 0.57 for
the exchange rate elasticity, -0.24 for the price elasticity and -0.21 for the dummy
variable for the Gulf War. The point estimates of the coefficients are not too different
from those of the static model, which could be taken as an indication of the robustness
of the estimates of the static model.
2.3 Cyprus
A study by the Economics Research Centre of the University of Cyprus (2008) was
commissioned in order to analyze the determinants of tourism demand in Cyprus. In
order to estimate the demand for tourism in Cyprus, the explanatory variables used
were grouped into the price variables and three additional groups: variables that
describe the origin-destination relationship, variables that are destination specific and
variables that are origin specific. The price variables used were the relative cost of
living in the destination with respect to the origin and the price of crude oil to
approximate for general transportation costs. The proxy for cost of living is the
reciprocal of the PPP conversion factor, which represents the purchasing power of one
Euro in the country.
The study shows that overall tourists tend to be insensitive to the relative cost of
spending their holidays in Cyprus and more likely to go to Cyprus if the transportation
cost, in terms of cost and inconvenience of travel, is less. However, when adjusting
the sample for the most important factor of transportation cost, that is, a direct flight
to Cyprus, the insensitivity to the cost of their holidays is reduced significantly.
The coefficient on price in this study is between -0.77 to -0.65 in the first set of
regressions reflecting direct flights and between -0.24 to -0.19 in the second set
reflecting indirect flights. This result is in line with economic intuition. Tourists that
have direct flight connections are more price-sensitive; they might consider Cyprus as
6a possible destination because of the convenience of the direct flight or can exploit
directly advertised packages to Cyprus that are most of the times accompanied by a
direct flight or they might be last minute travellers, less probable when there is a flight
connection. According to this study, the cost of travel is also driven by other costs
such as transportation costs, costs of organized tours or the alternative cost of leisure,
which are all independent of the cost of living in the destination country. In general,
the results on the price coefficients suggest that the general level of prices in
destinations is taken into account by travellers when making travel decisions and only
the fluctuations in prices over time are unimportant.
The coefficient on the price of crude oil enters all specifications with a negative sign
and is statistically significant, consistent with economic theory. Demand for travel,
regardless of destination, is reduced when transportation costs are higher, which is
more pronounced for Cyprus towards which travel involves at least one flight. The
coefficients on GNP for the origin are all positive and statistically significant and are
implying an income elasticity of between one and three, suggesting that tourism is a
luxury good.
In sum, the main findings are that tourism to Cyprus from countries with direct flights
to Cyprus has a price elasticity of about 0.7, while overall tourism to Cyprus is less
responsive to price changes as shown by a price elasticity of about 0.2. It is possible
that tourists who come to Cyprus with at least one flight connection have a strong,
unobserved preference to come to Cyprus that lowers the overall sensitivity to prices.
Transportation cost, overall and origin-specific is shown to be quite important for
choosing Cyprus as a destination.
2.4 Turkey
Aslan, Kula and Kaplan (2009) presented a dynamic model used to estimate the
demand function of tourism in Turkey with respect to its nine major clients, that is,
Germany, Russia, United Kingdom, Holland, France, Austria, Iran, Bulgaria and
Ukraine. With an adjustment coefficient of 0.72 the results show an income
coefficient of 0.04 in the short-run and 0.06 in the long-run and an own-price
elasticity coefficient of -0.23 in the short-run and -0.32 in the long-run. The estimated
coefficient for the income variable suggests that the demand for tourism in Turkey is
not dependent on the economic situation in nine major clients. This means that,
contrary to previous studies, tourism in Turkey is not considered as a luxury by nine
major clients.
Moreover, tourism in Turkey appears to be very sensitive to prices. Consistent with
demand theory, relative prices are negatively related to tourism demand. This means
that a 1 per cent decrease in relative prices leads to an increase in demand for tourism
of around 0.2 per cent in the short-run and 0.3 per cent in the long-run. Thus,
elasticities in both the short- and long-run demonstrate that the values of both income
and price elasticities in the long-run are greater than their short-run corresponding
items, suggesting that tourists are more sensitive to income/price changes over the
long-run.
2.5 Croatia
7A study by Merver and Payne (2007) provides long-run elasticity estimates associated
with the aggregate foreign tourism demand for Croatian destinations using the
autoregressive distributed lag (ARDL) approach. According to this study, besides
being sensitive to their own income, tourists are also sensitive to prices. Tourism
includes two price elements: the cost of travel to the destination and the cost of living
in the tourist destination. In an attempt to recognize the role of currency fluctuations
and relative prices on the demand for tourist destinations in Croatia, two alternative
real exchange rate measures are used in this study: the index of the real effective
exchange rate calculated with producer prices, and the index of the real effective
exchange rate calculated with consumer prices.
With the exception of one case, the parameter estimates for these two measures are
positive, meaning that the real depreciation of the Croatian unit of money should have
a positive impact on foreign tourist demand. However, the estimated parameters are
statistically insignificant in all cases, suggesting that currency fluctuations and relative
prices do not have a significant impact on tourism demand. Finally, the average world
oil price per barrel in U.S. dollars, serving as a proxy for transportation costs, is
negative in only two cases. In all other cases, the parameter estimates yield an
incorrect coefficient sign and are statistically insignificant. Additionally, this study
indicates that in the long-run tourism demand is income elastic, while the real
exchange rate and transportation costs (proxied by oil prices) do not have any
statistically significant impact on tourism demand in Croatia.
2.6 Italy
The study by Guizzardi and Mazzocchi (2009) provides a strategy for modelling the
effect of the business cycle on tourism demand under the rationale that tourism cycles
are heavily influenced by lagged effects of the overall business cycle. Two alternative
models are estimated, the first with a latent cycle component (LCC) and the second
based on specific economic explanatory variables (XCV). Based on the smoothed
estimates of the cyclical and irregular component of the LCC model, the estimated
price elasticity is negative and greater than one. The authors argue that this result may
be overemphasized because of specification effects, as price elasticities of nights
spent tend to be higher when a trend is included. At any rate, suppliers need to take
into account the strong impact of prices to support competitiveness of their products.
Instead, the Dollar/Euro exchange rate is significant for inbound demand only. This
finding is consistent with the fact that the main outbound destination for Italian
tourists is the Euro area (a market share of 57 per cent).
The policy implication from the XCV model is that it can be used for calibrating
countercyclical interventions in tourism policy. In fact, the XCV modelling approach
opens the way to identifying the specific impacts of economic policy instruments on
tourism dynamics. Among these instruments, the VAT rate for overnight stays might
play a relevant role. Italy’s VAT is 10 per cent compared to 7 per cent of Spain, 5.5
per cent of France and 8 per cent of Greece. As this model shows, this price
differential has a significant and large influence on demand. Accordingly, the authors
conclude that a policy decision towards the harmonization of VAT rates with the main
competitors would be very effective, as well as being in line with the rationale of the
EU single market.
82.7 France
In the paper by Durbarry (2002), the Almost Ideal Demand System (AIDS) model
was used to estimate France’s long-run outbound tourism demand in the UK, Spain,
and Italy. In this study, the author concluded that changes in quantity demanded due
to changes in price and income are very important especially in the field of tourism
when provisions need to be effected to service the industry well in advance. Service
providers are interested in how demand is affected by changes in price, for example,
due to a change in value added tax in the destination and also the reaction of tourists
when income changes. In this respect, Durbarry argues that the own-price and income
elasticities of demand are relevant.
In all three destinations the own-price elasticities are greater than unity, implying that
they are highly price elastic. In the case of the UK, the own price elasticity indicates
that a 1 per cent increase in its tourism price will decrease French tourism demand by
around 1.7 per cent. France, being the UK’s main tourist generating country, has
important effects on the amount of tourism receipts, employment, hotel bookings and
tax revenue. In Spain (-1.778), as well as in Italy (-1.857), French tourism demand is
elastic in both cases, although higher in the latter case. These estimates provide
evidence that in all the three destinations tourism demand is very sensitive to price
changes in the destinations. This implies that tourism demand is volatile and any
change in the pricing policy affecting tourism prices in the destinations would lead to
a more than proportionate change in the demand for tourism by the country’s
residents. Additionally, in this study, the income elasticities of UK (1.016), Spain
(1.001) and Italy (0.989) are all positive and around one, implying that a one percent
increase in real expenditure would lead to a proportionate increase in demand.
2.8 Balearic Islands
Munoz and Martin (2006) identify and measure the impact of the main determinants
of the inbound international tourism flows in the Balearic Islands. Taking into account
the changing structure of consumer preferences, a dynamic model is estimated. The
results suggest that the demand is heavily dependent on the evolution of economic
activity in each of the origin countries and on the relative cost of living of tourists in
the destination. The estimated short-run price elasticity is -0.76 while the long-run
effect of prices on tourism demand is -1.65. These results with an adjustment
coefficient of 0.5 indicate that tourism in the Balearic Islands is very sensitive to
prices. The short-run elasticity could lead to the conclusion that revenues could be
increased by increasing prices. However, the long-run elasticity may be a reflection of
the numerous alternative sand and sea holiday destinations. Meanwhile, the
coefficient of income elasticity in the short-run is 0.92 while in the long-run it is 2.02.
The price of travel elasticity is -0.30. The short-run results show that tourism to the
Balearic Islands is considered by foreigners as a non-luxury service. However, the
long-run income elasticity suggests that tourism is very dependent on the economic
conditions of the generating countries.
2.9 Canary Islands
Munoz (2004) presents a dynamic model of international tourism demand to Canary
Islands. The empirical analysis exploits the panel structure of the dataset by a
9Generalized Method of Moments estimation of a dynamic model taking into account
unobserved country-specific effects. A dynamic model where the lagged dependent
variable is included as regressor is used to obtain short-run and long-run elasticities.
The short-run income elasticity coefficient is 1.2 while the long-run coefficient is 2.9,
and the short-run price elasticity is -0.6 and the long-run price elasticity is -2.6, with
an adjustment coefficient of 0.4. In brief, the results suggests that tourism demand to
Canary Islands must be considered as a luxury good and is highly dependent on the
evolution of relative prices and cost of travel between origin and destination country.
2.10 Conclusion
Income elasticity has often been found to exceed one, confirming the luxury nature of
tourism travel. However, certain destinations can be regarded in a particular source
market as a necessity with income inelastic demand.
The own-price elasticity is normally negative, although magnitudes vary considerably
among studies. Generally, elasticity estimates show negative values ranging from 0 to
-2.5 in the long run, depending on the destination, model used and econometric
technique. However, two important findings particularly relevant for this study,
emerge from these elasticity estimates:
1. Long run elasticities typically exceed (in absolute terms) their short run
counterparts. This is in line with the demand theory implying that
consumption depends on what people expect to earn throughout their lifetime,
while fluctuations regarded as temporary having less effect on their
consumption spending. This indicates that lower tourism prices may take
time to fully influence foreign demand;
2. Whilst tourist demand is typically found to be price elastic (i.e. greater than 1)
with respect to an aggregate tourism price, the partial elasticity with respect to
a specific component of the tourist price (typically travel costs,
accommodation, cost of living and exchange rates) is often found to be
inelastic (i.e. less than 1). This indicates the importance of using the correct
partial elasticity with respect to the specific price component.
Studies which focus on tourism demand for Malta do not converge on the income
elasticity estimate, possibly depending on variations in the model used, time period of
analysis and econometric technique.
More importantly for the purpose of this exercise, all the studies concur that demand
tends to be price elastic. Estimated long run own price elasticities range from -2.54
(Mangion et al, 2004), -1.9 (Cordina, 1996), -1.34 (EPD, 2003) to -1.13 (EPD, 2009).
This is indicative of the significant competitive pressures the tourism industry in
Malta is generally operating in. Maintaining price competitiveness remains essential
in the tourism sector unless Malta manages to become a high-end tourist destination.
However, it is worth noting that none of the studies on Malta surveyed here
distinguish between different price components. Studies on Malta also confirm that
long-run elasticities tend to be higher than short run elasticities.
103. Theoretical and Empirical Considerations
The main impact of a reduced VAT rate will primarily depend on the extent to which
the tax reduction is passed through to the final goods price, the impact on consumer
demand and the effect of higher demand on employment. Ultimately it is thus a
question of elasticities and market structures. This section draws heavily from the
Final Report: Study on Reduced VAT applied to Goods and Services in the Member
States of the European Union, by Copenhagen Economics, May 2007. It will focus on
two major determinants, the elasticity of demand and market structures.
3.1 The Price Elasticity of Demand, Market Structures and Pass Through
If we assume a competitive market structure, the more responsive demand is to price
changes, the higher will be the impact on demand and the lower will be the degree of
pass through. This is illustrated in Figure 3.1, where a reduction in VAT is illustrated
as an outward shift in the supply curve. It is clear that the more elastic the demand is,
the higher the effect on output but the lower the degree of pass through to final goods
prices.
Fig. 3.1 S
S’
P
Pel
Pin
Del
Din
S Sin Sel
However, Stiglitz (1988)1 suggests that the degree of pass through could be
significantly lower if perfect competition is no longer assumed. This is illustrated in
Figure 3.2 where we have introduced the marginal revenue curve (MR) as distinct
from the demand curve to account for a monopoly situation. Figure 3.2 shows the case
of an elastic and inelastic demand. It is clear that the degree of pass through is higher
in the case of perfect competition than in the case of monopoly, irrespective of the
elasticity of demand. This occurs because the slope of the marginal revenue curve is
always steeper than that of the demand curve. Following a reduction in VAT, the
increase in output required to ensure profit maximisation (i.e. where marginal cost =
marginal revenue) in the case of a monopoly is less than the increase required under
perfect competition.
1
Stiglitz, J.E. (1988), Economics of the Public Sector, New York, Norton
11Fig. 3.2
S
S’
Monopoly
Impact
Perfect
Competition
Impact
Delastic
MR
S
Monopoly
Impact S’
Perfect
Competition
Impact
Dinelastic
MR
Perfect competition and monopoly situations are two extremes which do not
characterise the restaurant sector in Malta. The theoretical results become much more
complicated once intermediate market structures which typically characterise the
sector are considered. Theoretically, the results will depend heavily on supply and
demand elasticity. Stiglitz (1988) shows that as the demand curve becomes more
inelastic, the incentive to pass through the reduced VAT in the final goods prices
practically disappears. Putting it differently, demand needs to be highly sensitive to
price changes for there to be any incentive to pass through the reduced VAT to the
final goods prices. When demand is price inelastic, firms have the possibility to
maintain prices unchanged and thereby increase profit margins by the amount of the
VAT reduction.
3.2 Empirical Results
Theory suggests that the effect of a reduction in VAT will depend heavily on the price
elasticity of demand. This is primarily an empirical question. The degree of pass
12through will also depend on market structures which can also be considered as an
empirical question. The Copenhagen Economics Study includes a good review of the
literature on the impact of VAT reduction, and also empirically estimates the likely
degree of pass through, the effect on output and employment.
3.2.1 The Degree of Pass Through
The Copenhagen Economics Study indicates diverging conclusions in the literature on
the degree of pass through. However, most of these divergences appear to be
explained by differences in market structures across industries. There appears to be a
strong correlation between competitive pressures and the degree of pass through.
Industries characterised by significant market imperfections tend to exhibit low or
insignificant pass through. The Study also estimated the degree of pass through
observed in various EU Member States following a significant change in the VAT rate
on specific commodities. The degree of pass through ranges from no pass through to
full pass through.
Pass through was more than 100 per cent in certain cases. But this occurred only in
cases where VAT was increased. When VAT was reduced, the degree of pass through
ranged from no pass through to 82 per cent pass through in the case of Sweden’s
reduction of VAT on books in 2002. These are in line with empirical findings that
suggest that the degree of pass through is not symmetrical. Whilst total pass through is
evident in the case of VAT increases, pass through is partial or inexistent in the case
of VAT declines.
Of particular interest for the study of the reduced VAT rate on restaurants is the case
of Portugal. When the VAT rate on restaurants in Portugal was reduced by 5
percentage points, the degree of pass through measured by the Copenhagen
Economics Study was estimated at a mere 19 per cent.
3.2.2 The Impact on Demand and Production
The impact on demand and production will depend on both the degree of pass through
as well as the price elasticity of demand. The Copenhagen Economics Report
estimates demand elasticities for a number of sectors. These range from -1.94 in the
accommodation services to -0.18 for rental of housing. In some cases the price
elasticity of demand was found to be insignificantly different from zero. The food
category includes both restaurants and meals prepared at home. This is estimated at -
0.42 and is statistically significant. Unfortunately, the elasticity with respect to
restaurants only is not estimated. Given that meals prepared at home are likely to be
price insensitive, demand for restaurants is likely to be higher than 0.42 in absolute
terms. The study suggests that overall, the elasticity for the standard leisure goods is
estimated at -0.3 and for the luxury goods it was estimated at -0.8. Demand for
restaurants can be classified anywhere within this range.
3.2.3 The Impact on Employment
Clearly higher demand will increase output and demand for labour. However, the
demand elasticity for labour is likely to be less than 1. Increased demand can also
trigger new capital investment or other productivity enhancing measures implying that
13labour demand may rise by less than the increase in output. The more labour intensive
an industry is the higher are the likely positive effects on employment in the sector
resulting from the increase in output.
One should however note that the Report is based on a partial equilibrium analysis. In
a general equilibrium analysis, especially if the model imposes fiscal neutrality, the
overall impact on employment is likely to be less or possibly negative if the
employment gains in the sector subject to a reduced VAT rate is offset by
employment shedding in other sectors. This could arise because the measure itself
shifts demand away from (productive) sectors with a high VAT to (less productive)
sectors where VAT has been reduced. But more significantly, under fiscal neutrality
conditions, the reduced VAT rate has to be accompanied by an increase in other taxes
or an increase in the full rate of VAT. This can have negative consequences on the
economy in general and on employment.
The Copenhagen Economics Report indicates that the elasticity of labour demand to
output ranges from 0.3 to 0.7 in the short term and 0.5 to 0.9 in the long term.
Interestingly, the restaurant sector has the highest long term elasticity (0.9) and the
second highest short term elasticity (0.7) suggesting that a reduction in VAT in
restaurants is likely to have significant employment effects assuming full pass
through.
3.3 Conclusion
Empirical results suggest that the reduction in VAT in restaurants in the EU Member
States in general is not likely to be passed through totally to the consumer. In case of
VAT reductions, the highest pass through estimate observed was 82 per cent in the
case of Sweden’s reduction of VAT on books in 2002. In the closest case to the
scenario under consideration, the estimated pass through was 19 per cent. This will
significantly reduce the impact on output and demand. This will be partly offset by a
relatively high price elasticity of demand which probably ranges from -0.42 to -0.8.
This means that of the remainder of the price effect which is passed through to the
consumer, the restaurant sector will display among the highest output effect.
Moreover, because the restaurant sector is among one of the most labour intensive
sectors, it will also display a significant impact on employment. This is confirmed by
a relatively high output elasticity of labour demand which reaches 0.9 in the long
term.
144. Analysing the Competitiveness Level of the Restaurant Sector
Lowering of costs from the ‘producer’ end is not always reflected on the final price.
The extent of which any reduction is passed to the consumer depends largely on the
type of market structure the ‘firm’ is operating in. Chapter 3 of this study confirms
that market structures play an important role in the likely pass through of a reduced
VAT on final goods prices. For such purpose, it is important to look closely at the
structure of the restaurants sector.
4.1 Brief Description of the Restaurant Sector
Unless otherwise stated, the restaurants and catering sector referred in this section is
loosely defined following the statistical nomenclature NACE where they are classified
under Section H55.3. In Malta, this is made up of approximately 1,500 outlets,
including outlets in hotels. Restaurants account for an important part of the sector in
terms of both gross value added (GVA) and employment. The restaurant and catering
sector tends to be a relatively labour intensive sector. In Malta the sector is heavily
dependent on tourism, so employment levels tend to be seasonal. In addition, the
labour force is, on average, much younger and less skilled than in other sectors, and
also employs a higher percentage of women. Additionally, restaurants are generally
classified as micro-enterprises, with fewer than 10 persons employed. On average,
each restaurant and catering establishment in the EU employs around 5.4 employees.
4.2 Possible sources of Market Power
Market structures depend on various factors and considerable challenges are faced in
classification of markets. In economics, markets are classified according to the
structure of the industry serving the market. Industry structure is categorized on the
basis of market structure variables which are believed to determine the extent and
characteristics of competition. Those variables which have received the most attention
are number of buyers and sellers, extent of product substitutability, costs, ease of
entry and exit, and the extent of mutual interdependence.
Market structure is important in that it affects market outcomes through its impact on
the motivations, opportunities and decisions of economic actors participating in the
market. In highly stylised examples, perfect competition and monopolistic
competition, where freedom of entry is possible, super normal profits are eliminated
in the long-run. On the other hand, in the case of pure monopoly, the impossibility of
entry ensures that super-profits are made. The text-book models also illustrate the
importance of rivalry between existing firms, the extent of product differentiation and
the threat of substitution. Perhaps the best-known approach is the ‘five-forces’
approach, namely:
1. the intensity of rivalry among existing firms;
2. the threat of entry;
3. the threat of substitutes;
4. the power of buyers;
5. the power of suppliers
15A cursory glance at the restaurants market in Malta suggests a competitive market,
resulting from the presumed intensity of rivalry among restaurants and the free-entry
conditions2. However, this can be misleading, as the market is probably more
characterised by monopolistic competition – with many seller of differentiated
products, both in terms of price and location. This is very important due to product
substitutability. Since the market definition is partly conditioned by non-static
consumer perceptions, it is difficult to ascertain whether a market is characterised by
monopolistic competition.
4.3 Measurements of Market Power
Traditional proxies like price levels, concentration ratios or profit margins often used
as measures of market power. All indicators have their short-comings. Bearing these
caveats in mind, this section analyses the intensity and durability of observed
consumer prices as an indication of market structures. Whilst other indicators were
considered, availability of data exclusively for restaurant sector dictated our choice of
observed price movements as an indicator of possible market imperfections.
4.3.1 Observed Price Movement
Final prices of goods and services as measured by the HICP exhibit constant
variation, mainly resulting from the interaction of demand and supply, from the prices
of ‘inputs’ and also reflecting policy changes exogenous to the control of the firm.
Chart 4.1 illustrates the price inflation for the restaurant sector from January 1999 to
June 2009 for Malta, Spain, Cyprus, Greece, and Portugal. Those countries were
selected on the basis that they are similar to Malta in terms of development (measured
by PPS) and due the importance of the tourism sector for their respective economy.
As can be noted from the chart, restaurant prices in Malta tended to exhibit marked
periodical changes, with an accentuated decline at the start of 2003, probably as a
result of removal of levies on specific imports. It is also notable, that the inflation
generated in the sector moved closely with that registered in the selected economies.
From mid-2007, the inflation tended to be higher than most of the selected economies.
Given that a similar pattern was observed for food and electricity prices, which are an
important inputs to this industry, one cannot exclude the possibility that inflation
differential in the sector is unrelated to market structure in the sector itself.
To resolve this issue it is important to look at the visual relationship between the
restaurants prices and the prices of inputs (such as food). This can provide useful
insights on the competitiveness of the market. Chart 4.2, shows the changes in prices
for the restaurants sector sub-index, the food and non-alcoholic beverages sub-index,
and electricity and gas sub-index. The data suggests that changes in restaurant prices
are closely related to input prices, especially with the prices of food and beverages.
However, an element of price smoothing is also evident. For instance, the water and
electricity price increases in 2005 and 2006 were not passed on to consumer prices
whilst their reversal in 2007 and the beginning of 2008 were similarly not translated
into lower restaurant prices. This suggests that restaurants have some limited ability to
absorb changes in their input costs in profit margins.
2
The free-entry condition is rather debatable in this sector due to the high fixed cost of entry,
mainly in the form of immovable property
16Chart 4.1: Annual HICP for Malta and Selected Economies (COICOP 1111)
%
14
12
10
8
6
4
2
0
-2
-4
-6
1999M01
1999M06
1999M11
2000M04
2000M09
2001M02
2001M07
2001M12
2002M05
2002M10
2003M03
2003M08
2004M01
2004M06
2004M11
2005M04
2005M09
2006M02
2006M07
2006M12
2007M05
2007M10
2008M03
2008M08
2009M01
2009M06
GR ES CY MT PT
Chart 4.2: Annual HICP Malta
% %
14 50
12
40
10
8 30
6
20
4
10
2
0 0
-2
-10
-4
-6 -20
1999M01
1999M06
1999M11
2000M04
2000M09
2001M02
2001M07
2001M12
2002M05
2002M10
2003M03
2003M08
2004M01
2004M06
2004M11
2005M04
2005M09
2006M02
2006M07
2006M12
2007M05
2007M10
2008M03
2008M08
2009M01
2009M06
COICOP: CP1111 - Restaurants, cafés and the like
COICOP: CP01 - Food and non-alcoholic beverages
COICOP: CP045 - Electricity, gas and other fuels (Secondary Axis)
4.4 Drawing inferences about Market Competitiveness
Although the hypothesis that market imperfections exist in the restaurant sector
cannot be excluded, it is difficult to obtain a precise estimate of its degree. Despite the
presence of numerous operators in the sector, a certain degree of market power is
present in the sector which allows operators to smoothen prices to a certain extent.
This is probably resulting from the fact that the market is characterised by
differentiated products, both in terms of price, quality of service and location.
17Overall, the hypothesis of less than full pass-through to final goods prices cannot be
refuted. This is also supported by the empirical evidence on the EU Member States
presented in Chapter 3. Given that it is impossible to determine the exact degree of
pass-through likely to result in Malta following a removal of VAT on restaurants this
study will proceed by undertaking two different scenarios, one with full pass through
and another scenario with partial pass through.
185. Modelling the Reduction in VAT using SAMM
To analyse the economic impact of a reduction in VAT on restaurants, use was made
of the Structural Annualised Econometric Model for Malta (SAMM) at the Economic
Policy Division (EPD) within the Ministry of Finance, the Economy and Investment.
SAMM is a Keynesian structural model incorporating more than 1,600 variables, 378
behavioural equations and 278 identity equations. In view of its Keynesian nature,
output and employment is driven by demand. Therefore, this model is ideal for
analysing short- to medium term policy options like the proposed measure being
analysed.
One of the main attributes of SAMM is its ability to analyse the impact of policy
measures on different industries. The model is based on an input/output structure and
is thus able to capture inter-industry linkages in the Maltese economy and multiplier
effects. This is the main benefit of using this model as opposed to a partial
equilibrium analysis. At the same time, it can be considered superior to an input
output model since it is able to capture better short-term behavioural effects related to
the final demand components. Its main drawback is its inability to capture supply-side
effects in the long run. Given that such effects are not expected to materialise in the
short to medium term, SAMM remains an ideal model to analyse the impact of the
reduced VAT on restaurants.
5.1 The Expected Impact of the Reduction in VAT
Primary effects:
The immediate effect of the reduction in VAT on restaurants is to reduce prices of
restaurants for both domestic consumers and for tourists. The impact on domestic
consumption and on exports will depend on the elasticity components of domestic and
foreign demand.
One would expect the domestic impact to be bigger than the impact on exports in the
short run on the assumption that domestic consumers are able to adjust consumption
patterns faster than tourists who are unlikely to change their plans for vacation
immediately as a result of a change in restaurant prices. Also, one may contemplate
that domestic demand is more price elastic than foreign demand simply because
domestic consumers are likely to be more aware of the measure than tourists.
The empirical literature analysed in Chapter 3 also suggests that the impact will vary
over time. The immediate impact will be limited compared to the effect of the
measure in the long term. This is due to different price elasticity of demand in the
short term and the long term. The adjustment to a long-term equilibrium will depend
on the error correction term in the export equation. The model suggests a relatively
slow adjustment to long term equilibrium.
The reduction in VAT is also likely to reduce the costs of production for those
industries which make use of restaurants as an intermediate service. Other prices may
consequently decline, improving competitiveness of other sectors. However, most of
the impact will come from final demand components, namely domestic consumption
and exports.
19Fig 5.1: The Impact of the Reduced VAT Rate in Restaurants in SAMM
Lower VAT Rate
Lower Restaurant Prices Lower Restaurant Prices Lower Restaurant Prices Reduced
for Tourists for Maltese for Intermediate Producers Inflation
Tourism Demand does not Domestic demand Supply and use table determines
increase immediately increase immediately which industries using restaurants
will increase demand
Tourism demand increases
in the long run
Output, employment and profits Output, employment and profits
In restaurants and tourism In restaurants increase
in general increase Intermediate Demand by
Tourism Sector Leads to
further positive effects on other
Industries which depend on
tourism such as wholselae, retail
transport, agriculture,
food and beverages
Household Disposable Income
Increases due to higher
Profits and Employment
Further Increases in final demand
H igher VAT, Income Tax, Lower VAT Revenue for
NI revenuefor Government Government
Positive Effects
on GDP Net Negative effect on Public Finances
Secondary effects:
Because one of the main effects of the reduction of VAT on restaurants is on the
tourism sector (at least in the long-term), the significant multiplier effects involved are
likely to be an important consideration in this analysis. Sectors which are highly
dependent on tourism are expected to be affected more positively. These are likely to
include agriculture, food and beverages, wholesale and retail sector, hotels, and
transport.
Third round effects:
Higher output and lower costs of production are likely to increase profit margins
particularly in the hotels and restaurants sector. Higher output will also result in
higher employment and therefore an increase in total wages paid in the economy. The
model assumes that average wages do not rise on the assumption that there are enough
unemployed resources in the economy. This is a reasonable assumption especially
during the crisis. Higher profits which are then distributed to shareholders and higher
wages paid in the economy as a result of the increase in employment will raise
aggregate household disposable income. This will in turn have a further positive effect
on domestic consumption through the income effect. Imports will also rise as a result
of the higher domestic and foreign consumption, partly offsetting some of the positive
effects on the economy.
20All these changes will also affect public finances. Directly as a result of the reduction
in VAT on restaurants, Government will have to forego VAT revenue. Estimates by
the Ministry of Finance based on 2008 data indicate that this direct impact would be
roughly EUR 32 million. If allowance is made for the effect of the recession in 2009,
the tax base in 2010 is likely to be less due to lower expenditure by Maltese and
tourists. EPD estimates that in 2009 the tax base will be reduced by 10 per cent3, and
recover slightly by around 1.5 per cent in 2010. As a result of a lower tax base, the
direct impact of the reduced VAT on restaurants is estimated at EUR 30 million in
2010.
The total impact on public finances is likely to be less than EUR 30 million due to
some claw back resulting from the positive effect of the measure on economic
activity. This will primarily include:
1. higher VAT revenue resulting from increased consumption of other goods and
services as a result of the increase in household disposable income;
2. higher income tax and NI revenue as a result of the increase in employment;
3. higher income tax as a result of the higher profits by the sectors which are
positively affected by the measure;
4. higher revenue from import duties as a result of the increased consumption
5.2 Limitations and Further Considerations
To ensure that there is direct and separate feedback from restaurant prices to tourism
earnings it was necessary to tailor the model by incorporating restaurant prices
directly in the tourism earnings equation. The literature review suggests that it is very
important to ensure that the correct partial elasticity is used. For this purpose, a
separate study4 was undertaken in order to estimate the responsiveness of tourism
earnings to restaurant prices, other prices remaining unchanged. The partial elasticity
estimate from this study was incorporated in the model to ensure that the model
captures only the responsiveness of tourism earnings to a change in the specific price
of restaurants and not the responsiveness to an aggregate tourism price change with
which the model was originally designed.
The partial equilibrium analysis was carried out using an error correction
specification. The results of this analysis are by themselves important in their own
right. Different specifications of the model were also tested. It is beyond the scope of
this report to enter into the specific details of these estimations. However some
important conclusions are worth highlighting.
First of all it is evident that, in line with SAMM estimates and in line with various
international and local studies on tourism, demand tends to be price elastic. The (long-
run) elasticity with respect to the aggregate tourist price was estimated at -1.13 on the
basis of quarterly data.
Secondly and more directly related to the scope of this analysis, when different prices
of various components of tourist expenditure were used in the export equation, rather
3
This is roughly in line with the decline in tourism earnings evident in the first half of 2009.
4
Appendix 2 includes the results of this partial equilibrium analysis.
21than a single average price of tourism, the elasticity of tourist demand to the price of
restaurants was estimated to range from -0.56 to -0.72 depending on the model
specification utilised. Therefore, the elasticity with respect to the price of restaurants
only is less than unitary. The most reliable model suggests a price elasticity of -0.65
and this was imposed directly in SAMM. It is also important to note that this is the
elasticity of total tourist expenditure to the price of restaurants and not the elasticity of
tourist expenditure on restaurants to its own price.
Thirdly, the error correction models (including the equation in SAMM) reveal that the
price of restaurants has no significant direct bearing on tourism earnings in the short
term, but only in the long term. This conforms to international studies analysed in
Chapter 2. Moreover, the error correction term5 of -0.246 suggests that the adjustment
to long term fundamentals is relatively slow. This implies that the beneficial effect of
this measure on tourism will not materialise immediately, probably after 2010.
This does not apply to domestic expenditure. In this case, the price of restaurants is a
significant determinant in both the short term and the long term, as evidenced by the
statistical significance of the coefficients on the price variables. The partial elasticities
are also higher in the domestic expenditure equation although these are not strictly
comparable. Whereas the domestic equation refers to expenditure in restaurants and
hotels only, the tourism equation refers to total tourism expenditure inclusive of hotels
and restaurants and other tourist expenditure components. Therefore, the immediate
benefit of this measure will mostly come from domestic consumption and only
gradually will foreign demand adjust to this measure. This is in line with a-priori
expectations.
Another limitation of the model is the lack of a separate category for restaurants and
one for hotels. As a macroeconomic model designed to forecast the macroeconomic
variables, restaurants and hotels in SAMM are amalgamated in line with national
accounts data. Therefore, in model terms it was necessary to model the decline in
VAT on restaurants and hotel services altogether. As a result, the shock imposed on
the model (i.e. the VAT reduction) had to be scaled down in line with an estimated
proportion of expenditure going to restaurants only.
Another important consideration relates to competitiveness. The model assumes that
other competitor countries do not adjust their VAT rates. If this were to be the case,
relative prices of tourism will not be affected and most of the benefits resulting from
competitiveness gains will not result. The only benefits will come from domestic
sources which are assumed to be imperfect substitutes to the provision of catering
services abroad. It is important to note that if competitor countries also reduce their
VAT, the negative budgetary impact will be even larger since it will not be
compensated by the beneficial effects of the measure on the economy.
5
The error correction term represents the speed of adjustment to long term equilibrium. A coefficient
of -0.5, for instance, means that 50 per cent of the short-run disequilibrium between what happens
immediately following a change in the explanatory variable, and what should eventually happen in the
long-run is corrected in the next period. Further (50 per cent) corrections are made until long-run
equilibrium is achieved. The higher the absolute value of the error correction term, the faster the
adjustment to long-term equilibrium.
6
This estimate refers to the partial equilibrium estimates. In SAMM, the error correction term is
slightly higher and is estimated at -0.48. The adjustment to long-term fundamentals is thus slightly
faster in SAMM.
22You can also read


