Structure and dynamics of the drug-bound bacterial transporter EmrE in lipid bilayers - Nature
←
→
Page content transcription
If your browser does not render page correctly, please read the page content below
ARTICLE
                  https://doi.org/10.1038/s41467-020-20468-7                 OPEN

                  Structure and dynamics of the drug-bound bacterial
                  transporter EmrE in lipid bilayers
                  Alexander A. Shcherbakov 1, Grant Hisao 2, Venkata S. Mandala 1, Nathan E. Thomas 2,
                  Mohammad Soltani3, E. A. Salter3, James H. Davis Jr. 3, Katherine A. Henzler-Wildman 2 ✉ & Mei Hong                                            1✉
1234567890():,;

                  The dimeric transporter, EmrE, effluxes polyaromatic cationic drugs in a proton-coupled
                  manner to confer multidrug resistance in bacteria. Although the protein is known to adopt an
                  antiparallel asymmetric topology, its high-resolution drug-bound structure is so far unknown,
                  limiting our understanding of the molecular basis of promiscuous transport. Here we report
                  an experimental structure of drug-bound EmrE in phospholipid bilayers, determined using 19F
                  and 1H solid-state NMR and a fluorinated substrate, tetra(4-fluorophenyl) phosphonium (F4-
                  TPP+). The drug-binding site, constrained by 214 protein-substrate distances, is dominated
                  by aromatic residues such as W63 and Y60, but is sufficiently spacious for the tetrahedral
                  drug to reorient at physiological temperature. F4-TPP+ lies closer to the proton-binding
                  residue E14 in subunit A than in subunit B, explaining the asymmetric protonation of the
                  protein. The structure gives insight into the molecular mechanism of multidrug recognition by
                  EmrE and establishes the basis for future design of substrate inhibitors to combat antibiotic
                  resistance.

                  1 Department of Chemistry, Massachusetts Institute of Technology, 170 Albany Street, Cambridge, MA 02139, USA. 2 Department of Biochemistry,

                  University of Wisconsin at Madison, Madison, WI 53706, USA. 3 Department of Chemistry, University of South Alabama, Mobile, AL 36688, USA.
                  ✉email: henzlerwildm@wisc.edu; meihong@mit.edu

                  NATURE COMMUNICATIONS | (2021)12:172 | https://doi.org/10.1038/s41467-020-20468-7 | www.nature.com/naturecommunications                         1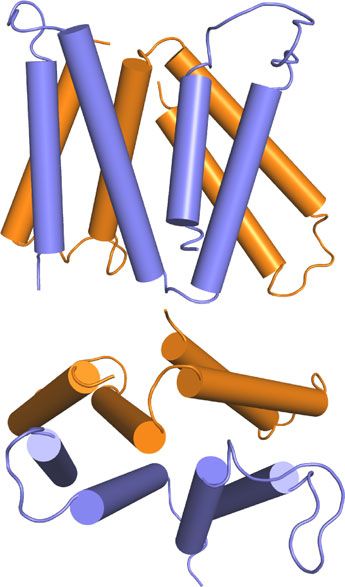
ARTICLE                                                                 NATURE COMMUNICATIONS | https://doi.org/10.1038/s41467-020-20468-7

A
        ntibiotic resistance is a rising public health crisis. Active         TPP+-bound EmrE21 showed an antiparallel topology for the
        drug efflux by multidrug resistance (MDR) transporters is              homodimer, which was controversial because it was the first
        of particular concern because it allows bacteria to mount             example of a dual topology integral membrane protein. However,
rapid defense against toxic compounds. Active efflux of harmful                subsequent NMR and single-molecule fluorescence resonance
metabolites, antiseptics, antibiotics, and toxins that either natu-           energy transfer experiments on wild-type EmrE in lipid bicelles
rally occur in the environment or are produced by competing                   demonstrated that the asymmetric antiparallel dimer was capable
bacteria or host organisms allow bacteria to survive these chal-              of undergoing alternating-access motion (Fig. 1a)22, and cross-
lenging conditions. The broad substrate specificities of MDR                   linking that blocked this process also blocked transport in vivo15.
transporters provide redundancy and can lead to unexpected                    Dual topology was further supported by mutagenesis23,24, DEER
outcomes with inhibition of individual transporters. To effectively           EPR25, and studies of the EmrE homolog Gdx26. The recent
curb this antibiotic resistance mechanism, a molecular under-                 discovery of a second family of antiparallel homodimeric bacterial
standing of the mechanism of substrate recognition and specifi-                membrane proteins, the Fluc channels27, further established dual
city is crucial. Here, we present atomic-level experimental                   topology. Orientational data from solid-state NMR confirmed the
distance restraints that define the location of a substrate in the             asymmetry of the EmrE dimer16,28, and showed that the gluta-
transport pathway of EmrE. EmrE is a member of the Small                      mate residue (E14)29, which binds both protons and substrates,
Multidrug Resistance (SMR) transporter family in E. coli. In vivo,            differs between the two subunits. Despite the well-established
it has been implicated in pH and osmotic stress response1, biofilm             dual topology and asymmetry of EmrE, no atomic structure of the
formation2, and resistance to many quaternary cationic com-                   substrate-binding site is known.
pounds, including the topical antiseptic acriflavine3. Many SMR                   The lack of higher-resolution structural information for EmrE
transporters have been implicated in resistance to clinically                 is not surprising, because the protein is small and lacks large
relevant drugs in pathogenic organisms such as mycobacterium                  soluble domains that are usually required to obtain high-quality
tuberculosis4 and Acinetobacter baumanii5. Although EmrE has                  crystals or particle alignment for cryo-EM studies. The protein is
not been directly involved in resistance to clinical antibiotics by           also flexible and dynamic, as evidenced by NMR13–16,22,28,
pathogenic E. coli, resistance is readily selected for in vitro, by           EPR25,30, and cryo-EM9,20 data. These dynamics are important
mutation of only 1–3 residues6. Thus, structure determination of              for multidrug recognition and transport but pose challenges for
the EmrE-substrate complexes is relevant for elucidating the                  structure determination. NMR is one of the best techniques for
mechanism of action of the SMR family of transporters. In                     determining the structure of small and dynamic proteins, but the
addition, EmrE is one of the smallest known proton-coupled                    conformational plasticity of the substrate-free EmrE still leads to
transporters and thus serves as a model for understanding                     significant line broadening in the spectra. Even with substrate-
proton-coupled transport7.                                                    bound protein, the rate of alternating-access motion is faster than
   To date, the available EmrE structural models have modest                  the cross-peak buildup rates in 2D correlation spectra.
resolution and lack details for understanding how multiple sub-                  Here, we report an experimental high-resolution structure of
strates are recognized by the protein. EmrE transports a wide                 the substrate-bound EmrE using magic-angle-spinning (MAS)
array of polyaromatic cations in vitro, including ethidium, methyl            solid-state NMR spectroscopy. We exploit a recently discovered
viologen, acriflavine, dequalinium, and tetraphenylpho-                        point mutant of EmrE, S64V-EmrE, which has the same affinity
sphonium8. Low-resolution cryo-electron microscopy (EM) maps                  for TPP+ and related substrates but slower internal dynamics and
and nuclear magnetic resonance (NMR) chemical shift changes                   alternating-access rates31. Further, we use a fluorinated TPP+
suggest that the protein’s transmembrane (TM) helices undergo                 derivative, tetra(4-fluorophenyl) phosphonium (F4-TPP+)
large-scale reorientation to bind and transport these diverse                 (Fig. 1a), which resembles TPP+ in the transport activity, and
substrates, but these data do not indicate how the substrates                 employ a multidimensional 1H-19F NMR technique32 to measure
interact with specific residues in the protein9,10. Biophysical and            a large number of protein–substrate distances. These distances
mechanistic studies have revealed unexpected complexity in the                constrain the binding-site structure. Together with 19F-detected
transport process11–17, giving evidence that EmrE may function                substrate dynamics, these data provide fresh atomic insights into
not only as a proton-coupled antiporter, pumping toxic poly-                  the mechanism of promiscuous substrate recognition and trans-
aromatic cations out of E. coli (Fig. 1a), but also as a proton-              port by EmrE.
coupled symporter or uncoupled uniporter11,13. Either symport
or uniport has the potential to confer susceptibility rather than
resistance because the inward proton motive force and negative-               Results
inside membrane potential in bacteria would lead to con-                      Our structure determination of the EmrE-TPP+ complex is
centrative uptake of toxic cations. To elucidate how EmrE                     enabled by three recent experimental advances: a long-range
interacts with and transports diverse substrates with divergent               multiplexed 1H-19F distance measurement technique32, fluori-
biological outcomes, high-resolution structural information of                nated TPP+, and the slow-exchanging S64V-EmrE31. Because of
substrate-bound EmrE is essential.                                            the large magnetic dipole moments of 1H and 19F spins, 1H-19F
   The functional unit of EmrE is an antiparallel, asymmetric                 distances up to ~2 nm can now be measured using a two-
homodimer. Cryo-EM, X-ray crystallography, and electron                       dimensional rotational-echo-double-resonance (REDOR) NMR
paramagnetic resonance studies have established the global                    technique32. To utilize this technique, we synthesized F4-TPP+
topology and asymmetry of the dimer. Cryo-EM maps of EmrE in                  (Supplementary Fig. 1A, B), which has the same three-
2D crystals formed in lipid bilayers18 gave the first indication that          dimensional structure as TPP+ but slightly larger cationic
the dimeric protein had no obvious twofold symmetry. This                     charge of the central phosphorous owing to the electronegative
surprising result was later confirmed in moderate resolution (7.5              fluorines (Supplementary Fig. 1C). To assess whether fluorination
Å in-plane, 16 Å perpendicular to the membrane) 3D cryo-EM                    affects the protein conformation, we measured the chemical
structures with and without the tight-binding substrate tetra-                shifts of S64V-EmrE bound to F4-TPP+ versus TPP+ under
phenylphosphonium (TPP+)19. These 2D maps and 3D                              identical conditions in dimyristoylphosphatidylcholine/ di-C6-
structures9,20 also indicated that the substrates bind at the                 phosphatidylcholine (DMPC/DHPC) bicelles (q = 0.33, pH 5.8,
homodimer interface, but asymmetrically between the two sub-                  45 °C) using solution NMR. The amide chemical shift difference
units. A subsequent 3.8 Å crystal structure of the backbone of                between proteins with bound F4-TPP+ versus TPP+ (Fig. 1b) is

2                NATURE COMMUNICATIONS | (2021)12:172 | https://doi.org/10.1038/s41467-020-20468-7 | www.nature.com/naturecommunications
NATURE COMMUNICATIONS | https://doi.org/10.1038/s41467-020-20468-7 ARTICLE
a Periplasm, low pH F
F
B A A B P+
F
Cytoplasm, high pH F
b c
TM1 TM2 TM3 TM4 TM1 TM2 TM3 TM4
1.6 1.6
1.4 monomer A 1.4 F4-TPP+
(ppm)
1.2
monomer B 1.2 TPP+
(ppm)
HN
1.0 1.0
F4-TPP+ vs TPP+
HN
0.8 0.8
A vs B
0.6 0.6
0.4 0.4
0.2 0.2
0.0 0.0
0 20 40 60 80 100 0 20 40 60 80 100
Residue Number Residue Number
F4 -TPP+ F4 -TPP+
d F4 -TPP+
H+ H+ H+
H+ H+ H+
F4 -TPP+
F4 -TPP+ F4 -TPP+
Favorable for antiport Downhill H+ transport current Favorable for symport
100
Transported Charge (pC)
WT
80 E14Q
60
40
20
0
-20
-40
F4 -TPP+ Gradient: Outward-facing No gradient Inward-facing
Fig. 1 EmrE binds and transports F4-TPP+ in a similar fashion to TPP+. a Schematic model of the alternating-access mechanism of the asymmetric EmrE
homodimer to export polyaromatic substrates out of bacterial cells. The F4-TPP+ structure is shown on the right. b Amide HN and 15N chemical shift
difference between F4-TPP+ and TPP+ bound S64V-EmrE in lipid bicelles. Red: subunit A; Blue, subunit B. Small chemical shift differences are observed,
indicating that TPP+ fluorination has little effect on the protein structure. Error bars are ±0.025 ppm based on spectral resolution. c Amide HN and 15N
chemical shift difference between subunits A and B of bicelle-bound S64V-EmrE. Red: F4-TPP+ bound protein data; Black: TPP+-bound protein data. The
structural asymmetry between the two subunits is similar for the two substrates. Error bars are ±0.025 ppm based on spectral resolution. d Solid-
supported membrane electrophysiology data of F4-TPP+ transport by wild-type EmrE, driven by an inward pH gradient. When the F4-TPP+ gradient is in
the opposite direction from the pH gradient, net current increases compared with when the drug gradient is absent. When the substrate gradient is in the
same direction as the pH gradient, net current decreases. Thus, F4-TPP+ is a canonical antiported substrate of EmrE. The E14Q mutant data serve as
controls. Raw current traces and additional details are shown in Supplementary Figure 3. Error bars represent the standard error of three replicates using
independently prepared sensors and the three individual data points are shown as circles.
small, and is less than the chemical shift difference between the F4-TPP+ is an antiported substrate of EmrE. We used solid-
two subunits of the dimer (Fig. 1c). The chemical shift differences supported membrane electrophysiology to monitor liposomal
between F4-TPP+- and TPP+-bound proteins mainly localize to transport of F4-TPP+ by wild-type (WT) EmrE (Fig. 1d, Sup-
residues that are known from mutagenesis to interact with the plementary Fig. 3). The assay starts with equal concentrations of
substrate30,33,34. 2D ZZ exchange spectrum of F4-TPP+ bound both proton and substrate on either side of the liposome. Low-
protein shows no conformational dynamics within 200 ms ering the pH of the external buffer creates an inward-facing
(Supplementary Fig. 2), indicating that the alternating-access proton-concentration gradient that triggers transport, and net
motion is slower for S64V-EmrE bound to F4-TPP+ than to charge movement is recorded by the sensor. Combining this pH
TPP+31. This slow alternating-access rate with bound F4-TPP+ gradient with varying F4-TPP+ gradients allows for investigation
facilitate the measurement of protein-substrate distances. But of the proton/substrate coupling behavior of EmrE. In the
given the lack of observable alternating access, we first verified absence of a drug gradient, protons are transported down their
that F4-TPP+ is indeed transported by EmrE. concentration gradient into the liposome, creating a positive
NATURE COMMUNICATIONS | (2021)12:172 | https://doi.org/10.1038/s41467-020-20468-7 | www.nature.com/naturecommunications 3ARTICLE NATURE COMMUNICATIONS | https://doi.org/10.1038/s41467-020-20468-7
a b c
245 K
Experimental 285 K -106 ppm
-105 ppm 51%
Simulation DP 18% -110 ppm
-103 ppm 6%
21%
2% 1% 245 K
285 K
13C-19F 285 K
308 K CP
308 K
-50 -100 -150 -95 -100 -105 -110
19F (ppm) 19F (ppm) 80 70 60 50 40 30 20 10 0
13C (ppm)
d 10 ms mixing e
265 K 285 K 1.0 -103 ppm -> -110 ppm
cross peak intensity
18±5 ms
-110
0.8
(ppm)
0.6 20±5 ms
-110 ppm -> -103 ppm
-105 0.4 10±3 ms
-105 ppm -> -110 ppm
19F
0.2 -106 ppm -> -110 ppm
14±6 ms
-100 0.0
-100 -105 -110 -100 -105 -110 0 20 40 60 80 100 120
19F (ppm) 19F (ppm) Mixing Time (ms)
Fig. 2 19F NMR spectra of F4-TPP+ bound to S64V-EmrE in DMPC bilayers. a Variable-temperature 19F direct-polarization (DP) spectra measured under
10.5 kHz MAS. The substrate has an isotropic 19F chemical shift of −106 ppm. The 19F linewidths and spinning sideband intensities are highly sensitive to
temperature. At 245 K, F4-TPP+ is immobilized, as seen by the high sideband intensities, which are simulated (blue) to give the 19F CSA. In contrast, at
308 K, F4-TPP+ is nearly isotropically mobile. The small sharp peaks at −80 ppm and −116 ppm in the high-temperature spectrum are attributed to
residual 4-fluoroiodobenzene and tris(4-fluorophenyl)phosphine from the F4-TPP+ synthesis. b 19F DP spectrum measured at 285 K under 35 kHz MAS.
Spectral deconvolution gives five components, indicating that the ligand experiences a heterogeneous structural environment. 13C-19F cross-polarization
(CP) spectrum enhanced three out of the five components, indicating that these species are closest to the 13C-labeled protein. c Variable-temperature 13C
CP MAS spectra of DMPC-bound S64V-EmrE. The spectral intensity decreases with increasing temperature, indicating that the protein becomes more
dynamic at higher temperature. d 2D 19F-19F correlation spectra of F4-TPP+ with 10 ms mixing, measured under 38 kHz MAS. Exchange peaks are detected
at 285 K but not at 265 K, indicating that the exchange is owing to substrate reorientation. e Intensity buildup curves of cross peaks (shown as blue crosses
in d) yield an average exchange time constant of 16 ± 2 ms.
signal for the transported charge. This signal is increased by an the liquid-crystalline phase of the DMPC bilayer, the 19F spec-
outward-facing F4-TPP+ concentration gradient (favoring anti- trum collapses into a narrow isotropic peak at −106 ppm, indi-
port). In contrast, a large inward-facing F4-TPP+ gradient cating that the ligand undergoes nearly isotropic motion at rates
reverses the net transport direction, indicating that protons are faster than the 19F CSA of 34 kHz. These substrate dynamics
driven out of the liposomes against their concentration gradient. coincide with the onset of protein dynamics, as seen in the 13C
This reversal of current is indicative of coupled transport35,36 and NMR spectra, which exhibit lower intensities above the mem-
demonstrates that F4-TPP+ is antiported by EmrE. Although the brane phase transition temperature (Fig. 2c).
timescale of transport differs between transporters, a similar To further understand the heterogeneous environment of F4-
reversal of current is observed for proton/guanidinium antiport TPP+, we measured the 19F direct-polarization spectrum under
by the EmrE homolog Gdx36. 35 kHz MAS to detect only the isotropic peaks. The spectral
lineshape is complex, and can be deconvoluted into five
The substrate is dynamic in the binding pocket of membrane- components (Fig. 2b). A small sharp peak (0.2 ppm linewidth)
bound EmrE. The four fluorine atoms of F4-TPP+ provide a at −105.7 ppm can be attributed to free F4-TPP+ in solution.
direct probe of substrate dynamics and location with respect to Three broad peaks with linewidths of 1.9–4.2 ppm are observed
the protein. The 19F NMR spectra of F4-TPP+ bound to S64V- from −102 to −108 ppm. Most interestingly, a sharp peak with a
EmrE in DMPC bilayers show strongly temperature-dependent linewidth of 1.0 ppm is observed at −110 ppm. These four
spinning sideband intensities and linewidths (Fig. 2a). At a components vary in intensities from 6% to 50% of the full spectral
sample temperature (Teff) of 245 K, the 19F linewidth is ~5.7 ppm, intensity, thus cannot be simply attributed to each of four
and the sideband intensity envelope fits to a rigid-limit chemical fluorines. When the 19F intensity was transferred from protein
shift anisotropy (CSA) of 60.1 ppm and an asymmetry parameter carbons by cross polarization (CP)38,39, the −103 ppm, −105
of 0.8, indicating that the drug is immobilized.37 At 285 K, most ppm, and −110 ppm peaks are preferentially enhanced, indicat-
sideband intensities remain, but each peak in the sideband ing that these resonances arise from fluorines that lie in close
manifold resolves into multiple components, indicating that the proximity to the protein carbons. The −110 ppm signal shows the
fluorines experience a heterogeneous environment. At 308 K, in largest intensity increase, indicating that this peak results from a
4 NATURE COMMUNICATIONS | (2021)12:172 | https://doi.org/10.1038/s41467-020-20468-7 | www.nature.com/naturecommunicationsNATURE COMMUNICATIONS | https://doi.org/10.1038/s41467-020-20468-7 ARTICLE
Fig. 3 1H-detected 2D and 3D correlation NMR spectra of F4-TPP+ bound S64V-EmrE in DMPC bilayers. All spectra were measured under 55 kHz MAS
on CDN-labeled protein at a sample temperature of 285 K. a 2D 1H-15N correlation spectrum, showing assignment of selected resonances based on the 3D
spectra. Blue assignments correspond to residues shown in b. b Representative 3D strips extracted from the four 1H-detected spectra, showing the
assignment of residues T56–W63 of subunit A. Aliphatic 13C chemical shifts were assigned using the hCANH (orange) and hCA(CO)NH (green)
experiments, whereas CO chemical shifts were assigned using the hCO(CA)NH (red) and hCONH (blue) experiments.
fluorine that is both structurally ordered and the closest to the indicating that monomer B in the dimer is more dynamic. This
protein. In contrast, the −106 ppm peak is preferentially trend is reversed for TM4 residues, which show higher intensities
suppressed in the 13C-19F CP spectrum, indicating that this for monomer B residues than monomer A13. Additional side-
fluorine is the furthest from the protein. We attribute this −106 chain 13C chemical shifts were obtained from a 3D NCACX
ppm peak partly to lipid-bound F4-TPP+, consistent with spectrum (Supplementary Fig. 5B). In total, we assigned the HN,
previously reported 31P and 13C spectra of TPP+,40, which 15N, and 13Cα and 13CO chemical shifts of 72 residues in
detected nonspecific lipid-bound ligand. monomer A and 54 residues in monomer B (Supplementary
The partially resolved 19F isotropic chemical shifts allow us to Table 1). The Cα and CO chemical shifts confirm that the protein
probe millisecond-timescale dynamics of the substrate using a 2D is predominantly α-helical43, with inter-helical loops at residues
19F-19F exchange experiment (Fig. 2d). Using a fast MAS 25–35, 50–55, and 75–85, in good agreement with the secondary
frequency of 38 kHz and a short mixing time of 10 ms, we structure determined in bicelles (Supplementary Fig. 7) and with
minimized spin-diffusion effects and focused on detecting low-resolution cryo-EM and crystal structures6,21. The average
motional exchange41. No cross peaks are detected at 265 K, chemical shift differences between the two subunits are small:
consistent with the absence of 19F-19F spin diffusion under this 0.47 ppm for Cα and CO, 0.30 ppm for 1HN, and 1.0 ppm for
condition. In contrast, at 285 K, cross peaks between −110 ppm 15N. Among the four TM helices, TM3 displays the largest con-
and other peaks are observed, indicating that F4-TPP+ reorients formational asymmetry between the two subunits: for example,
on the 10 ms timescale. Cross-peak intensity buildup (Fig. 2e) V64 CO, I68 Cα, and I71 Cα exhibit 13C chemical shift differ-
indicates a time constant of 16 ± 2 ms for the exchange, indicating ences of 2.9 ppm, 5.4 ppm, and 3.3 ppm, respectively (Supple-
that F4-TPP+ reorients, possibly by tetrahedral jumps, in the mentary Fig. 6A). The chemical shifts show excellent agreement
binding pocket with a rate of ~50 s−1 at ambient temperature. between bilayers and bicelles (Supplementary Fig. 8), with average
13C, HN, and 15N chemical shift differences of 0.23 ppm, 0.29
Conformation of EmrE in DMPC bilayers. To investigate the ppm, and 0.78 ppm, respectively, indicating that the substrate-
conformation of EmrE in lipid bilayers and to obtain the amide bound EmrE conformation is similar between these two
1H chemical shifts that are required for measuring protein- environments.
substrate HN-F distances, we recorded four 1H-detected 3D MAS
correlation spectra of CDN-labeled EmrE that was back- 1H–19F distances restrain the structure of the substrate-
exchanged in protonated buffer. The hCANH and hCO(CA) binding pocket. With the 15N and 1H chemical shifts assigned,
NH spectra correlate intra-residue chemical shifts, whereas the we turned to the 1H-19F REDOR experiment32 to measure
hCA(CO)NH and hCONH spectra correlate inter-residue che- protein–substrate distances. We detected REDOR dephasing in
mical shifts42 (Supplementary Fig. 4). At 55 kHz MAS, the 2D hNH spectra, which exhibit both backbone HN signals and the
DMPC-bound protein exhibits narrow linewidths of 0.2 ppm for sidechain indole Hε signals of the important residue W63
1H, 0.8 ppm for 15N, and 0.5 ppm for 13C, indicating high con- (Fig. 4a). Two REDOR spectra were measured at each mixing
formational homogeneity. Fig. 3 and Supplementary Fig. 5A show time, one without 19F pulses (S0) and one with 19F pulses (S) to
representative 2D strips of the 3D spectra to illustrate resonance induce distance-dependent dipolar dephasing. The difference
assignment. The majority of monomer A signals show higher spectrum, ΔS, selectively exhibits the signals of protons that are in
intensities than monomer B signals (Supplementary Fig. 6B), close proximity to the fluorine atoms. Thus, the difference spectra
NATURE COMMUNICATIONS | (2021)12:172 | https://doi.org/10.1038/s41467-020-20468-7 | www.nature.com/naturecommunications 5ARTICLE NATURE COMMUNICATIONS | https://doi.org/10.1038/s41467-020-20468-7 Fig. 4 Protein–substrate distance measurement using 1H-19F and 13C-19F REDOR experiments. a Representative S0 (red) and ΔS (blue) 2D REDOR-hNH correlation spectra, measured with mixing times of 1.68 ms and 3.78 ms. Assignment is shown for selected peaks in the S0 spectrum. More difference peaks are observed in the 3.78 ms ΔS spectrum than the 1.68 ms ΔS spectrum due to the detection of HN sites further away from the substrate at longer mixing times. b Representative 1H-19F REDOR S/S0 dephasing curves with best-fit simulations. Fast and slow dephasing, corresponding to short and long distances, are shown in blue and black, respectively. c Cα secondary chemical shifts (gray bars) of F4-TPP+ bound EmrE, indicating the four TM α-helices separated by short loops. Residues whose HN atoms show difference signals in the 2D REDOR-hNH spectra are indicated by magenta circles at the bottom. Best-fit HN-F distances are indicated by blue circles. Residues in TM3A, TM3B, and TM1A display short distances to F4-TPP+. d Topology of the eight TM helices in the dimeric EmrE, with monomer A helices shown in orange and monomer B helices shown in blue. e 1D 13C-19F REDOR S0 and ΔS spectra, coadded from spectra recorded with mixing times of 0.92, 2.0, 3.0, and 4.5 ms. The ΔS spectrum is scaled up by 32-fold with respect to the S0 spectrum to better display the signals of substrate-proximal 13C sites. Note the preferential increase of aromatic 13C intensities in the 100–160 ppm region in the ΔS spectrum compared to the control S0 spectrum. This is consistent with the dominance of aromatic residues at the binding site. Selected peaks are assigned based on the chemical shifts assigned from the 3D correlation spectra (Supplementary Table 1). not only encode distance information but also simplify the binding sites are saturated with TPP+. In comparison, some assignment of substrate-proximal protons. With a REDOR mix- residues such as R82A show minimal decay, indicating that they ing time of 1.68 ms, the 2D ΔS spectrum already exhibits signals are far from the fluorines. Best-fit distances were obtained by from aromatic residues such as W63 and Y60 and aliphatic minimizing the root-mean-square deviation (RMSD) between the residues such as E14 and S43. Increasing the REDOR mixing time measured and simulated S/S0 ratios (Supplementary Fig. 9). Many yielded more ΔS peaks, consistent with the detection of additional TM1–TM3 residues show significant dipolar dephasing that is fit residues that are further away from the substrate. The largest to distances of
NATURE COMMUNICATIONS | https://doi.org/10.1038/s41467-020-20468-7                                                                                  ARTICLE
 Table 1 Solid-state NMR and structure refinement statistics
 for F4-TPP+ complexed S64V-EmrE structure in lipid bilayers.                                   heavy-atom RMSD was 2.12 ± 0.23 Å for the run 1 ensemble and
                                                                                                1.98 ± 0.40 Å for the run 2 ensemble, whereas the RMSD between
                                                       Monomer A             Monomer B          the two lowest-violation structures from each ensemble was 1.59
                                                                                                Å (Supplementary Fig. 10F, G). The structural differences
 NMR distance and dihedral constraints
 Dipolar couplings                                     42                    30
                                                                                                between the two runs are manifested more in subunit B than in
 Distance constraints                                  120                   94                 subunit A, with an RMSD of 1.58 Å for monomer B and only
 Total number of dihedral-angle                                                                 1.13 Å for monomer A. This observation is consistent with the
 restraints                                                                                     fact that monomer B is more dynamic than monomer A
  ϕ                                                    99                    86                 (Supplementary Fig. 6B). Excluding the loops, the largest
  ψ                                                    99                    87                 deviations between the two ensembles are found at C-terminal
  χ1                                                   53                    42                 ends of TM3A and TM3B (Supplementary Fig. 10D), consistent
 Structure refinement statistics                                                                 with the fact that the chemical shift asymmetry is the most
 Violations (mean ± s.d.)                                                                       pronounced for the C-terminal end of TM3 (Supplementary
  Distance constraints (Å)                             0.008 ±               0.019 ± 0.114      Fig. 6A). TPP+ has the same orientation between the two
                                                       0.064                                    ensembles (Supplementary Fig. 10F) and has a small RMSD of
  Max. distance-constraint violation (Å)               0.96                  1.48
                                                                                                0.61 Å for the center atoms. Given the overall structural similarity
  ϕ Dihedral-angle constraints (°)                     0.160 ± 1.486         0.126 ±
                                                                             0.995
                                                                                                between the two lowest-energy ensembles, we chose 10
  ψ Dihedral-angle constraints (°)                     0.217 ± 2.143         0.383 ±            conformers from the two runs with the lowest violations with
                                                                             2.421              the experimental distance restraints to constitute the final NMR
  Max. ϕ dihedral-angle violation (°)                  22.8                  13.9               structure ensemble (Supplementary Fig. 10H).
  Max. ψ dihedral-angle violation (°)                  31.4                  31.5                  The NMR structural ensemble of the EmrE F4-TPP+ complex
 Average pairwise r.m.s.d (Å)a                                                                  shows TM1–TM3 residues to interact with the substrate while the
  Protein heavy atom                                   2.12 ± 0.23                              two TM4 helices associate to stabilize the dimer (Fig. 5a,
  Protein backbone                                     1.61 ± 0.19                              Supplementary Fig. 10D, H). This architecture is in good
  Ligand heavy                                         1.35 ± 0.35                              agreement with the low-resolution cryo-EM and X-ray data21,46.
  Ligand centerb                                       0.76 ± 0.32                              In each monomer, E14 in TM1 and Y40 in TM2 approach the
 aPairwise r.m.s.d. was calculated among 10 lowest-violation structures between the two         substrate from one side, while Y60 and W63 of TM3 approach
 independent MD runs after the refinement had equilibrated.
 bLigand center is defined as phosphorus and its four directly bonded carbon atoms of F -TPP+.
                                                                                                the substrate from another side at an angle of ~100˚ from the
                                                                                      4
                                                                                                E14/Y40 pair (Fig. 5b). Among these four residues, Y40 is the
                                                                                                furthest away from the substrate (Table 2). The relative
torsion angles obtained solution NMR in the final structure cal-                                 proximities of these aromatic and polar residues to F4-TPP+
culation. The use of solid-state NMR chemical shifts did not make                               are in good agreement with biochemical data that W63 and Y60
any noticeable difference. The structure calculation consisted of                               are essential for substrate binding and transport, whereas Y40
two stages: docking of F4-TPP+ into previous molecular                                          regulates substrate specificity7. Between the A and B subunits, the
dynamics (MD) simulated apo structural models in dimethyl                                       two E14 sidechains are approximately colinear and lie on two
sulfoxide (DMSO), followed by all-atom refinement of the docked                                  opposite sides of TPP+. However, the E14 displacement from the
protein–ligand complexes in explicit DMPC bilayers. The dock-                                   substrate is asymmetric. The distances from the phosphorous to
ing stage used as input the measured 1H-19F distance restraints                                 the two E14 Cδ atoms, averaged over the 10 structures, are 5.6 Å
with fourfold ambiguity (Supplementary Table 2), while the MD                                   to monomer A and 7.5 Å to monomer B. The four phenylene Hζ
refinement stage used as input structurally assigned 1H-19F dis-                                 corners of the substrate are also asymmetrically positioned from
tance restraints (Supplementary Table 3) together with the pro-                                 E14: the nearest Hζ lies 4.6 Å away from E14A Cδ, whereas the
tein torsion angles. Two apo structural models, biased to the low-                              nearest Hζ lies 6.5 Å from E14B Cδ. These structural features
resolution crystal structure, were used for docking44,45. The                                   suggest that monomer A provides more stabilization energy to
substrate clustered to a single position in one apo protein model44                             the substrate. This is consistent with the weaker intensities of
(Supplementary Fig. 10A) but diverged to four positions in the                                  monomer B peaks compared with monomer A, suggesting that
second model45 (Supplementary Fig. 10B). For the latter, only one                               monomer B is more dynamic. Importantly, one of the four
of these four positions lies at the dimer interface. Thus, we                                   phenylene Hζ atoms, designated as F13 (Fig. 5b), is held by a cage
removed the outcome of the second model from further analysis.                                  of four functional residues: W63A, W63B, Y60A and E14B, with
In the uniquely docked model, TPP+ is surrounded by                                             distances of 5.8 Å, 5.7 Å, 6.9 Å, and 6.5 Å to W63A Nε, W63B Nε,
TM1–TM3 helices of subunit A and TM3 of subunit B. Among                                        Y60A Oζ, and E14B Cδ, respectively (Table 2). Thus, the F13-
the 20 lowest-energy docked structures, the phosphorus and its                                  bearing phenylene ring of TPP+ experiences multiple weak π-π,
four directly bonded carbons in TPP+, which represent the center                                CH-π, and electrostatic interactions with the protein, making this
of the molecule, have a mean RMSD of 1.6 Å, whereas the protein                                 fluorine most likely responsible for the narrow −110 ppm peak in
shows an all-atom RMSD of 0.6 ± 0.1 Å. Importantly, docking                                     the 19F spectrum (Fig. 2b). This binding-site geometry indicates
allowed the assignment of the phenylene Hζ atoms, replaced by                                   that multivalent aromatic and polar interactions play the
fluorine here, that dephase each protein HN (see Methods and                                     dominant role for TPP+ binding to EmrE. The aromatic-rich
Supplementary Table 3). With the 1H-19F pairs thus assigned and                                 nature of the binding pocket is further evidenced by 13C-19F
the overall ligand position constrained, we then refined the pro-                                REDOR spectra (Fig. 4e), which show difference intensities at the
                                                                                                13C chemical shifts of residues such as W63, Y60, F44, E14, G65,
tein structure in DMPC bilayers (Supplementary Fig. 10C) under
the constraints of the measured 1H–19F distances and (ϕ, ψ, χ1)                                 G67, S43, and V64.
torsion angles.                                                                                    The NMR structure of the EmrE-TPP+ complex puts TPP+ at
   We used two lowest-violation HADDOCK models to carry out                                     a similar location as the previous MD model of drug-bound
two independent MD runs. The resulting two structural                                           EmrE44 (Fig. 5c, Supplementary Fig. 10I), but differs in terms of
ensembles (Supplementary Fig 10D) are each well clustered and                                   the substrate orientation and the positions and orientations of the
show only modest differences from each other. The protein                                       protein residues. In the NMR structure, the two W63 indoles are

NATURE COMMUNICATIONS | (2021)12:172 | https://doi.org/10.1038/s41467-020-20468-7 | www.nature.com/naturecommunications                                           7
ARTICLE NATURE COMMUNICATIONS | https://doi.org/10.1038/s41467-020-20468-7
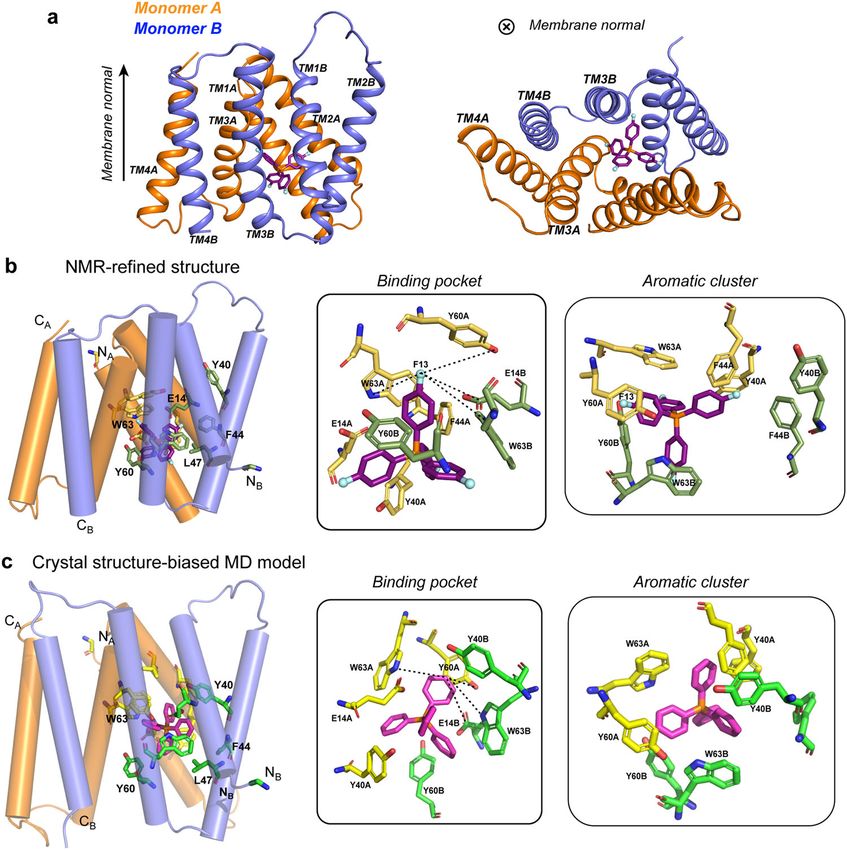
Fig. 5 Experimentally determined structural model of the EmrE-TPP+ complex in DMPC bilayers at low pH. a. Side view (left) and bottom view (right) of
the substrate-EmrE complex. The ligand (purple) lies closer to monomer A (orange) than monomer B (blue). b Distance-constrained NMR structure model
of the drug-binding site. Key residues, including E14, Y40, Y60, and W63, surround the substrate (middle). One of the four phenylene Hζ atoms, marked as
F13, is tightly coordinated by residues from both monomer A (yellow) and monomer B (green). The right panel shows a bottom view of all aromatic
residues (W63, Y60, F44, and Y40) surrounding the substrate. Monomer A residues are colored in yellow while monomer B residues are colored in green.
c Crystal structure biased MD-simulated structure model of TPP-bound EmrE. The substrate position and orientation relative to the binding-site residues
differ from those in the experimental NMR structure. Monomer A residues are shown in yellow and monomer B residues are shown in green.
roughly perpendicular to each other, with the W63A indole plane
Table 2 EmrE to F4-TPP+ distances extracted from the at an angle of ~50˚ with respect to the nearest, F13-bearing, TPP+
NMR-refined structural ensemble. phenylene plane. In comparison, the MD model puts the two
W63 indole rings roughly parallel to each other, and both are
Monomer A Monomer B perpendicular to the closest TPP+ ring44. In the MD model, the
P—E14 Cδ 5.6 ± 0.3 Å 7.5 ± 1.0 Å two E14 residues approach the substrate at different angles and
P—Y40 Oζ 6.8 ± 0.5 Å 16.7 ± 0.3 Å displacement compared with those of the NMR structure. The
P—Y60 Oζ 9.8 ± 0.7 Å 5.9 ± 0.4 Å residues in the NMR structure model are more loosely packed
P—W63 Nε 6.0 ± 0.4 Å 5.6 ± 0.3 Å compared with the MD model. For example, the E14B-Y60A-
Min. F a—E14 Cδ 4.6 ± 0.5 Å 6.5 ± 0.7 Å W63B triad show distances of 4.0–7.0 Å among the Cδ, Oζ, and
Min. F a—Y40 Oζ 6.2 ± 0.6 Å 12.2 ± 0.4 Å Nε atoms in the NMR structure (Fig. 5b), whereas the
Min. F a—Y60 Oζ 6.9 ± 0.4 Å 5.6 ± 0.5 Å corresponding distances in the MD structural model are much
Min. F a—W63 Nε 5.8 ± 0.3 Å 5.7 ± 0.4 Å shorter, 3.2–3.8 Å, suggesting hydrogen bonding. On the other
F13 b—E14 Cδ 8.7 ± 0.6 Å 6.5 ± 0.7 Å side of TPP+, the equivalent triad of E14A-Y60B-W63A is
F13 b—Y60 Oζ 6.9 ± 0.4 Å 5.6 ± 0.5 Å
similarly loose, with inter-atomic distances of 3.7–6.4 Å.
F13 b—W63 Nε 5.8 ± 0.3 Å 5.7 ± 0.3 Å
The average distances and standard deviations are from the ensemble of 10 lowest-violation
structures in the final 170 ns of the two MD trajectories. Discussion
aDistances of the nearest fluorine to protein atoms.
bDistances from the F13 atom, which resides in an aromatic box formed by W63 and Y60, to
The results shown here provide the first extensive experimental
protein atoms. definition of the geometry of the substrate-binding pocket of
EmrE. The large number of protein–substrate 1H-19F distances
(Supplementary Fig. 10E)32, measured in bilayer-bound EmrE,
8 NATURE COMMUNICATIONS | (2021)12:172 | https://doi.org/10.1038/s41467-020-20468-7 | www.nature.com/naturecommunicationsNATURE COMMUNICATIONS | https://doi.org/10.1038/s41467-020-20468-7 ARTICLE
indicates the relative proximities of residues at the binding required to determine whether increased dynamics of monomer B
pocket. The inequivalent substrate position between the two facilitates or impedes the alternating-access motion.
subunits42 gives insight into the asymmetric protonation of the Among different members of the tetrahedral ligands, higher
two E14 residues13,14. In the NMR structure, E14A Cδ in binding affinity is correlated with slower transport10. When the
monomer A is closer to the TPP+ phosphorus and the nearest same ligand binds different mutant proteins, then the anti-
fluorine than E14B Cδ in monomer B (Table 2), suggesting that correlation between binding affinity and protein dynamics
E14A is negatively charged and should experience favorable weakens31. These data suggest that the ligand geometry and
electrostatic attraction with the positively charged F4-TPP+. The protein structure both affect the binding-site structure and
inequivalent positions of E14 with respect to the substrate explain alternating-access rate, but in a partly independent manner.
the distinct chemical shifts of E14A and E14B, with E14A exhi- Future studies to determine how the EmrE binding-site structure
biting larger Cα, Cβ, and Cγ chemical shifts than E14B (Sup- changes with the ligand, pH, and protein mutation, will be
plementary Table 1). A previous NMR study of E14-labeled EmrE informative to define the conformational landscape of this pro-
bound to ethidium bromide reported similar aliphatic chemical miscuous transporter.
shift differences as seen here29, but in addition, measured the The contribution of MDR transporters to bacterial virulence
carboxyl chemical shifts at a low temperature of 200 K. E14A and and antibiotic resistance has led to significant interest in devel-
E14B were found to have Cδ chemical shifts of 180.9 ppm and oping efflux pump inhibitors. The goal is to block transport
178.3 ppm, respectively. Since protonated carboxyl groups activity in order to reduce bacterial virulence, restore antibiotic
have smaller isotropic chemical shifts on average than deproto- efficacy, and provide tools to understand the complex toxin efflux
nated ones47, these Cδ chemical shifts indicate that E14B is network in bacteria48–50. These inhibitors often resemble sub-
protonated while E14A is deprotonated in the presence of ethi- strates and compete for substrate binding or prevent the protein
dium. Therefore, this previous result is fully consistent with our from undergoing the conformational changes that are required
current assignment of E14A to be negatively charged and in for transport51. The structure presented here provides an initial
closer proximity to the positively charged TPP+. In addition, guide for structure-based design of EmrE inhibitors to probe
solution NMR pH and TPP+ titrations with bicelle-bound EmrE function within the E. coli MDR efflux network in vivo. As
EmrE also suggested asymmetric binding of TPP+: only E14B a model system, EmrE has provided rich insight into the com-
remained titratable, with a pKa of 6.8, implying that TPP+ is plexity of proton-coupled drug transport. Biophysical studies
closer to E14A, preventing its protonation13. These data, have revealed its ability to perform different types of coupled
taken together, indicate that TPP+, as well as other EmrE ligands, transport that would lead to either resistance or susceptibility
bind the dimer asymmetrically, closer to subunit A than to in vivo11,13. Mutagenesis of EmrE and other SMR homologs
subunit B, demonstrate the ease with which SMR transporters may be
The current data also report the first observation of substrate converted between these two phenotypes and confirm that a
dynamics in the binding pocket, which is coupled to protein single transporter can confer resistance to some substrates and
dynamics. These dynamics are manifested by the 19F NMR susceptibility to others6,52. Application of the approach used here
spectra of the substrate at physiological temperature and the to additional substrates will provide a foundation for under-
temperature-dependent 13C spectra of the protein (Fig. 2). It is standing the multidrug poly-specificity of EmrE and how differ-
also hinted by the subtle TM3 helix orientational difference ent substrates can interact with EmrE to trigger opposing
between the two MD runs (Supplementary Fig. 10D). How does biological outcomes of resistance or susceptibility.
the structure of the protein–substrate complex solved at low
temperature explain these motions at high temperature, and how Methods
do these motions relate to promiscuous substrate binding and Synthesis of tetra(4-fluorophenyl) phosphonium iodide. Into a 50 ml heavy-
transport? The current structure shows that the binding pocket is wall pressure vessel with a polytetrafluoroethylene internal-thread cap with a
composed of many aromatic and polar residues, which engage in magnetic stir bar, 4-fluoroiodobenzene (1.4 g, 1.0 equiv), tris(4-fluorophenyl)
phosphine (2.0 g, 1.0 equiv), Pd(OAc)2 (0.021 g, 1.5 mol%), and mixed xylenes
multivalent interactions with the substrate that are not easily (15 mL) were added. The tube was flushed with nitrogen, capped, and the reaction
perturbed by a single mutation at residue 64. At the same time, mixture stirred at 140 °C for 2 hours. The product, tetra(4-fluorophenyl) phos-
the binding pocket is spacious: most inter-residue distances are phonium iodide, precipitates during the course of the reaction. Once cooled, the
longer than the hydrogen-bond length, and the protein–drug product was isolated by filtration, washed with small portions of fresh xylenes, and
air-dried. The pure tetra(4-fluorophenyl) phosphonium iodide product was iso-
distances are also sufficiently long to allow drug reorientation. lated as a pale ivory solid (3.2 g, 95% yield).
This spacious and multivalent binding pocket explains the similar
binding affinities of TPP+ for the mutant and wild-type EmrE, S64V-EmrE expression and purification. S64V-EmrE was expressed and purified
and is also consistent with the ability of the protein to bind following published protocol31, using the same procedure as for WT EmrE53. In
multiple drugs promiscuously. However, binding does not equal brief, for 13C,15N-labeled S64V-EmrE, the protein was expressed using media
transport. Efficient translocation of the drug requires coordinated containing 2.5 g/L U-13C glucose, 1 g/L 15NH4Cl, 0.5 g/L 13C,15N-labled ISOGRO
(Millipore-Sigma). 2H,13C,15N (CDN) S64V-EmrE was expressed in 2H2O media
motion of the protein between the outward-facing and inward- containing 2.5 g/L U-2H,13C glucose, 1 g/L 15NH4Cl, 0.5 g/L 2H,13C,15N-labled
facing conformations. Although S64V-EmrE binds substrates ISOGRO. 2H,15N (DN)-labeled S64V-EmrE was expressed in 2H2O media con-
with nearly identical, sub-micromolar, affinity as wild-type EmrE, taining 1 g/L 15NH4Cl and 0.5 g/L 2H,13C,15N-labled ISOGRO. Lysis and pur-
it has a slower transport rate and eightfold slower alternating- ification were performed using Ni-NTA affinity column followed by thrombin
access rate than the WT protein31. This slower transport rate cleavage of the His-tag and size exclusion chromatography on a S200 column in
buffer containing 50 mM MES, 20 mM NaCl, 10 mM decyl-maltoside, 5 mM BME,
implies a reduced ability of the mutant to undergo coordinated pH 5.810,53.
conformational changes. We observed less helical chemical shifts
for V64 in monomer B than in monomer A, suggesting helix Solid-supported membrane-based electrophysiology experiments. WT EmrE
disorder in TM3 of monomer B9,46. The fact that this TM3 dis- and E14Q EmrE was expressed and purified similar to S64V-EmrE13. To minimize
order is observed in the more dynamic monomer (Supplementary solution exchange artifacts, the buffers used for size exclusion chromatography,
Fig. 6) suggests that the local motion of monomer B might reg- reconstitution, and electrophysiology steps had the same salt composition: 50 mM
MES, 50 mM MOPS, 50 mM bicine, 100 mM NaCl, and 2 mM MgCl2. Buffer pH
ulate the ability of the dimer to undergo conformational inter- values were carefully adjusted using only NaOH to ensure that internal and
conversion, which is required for drug efflux. Future comparison external Cl- concentrations were identical for all measurements. Protein was
of the mutant with the WT structure and dynamics will be reconstituted into POPC liposomes at a 1:400 protomer: lipid molar ratio, and
NATURE COMMUNICATIONS | (2021)12:172 | https://doi.org/10.1038/s41467-020-20468-7 | www.nature.com/naturecommunications 9ARTICLE NATURE COMMUNICATIONS | https://doi.org/10.1038/s41467-020-20468-7
detergent was removed with Amberlite XAD-2. Liposomes were collected, ali- Pulse sequences for the 1H-detected experiments and 19F solid-state NMR
quoted, and flash frozen. Immediately prior to measurements, liposomes were experiments are shown in Supplementary Fig. 4, whereas detailed experimental
thawed, diluted twofold with pH 7.3 buffer, and briefly sonicated. parameters are given in Supplementary Table 4. In general, N-C correlation
All electrophysiology measurements were recorded and analyzed using a experiments used SPECIFICCP for polarization transfer56. 13C-13C correlation was
Surf2er N1 solid-supported membrane-based electrophysiology (SSME) achieved using the CORD spin-diffusion sequence57 under slow MAS (14 kHz) and
instrument from Nanion Technologies. Prior to measurements, sensors were the DREAM sequence58 for one-bond 13C–13C transfer under fast MAS (55 kHz).
equilibrated on the instrument with multiple washes with pH 7.30 buffer High-power 1H decoupling used either continuous wave or TPPM59 schemes, and
containing 0.5 μM F4-TPP+ while recording currents. Washes were performed low-power 1H decoupling was performed using the WALTZ-16 scheme.60 Proton-
until successive washes produced no observable current. Transport was initiated by detected MAS NMR experiments employed MISSISPPI to suppress the water 1H
perfusion of pH 7.00 buffer containing 10 μM F4-TPP+ to simultaneously set signal.61 Four 1H-detected 3D correlation experiments were used to assign the 1H,
inward-facing proton and drug gradients. Transport currents were recorded during 15N, and 13C chemical shifts of bilayer-bound S64V-EmrE. The hCANH and hCO
1.5 s of perfusion of the external buffer and integrated to obtain transported charge. (CA)NH experiments allow intra-residue assignment, whereas the hCA(CO)NH
After these measurements, sensors were washed with pH 7.30 buffer containing and hCONH experiment allow inter-residue assignment.
10 μM F4-TPP+ while recording currents. Washes were again performed until 19F chemical shifts were externally referenced to the −122.1 ppm signal of 5F-
successive washes produced no observable current. (0.5 μM F4-TPP+ for outward- tryptophan on the CF3Cl scale and 15N chemical shifts were externally referenced
facing gradient, 10 μM F4-TPP+ for inward-facing or no gradient). Transport was to the 15N peak of N-acetylvaline at 122.0 ppm on the liquid ammonia scale. 1H
initiated by perfusion of pH 7.00 buffer containing 0.5 or 10 μM F4-TPP+ to and 13C chemical shifts were internally referenced to match the DSS-referenced
simultaneously set inward-facing drug and/or proton gradients. Reported values chemical shifts of the solution-state 1H and 13C values. The solid-state 2D 13C-13C
are the average of replicates on three different sensors, and error bars are the CORD spectrum was calibrated by referencing the T28AB Cβ peak to 70.3 ppm.
standard error of the mean. For the hNH, hCANH, hCONH, and hCA(CO)NH spectra, we chose G67A as the
reference signal, setting the 1H chemical shift to 9.0 ppm, 13Cα to 47.1 ppm, the
Reconstitution and preparation of solid-state NMR samples. 13C,15N-labeled V66 13CO to 178.1 ppm, and V66Cα to 67.1 ppm (Supplementary Table 1). The
S64V-EmrE was reconstituted into DMPC (Avanti Polar Lipids) liposomes at a hCO(CA)NH spectrum was similarly referenced to solution-state chemical shifts.
EmrE monomer to lipid molar ratio (P: L) of 1: 50 or 1: 25. DMPC was resus- However we noticed temperature-induced perturbations between redundant 13CO
pended in 50 mM MES, 20 mM NaCl, pH 5.8 buffer at 20 mg/mL. The lipid shifts in the hCONH and hCO(CA)NH spectra. As a result, we calculated the
mixture was incubated at 45 °C for 1 h to hydrate, then bath-sonicated for 1 min average perturbation in the hCO(CA)NH spectrum relative to the hCONH
before addition of 0.5% octyl-glucoside followed by 30 s bath sonication. The lipid spectrum for 10 13CO shifts, and applied a +0.4 ppm correction to the 13C
mixture was incubated at 45 °C for an addition 15 min before mixing with purified dimension of the hCO(CA)NH spectrum.
S64V-EmrE solution. After 20 min room temperature (RT) incubation, Amberlite
(Supelco) was added (3 × 30 mg Amberlite per mg total detergent) to remove the Solution NMR experiments. TROSY-selected ZZ exchange62 spectra were col-
detergent. The amberlite was removed after 16–24 hours by simple filtration. lected on an 800 MHz Varian VNMRS DD spectrometer equipped with a 5 mm
Liposomes were collected by ultracentrifugation (165,000 × g, 6 °C, 2 h.) and cold probe (1H/13C/15N) using VnmrJ 4.0. The VT setpoint was set at 45 °C and
resuspended in a small volume (~20 mg/mL lipid conc.) of buffer. To ensure data were collected with 200 ms mixing for ~5 days, yielding no discernable
complete detergent removal, the sample was dialyzed against 1 L of the same buffer exchange cross peaks. Data were processed using NMRPipe63 and NMRFAM-
(50 mM MES, 20 mM NaCl, pH 5.8) with buffer change every 24 hours over a Sparky64 was used to analyze spectrum.
72 hour period. The sample was then incubated with excess solid F4-TPP + + at RT
with end-to-end mixing for at least 16 hours. Excess F4-TPP + + was removed
using microcentrifugation (8000 × g, 5 min). Proteoliposomes were then pelleted at Solid-state NMR spectral analysis and distance extraction. 1D and 2D MAS
100,000 × g, 4 °C, 2 h in an ultracentrifuge. A similar method was used to prepare NMR spectra were processed in the Bruker Topspin software package. 3D corre-
the CDN-S64V-EmrE sample, except that the protein was reconstituted into lation spectra were added in the frequency domain using a Python script that made
DMPC-d54 liposomes at a P: L of 1: 25. Proteoliposomes were dried to ~40% use of NMRGlue and NumPy Python packages.65,66 Chemical shift assignment and
hydration by mass in a desiccator. Samples were centrifuged into 3.2, 1.9, and plotting of 3D spectra were performed in NMRFAM-Sparky67. Comparisons of
1.3 mm MAS rotors. Three 1.9 mm rotors were packed: (1) a CDN-EmrE sample solid-state and solution NMR chemical shifts and monomer A and B chemical
containing 3.6 mg protein in 16.0 mg proteoliposomes, (2) a CN-labeled EmrE shifts were computed in Python and plotted with Matplotlib.68 Protein backbone
sample (P: L = 1: 25) containing 3.4 mg protein in 14.9 mg proteoliposomes, and torsion angles were predicted from measured chemical shifts using the TALOS-N
(3) a CN-labeled EmrE sample (P: L = 1: 50) containing 1.9 mg protein in 15.0 mg software43, excluding all 1H chemical shifts and applying a deuterium isotope
proteoliposomes. A 1.3 mm MAS rotor was packed with 0.9 mg CDN-EmrE in 3.9 correction to the Cα and Cβ chemical shifts.
mg proteoliposomes. The 3.2 mm Revolution NMR rotor was packed with 5 mg HN-19F distance restraints were extracted from least square fit of the
CN-EmrE in 39 mg proteoliposomes (P: L = 1: 50). experimental REDOR data by numerically simulated curves.32,69 In brief, peak
volumes in the 2D 1H–19F REDOR-hNH S0 and S spectra were integrated to obtain
the intensity ratios S/S0 for all mixing times. We then simulated the two-spin
Reconstitution and preparation of solution NMR samples. All solution NMR REDOR dephasing curves for distances of 3.0–15.0 Å in 0.1 Å increments using the
samples were reconstituted into DMPC/DHPC isotropic bicelles (q = 3) at a 75:1 SIMPSON software package70. These numerical simulations included the
lipid to EmrE monomer ratio. The reconstitution was performed similarly to the magnitude (δ) and asymmetry (η) of 19F CSA, but left the tensor orientations
solid-state NMR sample up to the point where liposomes were pelleted at unknown (i.e., Euler angles of 0, 0, 0). Finite-pulse effects were explicitly encoded
(165,000 × g, 6 °C, 2 h). Once pelleted, the sample was resuspended in buffer in the NMR parameters. RF inhomogeneity was accounted for by simulating for
containing threefold higher concentration of 1,2-dihexanoyl-sn-glycero-3-phos- pulse flip angles of 180˚ to 145˚ in 5˚ increments, weighted by a half-Gaussian
phocholine (DHPC-6). Samples were then subjected to three cycles of freeze-thaw. function centered at 180˚.32,69 The REPULSION168 scheme with 32 gamma angles
The pH of the final samples was adjusted to 5.8 at 45 °C using a Hamilton biotrode was used for powder averaging71. The best-fit 1H–19F distance was extracted by
microelectrode. The sample was then incubated with excess solid F4-TPP + + at minimizing the RMSD between the simulated and measured S/S0 values. The
45 °C overnight. Excess F4-TPP + + was removed using microcentrifugation prior uncertainty in the best-fit distance was set by an RMSD threshold of 0.2, as this was
to transferring solution to NMR tubes. the maximum scatter observed for sites that do not dephase; distances below this
RMSD value were considered significant (Supplementary Fig. 9). In cases where
little or no dephasing was observed, we set the distance upper uncertainty to 40 Å,
Solid-state NMR experiments. All MAS NMR experiments were conducted at which is approximately the longest possible distance in the dimer. For residues
600, 700, and 800 MHz Bruker NMR spectrometers. 1H-19F REDOR distance whose signals overlap in the 2D hNH spectrum, the lower-limit distance
measurements were conducted under 38 kHz MAS at an effective sample tem- uncertainty was increased.
perature (Teff) of 285 K on a Bruker Avance III HD 600 MHz (14.1 T) spectrometer
at MIT using a 1.9 mm HFX probe. 1H-detected 3D correlation experiments for
resonance assignment were conducted on 1.3 mm HCN probes under 55 kHz MAS Solution NMR assignment spectra. Solution chemical shift assignments were
between 280 and 285 K on the 600 MHz spectrometer and an Avance NEO 700 assigned using the following suite of three-dimensional NMR spectra with non-
MHz (16.5 T) spectrometer at Bruker Biospin (Billerica, MA). 13C-detected 3D uniform sampling (NUS): TROSY-HNCA and TROSY-HNCACB spectra were
correlation experiments were conducted under 14 kHz MAS using a 3.2 mm recorded on a 900 MHz Bruker Avance III HD equipped with a 5 mm triple
BlackFox HCN probe on an 800 MHz spectrometer.54. The effective sample tem- resonance cryoprobe (1H/13C/15N) running Topspin NMR 3.5. Temperature was
peratures were estimated from the water 1H chemical shifts using the equation Teff set to 45 °C. The TROSY-HNCA72–74 (Bruker trhncaetgp2h3d) was acquired with
(K) = 96.9 × (7.83−δH2O) where δH2O is the measured water 1H chemical shift55. 1024 complex points in the direct dimension (1H) and 604 non-uniformly sampled
The corresponding thermocouple-reported set temperature (Tset) is given in Sup- complex points in the indirect dimensions (max increments 36 (15N) and 48 (13C))
plementary Table 4. There is no chemical shift difference between fast and slow for 35% sampling. Sixty-four scans were acquired per increment with a 2 s delay.
MAS, and the samples were maintained at similar temperatures by choosing Spectral widths were 16.34 ppm centered at 4.58 ppm (1H), 31.3 ppm centered at
appropriate bearing temperatures. Thus, the protein conformation is unchanged by 116.5 ppm (15N) and 29.5 ppm centered at 55.6 ppm (13C). The TROSY-
fast MAS compared with slow MAS. HNCACB72–74 (Bruker trhncacbetgp2h3d) was acquired with 1024 complex points
10 NATURE COMMUNICATIONS | (2021)12:172 | https://doi.org/10.1038/s41467-020-20468-7 | www.nature.com/naturecommunicationsYou can also read


