Pericentromeric Satellite III transcripts induce etoposide resistance
←
→
Page content transcription
If your browser does not render page correctly, please read the page content below
Kanne et al. Cell Death and Disease (2021)12:530
                                    https://doi.org/10.1038/s41419-021-03810-9                                                                                                             Cell Death & Disease

                                     ARTICLE                                                                                                                                                    Open Access

                                    Pericentromeric Satellite III transcripts induce
                                    etoposide resistance
                                    Julian Kanne1,2, Michelle Hussong1,2, Jörg Isensee 3, Álvaro Muñoz-López4, Jan Wolffgramm4, Felix Heß1,5,
                                    Christina Grimm 1,2, Sergey Bessonov1,6, Lydia Meder2,6, Jie Wang2,7, H. Christian Reinhardt8, Margarete Odenthal2,7,9,
                                    Tim Hucho3, Reinhard Büttner7, Daniel Summerer4 and Michal R. Schweiger 1,2

                                      Abstract
                                      Non-coding RNA from pericentromeric satellite repeats are involved in stress-dependent splicing processes, maintenance
                                      of heterochromatin, and are required to protect genome stability. Here we show that the long non-coding satellite III
                                      RNA (SatIII) generates resistance against the topoisomerase IIa (TOP2A) inhibitor etoposide in lung cancer. Because heat
                                      shock conditions (HS) protect cells against the toxicity of etoposide, and SatIII is significantly induced under HS, we
                                      hypothesized that the protective effect could be traced back to SatIII. Using genome methylation profiles of patient-
                                      derived xenograft mouse models we show that the epigenetic modification of the SatIII DNA locus and the resulting
                                      SatIII expression predict chemotherapy resistance. In response to stress, SatIII recruits TOP2A to nuclear stress bodies,
                                      which protects TOP2A from a complex formation with etoposide and results in decreased DNA damage after treatment.
                                      We show that BRD4 inhibitors reduce the expression of SatIII, restoring etoposide sensitivity.
                  1234567890():,;
1234567890():,;
                  1234567890():,;
1234567890():,;

                                    Introduction                                                                                        genome to daughter cells. Heterochromatic satellite
                                      Pericentromeric satellite RNAs are transcribed from                                               DNAs are structurally characterized by repressive histone
                                    heterochromatic regions under cellular stress conditions.                                           marks (H3K9me2/3, H4K20me2/3), a high degree of DNA
                                    The advancement in high-throughput technologies allows                                              methylation, and the presence of heterochromatin protein
                                    to map and characterize non-protein coding (NPC)                                                    1 (HP1)3. Upon relaxation of heterochromatin, and
                                    regions of the genome and has resulted in the discovery                                             especially following loss of H3K9me2, satellite RNA
                                    that heterochromatin is not generally transcriptionally                                             transcripts are derepressed what leads to RNA:DNA loop
                                    inert, but plays versatile roles in development and dis-                                            formation, the accumulation of R-loops, and excessive
                                    ease1. NPC regions are divided into non-repetitive and                                              strand breakage and DNA damage4,5. Similar to histone
                                    repetitive regions. A major subgroup of repetitive regions                                          methylation, the BRCA1 complex protects against repli-
                                    are the tandem repetitive DNAs, which include the pro-                                              cation defects, satellite repeat transcription and RNA:
                                    minent repeats: telomeric DNAs, microsatellites, and                                                DNA hybrid formation6,7. Though the complex organi-
                                    satellites2. Satellites are predominantly located at cen-                                           zation of repetitive regions is difficult to grasp, a thorough
                                    tromeric and pericentromeric regions of chromosomes                                                 understanding of errant stress responses in light of het-
                                    and mediate the faithful distribution of the duplicated                                             erochromatin relaxation is essential to uncover new
                                                                                                                                        mechanisms of disease development.
                                                                                                                                          Satellite RNA transcription can be induced by an array
                                    Correspondence: Michal R. Schweiger (mschweig@uni-koeln.de)
                                    1                                                                                                   of external triggers, most prominently by heat stress (HS)
                                     Institute for Translational Epigenetics, University Hospital of Cologne, Faculty
                                    of Medicine, University of Cologne, Cologne, Germany                                                that results in transcriptional induction of SatIII and an
                                    2
                                     Center for Molecular Medicine Cologne, University of Cologne, Cologne,                             accumulation of these transcripts at their genomic loci,
                                    Germany
                                                                                                                                        which ultimately leads to the formation of nuclear stress
                                    Full list of author information is available at the end of the article
                                    These authors contributed equally: Julian Kanne, Michelle Hussong                                   bodies (nSBs)8–11. The function of these subnuclear,
                                    Edited by B. Rotblat

                                    © The Author(s) 2021
                                                        Open Access This article is licensed under a Creative Commons Attribution 4.0 International License, which permits use, sharing, adaptation, distribution and reproduction
                                                        in any medium or format, as long as you give appropriate credit to the original author(s) and the source, provide a link to the Creative Commons license, and indicate if
                                    changes were made. The images or other third party material in this article are included in the article’s Creative Commons license, unless indicated otherwise in a credit line to the material. If
                                    material is not included in the article’s Creative Commons license and your intended use is not permitted by statutory regulation or exceeds the permitted use, you will need to obtain
                                    permission directly from the copyright holder. To view a copy of this license, visit http://creativecommons.org/licenses/by/4.0/.

                                    Official journal of the Cell Death Differentiation Association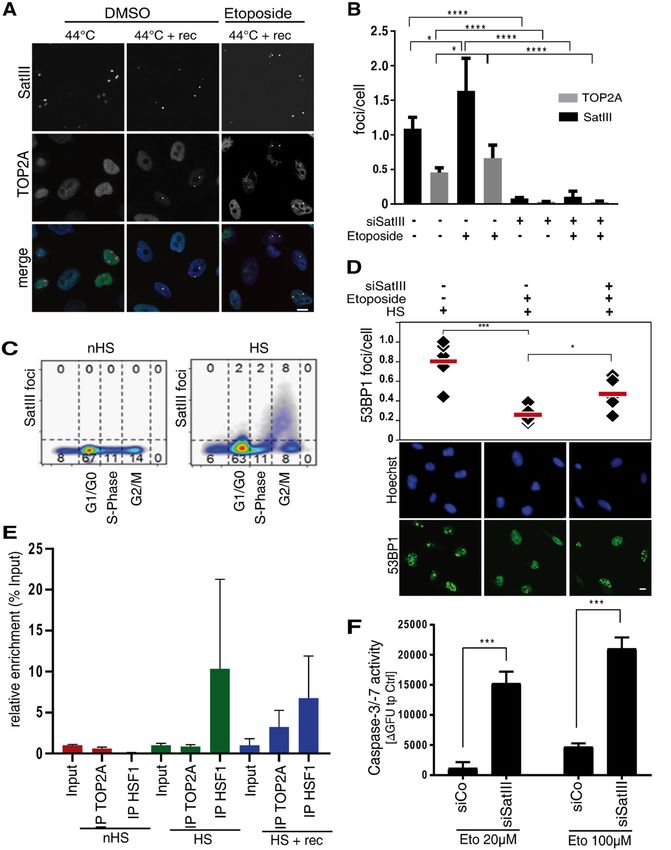
Kanne et al. Cell Death and Disease (2021)12:530                                                                Page 2 of 15

membrane-less structures and pericentromeric tran-              CVCL2063) were purchased from ATCC. HEKT293
scripts is largely unknown. Several transcriptional reg-        (Thermo R70007, RRID: CVCL6911) were purchased from
ulators, such as CREB (cAMP response element-binding            Thermo Scientific. HeLa and U2OS cells were cultivated in
protein)-binding protein (CREBBP), Pol II, and the heat         Dulbecco’s Modified Eagle’s Medium (Biochrom), con-
shock factor 1 (HSF1) are found at nSBs9,10. Stress-            taining 10% fetal calf serum, 2 mM L-glutamine, and 100 U
induced splicing processes are modulated by the recruit-        penicillin/streptomycin. H2030, HCC827: RPMI 1640
ment of splicing factors at nSBs12. We previously identi-       Medium, containing 10% fetal calf serum, 2 mM L-gluta-
fied the epigenetic regulator BRD4 (Bromodomain                  mine, and 100 U penicillin/streptomycin. HEK T293:
protein 4) as an additional component of nSBs13 and             DMEM GlutaMAX™ Medium, containing 10% fetal calf
showed that recruitment of BRD4 to the pericentromeric          serum and 100 U penicillin/streptomycin. All cell lines
regions influences the stress-induced splicing process and       were tested negative for mycoplasma contamination. Cell
the heat-mediated induction of SatIII RNA.                      line data were collected from Cancerrxgene (Wellcome
  Though the loss of heterochromatin and subsequent             Sanger Institute) and RNA-Seq data were obtained from
transcription of non-coding RNAs from satellite repeats is      Klijn et al.21.
induced in mouse and human epithelial cancers, including           For heat stress induction, cells were incubated at 44 °C
pancreatic, colon, and lung tumors14,15, SatIII repeats         with 5% CO2. Preliminary experiments in HeLa cells and
have not been reported to have therapeutic relevance. HS        U2OS cells revealed no substantial difference between
conditions protect cells against the toxicity of che-           42 °C for 4 h and 44 °C for 1 h on RNA level in our
motherapeutic drugs, most prominently the topoisome-            hands13. Thus, the latter conditions were applied for
rase 2 (TOP2) inhibitor etoposide16. Because SatIII is          subsequent experiments, as they induced SatIII foci in a
significantly induced under HS, we hypothesized that the         comparable or even stronger fashion.
protective effect could be traced back to SatIII. Etoposide
treatment is part of a broad range of cancer treatment          Transfection and viral transduction
regimens and is frequently used to treat lung cancer.             Transfections were performed with respective siRNAs
Etoposide temporarily stabilizes transiently induced DNA        (SatIII, Control) using Lipofectamine RNAiMAX reagent
double-strand breaks (DSB) created by TOP2A. The                (Invitrogen Inc., #13778030) according to the manu-
interaction of etoposide with TOP2A promotes the                facturer’s recommendations. Additionally, a modified
emergence of stable TOP2A cleavage complexes                    antisense oligonucleotide was transfected using Lipo-
(TOP2ccs) and causes defective DNA re-ligation and              fectamine 2000 (Invitrogen Inc., #11668027). Sequences
rewinding. This results in DNA damage, which induces            of siRNA/shRNA/antisense-oligos are provided in Sup-
the DNA damage response and leads to apoptosis17–20.            plementary Table 1.
Cellular stress response mechanisms, including DNA                For viral transductions plasmids psPAX2 (Dull et al.,
damage repair pathways, may counteract this effect and          1988, RRID:Addgene_12260), MD2.G (Dull et al., 1988,
enable therapy resistant cancer cells to evade the toxic        RRID:Addgene_12259) were used and transfected with
effect of etoposide.                                            PEI (Polysciences, #23966-1), Lentiviruses were harvested
  We report here that the de-methylation and expression         after 48 h and used for transductions.
of SatIII in non-small cell lung cancer patient-derived
xenograft mouse models (NSCLC-PDX) and cell culture             Patient-derived xenograft (PDX) models
models promote cellular resistance towards etoposide.             The PDX models used in this work are described in
We show that the recruitment of the etoposide target            detail in Grasse et al.22. In brief, patient lung tumor sam-
TOP2A to nSBs is SatIII dependent and results in                ples were implanted subcutaneously into 1–3 nude or
decreased DNA damage that impacts downstream DNA                NOD/SCID mice. For the generation of PDXs, primary
repair pathways. Etoposide resistance can be overcome by        NSCLC tumor samples with a tumor cell content ranging
inhibiting SatIII expression by BRD4 inhibitors. Our work       from 5% to more than 70% were used. For each PDX
identifies the first repetitive non-coding RNA that confers       model, six mice were exposed to treatments per injection
etoposide resistance, as well as proposes that chemically       or solvent intraperitoneal at days 1 and 8 and tumor
induced alterations in SatIII expression can be utilized to     growth was measured by caliper measurement for
overcome etoposide resistance.                                  2–6 weeks. Once tumors became palpable, tumor size was
                                                                measured weekly with a caliper-like instrument. Individual
Materials and methods                                           tumor volume V was calculated with the following for-
Cell lines and HS conditions                                    mula: V = 1/2 length × width2. Tumors of each model were
 HeLa (ATCC, CCL-2, RRID: CVCL0030), U2OS (ATCC                 further transplanted into 2–4 mice after a tumor volume of
HTB-96, RRID:CVCL0042), H2030 (ATCC CRL-5914,                   approx. 1.2 cm3 was reached. Where possible, snap-frozen
RRID:CVCL1517), and HCC827 (ATCC CRL-2868, RRID:                tumor samples from each passage (up to 10 passages) were

Official journal of the Cell Death Differentiation Association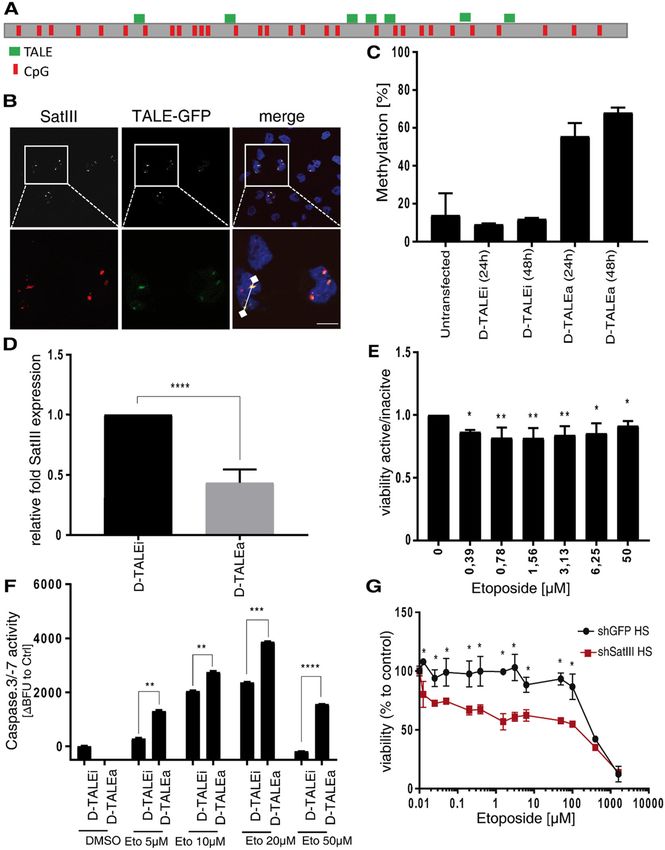
Kanne et al. Cell Death and Disease (2021)12:530                                                                Page 3 of 15

conserved and stored at − 80 °C for further analysis.           RNA immunoprecipitation
Chemosensitivity testing was performed as described               HeLa cells were subjected to three different treatment
before in male NMRI:nu/nu mice23. To this end, 6 mice           conditions: HS (1 h, 44 °C), HS with a 24 h recovery time
were randomly assigned to each control or treatment             at 37 °C, and non-HS conditions (constantly 37 °C). The
group. Treated to control (T/C) values of relative tumor        cells were fixed for 10 min with 1% formaldehyde (Carl
volume were used for the evaluation of the treatment.           Roth Inc) at RT followed by a 5 min blocking step with
Methylated immunoprecipitations followed by sequencing          glycine 125 µM. The harvested cells were lysed with
(MeDIP-Seq) analyses had been performed from 22 PDX             Farnham Lysis buffer (5 mM PIPES pH 8.0; 85 mM KCl;
tumors and normal lung tissues and made publicly avail-         0.5% NP-40, 100 U/ml SUPERase (Ambion, AM2694)) at
able in Grasse et al. 201822. This MeDIP-Seq data was used      4 °C. Chromatin was sheared by sonication (Bioruptur,
for methylation analyses of repetitive elements.                Diagenode) to a DNA fragment size of 200–600. RNA was
                                                                precipitated using an antibody against human TOP2A
Methylation analyses of repetitive elements                     (SigmaAldrich, #SAB4502998, RRID:AB_10753226) and
  For the genome-wide methylation analyses of repetitive        HSF1 (Santa Cruz Biotechnology, #sc-17757, RRID:
elements the RepEnrich2 tool was used24. Reads were             AB_627753). RNA was reversely crosslinked and purified
initially aligned to the unmasked genome using Bowtie225        using Trizol (SigmaAldrich) and RNA Micro purification
(RRID:SCR_005476) and divided into uniquely mapped              Kit (Zymo). After reverse transcription of the purified
and multi-mapped reads. Uniquely mapping reads were             RNA, enrichment of SatIII was determined with qPCR.
tested for overlap with repetitive elements, while multi-
mapped reads were separately aligned to repetitive ele-         Cell viability assay
ment assemblies identified with RepEnrich2 tool. The               Cell viability was measured using the AlamarBlue® Cell
repetitive element assemblies are represented by all            Viability Assay (Life Technologies, #DAL1025) according
genomic instances of an individual repetitive element           to the manufacturer’s recommendations. In brief, cells
subfamily. Further differential expression analyses were        were transfected with the referring oligos and cultured for
performed using EdgeR26 (R/Bioconductor). The region            24 h. Again 24 h later 10 µL of AlamarBlue® reagent was
displayed in Fig. 4B is the region that was assigned by the     added. Fluorescence intensities were measured 3 h after
RepEnrich2 tool for RNA-seq analyses. The region dis-           the addition of the reagent by Infinite 200 PRO Tecan
played shows a high enrichment of SatIII (which is              Microplate Reader (Tecan Germany GmbH).
recruited to its own genomic locus) upon HS.
  For visualization the bigwig files were converted to           Caspase 3/7 activity assay
bedgraph files that were used for visualization with R/            Apoptotic activity was determined using Amplite™
Bioconductor GViz package 27.                                   Fluorimetric Caspase 3/7 Assay Kit (AAT Bioquest,
                                                                #13503) following manufacturer’s instructions. In brief,
Chromatin immunoprecipitation                                   24 h before starting the assay, cells were transfected in a
  HeLa cells were exposed to 44 °C for 1 h and immediately      96-well frame with the plasmid constructs/siRNA of
fixed for 10 min with 1% formaldehyde (Carl Roth Inc) at         interest. The next day, caspase 3/7 assay loading solution
RT followed by 5 min blocking with 125 mM Glycine at            was prepared by adding 50 µl Caspase 3/7 Substrate
RT. Chromatin was extracted using the truChlP Chromatin         (Component A) into 10 ml Assay Buffer (Component B)
Shearing Kit (Covaris, #520154) according to the manu-          and mixing well. Then, 100 µl loading solution was
facturer´s instructions. The chromatin was sheared by           pipetted to the transfected cells and the plate was incu-
sonication to a DNA fragment size of 200–600 bp and             bated for at least 1 h at room temperature in the dark. The
precipitated using an antibody against human BRD4               plate was centrifuged at 800 rpm for 2 min. Fluorescence
(Bethyl Laboratories, A301-985A100, RRID:AB_2620184).           was measured either at 350 nm excitation and 450 nm
ChIPs were run on the IP-Star compact system using the          emission (for *Blue Fluorescence*) or at 490 nm excitation
Auto iDeal ChIP-seq kit for histones (Diagenode,                and 525 nm emission (for *Green Fluorescence*) in the
#C01010051) according to the manufacturer’s recommen-           plate reader Infinite 200 PRO.
dations for ChIP preparation. ChIP-DNA was sequenced
on a HiSeq4000, 50-bp single-end. Reads were mapped to          Cell cycle analyses
the hg19 genome using bwa-0.7.12 with default para-               To determine the cell cycle stage, the distribution of the
meters28. Peaks were called with MACS229 with the para-         total Hoechst intensity values acquired from quantitative
meters “bw 500 -mfold 2100 -broad broad-cutoff 0.1 –bdg”.       high-content screening microscopy data were measured.
For visualization the bigwig files were converted to bed-        Four thresholds were adjusted manually to gate cells in
graph files that were used for visualization with R/Bio-         2N (G0/G1), 2-4N (S), and 4N (G2/M) stages, respec-
conductor GViz package 30.                                      tively. Gates were applied to evaluate the mean number of

Official journal of the Cell Death Differentiation Association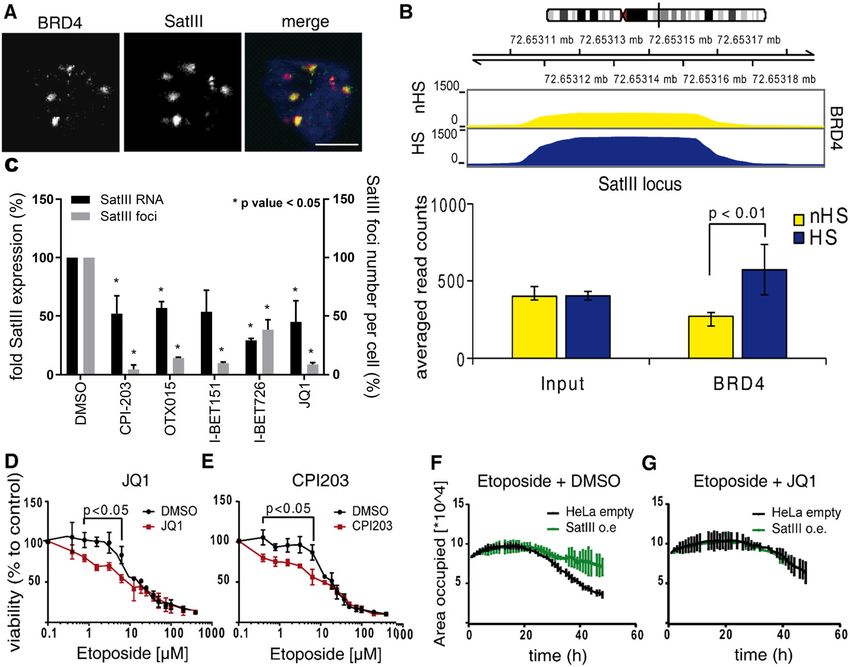
Kanne et al. Cell Death and Disease (2021)12:530                                                                Page 4 of 15

foci in cells of the respective cell cycle stage. Single-cell   Images were acquired using Zeiss software ZEN 2009 and
data were further processed and plotted using custom            processed using AxioVision software (Zeiss). Image analyses
R scripts.                                                      were performed using ImageJ31; (RRID: SCR_003070).

Cell proliferation assay                                        RNA Fluorescence in situ hybridization (FISH)
  Cells were treated with either DMSO (1%, SigmaAl-               For quantitative high-content screening microscopy
drich), etoposide (100 µM, Cayman chemical, CAS 33419-          analyses cells were fixed for 10 min with 1% For-
42-0), JQ1 (5 µM, Cayman chemical, 1268524-70-4), and           maldehyde (Carl Roth Inc.) at room temperature. After
CPI-203 (1 µM, BioCat, CAS 1446144-04-2) and imme-              washing twice with PBS cells were permeabilized with
diately incubated at 37 °C. Two pictures of each well were      70% ethanol at 4 °C overnight. For subsequent RNA
taken every 30 min for a total of 48 h by ImageXpress           smFISH stainings, cells were washed with Stellaris Wash
Micro4 (Molecular Devices). The pictures were analyzed          buffer A (BioSearch Technologies) for 5 min at room
using Cell Profiler software (Broad Institute, RRID:             temperature. Stellaris Hybridization Buffer (BioSearch
SCR_007358).                                                    Technologies) containing the RNA binding probe (1:500)
                                                                was added and the cells were incubated at 37 °C (without
Immunoblotting                                                  CO2) overnight. After an additional washing with Stellaris
  Cell lysates were obtained by cell lysis using Pierce lysis   Wash buffer A, nuclei were stained with Hoechst stain
buffer (25 mM Tris–HCl pH 7.4, 150 mM NaCl, 1 mM                33342 (1:1000 in Stellaris Wash buffer A) for 5 min. The
EDTA, 1% NP-40, and 5% glycerol) containing a protease          cells were washed with Stellaris Wash Buffer B for 5 min
inhibitor cocktail (Roche Diagnostics). The lysates were        at room temperature. Plates were stored in PBS at 4 °C
separated using SDS-PAGE and transferred onto nitrocellu-       until microscopy analyses. Sequences of the SatIII RNA
lose membranes. The membrane was blocked in 5% skim             binding probe are provided in Supplementary Table 1.
milk-TBST, incubated with primary antibodies: TOP2A
(SigmaAldrich #SAB4502998, RRID:AB_10753226, 1/1000),           FISH on formal fixed and paraffin embedded (FFPE) tissues
GAPDH (Invitrogen#AM4300, RRID: AB_2536381), washed               Each of the PDX tissues analyzed with FISH directly
three times (10 min each with TBST-0.1%Tween-20) and            corresponds to the samples analyzed in the former sec-
subsequently incubated with peroxidase-conjugated second-       tions (Fig. 1) and originates from Grasse et al. 201822.
ary antibodies. Chemiluminescence was performed using           FFPE tissues were cut with a microtome in order to
Clarity Western ECL Substrate (BioRad).                         acquire tissue slides with a thickness of 3 µm and
                                                                mounted onto a microscope slide. Deparaffinization was
Immunofluorescence staining and imaging                          performed by immersing the slide-mounted-tissue in
  For immunofluorescence experiments, cells were plated on       100% Xylene for 10 min. The slide was first immersed in
glass coverslips in 24-well plates and treated as described     100% EtOH twice (10 min), then in 95% EtOH (10 min),
above. Cells were washed with phosphate buffered saline         and then in 70% EtOH for 1 h to permeabilize the tissue
(PBS, Biochrom) and fixed with 1% formaldehyde (Carl Roth        section. After a washing step with PBS (5 min), the slide
Inc.) for 10 min. Afterwards, cells were washed with PBS and    was immersed in pre-warmed proteinase K solution
blocked with 0.5% bovine serum albumin (BSA, Sigma) in          (10 µg/mL, Enzo) and incubated at 37 °C for 20 min, fol-
PBS, containing 0.03% Triton X-100) for 1 h. Cells were         lowed by another washing step with PBS. Hybridization
incubated with the respective primary antibodies in 0.5%        was performed as described above. Analyses were per-
BSA/PBS overnight at 4 °C: BRD4 (Abcam, #ab75898 RRID:          formed using a confocal microscope (LSM 710, Zeiss) on
AB_1860650, 1/200), 53BP1 (Merck Millipore, #MAB3802,           an inverted stand (Axiovert 200 M, Zeiss) using objective
RRID:AB_2206767,        1/400),     TOP2A     (SigmaAldrich,    Plan-NEOFLUAR ×20/×40 1.3 oil DIC. Images were
#SAB4502998, RRID:AB_10753226, 1/250). Cells were then          acquired using Zeiss software ZEN 2009 and processed
incubated with secondary antibodies for 1 h at room tem-        using AxioVision software (Zeiss).
perature: goat anti-mouse Alexa Fluor 488, goat anti-rabbit
Alexa Fluor 488, goat anti-mouse Alexa Fluor 594 and goat       Quantitative high-content screening microscopy
anti-rabbit Alexa Fluor 594 (Molecular Probes, #A11029,           Plates were scanned using a Thermo Fisher Cellomics
RRID:AB_138404; #R37121, RRID:AB_2556549; #A11008,              ArrayScan XTI with LED light source and 2 × 2 binned
RRID:AB_143165; #A11037, RRID:AB_2534095; 1/1000).              images of 1104 × 1104 pixels were acquired with a ×20
Nuclei were stained with Hoechst stain 33342 (Sigma),           objective (Zeiss) and analyzed using the Cellomics soft-
samples were mounted with Fluoromount-G (Southern               ware package (Colocalization V.4 or SpotDetector V4.1
Biotech), and analyzed using a confocal microscope (LSM         Bioapplication). Cell nuclei were identified by Hoechst
710, Zeiss) on an inverted stand (Axiovert 200 M, Zeiss)        staining and according to the object identification para-
using objective Plan-NEOFLUAR ×20/×40 1.3 oil DIC.              meters size: 100–1200 μm2, ratio of perimeter squared to

Official journal of the Cell Death Differentiation Association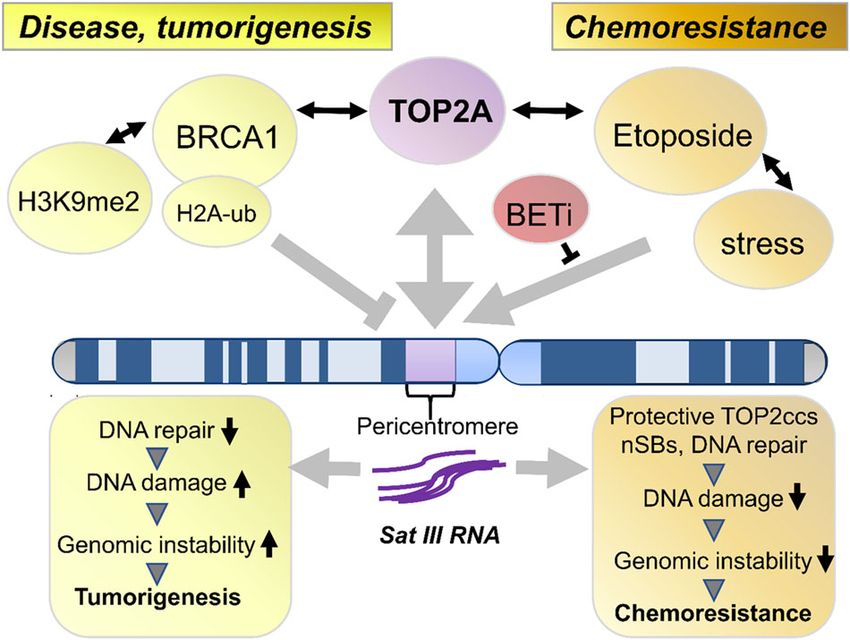
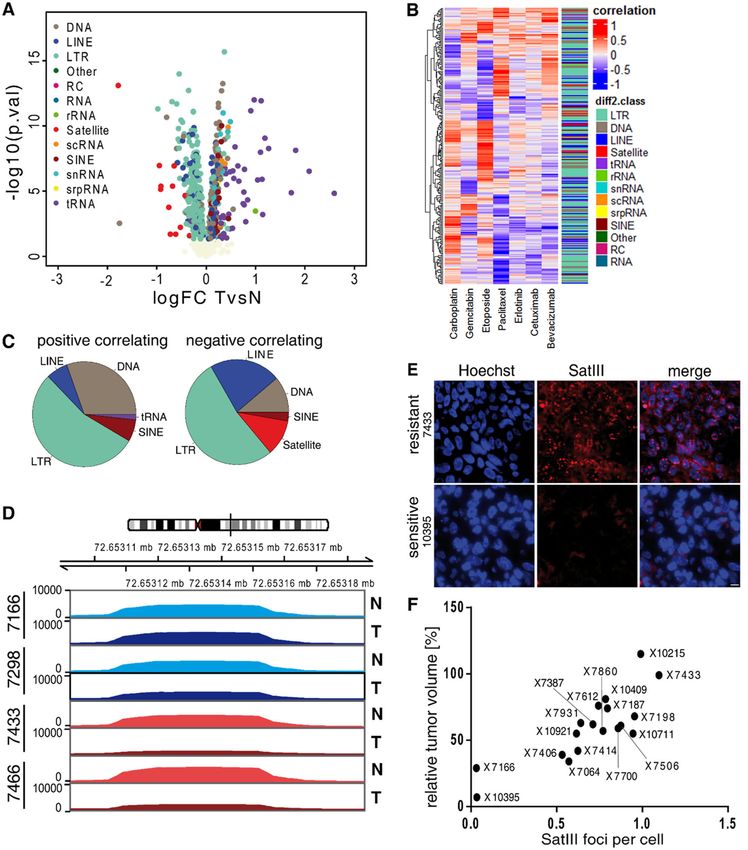
Kanne et al. Cell Death and Disease (2021)12:530                                                                                           Page 5 of 15

  Fig. 1 Hypomethylation of pericentromeric satellite repeats correlates with etoposide resistance in non-small cell lung cancer PDX mouse
  models. A Volcano plot shows the global methylation changes at repetitive elements between 22 patient-derived NSCLC xenograft tumor samples
  and their corresponding normal tissue (TvsN). Each dot represents one repetitive element, based on the RepeatMasker database, classified into
  subclasses (color code). The log fold change of methylation in tumor versus normal tissue is plotted on the x-axis, the y-axis shows the negative log
  10 of the p-value. B Heatmap shows the Pearson’s correlation between the sensitivity of the PDXs (measured by the differential methylation between
  tumor and normal tissues) with the chemotherapeutics indicated by the column name. The adjacent bar indicates the repetitive region class.
  C Composition of the significantly correlated (p-value < 0.05) repeats classes: positive (left) and negative (right) correlations between response to
  Etoposide and differential methylation. D Methylation levels of two etoposide sensitive PDXs (7166 and 7298; green) and two etoposide resistant PDX
  models (7433 and 7466; red) at the Satellite III DNA locus on chromosome 9. Lighter colors represent the coverage of normal tissue (N), darker colors
  show the coverage of tumor samples (T). E RNA FISH staining of Satellite III transcripts (SatIII RNA) in FFPE tumor material of untreated etoposide
  resistant (7433) and etoposide sensitive (10395) PDX mice. The tissue was stained with SatIII RNA FISH probes (red) as well as Hoechst stain 33342
  (blue). Scale bar, 10 µm. F Correlation of SatIII RNA foci and the relative tumor volume on native FFPE PDX tumor tissue. SatIII RNA foci were stained
  with SatIII RNA FISH, quantified, and set into relation to the response rate towards etoposide.

Official journal of the Cell Death Differentiation Association
Kanne et al. Cell Death and Disease (2021)12:530                                                                 Page 6 of 15

4π area: 1–3, length-to-width ratio: 1–3, average intensity:      Results
500–10,000, total intensity: 3 × 10⁵–3 × 10⁷. Nuclear             Hypomethylation of pericentromeric satellite repeats
stress bodies were identified within a circular region             correlates with etoposide sensitivity
extending the nucleus by maximally 20 μm. The object                 The hypomethylation of repetitive DNA is a frequent
identification parameters for nSB were: 0.5–20 μm2, the            and early event in tumor development, likely affecting
ratio of perimeter squared to 4π area: 1–3, length-to-            proliferation rates, therapy resistance, and early metas-
width ratio: 1–3, average intensity: 500–15000, total             tasis events. Because some lung tumors present with an
intensity: 5 × 10²–5 × 10⁴.                                       intrinsic therapy resistance without prior exposure to
                                                                  chemotherapies, we hypothesized that the methylation of
Quantitative RT-PCR                                               repetitive DNA is altered in cancer. Using therapy-
  The dsDNA-binding dye SYBR Green, which is inclu-               response data for seven chemotherapies from 22 NSCLC-
ded in the GoTaq qPCR Master Mix (Promega), was used              PDXs with available genome-wide DNA methylation data
to detect accumulating PCR fragments. Five ng of reverse          derived through methylated DNA immunoprecipitation
transcription cDNA were mixed with 300 nM primers and             and sequencing (MeDIP-Seq) of tumor and patient’s
×1 GoTaq qPCR Master Mix to a final reaction volume of             corresponding normal tissue22, we focused on the repe-
10 µl. Cycling parameters were used according to the              titive regions of the genome and calculated the differ-
manufacturer’s protocol. Sequences of qPCR primers are            ential methylation of 1116 repeating elements classified
provided in Supplementary Table 1.                                into 13 repeat classes by using the RepEnrich2 tool24.
                                                                  Global analysis revealed 690 significantly differentially
Pyrosequencing                                                    methylated repetitive regions in NSCLC-PDXs compared
  Bisulfite conversion and pyromark PCR were per-                  to the matching normal lung biopsies (Fig. 1A). The
formed with the EpiTect® Bisulfite Kit (QIAGEN) and                strongest hypomethylation was observed at satellite DNA
the Pyromark PCR kit (QIAGEN) according to the                    repeats followed by long terminal repeats (LTR), whereas
manufacturer’s recommendations. The Pyromark PCR                  the strongest hypermethylation was found in DNA
product was bound to sepharose beads on a 96-well plate           regions encoding tRNAs. Though hypomethylation of
utilizing the biotinylation of either forward or reverse          long interspersed nuclear elements (LINEs), in particular
primers. The bound PCR products were shaken on a                  of LINE-1, is a common characteristic of human cancers;
plate shaker for five minutes at room temperature. In the          we did not observe hypomethylation of LINEs (Fig. S1A).
meantime, 10 μM of sequencing primers were diluted in             By looking at the methylation patterns of LINE-1 sub-
annealing buffer and added onto a separate PSQ 96-well            classes, we discovered that the primate-specific LINEs
plate (Biotage). A vacuum filter station was used for              showed a pronounced and significant hypomethylation as
washing off the PCR product bound to the sepharose                previously shown in cancer32. The responsiveness to
beads. The filters were washed with water and then                 etoposide, paclitaxel, cetuximab, gemcitabine, carbopla-
immersed into the DNA solution on the first 96-well                tin, and bevacizumab was examined by measuring the
plate. The filters were immersed into 70% ethanol, 0.2 M           relative tumor volume as described by Grasse et al.22.
NaOH, and washing buffer containing 10 mM tris-                   Using the dose–response data of the 22 NSCLC-PDXs
acetate (pH 7.6). The vacuum was turned off and the               along with the differential methylation pattern of tumor
filters were placed into the PSQ 96-well plate containing          tissues, we calculated the correlation between the relative
the diluted sequencing primers. The plates were then              tumor volume after treatment with these chemother-
placed on a heating block for 2 min at 85 °C. The pyr-            apeutics and the corresponding methylation values for
osequencing reaction was performed in a PSQ HS                    each PDX. We found 265 significantly correlating repeats
96ATwo Pyrosequencer and analyzed using PSQ HS 96A                for at least one chemotherapeutic drug (Fig. 1B, Fig. S1B).
software (Biotage). The sequence of the Pyromark PCR              The most significantly correlating repeats were detected
and pyrosequencing primer are provided in Supple-                 for etoposide (95 repeats), in which LTR, LINE, and
mentary Table 1.                                                  satellite DNAs were differentially methylated32. Inter-
                                                                  estingly, a hypomethylation of the SatIII locus correlated
Statistics                                                        with an etoposide resistant phenotype. This was reflected
  Statistical analyses were performed using the GraphPad          by a negative Pearson correlation coefficient (Fig. 1C).
Prism 7 software package (GraphPad Software, RRID:                The transcription of pericentromeric SatIII repeats upon
SCR_002798). The type of statistical analyses, parameters,        HS is highly asymmetrical and most of the transcripts
and number of replicates are indicated in the figure               contain the G-rich strand of the repeat which are con-
legends. For all tests, p value significance was defined as         stantly associated with nSBs. Opposing to this, com-
follows: not significant (n.s.) p > 0.05; *p < 0.05; **p < 0.01;   plementary C-rich transcripts are only modestly
***p < 0.001.                                                     increased after stress8. Thus, subsequent bioinformatics

Official journal of the Cell Death Differentiation Association
Kanne et al. Cell Death and Disease (2021)12:530 Page 7 of 15
analyses focused on the G-rich (GAATG) repeats. Along fused to a GFP-tag and subjected to HS conditions (1 h at
with GSATII, LSAU, and (CATTC)n repeats (Fig. S1C), 44 °C). These conditions were chosen based on pre-
we found the (GAATG)n repeats (SatIII) to be one of the liminary experiments and previous results by Hussong
most significantly negatively correlating repeats between et al. that had determined these conditions to be sufficient
methylation levels in tumor tissue and etoposide sensi- to strongly induce SatIII expression and nSB formation13.
tivity (Figs. S1D, E). We calculated the methylation levels In parallel, cells were stained with a SatIII smFISH.
of the SatIII DNA locus on chromosome 9 and visualized Microscopy analyses revealed co-localization of the TALE
them in two of the most resistant and two of the most constructs and the SatIII RNA FISH foci (Fig. 2B;
sensitive PDXs (Fig. 1D). We found nearly no changes in Fig. S2B). To confirm our hypothesis that artificial
methylation levels in etoposide sensitive PDX tumors methylation of the SatIII locus results in a decreased
versus the corresponding normal tissue, whereas the SatIII expression and an increased etoposide sensitivity,
resistant PDX tumors showed strong hypomethylation in we screened cell lines for their baseline methylation
comparison to the normal tissue. level. Whereas HeLa cells were found to carry 18%
Based on the strong hypomethylation of the SatIII methylation at the targeted SatIII locus, U2OS cells and
region in etoposide resistant tumors we hypothesized that HEK293T cells, which are used as an alternate HS model,
there is a correlation between SatIII RNA expression and had approximately 5% methylation at the SatIII locus,
the resistance towards etoposide. Thus, we used single providing increased capacities for artificial methylation
molecule RNA FISH against SatIII RNA and found a high (Fig. S2C). Therefore, we chose to use U2OS and
number of SatIII foci in tissues originating from HEK293T cells to intensify the methylation capacity of
etoposide-resistant PDX tumors (Fig. 1E, F). Vice versa, a the D-TALEs. To exclude toxic effects originating from
low number of SatIII foci was observed in etoposide- variable transfection efficiencies, we performed cytometer
sensitive PDX tumors. Furthermore, using the publicly assays, acquiring information on the percentage of
available RNA expression dataset from Klijn et al.21, we transfected cells and determining the viability of these
analyzed the relationship between SatIII RNA expression cells with DAPI staining of the cells prior to the mea-
and the sensitivity to etoposide in different non-metastatic surement. Transfection efficiencies were constantly
NSCLC cell lines. We used the IC50 sensitivity data from around 80%, and in the same range was the percentage of
the Cancerrxgene database for erlotinib, gemcitabine, living cells on the whole population. This applied for both
etoposide, cetuximab, paclitaxel, and cisplatin to correlate control (DNMT inactive) and DNMT- active settings
the expression with chemosensitivity towards specific (Fig. S2E, F). The methylation level of the SatIII locus
chemotherapeutic drugs. Similar to what we observed increased 4-fold 24 h after transfection with the active D-
for our PDX models, we found a positive correlation TALE (D-TALEa) construct and 5-fold after 48 h, com-
between etoposide response and SatIII RNA expression in pared to an identical TALE construct bearing a E756A
the tested NSCLC cancer cell lines (data not shown), mutation in the DNMT3a domain that renders this
further supporting a role of SatIII expression in etoposide construct catalytically inactive (Fig. 2C)38. The methyla-
resistance. tion levels at LINE1 elements were used as control for
methylation specificity. Since we were unable to detect
Hypermethylation of the SatIII DNA locus diminishes SatIII any change in cytosine methylation in cells transfected
RNA expression and increases etoposide sensitivity with either the active or the inactive D-TALE, we con-
We reasoned that a reversion of the hypomethylation firmed a locus-specific hypermethylation of the SatIII
should decrease SatIII expression and alleviate etoposide locus (Fig. S2D). Along with increased locus methylation,
resistance. To address this, we used transcription- D-TALE transfected cells showed a decreased expression
activator-like effectors (TALEs), DNA binding domains of SatIII compared to the inactive control plasmid
originally derived from Xanthomonas bacteria which (Fig. 2D). Further on, we compared the drug response of
contain a modular domain of repeats that each recognize U2OS cells transfected either with the active or the
one nucleobase via a repeat variable di-residue (RVD), inactive D-TALE plasmid. Viabilities of the former cells
and can be programmed to bind user-defined DNA displayed a moderate and significantly enhanced sensi-
sequences33. We designed TALEs fused to a DNMT3a3L tivity towards etoposide compared to the inactive control
(D-TALE) construct for specific binding to the SatIII (Fig. 2E). Etoposide treatment causes DSBs and ultimately
DNA locus (Fig. 2A, Fig. S2A)34. This enabled targeted triggers apoptotic pathways which are either TP53
methylation of the SatIII DNA locus. Immunostaining dependent or independent39. Cells transfected with D-
was used to verify the correct localization of the TALE at TALEa displayed an enhanced Caspase-3/-7 activity after
the desired locus35,36. HeLa cells, which are the main etoposide treatment compared to the inactive control,
model system used for studies on nSBs and the heat stress which reflects an increased apoptotic activity in the cells
response37, were transfected with the TALE construct transfected with the D-TALEa (Fig. 2F).
Official journal of the Cell Death Differentiation AssociationKanne et al. Cell Death and Disease (2021)12:530 Page 8 of 15 Fig. 2 (See legend on next page.) Knockdown of SatIII RNA sensitizes cells towards with either a siRNA targeting SatIII RNA transcript or a etoposide non-targeting control siRNA. Along with the decreased To gather further evidence that not only methylation but expression and foci formation of SatIII RNA after SatIII the actually altered expression of SatIII (and subsequent knockdown in response to etoposide treatment, the siRNA changes in the recruitment to nSBs) affected the respon- SatIII-treated cells showed significantly reduced cell via- siveness to etoposide, we transfected post-HS HeLa cells bility (Fig. S3A, C, D, E). In order to validate these findings, Official journal of the Cell Death Differentiation Association
Kanne et al. Cell Death and Disease (2021)12:530                                                                                              Page 9 of 15

  (see figure on previous page)
  Fig. 2 Hypermethylation of the SatIII DNA locus by D-TALES diminishes SatIII RNA expression and increases sensitivity towards etoposide.
  A Schematic representation of SatIII DNA locus with all CpG localizations (red) as well as the TALE-binding sites (green). B Representative images of
  the co-localization of TALE-GFP (green) and SatIII RNA (red). HeLa cells were transfected with the TALE-GFP construct and exposed to HS conditions
  (1 h at 44 °C) 24 h after transfection in order to induce SatIII RNA expression and foci accumulation. Cells were fixed, immunostained, and imaged. The
  histogram indicates co-localizations, represented by overlapping peaks of fluorescence intensities. C Methylation level of the SatIII DNA locus in D-
  TALEa (active) and D-TALEi (inactive vector control) transfected U2OS cells. At 24 h and 48 h post-transfection U2OS cells were exposed to 44 °C for
  1 h (HS) conditions and harvested. Cells were FACS-sorted and mCherry positive cells used for DNA extraction and subsequent pyrosequencing of
  the SatIII DNA locus. Shown is the percent of methylation to a transfection control. D Quantitative PCR analyses for SatIII RNA expression of samples
  from (C). Samples incubated for 48 h with the transfection mix were used. Error bars represent standard deviation of the mean of two individual
  replicates. E Drug response of U2OS cells either transfected with D-TALEa or an inactive control plasmid (D-TALEi). Viabilities were examined by
  AlamarBlue. Error bars represent standard deviation of the mean of three replicates. Two-tailed paired Student’s t test significant P-values are marked:
  < 0.05 with (*), < 0.01 with (**), < 0.001 with (***). F Caspase-3/-7 assay of U2OS cells either transfected with the D-TALEa plasmid or an inactive
  control (D-TALEi). At 24 h post-transfection, cells were treated with different concentrations of etoposide or a DMSO control for 24 h. Depicted are the
  differences of blue fluorescence (BFU) signals between D-TALEa and D-TALEi. Error bars represent standard deviation of the mean of the three
  replicates. Two-tailed paired Student’s t-test significant P-values are marked: < 0.05 with (*), < 0.01 with (**), < 0.001 with (***). G Cell viability of
  HCC827 cells stably expressing either shRNA which targets SatIII (shSatIII, blue) or a shGFP-Control (red). Cells were exposed to 44 °C for 1 h (HS) and
  afterwards immediately treated with the indicated etoposide concentrations. After an additional 48 h cell viability was measured using AlamarBlue.

we performed a knockdown of SatIII using antisense-                             immunofluorescence experiments in HeLa and U2OS
oligos targeting SatIII (ASO-SatIII) (Fig. S4A–C). Trans-                       cells under HS conditions (1 h at 44 °C). Cells were fixed
fection with ASO-SatIII led to a higher sensitivity towards                     either immediately after 1 h at 44 °C or after 24 h recovery
etoposide compared to a non-targeting control, which was                        at 37 °C and subsequently stained with SatIII smFISH
observed both in an AlamarBlue cell viability assay and a                       probes and a TOP2A antibody. Though the co-
microscopy-based proliferation assay (Figs. S4D-F). An                          localization of TOP2A and SatIII RNA was not
even stronger effect of SatIII expression on etoposide                          observed immediately after HS, recovery at 37 °C for 24 h
treatment response was observed in NSCLC HCC827 cells                           led to a co-localization of both components in nearly 50%
upon a stable shRNA mediated SatIII repression (Figs. 2G                        of all SatIII foci containing cells, with an even increased
and S5C). HCC827 cells were selected as a model serving                         number of foci under etoposide treatment (Fig. 3A, Fig.
as an etoposide resistant cell line (Fig. S5A), illustrated by a                S6A). This accumulation of TOP2A at sites of SatIII foci
considerably higher IC50 compared to H2030, an etopo-                           was dependent on SatIII expression, as a knockdown of
side sensitive NSCLC cell line (Fig. S5B). In contrast to the                   SatIII abolished all SatIII foci and all TOP2A accumula-
effects observed for SatIII repression, transient over-                         tion sites (Fig. 3B). Interestingly, western blot experiments
expression of the SatIII transcripts resulted in increased                      revealed no effect of siRNA mediated SatIII knockdown
cell viability compared to the control (Fig. S3B, D). These                     on TOP2A expression (Fig. S6B). Similar to TOP2A
effects were generally intensified at lower etoposide con-                       expression patterns43,44, SatIII foci induction was mainly
centrations, strongly suggesting that cell death effects at                     induced during late S-, and peaked in G2/M phase (Fig.
higher concentrations overrule SatIII functions.                                3C). The expressions of SatIII and TOP2A, therefore,
                                                                                occur in the same phase of the cell cycle.
SatIII recruits TOP2A to nSB foci and protects cells from                         In order to study the downstream effects of varying
DNA double strand breaks                                                        SatIII expression levels on the complex formation of DNA,
  Etoposide forms a ternary complex with DNA and                                TOP2A, and etoposide; we stained the DNA damage
TOP2A during DNA replication. This prevents re-ligation                         reporter protein p53 binding protein 1 (53BP1). HeLa cells
of the DNA strands, leading to DSB and the induction of                         were transfected with either siRNAs targeting SatIII or a
the DNA damage response40. TOP2A consistently                                   non-targeting control. HS conditions (1 h at 44 °C) were
reaches peak expression during the G2/M phase of the cell                       applied before treatment with etoposide or DMSO as
cycle, associates with replication forks, and remains                           control. We found that 53BP1 co-localized with SatIII (Fig.
tightly bound to chromosomes during mitosis. Experi-                            S7A) which was also observed for gamma-H2AX as an
ments in Drosophila melanogaster have revealed that                             additional DNA damage reporter (Fig. S7B). Staining
SatIII repeats harbor several TOP2A cleavage sites41 and                        quantification uncovered increased DNA damage when
that the displacement of HP1 and TOP2A with synthetic                           SatIII RNA expression was decreased (Fig. 3D; Fig. S7C).
polyamides from the SatIII DNA locus results in chro-                           This was also true for HCC827 cells stably expressing
matin opening and de-silencing of the nearby transcrip-                         shSatIII RNA (Fig. S7D). On the other hand, a transient
tion sites42. Thus, to investigate whether TOP2A is                             overexpression of SatIII showed a significant decrease in
changing its cellular localization we performed                                 53BP1 foci per cell (Fig. S7E).

Official journal of the Cell Death Differentiation Association
Kanne et al. Cell Death and Disease (2021)12:530 Page 10 of 15 Fig. 3 (See legend on next page.) To further understand the interplay between SatIII and TOP2A and HSF1. Non-heat stressed cells did not show any TOP2A, we performed an RNA immunoprecipitation binding between SatIII and HSF1 or TOP2A, whereas heat- experiment. HeLa cells were subjected to three different stressed cells showed an enrichment of SatIII at HSF1 and treatment conditions: HS (1 h, 44 °C), HS with a 24 h TOP2A after recovery (Fig. 3E). As a downstream effect we recovery time at 37 °C, and non-HS conditions (constant found that knockdown of SatIII caused a significant increase 37 °C). RNA was precipitated using antibodies against in caspase-3/-7 activity upon etoposide treatment (Fig. 3F). Official journal of the Cell Death Differentiation Association
Kanne et al. Cell Death and Disease (2021)12:530                                                                                                  Page 11 of 15

  (see figure on previous page)
  Fig. 3 SatIII recruits TOP2A to nSB foci thereby protecting cells from DNA double strand breaks. A Representative images of the SatIII RNA and
  TOP2A co-localization in HeLa cells exposed to HS conditions (1 h at 44 °C) or HS plus 24 h recovery at 37 °C and DMSO or etoposide 10 µM
  treatment. SatIII RNA was stained using smFISH (red), TOP2A was stained using a protein-specific antibody (green). Scale bar, 10 µm. B Quantification
  of (A) by counting the number of foci per cell. Quantification was performed using an automated ImageJ pipeline, n = 5. C Cell cycle assay utilizing
  Hoechst staining was performed to clarify SatIII expression patterns during the cell cycle. HeLa cells were subjected to HS (1 h at 44 °C) or control
  conditions, fixed and stained with Hoechst staining dye. The cells were monitored over the course of the cell cycle in an automated HCS microscope.
  A minimum of 3000 cells, separated in n = 6 replicates, were quantified for each condition. D Effects of SatIII RNA knockdown on DNA damage was
  investigated by immunofluorescence staining for 53BP1. HeLa cells were transfected with siSatIII and scramble RNA (control), respectively. Cells were
  then exposed to HS conditions (1 h at 44 °C) or constant 37 °C and treated with 20 µM etoposide or DMSO. After 24 h, cells were fixed and stained
  with a protein-specific 53BP1antibody (green). Counterstaining of nuclei was performed with Hoechst stain. Imaging and analyses were performed
  utilizing HCS microscope-based quantifications of the staining. Error bars represent the standard deviation of the mean of three replicates. Two-tailed
  paired Student’s t test significant P-values are marked: < 0.05 with (*), < 0.01 with (**), < 0.001 with (***). Scale bar, 10 µm. E RNA immunoprecipitation
  in HeLa cells subjected to three different treatment conditions: HS (1 h at 44 °C), HS with a 24 h recovery time at 37 °C (HS + rec), and non-HS
  conditions (nHS, 37 °C). Chromatin was sheared by sonication and precipitated using an antibody against human TOP2A or HSF1. Binding to SatIII
  was analyzed using qPCR. HSF1 was used as a positive control. Figure shows a typical result for two biological replicates, each with three technical
  replicates. F Caspase-3/-7 assay of HeLa cells either transfected with the siRNA targeting SatIII (siSatIII) or control siRNA (siCo). After transfection, cells
  were treated as indicated with etoposide or a DMSO control. Error bars represent standard deviation of the mean of three replicates. Two-tailed
  paired Student’s t-test significant P-values are marked: < 0.05 with (*), < 0.01 with (**), < 0.001 with (***).

BET inhibitors re-sensitize etoposide-resistant cells                              etoposide treatment. Further validation was provided in
through SatIII down-regulation                                                     a proliferation assay in NSCLC lung cancer cell lines
   Next, we searched for a compound to reduce SatIII                               where HCC827 was the etoposide resistant and H2030
RNA expression and revert etoposide resistance. We                                 the etoposide sensitive cell line. Knocking down SatIII in
tested if disrupting BRD4 binding to chromatin with                                HCC827 cells led to a decreased survival under etopo-
small molecules results in an increase in etoposide sen-                           side treatment in comparison to a shGFP control. The
sitivity. BRD4 co-localized with SatIII RNA at nSBs (Fig.                          opposite effect was observed for H2030 cells stably
4A) and displayed a specific increased binding to the                               overexpressing SatIII (Fig. S8F, G).
SatIII DNA locus at chromosome 9 with ChIP-Seq
analysis (Fig. 4B). Furthermore, a significant decrease of                          Discussion
SatIII RNA expression under BRD4 inhibition was                                      In this study we report that SatIII RNA induces eto-
revealed by qPCR and quantitative high-content micro-                              poside resistance in lung cancer. We demonstrate that the
scopy showed a significant reduction of SatIII foci                                 recruitment of TOP2A through SatIII to nSBs is asso-
numbers (Fig. 4C, Fig. S8A). To examine whether the                                ciated with a reduction in 53BP1 formation, ultimately
effect of BRD4 inhibition on SatIII expression also                                promoting decreased apoptosis activation and increased
impacts the response towards etoposide, we performed                               cell survival. We propose a model in which TOP2A and
cell viability assays and added the BRD4 inhibitor JQ1 in                          SatIII RNA form protective complexes that are either
combination with etoposide. Similar to siRNA silencing,                            inaccessible to downstream DNA damage response acti-
the inhibition of SatIII expression by JQ1 caused a higher                         vation or lead to a local accumulation of TOP2ccs in
sensitivity towards etoposide compared to the DMSO                                 distinct DNA regions accompanied by an overall reduc-
control (Fig. 4D). The same effect was observed for                                tion of TOP2ccs in other DNA regions. Both models
treatment with CPI203, another small molecule inhibitor                            support that SatIII functions as a “sponge” by capturing
of BRD4 (Fig. 4E). Vice versa, stable overexpression of                            TOPccs and protecting cells from the initiation of DNA
SatIII resulted in substantially better cell survival under                        damage response pathways (Fig. 5). TOP2 chromatin
etoposide treatment (Fig. S8B). In this assay, cell pro-                           localization and its trapping in stable TOP2cc has been
liferation was traced by means of confluency (area                                  found to occur independently from transcription such
occupied) measurements. Visual inspection showed                                   that the recruitment of TOP2A to nSBs through SatIII
neither increase in cell size nor a major impact on cell                           seems not to be a consequence of the active transcrip-
morphology. This confirmed our previous observations                                tional process during HS45. Though Satellite RNA
of improved cell proliferation of SatIII overexpressing                            expression has been described as increased in a broad
cells compared to an empty control upon etoposide                                  range of cancer entities6,14, its functional role remains
treatment (Fig. 4F). This effect was reverted when we                              unclear. As a possible explanation for the increased SatIII
applied a combination treatment of etoposide and the                               expression in tumors, Zhu et al. investigated BRCA1
BRD4 inhibitor JQ1 or CPI203. (Fig. 4G, Fig. S8C-E). We                            deficiency and found a decrease of ubiquitin-histone H2A
concluded that BRD4 inhibition re-sensitizes cells for                             at satellite repeats and a diminished heterochromatin

Official journal of the Cell Death Differentiation Association
Kanne et al. Cell Death and Disease (2021)12:530                                                                                            Page 12 of 15

  Fig. 4 BET protein inhibitors revert etoposide resistance through SatIII regulation. A Representative images of co-localization of SatIII RNA and
  BRD4 after exposure to HS conditions (1 h at 44 °C). Immediately following HS, cells were fixed, immunostained, and imaged. SatIII was stained with
  smFISH (red), BRD4 with a protein-specific antibody (green). Scale bar, 10 µm. B Binding of BRD4 to the SatIII DNA locus after HS (1 h at 44 °C). For the
  ChIP-Seq experiment cells were subjected to HS or control conditions. ChIP was performed with a BRD4-specific antibody. C Effect of BRD4 inhibition
  on SatIII expression. HeLa cells were treated with various BRD4 inhibitors and exposed to HS conditions (1 h at 44 °C). Two read-out methods were
  applied: RNA expression was measured by qPCR and RNA FISH was used to quantify SatIII RNA foci. Values of non-treated cells (DMSO control) were
  set to 100%. Error bars represent SD of the mean of n = 2 independent replicates. P-values < 0.05 marked with (*). Significance was determined using
  two-tailed paired Student’s t-test. D Cell viability of HeLa cells treated with etoposide and the BRD4 inhibitor JQ1 (1 µM) or DMSO as control. Directly
  after exposure to HS (1 h at 44 °C), cells were treated with the indicated etoposide concentrations in combination with JQ1. After an additional 48 h,
  cell viabilities were measured using AlamarBlue. Error bars represent SD of the mean of n = 2 replicates. P-values
Kanne et al. Cell Death and Disease (2021)12:530                                                                                                      Page 13 of 15

                                                                                  Acknowledgements
                                                                                  We thank the CECAD Imaging Facility and staff members for their support in
                                                                                  microscopy and Elena Wasserburger for technical assistance. We thank N.C.
                                                                                  Øien for revising and editing the manuscript.

                                                                                  Author details
                                                                                  1
                                                                                   Institute for Translational Epigenetics, University Hospital of Cologne, Faculty
                                                                                  of Medicine, University of Cologne, Cologne, Germany. 2Center for Molecular
                                                                                  Medicine Cologne, University of Cologne, Cologne, Germany. 3Translational
                                                                                  Pain Research, Department of Anaesthesiology and Intensive Care Medicine,
                                                                                  University Hospital Cologne, Faculty of Medicine, University Cologne, Cologne,
                                                                                  Germany. 4Faculty of Chemistry and Chemical Biology, TU Dortmund
                                                                                  University, Dortmund, Germany. 5Rheinische Fachhochschule Cologne,
                                                                                  Cologne, Germany. 6Department I of Internal Medicine, University Hospital
                                                                                  Cologne, Medical Faculty, Cologne, Germany. 7Institute of Pathology,
                                                                                  University Hospital of Cologne, Medical Faculty, Cologne, Germany.
                                                                                  8
                                                                                   Department of Hematology and Stem Cell Transplantation, University Hospital
                                                                                  Essen, University Duisburg-Essen, German Cancer Consortium (DKTK partner
                                                                                  site Essen), Essen, Germany. 9Center of Integrated Oncology Cologne-Bonn,
                                                                                  Medical Faculty, University of Cologne, Cologne, Germany
  Fig. 5 Model of SatIII regulation in tumorigenesis and
  chemoresistance. Loss of BRCA1 results in an increased SatIII RNA               Author contributions
  expression through reduced ubiquitination of H2A and a relaxation of            J.K., M.H., and M.R.S. designed the study and coordinated experiments and data
  pericentromeric heterochromatin, reflected by a loss of H3K9me2 (left            analysis; J.K., M.H., J.I., A.M., J.W., F.H., C.G., S.B., L.M., and J.W. performed the
  side, Zhu et al., 2018, Padeken et al.). SatIII RNA interacts with the BRCA1-   experiments; J.I. and T.H. performed high content microscopies; A.M., J.W. and
  associated protein network and destabilizes replication forks which in          D.S. designed and tested the TALEs; J.K., M.H., J.I., A.M., M.O., T.H., R.B., D.S., and
  turn enhances DNA damage and genomic instability, ultimately                    M.R.S. analyzed the data; H.C.R., M.O., R.B. collected specimens and clinical data;
                                                                                  J.K., M.H., J.I. performed bioinformatics analyses; J.K., M.H. and M.R.S. wrote the
  promoting tumor growth. Etoposide also drives SatIII expression, but in
                                                                                  manuscript with comments from all authors; C.G., M.O., T.H., R.B., D.S., and M.R.S.
  this case, SatIII RNA facilitates the recruitment of TOP2A to TOP2ccs
                                                                                  supervised analyses and experiments.
  located at nSBs (our data). This leads to less DNA damage and
  subsequent downstream mechanisms that decrease genomic instability
                                                                                  Funding
  and therefore cells are more resistant against etoposide.
                                                                                  This work was funded through the Volkswagenstiftung (Lichtenberg
                                                                                  Professorship to M.R.S.), the Deutsche Forschungsgemeinschaft (KFO-286-RP8
                                                                                  and RP2 to H.C.R. and M.R.S., SFB-1399-B03 to M.R.S. and A01/C02 to H.C.R.), the
repair49–51. By affecting TOP2 localization SatIII directly                       Center for Molecular Medicine Cologne (CMMC-A10 to M.R.S., R.B. and M.O.),
affects TOP2 functionality, and functions alongside other                         the German-Israeli Foundation for Research and Development (I-65-412.20-
                                                                                  2016 to H.C.R.), the Else Kröner-Fresenius Stiftung (EKFS-2014-A06 to H.C.R.,
resistance mechanisms.
                                                                                  2016_Kolleg.19 to H.C.R.), the Deutsche Krebshilfe (1117240 and 70113041 to
  The clinical use of etoposide in cancer treatment is not                        H.C.R.), the Federal German Ministry of Science and Education (BMBF e:Med
restricted to lung cancer, but includes a large variety of                        01ZX1303A to H.C.R. and SMOOSE to R.B.), North Rhine-Westfalia Ministry of
                                                                                  Innovation and Sciences (PerMed network to R.B.) and the European Research
other cancer entities, i.e. Hodgkin and non-Hodgkin
                                                                                  Concil (ERC CoG “EPICODE”, Grant No. 723863 to D.S). Open Access funding
lymphoma, testicular cancer, Ewing’s sarcoma, and oth-                            enabled and organized by Projekt DEAL.
ers. A correlation of SatIII expression with therapy
resistance data in these tumors will be a promising and                           Ethics statement
intriguing approach in determining potential roles of                             PDX data in this study were derived from Grasse et al.22. The establishment of
                                                                                  these PDX models from NSCLC patients was approved (EA3/001/06) by the
satellite RNAs in therapy resistance. A combination                               local ethical review committee (Charité Berlin). Written informed consent to
treatment of etoposide and BRD4 inhibitors reversed the                           participate in the study was obtained from all patients. The use of clinical data
resistance phenotype in vitro, making this approach a                             and patient’s material was approved by the institutional review board of the
                                                                                  ELK Berlin Chest Hospital. All mice used in the study were handled in
powerful candidate for clinical application52. It cannot be                       accordance with the Guidelines for the Welfare and Use of Animals in Cancer
excluded that the inhibitory effect of BRD inhibition is                          Research53. Their use was approved by the local responsible authorities
also partly due to a general effect on gene expression.                           (approval no. G 0030/15), according to the German Animal Protection Law.

However, several findings speak against a more global
effect: We found (i) a co-localization of BRD4 and SatIII                         Competing interests
                                                                                  H.C.R. received consulting and lecture fees from Abbvie, Astra-Zeneca, Vertex,
upon stress, (ii) repression of SatIII RNA expression and                         and Merck. H.C.R. received research funding from Gilead Pharmaceuticals. H.C.
foci formation upon multiple other BRD4 inhibitors as                             R. is a co-founder of CDL Therapeutics GmbH. No potential conflicts of interest
well as upon a siRNA based BRD4 knockdown, and (iii)                              were disclosed by the other authors.

an induction of resistance upon expression of SatIII.
Further work is needed to provide additional options for                          Publisher’s note
co-treatments or to develop specific inhibitors of SatIII                          Springer Nature remains neutral with regard to jurisdictional claims in
                                                                                  published maps and institutional affiliations.
RNA that overcome therapy resistance in cancer patients
by intervening with heterochromatin formation at the                              Supplementary information The online version contains supplementary
SatIII locus.                                                                     material available at https://doi.org/10.1038/s41419-021-03810-9.

Official journal of the Cell Death Differentiation Association
You can also read