Mass spectrometry imaging identifies abnormally elevated brain l-DOPA levels and extrastriatal monoaminergic dysregulation in l-DOPA-induced ...
←
→
Page content transcription
If your browser does not render page correctly, please read the page content below
SCIENCE ADVANCES | RESEARCH ARTICLE
NEUROSCIENCE Copyright © 2021
The Authors, some
Mass spectrometry imaging identifies abnormally rights reserved;
exclusive licensee
elevated brain l-DOPA levels and extrastriatal American Association
for the Advancement
monoaminergic dysregulation in of Science. No claim to
original U.S. Government
l-DOPA–induced dyskinesia Works. Distributed
under a Creative
Commons Attribution
Elva Fridjonsdottir1, Reza Shariatgorji1,2, Anna Nilsson1,2, Theodosia Vallianatou1, Luke R. Odell3, NonCommercial
Luke S. Schembri1,2, Per Svenningsson4, Pierre-Olivier Fernagut5,6,7, Alan R. Crossman8, License 4.0 (CC BY-NC).
Erwan Bezard5,6,9*, Per E. Andrén1,2*
l-DOPA treatment for Parkinson’s disease frequently leads to dyskinesias, the pathophysiology of which is poorly
understood. We used MALDI-MSI to map the distribution of l-DOPA and monoaminergic pathways in brains of
dyskinetic and nondyskinetic primates. We report elevated levels of l-DOPA, and its metabolite 3-O-methyldopa, in
all measured brain regions of dyskinetic animals and increases in dopamine and metabolites in all regions analyzed
Downloaded from http://advances.sciencemag.org/ on February 11, 2021
except the striatum. In dyskinesia, dopamine levels correlated well with l-DOPA levels in extrastriatal regions,
such as hippocampus, amygdala, bed nucleus of the stria terminalis, and cortical areas, but not in the striatum.
Our results demonstrate that l-DOPA–induced dyskinesia is linked to a dysregulation of l-DOPA metabolism
throughout the brain. The inability of extrastriatal brain areas to regulate the formation of dopamine during l-DOPA
treatment introduces the potential of dopamine or even l-DOPA itself to modulate neuronal signaling widely
across the brain, resulting in unwanted side effects.
INTRODUCTION tion leading to abnormal basal ganglia output, resulting in hyper-
Since its introduction for the treatment of Parkinson’s disease (PD), kinetic movements or dyskinesia (4).
l-3,4-dihydroxyphenylalanine (l-DOPA) remains the most effective Several lines of evidence suggest that LID is associated not only
therapy for alleviating parkinsonian symptoms. The therapeutic with striatal fluctuation in DA but also with widespread dysregula-
effects of l-DOPA are assumed to rely upon its conversion into tion of monoaminergic system homeostasis, involving both motor
dopamine (DA) following decarboxylation by the enzyme aromatic and nonmotor circuits within and outside the basal ganglia (9, 10).
l-amino acid decarboxylase (AADC). Although highly effective in Such changes may occur when l-DOPA is taken up by nondopami-
the early stages of PD, long-term treatment leads to abnormal invol- nergic neurons containing AADC and converted to DA, which
untary movements or l-DOPA–induced dyskinesia (LID) that affects may, in turn, affect the synaptic concentration and signaling of other
10% of patients per year of treatment (1). LID represents the most neurotransmitters (11). Besides contributing to LID, such alteration
debilitating motor side effect of DA replacement therapy and markedly may also be involved in l-DOPA–induced nonmotor fluctuations
reduces the clinical benefit of l-DOPA treatment. The current patho- (4). The precise nature and extent of these neurochemical alterations
physiological hypothesis of LID involves pulsatile stimulation of remain poorly understood. We took advantage of matrix-assisted
DA receptors, large fluctuations in extracellular concentrations of laser desorption/ionization mass spectrometry imaging (MALDI-MSI)
DA and l-DOPA in the striatum, abnormal signaling downstream to comprehensively map monoaminergic changes in the brain of a
of DA synapses, and changes in nondopaminergic neurotransmit- nonhuman primate model of PD.
ter systems (2–4). In particular, the 5-hydroxytryptamine (5-HT) Advances in the field of MSI have established the great potential
system has been implicated in dyskinesia. It has been shown that of the technique in neuroscience through its ability to detect a wide
5-HT neurons may release DA as a false neurotransmitter during range of neuroactive compounds and metabolites in a single tissue
l-DOPA treatment (5–8). In addition, by targeting the 5-HT sys- section (12, 13). It measures the tissue levels of endogenous com-
tem, dyskinesia has been alleviated in both preclinical and clinical pounds, at a specific time point, where a single experiment can pro-
studies (2). These alterations disrupt striatal information integra- duce thousands of molecular images, displaying their quantitative
tissue distribution (14). Here, we apply a recently developed method
1 using ultrahigh mass resolution Fourier transform ion cyclotron
Medical Mass Spectrometry Imaging, Department of Pharmaceutical Biosciences,
Uppsala University, Uppsala, Sweden. 2Science for Life Laboratory, National Resource resonance (FTICR) MALDI-MSI to map multiple neurotransmitters
for Mass Spectrometry Imaging, Uppsala University, Uppsala, Sweden. 3Depart- and downstream metabolites, including catecholaminergic, serotonin-
ment of Medicinal Chemistry, Uppsala University, Uppsala, Sweden. 4Section of ergic, and -aminobutyric acid (GABA)-ergic pathways using a
Neurology, Department of Clinical Neuroscience, Karolinska Institutet, Stockholm,
Sweden. 5Université de Bordeaux, Institut des Maladies Neurodégénératives,
derivatization approach targeting primary amines and phenolic hydroxyl
Bordeaux, France. 6CNRS, Institut des Maladies Neurodégénératives, Bordeaux, groups to facilitate the ionization of the neurotransmitter metabolic
France. 7Université de Poitiers, INSERM, U0-1084, Laboratoire de Neurosciences pathways (15).
Expérimentales et Cliniques, Poitiers, France. 8University of Manchester, Manchester Samples from a previously published brain biobank of 1-methyl-
M13 9PL, UK. 9Motac Neuroscience, Manchester M15 6WE, UK.
*Corresponding author. Email: erwan.bezard@u-bordeaux.fr (E.B.); per.andren@ 4-phenyl-1,2,3,6-tetrahydropyridine (MPTP)–exposed nonhuman
farmbio.uu.se (P.E.A.) primate model of PD were investigated (16–18). This model is
Fridjonsdottir et al., Sci. Adv. 2021; 7 : eabe5948 6 January 2021 1 of 14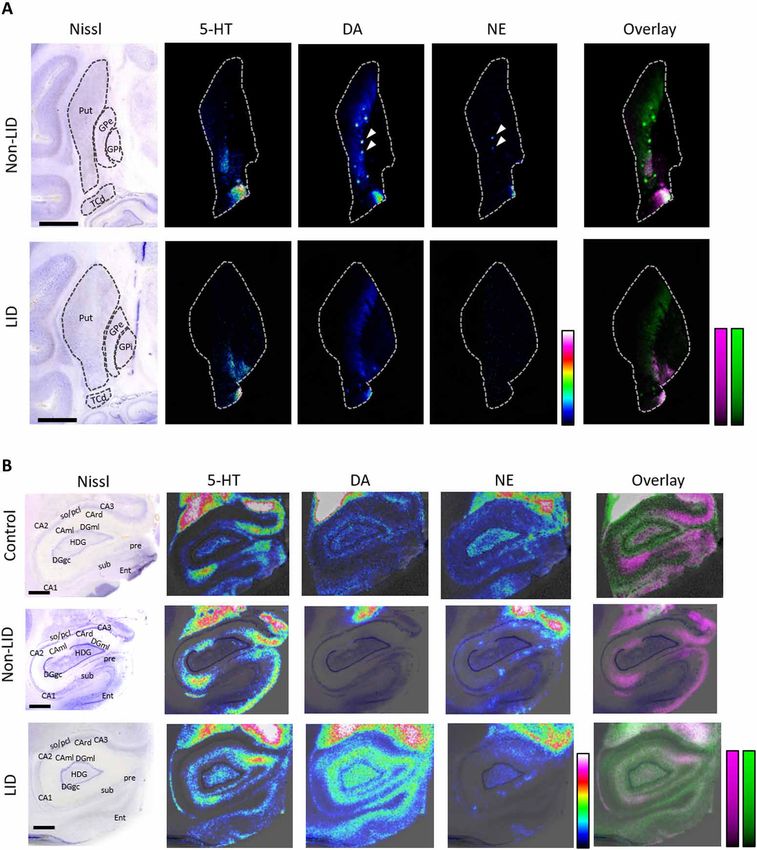
SCIENCE ADVANCES | RESEARCH ARTICLE
considered to be the optimal model to study preclinical LID, as it 6.963 ± 1.729 g/ml; LID, 7.645 ± 1.262 g/ml, P = 0.54) and in CSF
mimics well the human representation of the disease (19). We (non-LID, 0.161 ± 0.060 g/ml; LID, 0.176 ± 0.031 g/ml, P = 0.66).
investigated neurochemical changes between untreated control Slopes of the linear regression (LR) traced from the correlation
animals, animals receiving MPTP without l-DOPA (MPTP), MPTP- between CSF and plasma concentrations were identical in the two
administered animals with chronic l-DOPA treatment but without conditions (non-LID, R2 = 0.76; LID, R2 = 0.83), suggesting that
dyskinesia (non-LID), and MPTP-administered animals with chronic brain bioavailability of l-DOPA was identical in both non-LID and
l-DOPA treatment displaying dyskinesia (LID). We thoroughly LID groups.
compared the non-LID and LID groups to quantify the extent of
dysregulation of monoaminergic metabolism occurring in dyskinesia DA distribution in tissue sections from control, MPTP, LID,
without the interference of changes that may arise due to MPTP admin- and non-LID animals
istration. Neurotransmitter and metabolite levels were quantified in DA distribution was visualized in the post-commissural striatum of
coronal tissue sections, enabling investigation of molecular tissue controls, MPTP, non-LID, and LID animals (Fig. 1, A and B). The
distribution in 18 brain regions. In addition, we performed a qualita- MALDI-MS images show decreased levels of DA as a result of the
tive comparison of tissue distribution of neurotransmitters between degeneration of dopaminergic neurons, leading to a loss of terminals
the groups in selected brain regions and explored the potential of in the putamen (Put) and caudate nucleus (Cd), following MPTP
the method for showing the DA displacement in 5-HT neurons by exposure, as expected in this model (18, 25). The untreated controls
comparing the distribution of these two neurotransmitters. had high levels and a relatively homogeneous distribution of DA
throughout the Cd and Put (Fig. 1A). Following MPTP exposure,
Downloaded from http://advances.sciencemag.org/ on February 11, 2021
the remaining DA was mostly located in the dorsomedial part of the
RESULTS Put, with round patches displaying high levels of DA distributed
Animal behavioral data throughout the striatum. A similar pattern was observed for the
The brain tissues analyzed in the current study were obtained from non-LID and LID animals, although the LID animals showed a lower
a previously published biobank, which contains untreated controls, number of DA patches in the Put (Fig. 1B). The control group had
parkinsonian MPTP-exposed without l-DOPA treatment (MPTP), significantly higher DA in Cd and Put than the other groups
l -DOPA–treated nondyskinetic parkinsonian (non-LID), and (Fig. 1C). The LID animals did not significantly differ from MPTP
l-DOPA–treated dyskinetic parkinsonian (LID) rhesus monkeys and non-LID groups, although there was a nonsignificant trend of
(16–18). Parkinsonism exhibited by MPTP (disability score = 8.5 ± 0.5), increased DA in striatal structures (Fig. 1C), which may have arisen
non-LID (disability score = 9.8 ± 2.1), and LID groups (disability from high variance of DA levels in the LID group and the relatively
score = 9.3 ± 2.1) was fully comparable and directly related to the small number of animals.
extent of lesion of DA terminals in the striatum in comparison to Both segments of globus pallidus (GP) had a trend of decreased
controls as evidenced by (i) in vivo binding of [99mTc]TRODAT-1, DA in the MPTP and non-LID groups, whereas the LID group had
a DA transporter marker, using single-photon emission computed an increased level of DA, comparable to the control group (Fig. 1C).
tomography (18), (ii) ex vivo DA transporter binding autoradiography The LID group had higher DA than control and MPTP groups in
using [125I]PE2I (>95%) (18), (iii) counting of tyrosine hydroxylase the precentral gyrus (PrG), where the motor cortex is located. The
(TH)–immunopositive neurons in the substantia nigra pars compacta thalamus and the amygdala did not show significant change. DA
(>80%) (20), (iv) measurement of DA levels by high-performance was, however, increased in the hypothalamus and the hippocampus
liquid chromatography (HPLC) (>92%) (9), and (v) detailed high- in the LID animals compared to the other three groups. DA was
resolution analysis of TH and DA transporter-immunopositive DA slightly higher in the bed nucleus of stria terminalis (StT) in the LID
fibers in the striatum (20). animals compared to MPTP animals.
Despite the comparable extent of lesions and of the l-DOPA
dose administered to non-LID and LID animals, non-LID animals MALDI-MSI of multiple neurotransmitters and metabolites
had no dyskinesia (dyskinesia score = 0), while LID animals experi- Fourteen neurotransmitters and metabolites were simultaneously
enced an average peak dyskinesia rating of 2.3 ± 0.5. After oral ad- imaged and identified with accurate mass (table S1). MS/MS was used
ministration of the fixed dose of l-DOPA, both non-LID and LID to further confirm the identity of DA, l-DOPA, 3-O-methyldopa
animals exhibited similar reversal of their parkinsonism, an effect (3-OMD), 3-methoxytyramine (3-MT), norepinephrine (NE), 5-HT,
peaking from 30 to 40 min after administration until 150 to 180 min, 5-hydroxyindolic acid (5-HIAA), and GABA (fig. S1). MS imaging
before progressively returning to the OFF state as classically observed provides an additional parameter for identification purposes over
(17, 21–24). Dyskinesia in the LID group peaked from 50 to 60 min after traditional MS, namely, anatomical distribution, which was used to
l-DOPA intake until 130 to 150 min, as previously reported (17, 21–24). further confirm the identifications. In addition, the number of reactive
sites for derivatization (primary amines and phenolic hydroxy groups)
Peripheral and brain bioavailability of l-DOPA on the analytes of interest was used for identification (fig. S1 and table
Both l-DOPA–treated groups received one last l-DOPA dose 1 hour S1), as described previously (15). The identified metabolites included
before euthanasia, i.e., at the peak of antiparkinsonian and prodys- eight components of the catecholamine metabolic pathway, i.e., l-DOPA,
kinetic effects (16–18). l-DOPA levels were assessed, at 1 hour after DA, 3-MT, 3,4-dihydroxyphenylacetic acid (DOPAC), homovanillic
administration, in the plasma and cerebrospinal fluid (CSF) of sep- acid (HVA), NE, 3,4-dihydroxy-phenylglycol (DOPEG), and 3-methoxy-
arate (but concomitantly prepared) groups of non-LID (n = 4; PD 4-hydroxyphenylglycol (MOPEG), and also the main metabolite of
score = 8.9 ± 1.8; LID score = 0) and LID monkeys (n = 4: PD l-DOPA formed during pharmacological treatment, 3-OMD (fig. S2).
score = 9.2 ± 1.7; LID score = 2.5 ± 0.7). l-DOPA levels were indis- 5-HT and its metabolites 5-hydroxyindoleacetic acid (5-HIAL) and
tinguishable between the two groups both in plasma (non-LID, 5-HIAA were imaged, in addition to taurine and GABA (fig. S2).
Fridjonsdottir et al., Sci. Adv. 2021; 7 : eabe5948 6 January 2021 2 of 14
SCIENCE ADVANCES | RESEARCH ARTICLE
Downloaded from http://advances.sciencemag.org/ on February 11, 2021
Fig. 1. Tissue distribution of DA in basal ganglia structures and regional quantitation of DA. DA distribution in basal ganglia structures in (A) control, MPTP, non-LID,
and LID tissue sections, scaled to 0 to 100% of maximum intensity and (B) to 0 to 20% of maximum intensity. Lateral resolution, 80 m; all images are log-transformed and
RMS-normalized; scale bars, 4 mm. Coronal level, −4 mm ac. (C) Regional quantitation of DA; y axis shows log2AUC of DA. n = 6 for Ctrl, non-LID, and LID; n = 5 for MPTP. A
two-way ANOVA followed by a Tukey’s multiple comparisons test was performed. *P < 0.05; **P < 0.01; ***P < 0.001. Amyg, amygdala; Cd, caudate; Ctrl, control; GPe, external
globus pallidus; GPi, internal globus pallidus; Hip, hippocampus; Hy, hypothalamus; PrG, precentral gyrus; Put, putamen; StT, nucleus of stria terminalis; Thal, thalamus.
Neurotransmitter and metabolite alterations between PrG, superior temporal gyrus (STG), and thalamus. The mono-
non-LID and LID amine oxidase (MAO) metabolite DOPAC was only significantly
A thorough comparison of monoamine metabolites between non- elevated in the claustrum, although there was a trend of increased
LID and LID animals was performed in 18 brain regions (Fig. 2A DOPAC throughout the most analyzed regions in LID. These re-
and fig. S3). There was a significant increase in l -DOPA and sults indicate that the excess DA in LID is preferentially metabo-
3-OMD in the LID group compared to the non-LID group in all lized to 3-MT via COMT.
18 brain regions (Fig. 2, B and C). DA was significantly elevated in LID The log2 fold change (log2FC) of l-DOPA levels was highest in
in all brain regions, except Cd and Put. There was a nonsignificant GPi and lowest in hypothalamus, ranging from 5 to 7 (Fig. 2B).
trend toward increased DA in these regions. The catechol-O-methyl 3-OMD had a log2FC of approximately 4 to 5 in all regions. DA was
transferase (COMT) metabolite of DA, 3-MT, was significantly ele- elevated the most in Ent and hippocampus (log2FC = 3.8, for both).
vated in the LID state in the following 13 regions: anterior cingulate 3-MT displayed the largest increases in GPi (log2FC = 5.5), hippo-
gyrus (ACgG), claustrum, entorhinal area (Ent), external GP (GPe), campus (log2FC = 5.3), Ent (log2FC = 5.6), and thalamus (log2FC =
internal GP (GPi), hippocampus, insula, inferior temporal gyrus 4.8). DOPAC was elevated the most in hypothalamus (log2FC = 2.3),
(ITG), middle temporal gyrus (MTG), postcentral gyrus (PoG), GPi (log2FC = 2.4), and claustrum (log2FC = 1.9), although the
Fridjonsdottir et al., Sci. Adv. 2021; 7 : eabe5948 6 January 2021 3 of 14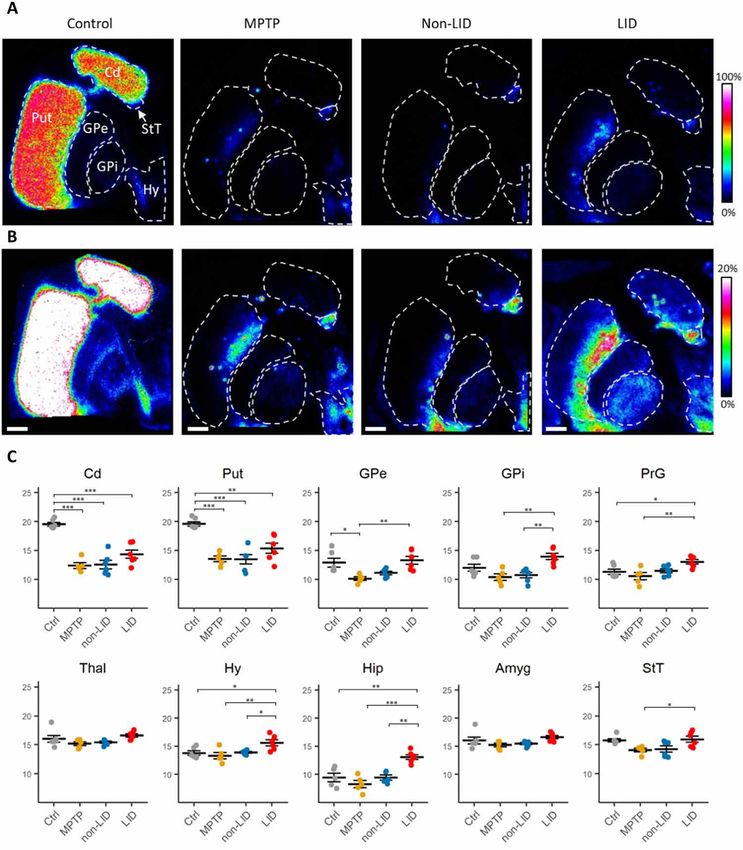
SCIENCE ADVANCES | RESEARCH ARTICLE

                                                                                                                                                                                    Downloaded from http://advances.sciencemag.org/ on February 11, 2021
Fig. 2. Regional alterations of metabolites in non-LID versus LID. (A) Nissl-stained macaque brain tissue section at −4 mm ac with annotated brain regions. (B) Region-
al heat maps color-coded according to log2FC between non-LID and LID. Blue indicates elevated levels in non-LID, red indicates higher levels in LID, and white indicates
no change. (C) Regional quantitation of metabolites in non-LID and LID. Log2-transformed AUC values for each sample are shown. Blue, non-LID; red, LID. Crossbar and
error bars show means and SDs. A Shapiro-Wilk normality test was used to determine normal distribution of samples; a Student’s t test was used when passing normality
test; otherwise, a Mann-Whitney U test was used. *P < 0.05; **P < 0.01; ***P < 0.001. For all metabolites in all regions, n = 6, except n = 5 for PoG in LID group, n = 3 for PoG
in non-LID group, and n = 5 for Hip in non-LID. Statistical results are summarized in table S2. ac, anterior commissure; ACgG, anterior cingulate gyrus; Clau, claustrum; Ent,
entorhinal area; Ins, insula; ITG, inferior temporal gyrus; MTG, middle temporal gyrus; PoG, postcentral gyrus; STG, superior temporal gyrus.

alterations were not significant. Noticeably, the metabolites that oc-                    enough time for HVA formation according to pharmacokinetic
cur early in the metabolic pathway, i.e., l-DOPA, 3-OMD, DA and                           data (26), suggesting that there may be a rate-limiting step in HVA
3-MT, exhibited the greatest changes, whereas the end-metabolite                          formation, possibly due to the extreme levels of l-DOPA in the LID
HVA was not significantly altered (Fig. 2 and fig. S3). The animals                       brains. Another possible explanation is that the HVA clearance
were euthanized 1 hour after l-DOPA administration, which is                              from the brain is high enough to prevent elevated levels of HVA.

Fridjonsdottir et al., Sci. Adv. 2021; 7 : eabe5948   6 January 2021                                                                                                     4 of 14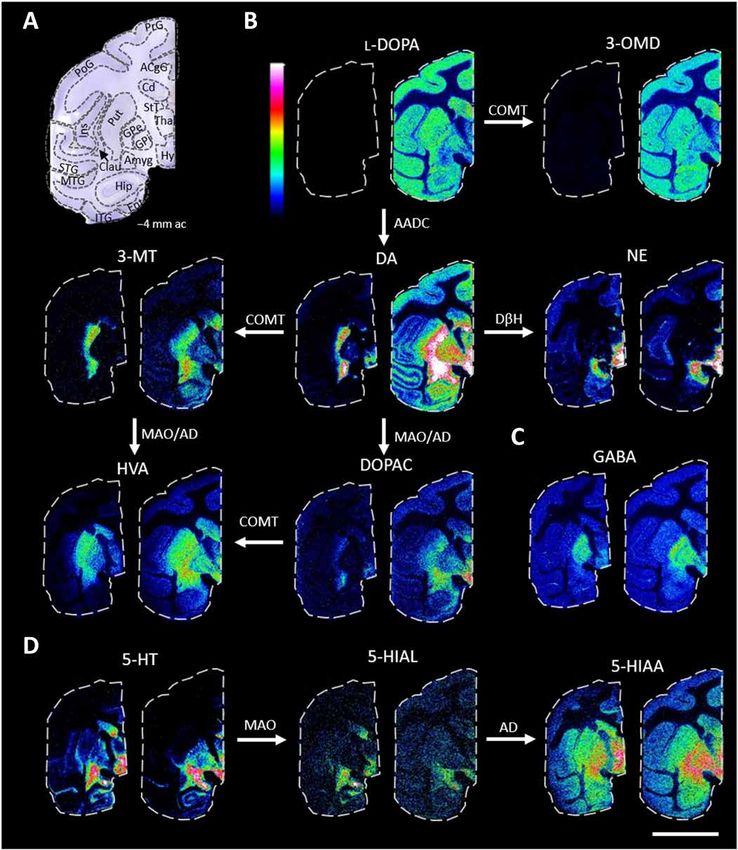
SCIENCE ADVANCES | RESEARCH ARTICLE
5-HT showed a trend to decrease in LID animals, especially in cor- more abundant throughout the tissue section and, not defined to
tical regions, hippocampus, hypothalamus, and thalamus, indicated specific structure to the same extent as 5-HT, with highest intensity
by the blue color on the heatmap (Fig. 2B); the difference was, how- detected in hypothalamus, GP, and amygdala (Fig. 3D).
ever, not significant. The remaining investigated metabolites GABA,
DOPEG, MOPEG, 5-HIAL, 5-HIAA, and taurine did not show any Neurotransmitter abundance in control, MPTP, non-LID,
significant difference between non-LID and LID in the investigated and LID animals
regions (fig. S3). To investigate how the levels of metabolites related to control ani-
The MALDI-MS images were outlined in a metabolic pathway mals and MPTP-exposed animals without l-DOPA treatment, we
to visualize the monoaminergic differences between non-LID and compared the relative abundance of l-DOPA, NE, 5-HT, and
LID animals (Fig. 3B). A marked increase in l-DOPA and 3-OMD GABA between control, MPTP, non-LID, and LID groups in 10
was obvious in LID animals. DA increased especially in extrastriatal selected regions: Cd, Put, GPe, GPi, PrG, thalamus, hypothalamus,
regions, such as cerebral cortex, GP, and hippocampus. The DA hippocampus, amygdala, and StT (table S3). We found that l-DOPA
metabolites 3-MT, DOPAC, and HVA had highest abundance in levels were equal between non-LID and control animals in the Cd
the Put, Cd, StT, and hypothalamus. NE was highest in the hypo- and Put (fig. S4). This may be interpreted as the non-LID animals
thalamus, StT, and amygdala but was also abundant in cortical having had an optimal amount of l-DOPA, whereas LID animals had
regions predominantly in ACgG, PrG, PoG, and insula. GABA was an overdose of l-DOPA. The MPTP animals had significantly lower
most abundant in both segments of GP but was also abundant l-DOPA in the Cd and Put compared to the other three groups (fig.
throughout the whole gray matter (Fig. 3C). 5-HT was highly abun- S4). In the remaining regions, l-DOPA was significantly elevated in
Downloaded from http://advances.sciencemag.org/ on February 11, 2021
dant in amygdala, hypothalamus, GPi, StT, and medial Cd (Fig. 3D). LID compared to all other three groups (fig. S4). The MPTP, non-
5-HIAL had similar distribution as 5-HT; however, 5-HIAA was LID, and LID groups had decreased NE levels compared to controls
in the Cd and a similar trend was observed in Put, although the
decrease was not significant for non-LID and LID groups (fig. S4).
5-HT did not show a significant change between the groups in the
brain regions analyzed (fig. S4). GABA was increased in both non-
LID and LID compared to the MPTP group in Cd, Put, GPe, GPi,
and PrG. In addition, GABA was elevated in non-LID and LID
compared to control in the Put (fig. S4). MALDI-MS images of con-
trol, MPTP, non-LID, and LID are presented in fig. S2.
Increases of l-DOPA in LID correlated to elevated DA
and 3-OMD concentrations
To understand the fate of l-DOPA in the non-LID and LID brains,
we investigated the relationships between l-DOPA and its two
metabolites 3-OMD and DA with LR analysis, where the levels of
metabolites were correlated with their precursor (l-DOPA). Although
this analysis cannot prove a causal relationship, we hypothesize that
a highly linear relationship would indicate that the formation of the
product metabolites, i.e., 3-OMD or DA, was highly dependent on
the substrate (l-DOPA) concentration. Any region displaying a sig-
nal lower than three times the noise level of the mass spectra was
excluded from the analysis. No regions were excluded in the LID
groups. However, because of the low intensity of l-DOPA in several
non-LID brain regions, the number (n) was reduced to n = 3 in
hippocampus; n = 4 in claustrum, Ent, GPe, GPi; and n = 5 in amyg-
dala. In addition, in Ent in non-LID, the number of samples was
reduced to n = 3 for the correlation of l-DOPA to DA due to low
DA levels in three of the samples.
For the COMT metabolite, 3-OMD, there was a significant linear
Fig. 3. MALDI-MS images of neurotransmitters and metabolites in non-LID relationship in all regions in the LID group (Fig. 4A), where all fitted
and LID. (A) Nissl-stained macaque brain tissue section at −4 mm ac with annotat- models had a similar slope (0.57 to 0.65), indicating a homogeneous
ed brain regions. (B) Catecholaminergic metabolic pathway. All MALDI-MS images rate of formation of 3-OMD in response to increased l-DOPA con-
are RMS-normalized and log-transformed intensities. l-DOPA, 3-OMD, 3-MT, HVA, centration. In the non-LID group, there was a significant linear re-
and DOPAC are scaled to 0 to 100% of maximum intensity, and DA and NE are
lationship in Cd, GPe, Put, StT, and cortical regions (Ctx, Fig. 4). In
scaled to 0 to 10% of maximum intensity. (C) GABA, scaled to 0 to 100% of maxi-
these brain structures, a lower rate of formation of 3-OMD was
mum intensity. (D) 5-HT metabolic pathway: 5-HT scaled to 0 to 15%, 5-HIAL scaled
to 0 to 20%, and 5-HIAA scaled to 0 to 50% of maximum intensity. For all images:
found in response to increased l-DOPA levels in the non-LID group,
left section, non-LID; right section, LID; scale bar, 20 mm; lateral resolution, 150 m. indicated by a reduced slope (0.26 to 0.33).
Enzymes involved are annotated by the arrows. COMT, catechol-O-methyl transfer- For the conversion of l-DOPA to DA, there was a significant
ase; MAO, monoamine oxidase; AADC, aromatic l-amino acid decarboxylase; DH, linear relationship in the LID group in all investigated regions
dopamine--hydroxylase; AD, aldehyde dehydrogenase. except for the Cd and Put, the main target structures for l-DOPA
Fridjonsdottir et al., Sci. Adv. 2021; 7 : eabe5948 6 January 2021 5 of 14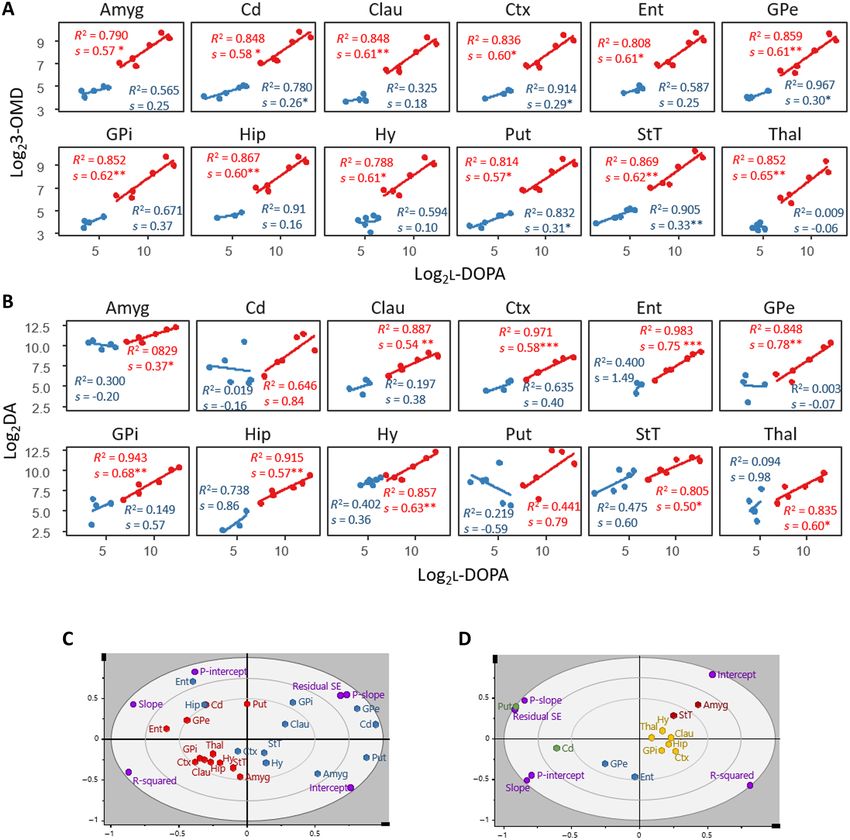
SCIENCE ADVANCES | RESEARCH ARTICLE

                                                                                                                                                                                 Downloaded from http://advances.sciencemag.org/ on February 11, 2021
Fig. 4. Correlation of l-DOPA to 3-OMD or DA in non-LID and LID. (A) LR of the change in 3-OMD content in response to l-DOPA. (B) LR of the change in DA content
in response to l-DOPA. (A and B) Blue, non-LID; red, LID. A significant linear relationship is indicated with *P < 0.05, **P < 0.005, and ***P < 0.001. For all linear models,
n = 6 in the LID group, and Cd, Hy, Put, and StT in the non-LID group. For the remaining non-LID regions, n = 5 in Amyg and Thal, n = 4 in Clau, Ctx, GPe, and GPi, n = 3 in
Hip in both correlations, n = 4 in Ent in l-DOPA to 3-OMD, and n = 3 in Ent in l-DOPA to DA. (C) PCA model computed from results of LR models in (B); blue, non-LID; red, LID;
purple, loadings. (D) PCA model computed from results of LR analysis for change in DA in response to increased l-DOPA in LID only. Regions are color-coded according
to hierarchical clustering and grouping structures that respond similarly to changes in l-DOPA content. P-intercept, P value for intercept; P-slope, P value for slope;
R-squared, R2; Residual SE, SE of residuals.

treatment (Fig. 4B). The non-LID group did not have a significant                       the LR model. To simplify, the groups were separated on whether
linear relationship between l-DOPA and DA in any structure. Note                        they had a significant LR or not. To further investigate the response
that the concentration range of l-DOPA was not the same in the                          in different brain structures to increased l-DOPA in the LID group,
two groups, and therefore, it was not appropriate to extrapolate the                    a PCA with only the LID group was performed and a hierarchical
results from the non-LID to the higher l-DOPA levels. If non-LID                        clustering analysis grouped structures that responded similarly to
animals would have had l-DOPA tissue levels in the same range as                        changes in l-DOPA content (Fig. 4D). Put and Cd were placed far
the LID animals, they may have shown the same results as LID. The                       from the other brain regions because of their high P value for slope
important finding is that the correlations between the levels of                        and SE of residuals, i.e., nonsignificant LR. GPe and Ent are grouped
l-DOPA and its two metabolites are highly linear when l-DOPA is                         because of their high slope and insignificant intercept, suggesting
elevated, as in the LID state.                                                          that their DA levels increased more in response to increased l-DOPA
   A principal components analysis (PCA) was performed on the                           than in other brain structures, and when there is no exogenous
output from the LR analysis: the slope, intercept, P value for slope,                   l-DOPA present, there is negligible amounts of DA in these struc-
P value for intercept, R2, and SE of residuals (obtained from LR be-                    tures. Amygdala and StT are grouped because of a high and signifi-
tween l-DOPA and DA). The resulting PCA showed that the brain                           cant intercept illustrating the high amount of DA present in these
regions of LID and non-LID were separated, except for the Cd and                        structures regardless of the presence of exogenous l-DOPA. Last,
Put of the LID group that were located closer to the non-LID re-                        hypothalamus, claustrum, thalamus, GPi, hippocampus, and corti-
gions (Fig. 4C). The main separators were the P value for the slope,                    cal regions are grouped, as their LR models had moderate values for
SE of residuals, and R2, i.e., parameters that describe the linearity of                the slope and intercept and a good fit indicated by a high R2.

Fridjonsdottir et al., Sci. Adv. 2021; 7 : eabe5948   6 January 2021                                                                                                  6 of 14
SCIENCE ADVANCES | RESEARCH ARTICLE
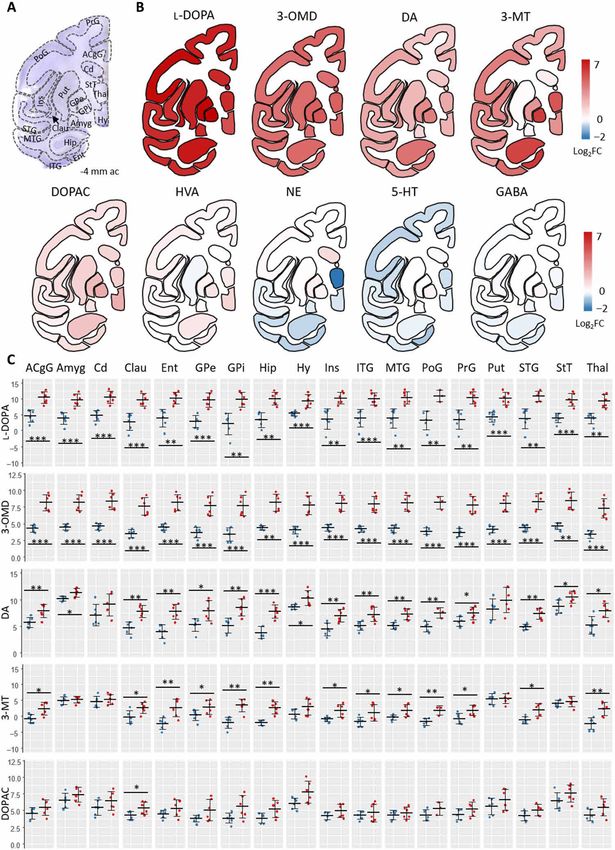
Changes in striatal metabolism of DA nals in the Put (Fig. 6A), and we were, therefore, unable to show DA
We investigated different routes of DA metabolism using the ratios displacement in 5-HT neurons in the Put using this approach.
of the MAO metabolite DOPAC and the COMT metabolite 3-MT The hippocampus is innervated by serotonergic neurons hetero-
to DA in the Cd and Put. The DOPAC/DA ratio was not different geneously to different hippocampal layers (28). In control animals,
between the two groups (Fig. 5A). The 3-MT/DA ratio was, however, we detected 5-HT prominently in the molecular layer of hippocam-
higher in non-LID than in LID in both Cd and Put (Fig. 5B). Con- pus (CAml), in the hilar region of the dentate gyrus (HDG), and in
sidering the previous analysis, where we found no significant differ- stratum radiatum of CA3 and CA1 (CArd) (Fig. 6B). Although car-
ence in either 3-MT or DA levels in Cd and Put, the difference in rying a known physiological function (29), DA abundance was low
3-MT/DA ratio indicated that there was an altered COMT metabo- in the hippocampus of control animals and was mainly confined to
lism between the two groups in the striatal regions, with higher the molecular layer of the dentate gyrus and the outer part of HDG
COMT activity in non-LID animals than in LID animals. along the surface of the granular layer of the dentate gyrus. In con-
trol animals, 5-HT and DA distributions did not overlap. In the LID
Localization of 5-HT, NE, and DA in the striatum animals, however, DA was more widely distributed throughout the
and hippocampus hippocampus than in control, with high levels in CAml and whole
We observed a patchy distribution of DA in non-LID animals. HDG, illustrating overlap with 5-HT, an indication of DA displace-
These patches were also found in the striatum at brain levels −4, −2, ment in 5-HT neurons occurring in LID. In contrast, the non-LID
0, and +4 mm from the anterior commissure (ac) in non-LID animals animals showed very low abundance of DA not associated with
(fig. S5). The LID animals did not show such patchy DA distribu- specific hippocampal layers. The localization pattern of NE in hip-
Downloaded from http://advances.sciencemag.org/ on February 11, 2021
tion but rather a smoother distribution with the highest intensity in pocampus was similar in all groups.
the medial part fading into the lateral part of Put. We quantified
these patches by counting the number of patches in Cd and Put in Distribution pattern of DA, 5-HT, and NE in different cerebral
each tissue section, and a significantly higher number of patches cortical areas
were observed in non-LID animals (fig. S5). A patchy distribution Higher-order brain functions are processed in the cerebral cortex
of NE that colocalized with some of the DA patches (arrows, Fig. 6A) and are modulated by the monoaminergic transmission (30). We
was observed in the Put of non-LID macaque brains. investigated the monoaminergic distribution in the primary motor
Serotonergic neurons can uptake exogenous l-DOPA, synthesize, cortex (PrG), a key region for the execution and control of move-
and release DA as a false neurotransmitter and, due to the lack of ment and in the temporal gyrus (TG), involved in sensory process-
efficient reuptake capacity, cause fluctuation of extracellular DA, ing (Fig. 7A). The monoaminergic neurons innervate cortical areas
which is one of the most compelling hypotheses explaining LID, with laminar specificity (30, 31). In PrG, the DA neurons from the
based on preclinical and clinical data (27). In addition, synaptic ventral tegmental area mainly innervate deep cortical layers, but the
5-HT content may decrease due to its displacement by DA in 5-HT 5-HT neurons from dorsal raphe nucleus and NE neurons from the
neurons. In the current study, however, quantitation of 5-HT did locus coeruleus innervate layer I with greater density than deep layers
not show a significant change in 5-HT levels in LID compared to (30). A laminar distribution was observed for all three neurotrans-
the other investigated groups (fig. S4). We investigated the localiza- mitters (Fig. 7B). In the PrG, the control had low DA in layer I but
tion of 5-HT and DA to evaluate the potential formation of DA in high 5-HT, whereas non-LID and LID had high DA in layer I, similar
5-HT neurons in striatal structures, Cd and Put, and also in the to the 5-HT distribution, indicating that the DA in layer I in non-
hippocampus. We found a very low amount of 5-HT in the Put LID and LID animals originated in 5-HT neurons, another indica-
(Fig. 6A), as previously shown (7), and its localization could not be tion of DA displacement in 5-HT neurons. NE had a homogeneous
correlated with the DA distribution in either non-LID or LID. Over- distribution throughout the PrG but was slightly higher in the outer
laying DA and 5-HT distributions showed little concordance of sig- layer in all three states.
In the TG, the three groups had a similar distribution of DA,
which was high in the outer layers, low in middle layers, and modest
A B in the deep layers (Fig. 7C). This distribution pattern was similar to
D O P A C /D A 3 - M T /D A
previously reported pattern of TH-immunoreactive fibers in the
1 .0 0 .2 5 * TG, where the highest density was found in layers I and VI (32). All
*
animals had high 5-HT and NE in the outer layers of the TG.
0 .8 0 .2 0
The laminar distribution of DA was divided into three layers for
0 .6 0 .1 5
relative quantification, namely, outer, middle, and inner layers,
containing cortical layers I and II, III and IV, and V and VI, respec-
0 .4 0 .1 0 tively (Fig. 7D). The abundance of DA was significantly elevated in
LID in all layers, except in the outer layer of PrG (P = 0.0815), al-
0 .2 0 .0 5 though this layer showed a similar trend as the other layers (Fig. 7E).
The outer layers displayed the highest DA levels consistently through-
0 .0 0 .0 0
out PrG, insula, and the TG (Fig. 7E).
Fig. 5. DA metabolism in striatum. (A) DOPAC/DA ratio (MAO metabolism of DA)
and (B) 3-MT/DA ratio (COMT metabolism of DA) in Cd and Put in non-LID (blue)
and LID (red). Bars show means, and error bars show SDs (n = 6 for both groups in DISCUSSION
both regions). A Mann-Whitney U test was used; results are summarized in table S4. Although l-DOPA can cause severe side effects such as LID after
*P < 0.05. long-term treatment, it remains the most effective symptomatic
Fridjonsdottir et al., Sci. Adv. 2021; 7 : eabe5948 6 January 2021 7 of 14SCIENCE ADVANCES | RESEARCH ARTICLE
Downloaded from http://advances.sciencemag.org/ on February 11, 2021
Fig. 6. Comparison of 5-HT, DA, and NE localization in basal ganglia and hippocampus. (A) Nissl-stained section showing basal ganglia structures at −6 mm ac and
MALDI-MS images of 5-HT (scaled to 0 to 25%), DA (scaled 0 to 30%), and NE (scaled to 0 to 40%) in non-LID and LID. Lateral resolution, 50 m. Scale bars, 5 mm. White
arrows indicate DA and NE patches that colocalize. (B) Nissl-stained section of Hip at −4 mm ac and MALDI-MS images of 5-HT, DA, and NE (all scaled to 0 to 20%) in con-
trol, non-LID, and LID macaque brain. Lateral resolution, 80 m. Scale bars, 2 mm. For (A) and (B), images are RMS-normalized and log-transformed, and overlays show DA
in green and 5-HT in magenta. CA, Cornu ammonis; CAml, molecular layer of the Hip; CArd, stratum radiatum; DGgc, granular layer of the dentate gyrus; DGml, molecular
layer of the dentate gyrus; HDG, hilus of the dentate gyrus; so, stratum oriens; pcl, pyramidal cell layer; pre, presubiculum; sub, subiculum; TCd, tail of caudate nucleus.
therapy for PD (33). The rationale of l-DOPA treatment is to in- nonhuman primate model of PD and LID. Our results revealed ex-
crease the striatal DA concentration to compensate for the DA loss cessive amounts of l-DOPA and 3-OMD in brains of LID animals.
following dopaminergic denervation. The mechanisms of l-DOPA’s All animals received the same dose, 20 mg/kg orally, twice daily for
action are, however, not fully understood. Accumulating evidence 3 months, with the last dose given 1 hour before euthanasia (16, 18).
has shown that l-DOPA affects wide networks of neurotransmitter Despite the fact that striatal l-DOPA was increased more than 30
systems that can be involved in LID and other side effects of l-DOPA times in LID compared to non-LID, we did not find a significant
treatment (9). Although poorly considered, l-DOPA itself has been rise in DA in the striatum. This unexpected result is contrary to
hypothesized as acting as a neurotransmitter (34). previous studies, performed using microdialysis and positron emis-
In the present study, we have used our recent advances in the sion tomography (PET), that have suggested a significant rise in
visualization of comprehensive neurotransmitter networks by MALDI- extracellular DA in the striatum associated with LID (3, 5, 8, 27).
MSI to investigate the relative abundance of multiple neurotrans- Most of these microdialysis studies have, however, been performed
mitters and their metabolites, possibly involved in LID, in specific on the 6-hydroxydopamine (6-OHDA)–lesioned rodent model of
brain regions (15). Through this methodology, we were able to map PD, which does not fully represent the human biology and anatomy
the brain distribution of l-DOPA, DA, and derived metabolites in a as well as the nonhuman primate model. A microdialysis study in
Fridjonsdottir et al., Sci. Adv. 2021; 7 : eabe5948 6 January 2021 8 of 14SCIENCE ADVANCES | RESEARCH ARTICLE
Downloaded from http://advances.sciencemag.org/ on February 11, 2021
Fig. 7. Mapping of DA throughout cortical areas and layers. (A) Nissl-stained coronal tissue section at −4 mm ac illustrating the location of the analyzed cortical area.
(B) MS images of DA, 5-HT, and NE in PrG and (C) TG at −4 mm ac. Color intensity scale is 0 to 50% for DA and 5-HT and 0 to 30% for NE. Lateral resolution, 50 m; scale bar,
1 mm; images are RMS-normalized. The arrows in (B) and (C) show the orientation of the sample pointing toward the outer layers of the cortex. (D) Nissl-stained cortex
section overlaid with DA distribution illustrating the three layers of the cortex that were analyzed. (E) Relative quantitation of DA in outer, middle, and deep cortical layers
at −4 mm ac in the PrG, Ins, and TG. Bars show means, and error bars show SDs; blue, non-LID; red, LID. Statistics were performed using a two-way ANOVA and a post hoc
Sidak’s multiple comparisons test (n = 6 for both groups in all cortical layers). *P < 0.05; **P < 0.01; ***P < 0.001. Two-way ANOVA results are summarized in table S5.
the MPTP primate model did not detect any significant rise in DA in this context. Evidence in rodents and nonhuman primates has
in the striatum associated with LID (10). In addition, PET measures shown that 5-HT neurons are a significant source of extracellular
the changes in l-DOPA–induced displacement of [11C]raclopride DA in LID. Lesioning of 5-HT neurons (5–8) or coadministration
binding (3, 35, 36). Previous reports concluded that such changes of tryptophan with l-DOPA significantly improves or, in some cases,
reflect changes in synaptic DA levels, based on the assumption that completely abolishes dyskinesia (37). In addition, 5-HT1A and 5-HT1B
only DA could displace raclopride binding (3, 35, 36), the possibility agonists and some serotonin transporter inhibitors are effective anti-
of any other endogenous ligand not having been considered. With dyskinetic agents, as shown in preclinical and clinical studies [re-
the method used in the current study, total brain levels were mea- viewed in (38, 39)]. However, not all data that have been produced
sured and extracellular DA could not be distinguished from intra- in LID research can be fully explained by the ectopic release of DA
cellular DA. The data, however, raise the possibility that l-DOPA from serotonergic neurons.
itself may be a contributory factor in causing LID, indicating that While there is a direct relationship between l-DOPA dose and
stabilization of brain l-DOPA levels is of high importance to pre- LID occurrence and severity, some PET studies suggest that LID is
vent dyskinesia. Our results showed that non-LID animals had the not strictly paralleled by a rise in striatal DA tone (3). Earlier find-
same amount of l-DOPA in the striatum as control animals, indi- ings have demonstrated that l-DOPA may act on its own (40).
cating that non-LID animals had a favorable amount of l-DOPA. l-DOPA produces some pharmacological actions not through con-
The profuse amount of evidence that has emerged during the past version to DA (41), which suggests antiparkinsonian action of l-DOPA
20 years of a central role of 5-HT system in LID has to be mentioned itself shown in both the 6-OHDA–lesioned and reserpine-treated
Fridjonsdottir et al., Sci. Adv. 2021; 7 : eabe5948 6 January 2021 9 of 14SCIENCE ADVANCES | RESEARCH ARTICLE
rat models of PD (42, 43). Such antiparkinson action happened be- trast to the present study. In addition, we found that NE was de-
fore the elevation in DA when l-DOPA was administered after pre- creased only in the striatum following MPTP treatment (including
treatment with benserazide or in the absence of DA when l-DOPA non-LID and LID) compared to control. The HPLC study did not
was given in combination with NSD-1015, a central AADC inhibitor detect NE in the striatum but reported decreased levels in motor
(43). The present results lead us to hypothesize that the antiparkinson cortex in non-LID compared to control, and in amygdala in non-
effect might be due to either (i) a direct effect of l-DOPA upon super- LID and LID compared to control (9).
sensitive DA receptors in the absence of the endogenous ligand while HPLC has been the mainstay to quantify neurotransmitters in
striatal levels of l-DOPA are markedly increased, (ii) the action of brain tissue but results in the loss of the spatial information from
DA outside the striatum, because there was a significant rise in DA the sample. It merely provides an average concentration of the brain
everywhere except in the striatum, or (iii) a combination of both. region selected, i.e., it does not resolve intraregional changes of
Such a provocative hypothesis deserves further investigation. neurotransmitters and metabolites. The approach may also suffer from
A direct role for l-DOPA upon LID, independently from DA, variable dissection skills. On the other hand, the method may pro-
has received little attention beyond the classic conversion into DA vide a better overall estimate of a concentration of a transmitter in a
(44, 45). We recently showed that l-DOPA can alter basal ganglia whole brain region than MALDI-MSI, where often only a single tis-
activity and produce LID without enhancing striatal DA release in sue section is analyzed at a certain brain level. Therefore, the levels of
dyskinetic parkinsonian macaques using microdialysis (10). l-DOPA the neurotransmitters and metabolites vary depending on the exact
has, however, little affinity for DA receptors. In physiological con- localization where the tissue section was collected, and the two
ditions, DA would compete with and prevent l-DOPA binding to methods may therefore not always provide the same results. An
Downloaded from http://advances.sciencemag.org/ on February 11, 2021
DA receptors. In a condition of depleted DA, it is possible that advantage of MALDI-MSI is that it enables quantitative analysis in
l-DOPA’s affinity for DA receptors is sufficient to enable it to bind relatively small regions of a tissue sections, which may be very diffi-
to those receptors with physiological effect. In view of the well- cult to perform in tissue homogenates using HPLC.
documented pathological activation of noncanonical signaling cas- Although MALDI-MSI cannot distinguish extracellular from in-
cades of DA receptors in LID (4), one can posit that l-DOPA might tracellular metabolite levels, the simultaneous mapping of multiple
actually be a biased agonist to DA receptors, preferentially activating neurotransmitters and their metabolic pathways has several advan-
noncanonical cascades leading to LID. While biased agonists aim at tages, besides the number of brain regions and metabolites measured
dissociating on-target benefits from adverse effects (46), we here face in a single experiment. The formation of DA metabolites can be an
a situation where the biased agonist is detrimental. indication of the compartmental location of DA. In regions with
In the light of fluctuating l-DOPA levels, considerable efforts significantly elevated DA levels, we found mainly increases of the
have been made to stabilize l-DOPA delivery to decrease LID with COMT metabolite 3-MT but not of the MAO metabolite DOPAC.
promising results using intravenous or intestinal infusion (47, 48). 3-MT has been established as an indicator of DA release because of
It is, however, important to understand the physiological process the location of the COMT enzyme (54), which indicated that the
that leads to the extensive difference in l-DOPA levels in brain tissue excess DA was metabolized extraneuronally, and therefore located
between the two states. The plasma and CSF data showed that both extraneuronally. We also explored the potential of MALDI-MSI to
non-LID and LID had similar l-DOPA levels, indicating that the show DA replacement in 5-HT neurons by comparing distribution
large difference we report in brain tissue l-DOPA is not due to patterns of the two neurotransmitters. Our data were not suitable to
peripheral differences. Therefore, the transportation of l-DOPA into illustrate this displacement in the striatum, mainly because of the
the brain might be facilitated in LID animals, causing accumulation low detection of 5-HT in the striatum. We were, however, success-
of l-DOPA possibly due to blood-brain barrier impairment (49, 50), ful in showing that 5-HT–rich layers in the hippocampus and in the
or l-DOPA may be effluxed in non-LID animals. Such an efflux PrG had increased amount of DA in the dyskinetic animals.
transporter has been previously characterized and shown to reduce Research on LID has mainly focused on pathophysiological
brain bioavailability of l-DOPA (51). changes in the basal ganglia and motor cortex. However, pos-
The biological effect of 3-OMD has been studied preclinically. sible involvement of nonmotor nuclei, including the lateral
Studies in rats have shown that 3-OMD reduced locomotor activity habenula and the bed nucleus of the StT, in the mechanism of LID
and decreased DA metabolite concentrations (52, 53). When 3-OMD has been speculated in recent years (55, 56). In the present study,
was combined with l-DOPA, the decrease in DA metabolites was we show that DA increased linearly with increased l-DOPA levels
reversed. In addition, 3-OMD inhibited the DA transporter but did in extrastriatal regions, indicating the inability of nonstriatal brain
not bind to DA receptor 1 (52). These results suggest a synergistic regions to regulate the conversion of l-DOPA to DA. The effect of
effect between l-DOPA and 3-OMD in the brain. The coexistence elevated l-DOPA and DA in nonstriatal regions has received little
of excessive amounts of l-DOPA and 3-OMD in dyskinetic primate attention previously, but the significant changes seen in our
brains could potentially contribute to dyskinesia. study may have implications for a number of motor and behavioral
In a previous study that analyzed tissue samples from the same syndromes.
animals as in the present study, the levels of DA, NE, and 5-HT were MALDI-MSI revealed DA patches that occurred repeatedly in
quantified by HPLC in striatum, motor cortex, amygdala, and hippo- the Put of MPTP-exposed and non-LID brains. These patches
campus (9). The study reported no significant increase of DA in the may represent intact DA terminal collections that may have a role
striatum in LID compared to non-LID, which is in accordance with in preventing dyskinesia because they were more prevalent in the
our current findings. Similarly, DA was increased in LID compared non-LID animals. We were not able to correlate these DA patches,
to controls and non-LID in hippocampus and amygdala (9). How- with other signals either in our MSI data or in the literature,
ever, the HPLC analysis reported decreased 5-HT in the striatum, when searching for a pattern comparable with the patchy distri-
hippocampus, and amygdala in LID compared to controls, in con- bution of DA.
Fridjonsdottir et al., Sci. Adv. 2021; 7 : eabe5948 6 January 2021 10 of 14SCIENCE ADVANCES | RESEARCH ARTICLE
To summarize, we have thoroughly mapped the distribution of (150 mg/kg, intravenously). The animals were euthanized 6 months
monoamines and their metabolites, in non-LID and LID primate after the initial MPTP exposure (or saline, for control), and
brains, highlighting multiple locations of monoaminergic alter- the brains were quickly removed and immediately frozen by
ations using MALDI-MSI. l-DOPA was highly elevated in LID animals immersion in isopentane, cooled with dry ice, and stored at −80°C.
causing an increase in DA and DA metabolites in extrastriatal struc- The time between euthanasia and freezing of the samples was
tures. In addition, 3-OMD, the main metabolite of l-DOPA, was 10 min.
highly elevated in LID, indicating that dysregulated metabolism of
l-DOPA is involved in LID. The high l-DOPA levels in LID resulted CSF and plasma analysis of l-DOPA levels
in elevated levels of DA in extrastriatal regions, which was predom- Bioanalysis was conducted as previously described (60) of separate
inantly metabolized through COMT. The high abundance of DA in but parallel prepared groups of non-LID and LID monkeys (n = 4
extrastriatal regions may exert biological function by altering sig- per group). Briefly, blood samples were collected immediately be-
naling throughout the whole brain and resulting in various adverse fore dosing and at 1 hour after l-DOPA administration, and plasma
effects of l-DOPA treatment. was immediately separated. Lumbar CSF was collected 1 day before
dosing and at 1 hour after l-DOPA. After thawing, 20 l of plasma
or CSF was spiked with 100 l of 0.4 M perchloric acid and 200 l of
MATERIALS AND METHODS the internal standard solution (3-methyl-DOPA at 0.2 g/ml in
Materials 0.4 M perchloric acid solution). Ten microliters of the supernatant
Deuterium-labeled standards (GABA-d6, DA-d4, 3-MT-d4, Tyr-d2, aliquot was then injected into the liquid chromatography (Agilent
Downloaded from http://advances.sciencemag.org/ on February 11, 2021
NE-d6, and l-DOPA-d3) were obtained from Qmx Laboratories 1200 RRLC, Agilent Technologies, Santa Clara, CA, USA) MS (LC-
(Thaxted, UK). The derivatization matrix FMP-10 was synthesized MS) system (Agilent 6410B, Agilent Technologies). The LC separa-
in-house as previously reported (15). Standards for DA, l-DOPA, tions of l-DOPA were achieved using a C18 column (3.5 m,
3-OMD, 3-MT, NE, 5-HT, 5-HIAA, and GABA used for MS/MS 2.1 mm × 100 mm, Xterra MS, Waters, Milford, MA, USA). The
were purchased from Sigma-Aldrich (Stockholm, Sweden). optimum operating parameters of the electrospray ionization interface
in positive mode were as follows: nebulizer, 40 psi; dry gas, 9 liters/min;
Animal experiment dry temperature, 350°C; capillary voltage, 4000 V; delta electron
All animal experiments were performed according to the European multiplier voltage, 300 V. Column eluate was switched 0 to 0.9 min
Communities Council directive of 24 November 1986 (86/609/EEC) to waste and 0.9 to 3.8 min to the mass spectrometer. Quantitation
revised in 2010 (2010/63/EU) for laboratory animal care in an Asso- was achieved using multiple reaction monitoring mode. The precursor–
ciation for Assessment and Accreditation of Laboratory Animal to–product ion transitions were mass/charge ratio (m/z) 198.1 to
Care International-accredited facility after acceptance of study 152.0 for l-DOPA and m/z 212.1 to 152.0 for 3-methyl-DOPA
design by the Institute of Lab Animal Science (Chinese Academy (fragmentor, 70 V; collision energy, 10 V). The limit of quantitation
of Science, Beijing, China) Institutional Animal Care and Use for l-DOPA was 100 ng/ml.
Committee for experiments on nonhuman primates. A skilled and
experienced veterinarian supervised the maintenance and care of Experimental design
animals. While designing the experiment, several aspects were considered to
The brain tissues analyzed in the current study were obtained minimize the technical variability, which can arise during sample
from a previously published biobank (16–18). The biobank con- preparation and data acquisition. A standard protocol was used
sists of female rhesus monkeys (Macaca mulatta, Xierxin, PR of during all sample preparations, and the MALDI-MSI data acquisi-
China) of age 5 ± 1 years and mean weight 5.3 ± 0.8 kg. Parkinson- tion method was kept the same in all experiments. Only two brain
ism was induced according to a published procedure (25, 57). tissue sections could be analyzed in the same MALDI-MSI experi-
Monkeys were given daily injections of MPTP (0.2 mg/kg, intra- ment because of their large size. Therefore, we analyzed first a batch
venously) until stabilization of parkinsonian symptoms. Control of non-LID and LID samples by randomly pairing one section from
animals received vehicle (saline, intravenously) for a comparable each group. A second batch was analyzed where control and MPTP
amount of time as the MPTP exposure. The degree of parkinsonism samples were paired. The time between experiments was kept to a
was assessed using a clinical rating scale optimized for macaques minimum, each experiment lasting on average 32 hours. As a quality
(58). The animals in the MPTP group received no further treat- control measure, deuterium-labeled standards were spotted in a
ment. Animals receiving chronic l-DOPA treatment (20 mg/kg orally, mixture on the glass slide next to the tissue section. MALDI-MSI
twice daily) received l-DOPA commencing 3 months after the first data were acquired from these standards both before and after data
day of MPTP treatment. The severity of dyskinesia was assessed acquisition from the brain tissue samples. These data were used to
using a dyskinesia disability scale during a 3-month treatment evaluate intensity changes over time within acquisitions.
period (59). On the basis of the rating, animals were assigned to
groups, where animals scoring zero were assigned to the non- Sample preparation
LID group (n = 6 for brain tissue sections analyzed with MALDI- A mixture of deuterium-labeled standards was prepared with con-
MSI and n = 4 for CSF and plasma bioanalysis) and animals scoring centration of 2.5 mM for Tyr-d2, 10 mM for GABA-d6, and 0.1 mM
above zero were assigned to the LID group (n = 6 for brain tissue for DA-d4, 3-MT-d4, NE-d6, and l-DOPA-d3 in 50% methanol in
sections analyzed with MALDI-MSI and n = 4 for CSF and plasma water. Coronal sections 4 mm posterior to the ac (−4 mm ac) were
bioanalysis). For the chronically l-DOPA–treated groups (non- used for relative quantitation. This level was chosen because of fea-
LID and LID), one last l-DOPA dose was administered 1 hour sibility of studying the following regions of interest: Put, Cd, GP,
before euthanizing the animals with an overdose of pentobarbital thalamus, hypothalamus, amygdala, and StT, as well as hippocampus
Fridjonsdottir et al., Sci. Adv. 2021; 7 : eabe5948 6 January 2021 11 of 14SCIENCE ADVANCES | RESEARCH ARTICLE
and eight regions of the cerebral cortex including the PrG that con- imported into SCiLS Lab (Bruker Daltonics, Bremen, v.2019c Pro)
tains the primary motor cortex, PoG, ACgG, insula, TG, and Ent. and merged into a single file. An initial dataset including only non-
Samples from −6 mm ac were used as technical replicates. In addi- LID and LID was created for extensive investigation of the differ-
tion, samples at −2, 0, and +4 mm ac were imaged to visualize further ences between these two groups in 18 brain regions. Later, a dataset
the anterior parts of the striatum. Frozen brains were sectioned at including all four experimental groups—control, MPTP, non-LID,
12 m thickness on a Leica CM3050S cryostat (Leica Microsystems, and LID—was created for investigation of 10 regions. Import param-
Wetzlar, Germany) at −20°C, thaw-mounted onto indium tin oxide– eters were as follows: axis interpolation mode was exponential, and
coated glass slides (Bruker Daltonics, Bremen, Germany), and stored average data point accuracy was 0.60 mDa, leading to a number of
at −80°C before analysis. On the day of analysis, samples were 2.249.159 resulting data points.
brought to room temperature in a desiccator. After 30 min in the To explore the technical variability and presence of possible out-
desiccator, the deuterium-labeled standard solution was spotted on liers in the non-LID and LID data, a mass list with the 2488 most
the glass slide (two spots, 0.2 l) next to the tissue section for quality intense peaks was exported through the report table function in
control. The on-tissue derivatization was performed according to a SCiLS Lab. Area under curve (AUC) and maximum intensity values
published protocol (15). Briefly, a solution with concentration were extracted, both without normalization and normalized to root
(1.8 mg/ml) of FMP-10 in 70% acetonitrile was sprayed over the mean square (RMS) of all data points. These data were used to
tissue sections with a robotic sprayer (TM-Sprayer, HTX-Technologies). investigate technical variability with PCA (fig. S6; SIMCA, v.15,
Parameters of the spraying method were as follows: temperature, Sartorius Stedim Biotech, Umeå, Sweden) and boxplots (RStudio,
80°C; flow rate, 80 l/min; nozzle velocity, 1100 mm/min; track v.1.1.383, RStudio Team, Boston, MA, USA). This mass list was also
Downloaded from http://advances.sciencemag.org/ on February 11, 2021
spacing, 2.0 mm; N2 pressure, 6 psi; number of passes, 30. After used to calculate coefficient of variation for every sample in the
matrix application, the two slides were put in a MALDI slide adapter non-LID and LID groups.
(Bruker Daltonics, Bremen) and scanned using a flatbed optical scanner A separate SCiLS file was created from the data acquired from
(Epson Perfection V500, Japan). the deuterated standards run before and after acquisition of tissue
samples. The processing parameters were the same as for the tissue
Data acquisition experiments: average data point accuracy 0.60 mDa and 2.249.159
All MSI experiments were carried out on a MALDI-FTICR MS resulting data points. Ion signals arising from the deuterated stan-
instrument (Solarix 7T-2, Bruker Daltonics). Before analysis, the dards were used to evaluate intensity changes over time and between
method was calibrated with red phosphorus. Mass range scanned experiments performed on non-LID and LID samples (fig. S7).
was m/z 150 to 1500, and Q1 mass was set to m/z 378. Transient size
of 2M and quadrature phase detection of 2 were used to achieve Statistical analysis
the minimum acquisition time with sufficient mass resolution. The Student’s t test was used to compare plasma and CSF concentrations
time-of-flight value was set to 0.700 ms, and transfer optics frequency between groups. The correlation between plasma and CSF samples
was 4 MHz. The small laser was used, and spectra were collected by was calculated with LR passing through the origin, and coefficients
firing 100 shots per pixel. Samples were run at 150-m lateral reso- of determination were calculated to quantify the strength of the re-
lution for relative quantitation in positive ion mode. Online calibra- lationship between the variables (GraphPad Prism v.8.4, GraphPad
tion was performed using m/z 555.2231, an abundant ion cluster Software, La Jolla, CA, USA).
signal of FMP-10. Additional experiments were performed at high- Brain regions were annotated in SCiLS Lab according to a
er lateral resolution varying from 50 to 80 m for certain brain ar- macaque brain atlas (61). The 14 targeted metabolites were man-
eas. These included either samples that were rerun from previous ually peak-picked (table S1). RMS-normalized AUC values were
experiment or samples at other coronal brain levels. exported from SCiLS Lab via the report table function and log2-
transformed for all metabolites in all brain regions for relative
Identification of metabolites quantitation.
Accurate mass was used for identification in addition to on-plate A sample was considered an outlier if the mean of the sample
standards and on-tissue MS/MS for metabolites with high enough was outside the average interquartile range of all samples. No whole
signal and mass resolution to be isolated and fragmented. The MS/ sample was excluded (fig. S8). However, because of differences be-
MS spectra from standards were compared to MS/MS spectra ob- tween individual brain sections, some regions were not present on
tained from tissue using DataAnalysis (Bruker Daltonics, Bremen, all tissue sections, reducing the number (n) in the statistical analysis
v.4.2). An optimal fragmentation energy was adjusted for each in the following brain areas: hippocampus in non-LID, n = 5; PoG
compound, and a blank sample was collected as a negative control in non-LID, n = 3; PoG in LID, n = 5. A Shapiro-Wilk normality test
to identify fragments matching between standards and tissue. In ad- was performed to determine whether to use a parametric or non-
dition, the metabolites were identified by their anatomical distribu- parametric hypothesis test. A Student’s t test or nonparametric
tion. Furthermore, because multiple signals can arise from a single Mann-Whitney U test was performed to test for differences between
metabolite, depending on the metabolite’s ability to be derivatized non-LID and LID in 18 brain regions; of 0.05 was used (SPSS, IBM,
(number of primary amines and/or phenol groups), all possible Armok, v.22.0). A one-way analysis of variance (ANOVA) with a Tukey’s
signals form each metabolite were evaluated, considering possible multiple comparisons post hoc test was used to compare all four groups
overlapping signals and their signal-to-noise values (15). (control, MPTP, non-LID, and LID) in RStudio. Log2FC was calcu-
lated as the log2 of the ratio (metabolite AUC in LID)/(metabolite
Data processing AUC in non-LID), and the color scale was created in Excel.
Data were initially visualized in flexImaging (Bruker Daltonics, LR analysis was computed in RStudio. AUC values were log2-
Bremen, v.5.0). For relative quantitation, all experiments were transformed to obtain normality. Metabolites in particular brain
Fridjonsdottir et al., Sci. Adv. 2021; 7 : eabe5948 6 January 2021 12 of 14You can also read