Annual aboveground carbon uptake enhancements from assisted gene flow in boreal black spruce forests are not long-lasting - Nature
←
→
Page content transcription
If your browser does not render page correctly, please read the page content below
ARTICLE
                  https://doi.org/10.1038/s41467-021-21222-3                 OPEN

                  Annual aboveground carbon uptake enhancements
                  from assisted gene flow in boreal black spruce
                  forests are not long-lasting
                  Martin P. Girardin1,2 ✉, Nathalie Isabel1,3, Xiao Jing Guo1, Manuel Lamothe                                   1,   Isabelle Duchesne4 &
                  Patrick Lenz3,4
1234567890():,;

                  Assisted gene flow between populations has been proposed as an adaptive forest manage-
                  ment strategy that could contribute to the sequestration of carbon. Here we provide an
                  assessment of the mitigation potential of assisted gene flow in 46 populations of the
                  widespread boreal conifer Picea mariana, grown in two 42-year-old common garden experi-
                  ments and established in contrasting Canadian boreal regions. We use a dendroecological
                  approach taking into account phylogeographic structure to retrospectively analyse population
                  phenotypic variability in annual aboveground net primary productivity (NPP). We compare
                  population NPP phenotypes to detect signals of adaptive variation and/or the presence of
                  phenotypic clines across tree lifespans, and assess genotype‐by‐environment interactions by
                  evaluating climate and NPP relationships. Our results show a positive effect of assisted gene
                  flow for a period of approximately 15 years following planting, after which there was little to
                  no effect. Although not long lasting, well-informed assisted gene flow could accelerate the
                  transition from carbon source to carbon sink after disturbance.

                  1 Natural Resources Canada, Canadian Forest Service, Laurentian Forestry Centre, Québec, QC, Canada. 2 Centre d’étude de la forêt, Université du Québec à

                  Montréal, Montréal, QC, Canada. 3 Canada Research Chair in Forest Genomics, Faculté de Foresterie, de Géographie et de Géomatique, Université Laval,
                  Québec, QC, Canada. 4 Natural Resources Canada, Canadian Wood Fibre Centre, Québec, QC, Canada. ✉email: martin.girardin@canada.ca

                  NATURE COMMUNICATIONS | (2021)12:1169 | https://doi.org/10.1038/s41467-021-21222-3 | www.nature.com/naturecommunications                               1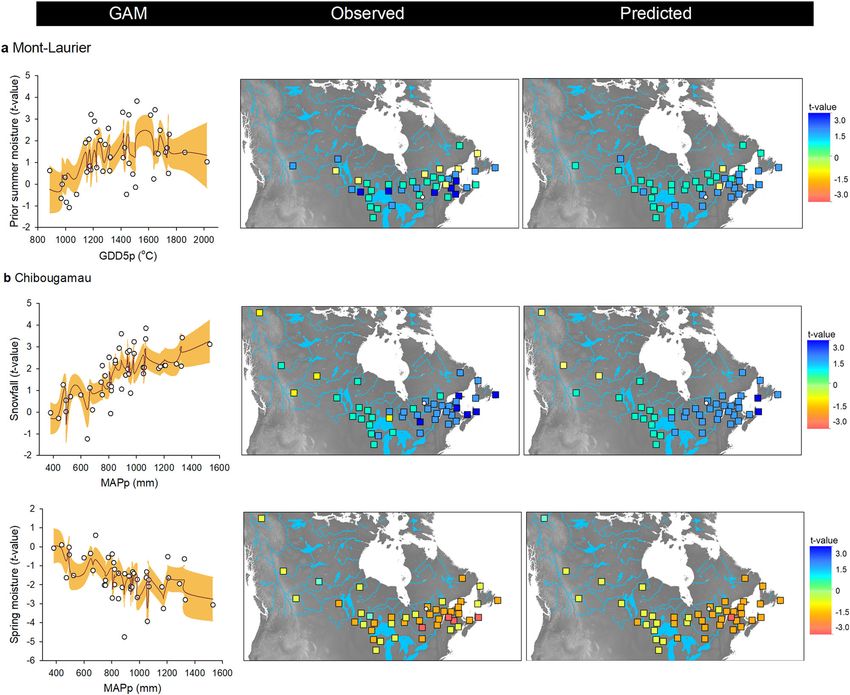
ARTICLE                                                                   NATURE COMMUNICATIONS | https://doi.org/10.1038/s41467-021-21222-3

T
       he twentieth century was a pivotal period as it marked the             pressures) and minimal genetic baseline information that are also
       onset of a rapid increase in global average temperature                essential before assisted gene flow deployment.
       associated with major anthropogenic changes in atmo-                      Within today’s climate context, mature common gardens offer
spheric composition1. At high boreal latitudes, prominent effects             the opportunity to determine the degree of population/lineage
included more persistent weather patterns with an increased                   differentiation for adaptive traits (phenotypes) and the genetic
probability of long-lasting extreme weather events, such as                   basis of local adaptation (for a review see refs. 29,30). This
summer heat waves, droughts, and frosts2,3. Countries have                    information is a prerequisite to inform species-specific assisted
agreed that large net global greenhouse gas (GHG) emission                    gene flow16. Common garden experiments that gather a repre-
reductions (i.e., the sum of gross emissions to the atmosphere                sentative sample of populations from a species’ range were
plus removals of carbon from the atmosphere) are required to                  established starting in the 1960s for a number of boreal and
hold this warming to less than 2 °C above pre-industrial levels.              temperate Canadian tree species31,32. They were originally
This level is considered the most the Earth could tolerate without            designed to quantify phenotypic differences among populations
risking catastrophic changes to ecosystem health and human                    and to identify optimal (performant and adapted) seed sources
safety4. Mitigation efforts that limit future growth in GHG                   for reforestation. The replication of provenances within and
emissions will lessen climate change and reduce the adaptation                across sites allows the gauging of tree fitness with dendrometric
required by societies5.                                                       traits like diameter and height and survival rate, while controlling
   Forest-related measures such as afforestation, reforestation,              for environmental factors33–36.
forest restoration, increasing tree cover, and enhancement of                    Lately, the retrospective study of tree rings in common garden
forest carbon stocks have a significant role to play in mitigation             experiments and their linkages with climate variability (i.e. the
efforts6–10. However, the effects of global warming on tree growth            science of dendroecology) allowed the determination of species-
are already being observed11–14 and forest trees are showing signs            specific climatic drivers and comparisons of population/tree
of maladaptation at a regional scale15. To help increase the                  responses22,37. Therefore, the level of intraspecific variability of
adaptive capacity of vulnerable tree populations, human-assisted              tree responses (e.g. recovery after drought stress) and/or potential
movement of tree species’ populations via assisted gene flow, i.e.             population divergence of adaptive nature can be detected22.
the migration of pre-adapted alleles/genotypes, is envisioned15,16.           Nevertheless, an important drawback from conventional tree-ring
While assisted gene flow, as an adaptive measure, could help                   studies lies in the fact that decisive factors such as tree density and
maintain and even enhance the health and growth of forests, it                mortality are generally not taken into account20,37,38. This
might also contribute to climate mitigation through more per-                 drawback needs to be addressed for these studies to be repre-
manent sequestration of forest carbon17,18. Notably, by influen-               sentative of the mitigation potential that is forest productivity.
cing the rates of tree survival and growth, assisted gene flow could           This limitation could be overcome by coupling tree-ring mea-
help increase the carbon stored during stand development.                     surements with periodic sampling of forest stand attributes and
   To succeed, mitigation based on forestry solutions requires a              scaling to annual forest stand productivity using allometric
long-term vision that is almost as long as the life cycle of a tree to        equations39,40. By doing so, we suggest integrating the various
avoid maladaptation, mortality, and plantation failure. The                   traits outlined above into a single metric to describe each popu-
foremost drivers of tree growth performance and survival, whe-                lation (i.e. the amount of annual aboveground carbon increment
ther it is abiotic or biotic stress (e.g. late frost, drought, defolia-       or net primary productivity, NPP) which is more relevant to
tion, etc.), or their cumulative impacts along a tree’s lifespan have         climate mitigation.
to be identified and taken into account19–22. Even adaptive                       Here, we show evidence that standing genetic adaptive varia-
measures such as assisted gene flow carry the risks of negative                tion resulting from past and contemporary selection for climate
feedback on carbon if relocated genotypes (as a group of indivi-              has a significant but non-lasting role in the aboveground carbon-
duals) are exposed to climatic stresses for which they are not                uptake capacity of forest stands. Black spruce (BS) (Picea mariana
adapted16,17,23. Reduced carbon uptake in trees growing under                 (Mill.) B.S.P.) is a boreal foundation and resource-production
climatic stresses12,24 and increased release of carbon via                    species that could be a potential candidate for assisted gene
mortality25,26 could offset benefits of mitigation activities aimed            flow16. In order to assess the mitigation potential of assisted gene
at the enhancement of forest carbon stocks17.                                 flow, we measured the variability in the annual aboveground NPP
   As aforementioned, mitigation and adaptation goals have dif-               (carbon uptake) of 46 BS populations representative of the species
ferent spatial and temporal scales27. The primary objective of                range and of its phylogeographic structure (Fig. 1a). The NPP
mitigation is to enhance absorption of atmospheric carbon that                composite phenotype estimated for each population provides the
should result in global benefits in the long term. Adaptation                  means to integrate growth productivity, tree competition among
measures, such as assisted gene flow, could be effective rapidly               individuals from the same provenance/lineage, and mortality over
and yield benefits by reducing tree vulnerability to climate                   the tree’s lifespan. We then looked for signals of divergent
change. Whether there is potential for climate mitigation with                adaptive variations (historical and contemporary) and the pre-
assisted gene flow requires an interdisciplinary framework to                  sence of phenotypic clines across the species range. We also
determine tree productivity (i.e. carbon (C) unit per area). This             assessed population-by-environment interactions by evaluating
framework should comprise several dimensions taking into                      climate–NPP phenotype relationships across populations and
account all relevant information for a given species. The total               common gardens. This approach allows identifying climatic
amount of carbon stored in trees depends on their growth                      constraints that limit carbon accumulation in BS while detecting a
responses to climate fluctuations and biotic factors during their              lineage effect (historical adaptation) on tree productivity. Finally,
lifetime and, more importantly, their resulting survival/mortality.           we illustrate how adaptive traits (summed as NPP) respond to
This is influenced by the adaptive capacity (standing genetic                  climate and vary among populations from juvenile to mature
variation and plasticity) of contemporary species and popula-                 stages.
tions, which has been shaped by past evolutionary processes and
demographic history28,29. Hence, assessing the mitigation
potential of trees at the stand level (i.e. a group of individuals of         Results
the same geographic origin competing for the same resources)                  We examined 51,029 tree rings from 1560 trees growing since
requires both species’ sensitivity to climate (climatic selective             1974 in two common gardens located at Mont-Laurier and

2                 NATURE COMMUNICATIONS | (2021)12:1169 | https://doi.org/10.1038/s41467-021-21222-3 | www.nature.com/naturecommunications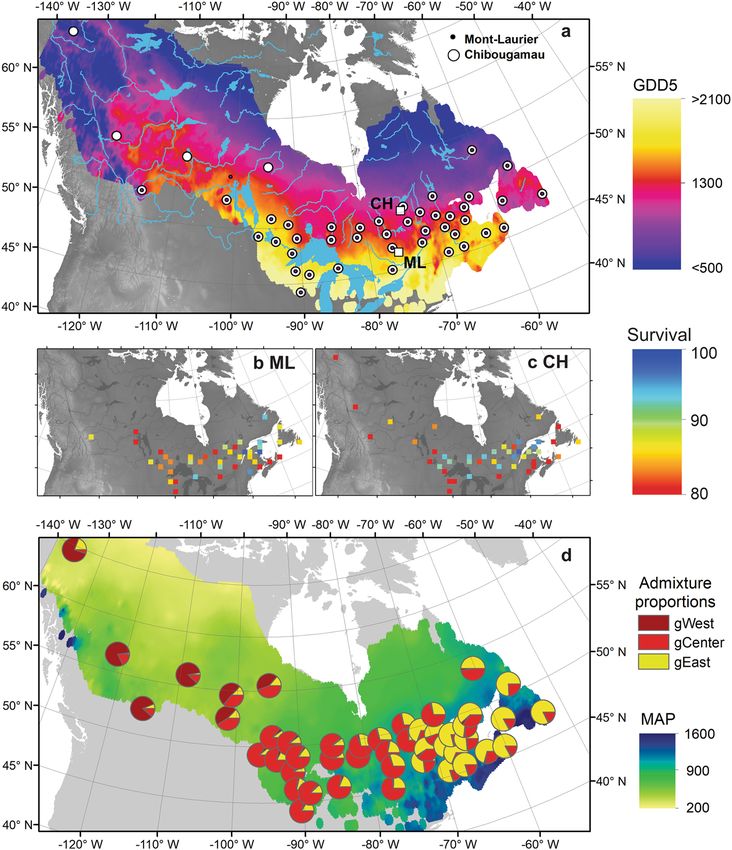
NATURE COMMUNICATIONS | https://doi.org/10.1038/s41467-021-21222-3                                                                   ARTICLE

Fig. 1 Origin of sampled black spruce provenances. a Squares: Locations of the Mont-Laurier (ML) and Chibougamau (CH) common gardens along with
the locations of the black spruce seed origins (dots), superposed on the species’ range limits90. Background colors: mean annual growing degree days
above 5 °C (GDD5, °C) computed over 1961–1990. b, c Percent survival (%) of individuals as of year of sampling in each common garden as a function of
the seed provenance distribution. d Pie chart: Averaged genetic admixture proportions on a given cluster corresponding to Western (gWest), Central
(gCenter), and Eastern (gEast) lineages. The admixture proportions are used as a proxy to describe among population genetic differences. Background
colors: mean annual precipitation (MAP, mm).

Chibougamau (Fig. 1a). Trees originated from 46 provenances                      period of approximately 15 years after planting (Fig. 2, time-series
representative of the BS distribution range (Fig. 1a and Supple-                 plots; unpaired Student’s t-test for mean differences of TotalC
mentary Data 1). Overall, trees from both sites showed identical                 between sites in 1984: P < 0.001). The productivity differences
gene diversity estimates (Ho = 0.29 and Hs = 0.29 for the 41                     between the two sites then diminished in the subsequent years. At
provenances in common; Supplementary Table 1). Based on the                      the end of the studied period (after 42 years), both sites had only
1628 trees genotyped from 67 populations to cover the species                    a slightly different amount of stored aboveground carbon: TotalC
range, there were three main smoothly integrated genetic clusters                averaged across all Mont-Laurier populations in 2015 was 4.3 kg
that corresponded to the phylogeographic structure observed by                   C m−2 (s.d. 1.0), while it was 3.9 kg C m−2 at Chibougamau (s.d.
Jaramillo-Correa et al.41 and Gérardi et al.42, hereafter named                  1.2) (Student’s t-test for 2015 TotalC: P = 0.033).
Western, Central, and Eastern lineages (Fig. 1d). This genetic                      Large differences in the amount of aboveground carbon stored
structure was taken into account for the remaining analyses (see                 by each population were observed for both sites. For example, the
“Methods” section and Supplementary Data 2).                                     most productive population at the Mont-Laurier site had a TotalC
                                                                                 in 1984 (0.176 kg C m−2) estimated to be 1536% higher than the
                                                                                 least (0.011 kg C m−2) productive population. The same holds
Productivity (aboveground NPP and TotalC) is population-                         true for the Chibougamau site, with a ratio of 1069% between the
dependent. During the 2007 census that preceded our sampling                     most (0.086 kg C m−2) and the least (0.008 kg C m−2) productive
campaign, the median survival rate by population was 90% at                      populations (Supplementary Data 3). In most cases, the
Mont-Laurier and 92% at Chibougamau. Survival had decreased                      performance ranking of populations was not constant over time:
to 85% at both sites according to our recent census of 2015‒2016                 highly productive populations at the juvenile stage sometimes
(Fig. 1b, c, middle maps). Overall, aboveground NPP and TotalC                   ended up among the least productive at the mature stage, and
tended to be higher at the southern site, i.e. Mont-Laurier, for a               populations having low productivity at the juvenile stage showed

NATURE COMMUNICATIONS | (2021)12:1169 | https://doi.org/10.1038/s41467-021-21222-3 | www.nature.com/naturecommunications                           3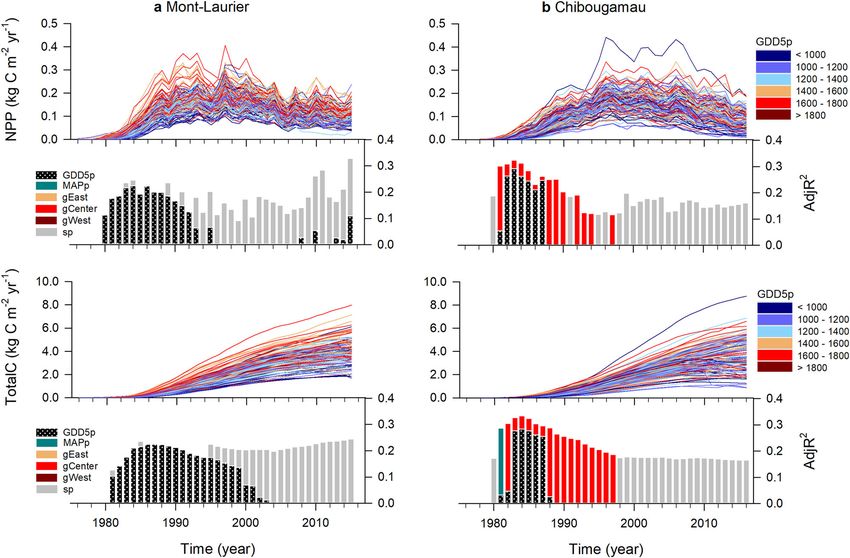
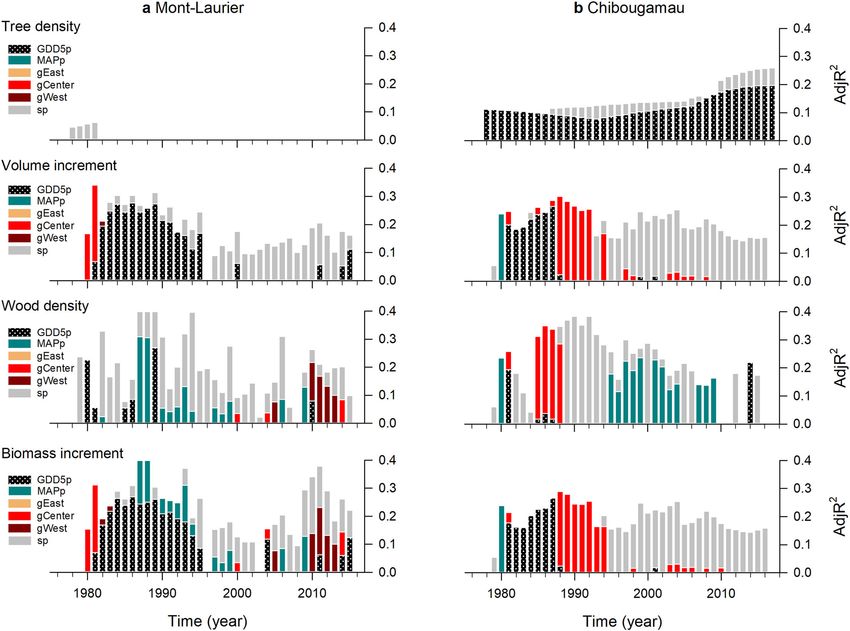
ARTICLE                                                                    NATURE COMMUNICATIONS | https://doi.org/10.1038/s41467-021-21222-3

Fig. 2 Annual changes in composite phenotypes. Time-series plots: annual aboveground net primary production (NPP) and total carbon (TotalC, i.e.
cumulated NPP), at the population level by block, at the a Mont-Laurier and b Chibougamau common garden sites. The color scheme indicates the mean
annual growing degree days above 5 °C at provenance (GDD5p) seed sources. Vertical bars: Results of generalized additive models (GAM) for population
differentiation and clinal variations in annual NPP. A high adjusted R2 (AdjR2) value denotes a high goodness-of-fit between NPP and the explanatory
variables GDD5p, mean annual precipitation (MAPp), admixture proportions along Western, Central, and Eastern genetic clusters (gWest, gCenter, gEast),
and spatial factors (sp) represented by the distance-based Moran’s eigenvector maps. The number of sampled independent populations in GAM analysis
was n = 42 for Mont-Laurier and n = 45 for Chibougamau, each having three replicates. All shown variables are significant at the two-sided 5% level.

high annual productivity levels at the mature stage (Table 1).                 Population aboveground NPP exhibits different climate sen-
These changes in annual aboveground productivity contributed                   sitivities. The analysis of interannual variability of population-
to reducing disparities between populations in the total amount of             level aboveground NPP in relation to climatic fluctuations enables
aboveground carbon sequestered over time. By 2015, the most                    the identification of climatic limitations acting upon productivity.
productive population at the Chibougamau site had a TotalC                     The goodness-of-fit statistics for the GAMMs (Eq. 5) were high
(5.348 kg C m−2) estimated to be 226% higher than the least                    and averaged to R2 = 0.97 and R2 = 0.98 for the Mont-Laurier
(2.366 kg C m−2) productive population. The same holds true for                and Chibougamau sites, respectively (Supplementary Table 3).
the Mont-Laurier site, with a ratio of 302% between the most                   Accordingly, the two sites showed very different distributions for
(6.519 kg C m−2) and the least (2.161 kg C m−2) productive                     their populations’ responses to climate (CStraits; Fig. 3, check-
populations (Supplementary Data 3).                                            erboard plots). Populations established at the Mont-Laurier site
   Within sites, the population-by-block NPP time-series exhib-                exhibited evidence of water limitations (μClimlim = ‒6.06 ± 2.27 s.
ited similar interannual variability (i.e. fluctuations around the              d.), whereas populations at the Chibougamau site exhibited a
mean; Fig. 2, time-series plot). The means of the pairwise                     positive dependence on temperature (μClimlim = 7.83 ± 1.96 s.d.)
correlations were, respectively, 0.80 and 0.89 for the Mont-                   (Table 1 and Fig. 4).
Laurier and Chibougamau sites (0.68 and 0.60 after first-                          Specifically, the positive influence of a lengthening of the
difference transformations). Noteworthy, the values of these                   growing season on annual NPP was made evident by the positive
pairwise correlations tended to be higher when computed                        correlations between population annual NPP and fall, winter,
between provenances that had smaller geographic distances                      spring and summer temperatures at the Chibougamau site
(Mont-Laurier Mantel test combined P = 0.029; Chibougamau                      (Fig. 3b). At the Mont-Laurier site, this sensitivity to temperature
combined P = 0.007; Supplementary Table 2). Provenances that                   was limited to the winter season for the vast majority of
were farther apart had NPP time-series that were more weakly                   the sampled populations (Fig. 3a). Furthermore, what appears to
correlated. Hence, these results suggest the existence of gradients            be unique to the Mont-Laurier site is the dominant-negative
in the synchronicity of year-to-year fluctuations in aboveground                correlation between NPP and temperature in the summer of
NPP that are linked to the geographical distances of the                       the year preceding growth, and in the spring and summer during
provenances.                                                                   the year of growth (Fig. 3a). Positive correlations with soil

4                  NATURE COMMUNICATIONS | (2021)12:1169 | https://doi.org/10.1038/s41467-021-21222-3 | www.nature.com/naturecommunications
NATURE COMMUNICATIONS | https://doi.org/10.1038/s41467-021-21222-3 ARTICLE
Table 1 Annual net primary productivity (NPP) by provenance and common garden, averaged over 1980–1984 and 2011–2015.
Garden Mont-Laurier Chibougamau
Year 1980–1984 2011–2015 1980–1984 2011–2015
Variable NPP Rank NPP Rank ClimLim NPP Rank NPP Rank ClimLim
Provenance (kg C m−2 (unitless) (kg C m−2 (unitless) (unitless) (kg C m−2 (unitless) (kg C m−2 (unitless) (unitless)
yr−1) yr−1) yr−1) yr−1)
321 0.025 11 0.095 29 −8.069 0.014 8 0.092 26 8.609
325 0.020 22 0.100 25 −3.971 0.006 31 0.116 14 7.183
326 0.020 18 0.097 27 −4.013 0.009 19 0.143 4 (low) 8.176
329 0.008 40 (high) 0.126 7 −6.679 0.002 44 (high) 0.119 11 7.728
332 0.011 34 0.126 8 −7.109 0.011 13 0.080 36 11.215
333 0.027 7 0.073 38 (high) −5.331 0.005 36 0.118 13 6.820
336 0.014 28 0.098 26 −6.257 0.007 26 0.093 25 9.859
338 0.028 6 0.127 5 (low) −4.046 0.012 12 0.141 5 (low) 12.851
342 0.008 39 0.122 11 −4.468 0.007 28 0.150 1 (low) 5.572
345 0.007 41 (high) 0.117 13 −3.948 0.004 38 0.145 2 (low) 8.722
352 0.010 37 0.116 14 −7.630 0.006 30 0.125 9 9.669
355 0.012 31 0.111 18 −4.687 0.007 27 0.105 21 8.536
369 0.014 27 0.127 4 (low) −8.915 0.004 40 0.112 16 5.753
1329 0.016 25 0.123 10 −6.623 0.014 6 0.125 10 7.519
1528 0.028 5 (low) 0.100 24 −9.407 0.010 17 0.110 17 9.742
1530 0.011 32 0.076 36 −10.184 0.008 22 0.085 35 7.631
1531 0.025 12 0.108 19 −7.298 0.010 16 0.077 37 3.995
1534 0.020 19 0.107 21 −4.775 0.007 25 0.114 15 9.537
1538 0.034 2 (low) 0.172 1 (low) −9.443 0.006 29 0.144 3 (low) 9.364
3268 0.015 26 0.055 42 (high) −2.377 0.006 34 0.057 42 (high) 5.002
4277 0.012 30 0.094 30 (high) −8.009 0.015 3 (low) 0.073 38 7.767
4344 0.021 17 0.063 41 (high) −7.575 0.016 2 (low) 0.051 43 (high) 11.650
4351 0.023 15 0.146 2 (low) −4.888 0.012 11 0.119 12 7.904
4353 0.030 4 (low) 0.115 15 −6.843 0.014 7 0.110 18 9.143
4360 0.035 1 (low) 0.125 9 −8.163 0.011 14 0.094 23 8.101
6801 0.020 23 0.084 33 −7.101 0.003 42 (high) 0.064 40 5.340
6802 0.018 24 0.107 20 −6.176 0.006 32 0.086 33 5.083
6804 0.002 42 (high) 0.065 40 (high) −5.263 0.004 41 (high) 0.064 39 8.023
6805 0.014 29 0.096 28 −5.510 0.006 33 0.125 7 8.709
6901 0.034 3 (low) 0.126 6 −1.663 0.008 24 0.085 34 7.756
6907 0.020 20 0.102 23 −6.515 0.013 10 0.131 6 10.404
6909 0.011 35 0.112 17 −1.842 0.009 20 0.109 19 7.574
6914 0.021 16 0.090 32 −11.785 0.008 23 0.107 20 7.926
6917 0.026 10 0.119 12 −6.578 0.015 5 (low) 0.089 31 9.732
6922 0.025 14 0.135 3 (low) −5.361 0.017 1 (low) 0.090 28 7.405
6927 0.026 8 0.079 35 −5.090 0.015 4 (low) 0.093 24 7.767
6930 0.026 9 0.114 16 −7.792 0.009 18 0.088 32 6.781
6938 0.020 21 0.091 31 −6.955 0.011 15 0.090 29 8.970
6965 0.011 33 0.079 34 −3.114 0.005 35 0.091 27 6.956
6967 0.002 43 (high) 0.095 22 3.548
6968 0.009 38 (high) 0.075 37 −3.105
6970 0.004 39 0.089 30 6.687
6973 0.025 13 0.103 22 −6.886 0.013 9 0.125 8 6.645
6979 0.010 36 (high) 0.066 39 (high) −3.224 0.008 21 0.060 41 (high) 8.420
6986 0.002 45 (high) 0.041 44 (high) 4.521
7000 −8.069 0.005 37 0.040 45 (high) 5.883
A performance ranking was applied to each provenance and period. The five highest and lowest values are highlighted in parenthesis (respectively high and low) for each garden and period. Also
indicated are climate limitations (ClimLim) on NPP for both sites. Negative values of climate limitations are indicative of low temperature limitations and high water limitations on NPP; positive values are
indicative of high temperature limitations and low water limitations on NPP.
moisture in the summer of the year preceding growth, and in the with the amount of winter snowfall. Of note, populations having
fall of the current year growth, were also observed for many lower temperature limitations at the Chibougamau site were
populations at the Mont-Laurier site. This highlights the positive typically associated with lower aboveground productivity during
influence of summer moisture on productivity. That said, high their juvenile phase; no such tendency was found at the Mont-
moisture during the fall of the year preceding growth and spring Laurier site (Fig. 4).
tended to be associated with a decrease in NPP for many of the
studied populations. This negative relationship to water was a
dominant feature at the Chibougamau site, especially during the Adaptive variation detected in tree-ring traits. Population
summer of the year preceding growth (Fig. 3b). On this same site, aboveground NPP and TotalC exhibited significant, non-linear,
however, many of the populations express a positive relationship relationships with GDD5p in the years following planting
NATURE COMMUNICATIONS | (2021)12:1169 | https://doi.org/10.1038/s41467-021-21222-3 | www.nature.com/naturecommunications 5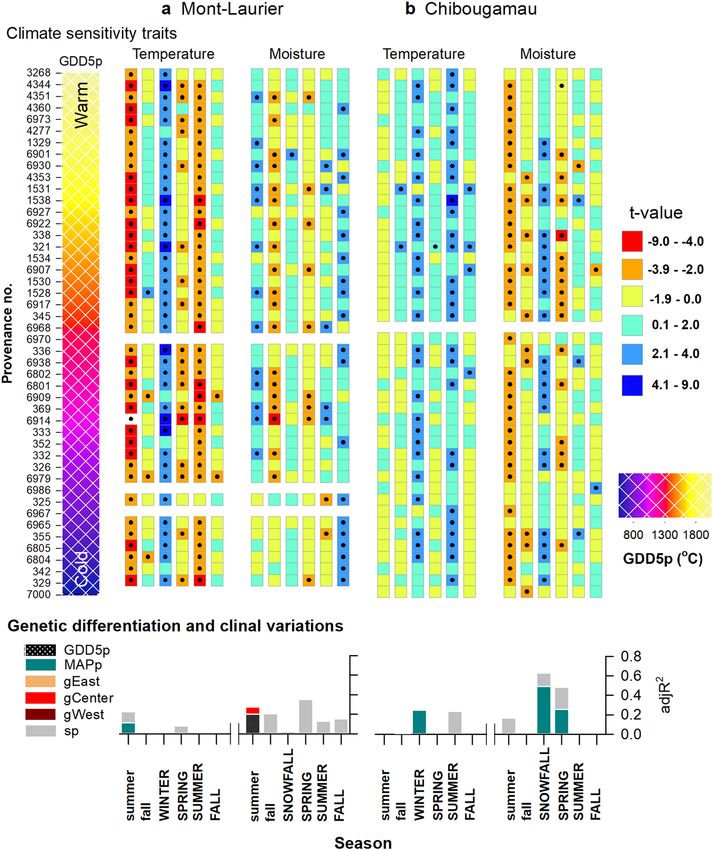
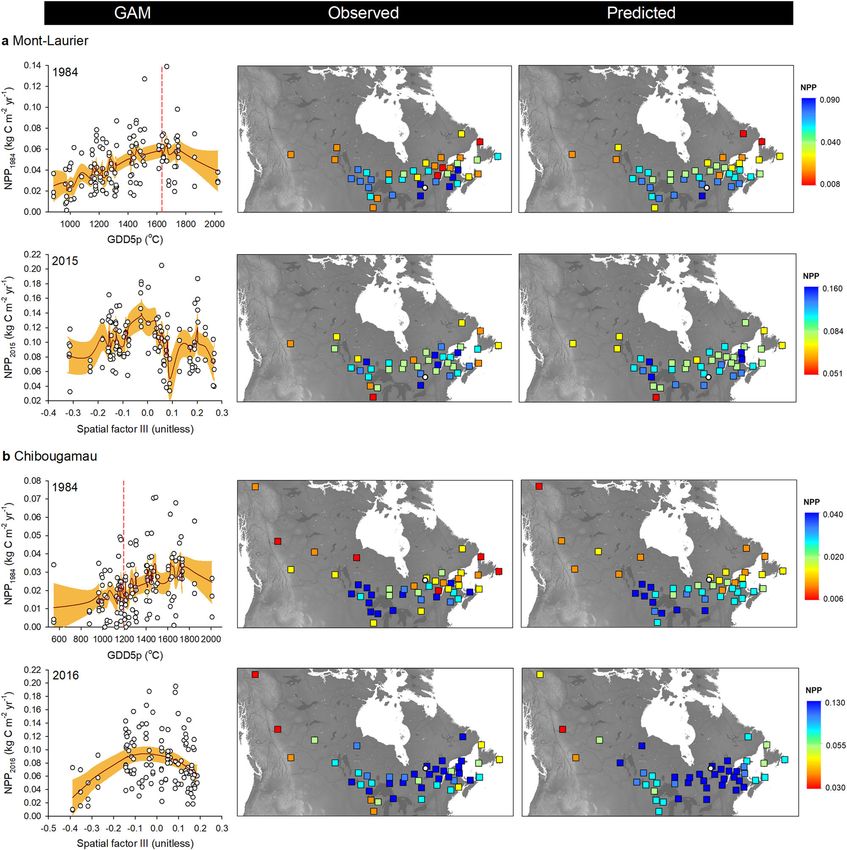
ARTICLE                                                                     NATURE COMMUNICATIONS | https://doi.org/10.1038/s41467-021-21222-3

Fig. 3 Productivity–climate associations. Season–provenance diagrams: climatic sensitivity traits (CStraits), represented by t-value scores of the
generalized additive mixed models (GAMM) linking annual NPP and annual seasonal temperature, soil moisture and snowfall fluctuations, by population
and common garden site a Mont-Laurier (n = 42 independent populations) and b Chibougamau (n = 45 independent populations). A positive influence of a
climate variable on NPP is denoted in blue; a negative influence is denoted in red. The period of analysis was 1976–2016. Studied populations (rows) are
ordered by increasing mean annual growing degree days above 5 °C at provenance (GDD5p; color scale at left from warm to cold; legend at far right)
origin. Seasons in capital letters represent the current year of ring formation; seasons in lower case represent climate variables during the year preceding
ring formation. Significant t-value scores at the 5% level (two sided) are represented by dots. Vertical-bar plots: Tests for genetic differentiation and clinal
variations in t-value scores using generalized additive models (GAM). A high adjR2 value denotes a high goodness-of-fit between NPP and the explanatory
variables GDD5p, mean annual precipitation (MAPp), admixture proportions along Western, Central, and Eastern genetic clusters (gWest, gCenter, gEast),
and spatial factors (sp) represented by the distance-based Moran’s eigenvector maps. All shown variables are significant at the two-sided 5% level.

(Fig. 2, vertical-bar plots; GAM R² up to 0.30). This is indicative              in 1984 varied between 1500 and 1800 °C, which is much higher
of a high degree of variation among populations, both within                     than the GDD5 at the Chibougamau common garden site
and between glacial lineages in association with the climate of                  (1192 °C; Fig. 5b, left column). The climate of origin of these well
the provenance. According to observations and GAM predic-                        performing populations was somewhat similar to that of the
tions, the best-performing populations were local ones at the                    Mont-Laurier site, their distribution being mainly scattered in
Mont-Laurier site. For instance, the GDD5p of populations pre-                   the Great Lakes and Saint-Lawrence River regions (Fig. 5b,
dicted as having had the highest NPP in 1984 were approximated                   middle and right columns). The other environmental variables
to be 1585 to 1735 °C, which is close to the GDD5 at the Mont-                   studied did not prove to be good predictors of productivity,
Laurier common garden site (1635 °C) (Fig. 5a, left column).                     although belonging to the Central lineage (averaged Q-values
Populations showing a good performance originated from seed                      >0.795, except for three populations) (Fig. 1d, pie plot) explained
provenances collected in the Great Lakes and Saint-Lawrence                      a non-negligible part of the Chibougamau NPP variability in the
River regions (Fig. 5a, middle and right columns). Populations                   first 15 years after planting (Fig. 2b, vertical-bar plot).
from colder, northern provenances were predicted to exhibit                         At both sites, and starting about 15 years after planting, we
lower NPP and the distribution of observed values suggests high                  observed a decrease in the relationships between explanatory
variability (Fig. 5a). For the Chibougamau site, the best-                       variables and productivity (Fig. 2a, b, vertical-bar plots). However,
performing populations were clearly non-local ones: the                          the rising importance of spatial factors (typically 15% of variance)
GDD5p of populations predicted as having had the highest NPP                     raises the possibility that unidentified gradients still affect

6                   NATURE COMMUNICATIONS | (2021)12:1169 | https://doi.org/10.1038/s41467-021-21222-3 | www.nature.com/naturecommunications
NATURE COMMUNICATIONS | https://doi.org/10.1038/s41467-021-21222-3 ARTICLE
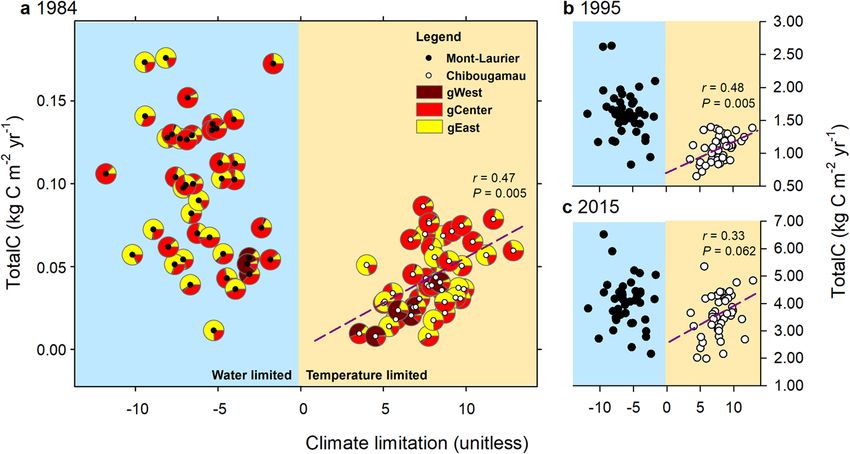
Fig. 4 Graphical summary of climatic sensitivity traits presented at the population level in Mont-Laurier and Chibougamau common gardens.
Aboveground total carbon (TotalC) as of years a 1984, b 1995, and c 2015 expressed as a function of overall climate limitation on productivity. Negative
values of climate limitations indicate that productivity is water limited; positive values indicate that productivity is temperature limited. Also plotted in a are
averaged admixture proportions according to Q-values (K = 3) determined for each population (see Fig. 1d). The Pearson correlation r and two-sided
P values at right of each panel indicate the goodness-of-fit between Chibougamau TotalC and climate limitation, for a given year (slopes are represented by
dashed lines). No adjustment was made for multiple comparisons; the presence of spatial autocorrelation was taken into account87. The relationship
suggests that, in the northernmost garden, a shift of a population towards the water-limiting side of the x-axis takes place in parallel with a lower TotalC.
population performance. NPP gradients were particularly strong without any noticeable lineage effect. For the Mont-Laurier site,
at the Mont-Laurier site post-2010 (Fig. 2a), with the best sensitivity of NPP to summer moisture during the year preceding
performing populations during 2015 originating from prove- growth displayed a non-linear relationship with GDD5p, with
nances mostly west of the Great Lakes region and south of the populations from provenances having GDD5p > 1200 °C gener-
Saint-Lawrence River (Fig. 5a, middle and right columns). For ally showing higher positive correlations (Fig. 7a, left column).
Chibougamau, the NPP gradient was instead driven by a few The importance given to spatial factors in explaining variance in
provenances from western regions with low performance (Fig. 5b). the sensitivity of NPP to soil moisture in spring (>30%, Fig. 3a,
Additional analyses in which we substituted the variable GDD5p vertical-bar plot) also raises the possibility that spatial gradients
with other variables (e.g. latitude, longitude, solar radiation, (i.e. dependent on geographic distance) exist in this trait (Fig. 3a).
number of frost days, vapor pressure deficit) were not conclusive. For the Chibougamau site, the strength of the positive association
It should be noted that, according to the models, the location of between NPP and winter snowfall was strongly related with
the best performing provenances is not static during population MAPp in a nearly linear manner: populations that originated
development. It is indeed possible for us to observe a reversal of from southeastern provenances with MAPp > 800 mm exhibited
productivity during the different years analyzed, in particular at the highest dependence upon winter snowfall for gaining optimal
the Chibougamau site (Fig. 5b), where populations that tended to NPP (Fig. 7b). There too, the sensitivity to spring soil moisture
perform poorly at the juvenile stage (e.g. 1984) were among the exhibited spatial dependence (Fig. 3b, vertical-bar plot), with
best performers in later years with higher levels of NPP (e.g. 2016). provenances having MAPp > 800 mm exhibiting the strongest
Sources of population variations in NPP and TotalC can be of negative relationship with the soil moisture index (Fig. 7b).
multiple origins. Here they were distinguished by variations in
wood formation (annual radial increment and wood density) and
by confounding effects of tree mortality (Fig. 6). Accordingly, the Discussion
binc;i , Eq. 1) was Boreal foundation and resource-production species, such as BS,
annual volume increment of a juvenile tree (i.e. V
are potential candidates for the implementation of assisted gene
significantly associated with GPP5p and, to a lesser extent, with flow to maintain forest health and productivity16, and to hope-
an effect of the Central lineage. This was also true when analyzing fully mitigate climate change. Using NPP phenotypes to compare
annual wood density, although the relationships tended to switch populations for their mitigation potential, we found historical
to an expression of MAPp during the mature phase of growth (lineage effect) and present-day adaptive variation to temperature
(Fig. 6). This expression of MAPp was largely offset when (GDD5p) and precipitation (MAPp) over the 42-year growth
combining annual volume increments and wood density into the period. In all cases, the observed population divergence, measured
annual biomass increment (i.e. BM dinc;i , Eq. 3). Any existing in terms of productivity (NPP), played a significant but tempo-
relationship to climate at origin during the mature growth phase rally variable role in determining the aboveground productivity of
disappeared when mortality was considered when scaling to the BS. Additionally, results from the temperature-limited north-
population-level NPP metric (Eq. 4 and Fig. 2). Consequently, the ernmost environment (Chibougamau) showed that BS popula-
analysis of these single phenotypic traits suggests that, in terms of tions differ in their inherent growth potential (corresponding to
quantitative genetics (polygenic architecture of the traits) applied the extent of plasticity32). As a result, southeastern populations
to the context of NPP (network of interacting genes/traits), with higher growth potential showed a higher carbon uptake in
different traits have a different relationship to provenance conjunction with warmer and snowier winters43. In contrast,
climate, where one trait can downweight another one especially results obtained for the climate sensitivity of the populations in
along environmental gradients. the moisture-limited southern environment (Mont-Laurier) were
The analyses of CStraits that cover a 42 year-period (Fig. 3, rather mixed. Although we found advantages with specific pro-
vertical-bar plots) suggest the presence of local adaptation venances showing higher aboveground carbon uptake during the
NATURE COMMUNICATIONS | (2021)12:1169 | https://doi.org/10.1038/s41467-021-21222-3 | www.nature.com/naturecommunications 7ARTICLE NATURE COMMUNICATIONS | https://doi.org/10.1038/s41467-021-21222-3 Fig. 5 Relationships between annual NPP and phenotypic GDD5p clines and spatial factors. Illustrated are the year 1984 (i.e. the 10th year after planting) and the last year of inventory (2015 for a Mont-Laurier and 2016 for b Chibougamau). Biplots at left illustrate observations (white dots) along with generalized additive model (GAM) predictions (red lines), with two-sided 95% confidence intervals (orange shadings). The location of the sampling sites along the GDD5p gradient is illustrated by a vertical dashed line; a provenance that has its value to the left of that line is from a cooler origin than local, and a value that is to the right denotes a warmer origin. The spatial factor illustrated here is the third one, as determined using distance-based Moran’s eigenvector maps. Maps at right illustrate the variability of NPP in coordinate spaces (with the location of the common garden sites illustrated by white circles). juvenile phase, the gains were not guaranteed to last, which was stage that population volumetric increments, NPPs and TotalC especially the case in the harsher environment. Our results exhibited significant relationships with specific genetic lineages highlight a potential for well-informed (based on common garden and climatic factors (GDD5, MAP). For wood density, these experiments and/or genomics data) assisted gene flow as a forest- relationships fluctuated during the tree’s lifespan. Clines in genetic related mitigation activity in this boreal environment15,36. variation of growth and adaptive traits have been previously At each site, large differences were observable in the amount of reported33,44, contributing to trade-offs between productivity stored aboveground carbon (TotalC) among the different BS (height and diameter) and traits determining the length of the populations. Indeed, estimates from our last census suggest a ratio growing season, such as the timing of budset45. This delicate in the order of 300% between the most and the least productive equilibrium between bud phenology and growth is particularly populations. That said, the attribution of performance variance to determinant for adaptation during the juvenile phase, although spatial patterns has produced mixed results. It is at the juvenile very few studies have been conducted on mature trees. In BS, as 8 NATURE COMMUNICATIONS | (2021)12:1169 | https://doi.org/10.1038/s41467-021-21222-3 | www.nature.com/naturecommunications
NATURE COMMUNICATIONS | https://doi.org/10.1038/s41467-021-21222-3                                                                       ARTICLE

Fig. 6 Results of generalized additive models (GAM) for population differentiation and clinal variation in single traits. Illustrated are plot tree density
(n living trees per plot), tree annual volume increment, tree annual wood density, and tree annual biomass increment. The number of sampled independent
populations in the analysis was n = 42 for Mont-Laurier and n = 45 for Chibougamau, each having three replicates. All shown variables are significant at
the two-sided 5% level. See Fig. 2 for definitions.

for other conifer species, most studies that looked at adaptive traits           nonexistent (Fig. 2). This was true for both studied sites and for
were carried out using seedlings and saplings in laboratory or pre-              single trait volumetric increments (Fig. 6). The explanatory
crown closure stand conditions. They are thus comparable with                    variables (lineage, GDD5p and MAPp) saw their predictive power
our analyses conducted on the period covering the first 15 years or               diminished considerably and most often replaced by variables
so after planting. For example, in their study of BS seedlings,                  based on geographic distances (spatial factors, Fig. 2). Both sites
Sniderhan et al.46 found a significant interaction between popu-                  also saw their means of TotalC converge to almost similar
lation and time, with southern populations exhibiting a faster                   quantities with time since planting (Figs. 2 and 4). These findings
growth rate and biomass production than northern populations.                    reinforce the idea proposed by Morgenstern and Mullin31 and
Such a north–south clinal pattern of genetic variation in BS for                 Newton47 that differentiation amongst populations is not static
juvenile height growth is well established in the literature35,47. But           and evolves over time, with populations changing ranks in their
Morgenstern and Mullin31 noted that in most of their studied                     ability to perform (Table 1, Supplementary Data 3 and Supple-
common gardens, populations having fast height growth had                        mentary Fig. 1). A population’s high productivity in its juvenile
undifferentiated survival rates (as also noted in Fig. 6), both                  phase does not necessarily translate into an enhanced pro-
variables having opposite correlations with the length of the                    ductivity and carbon sequestration in the long-term, especially if
growing season, which is the case at the Mont-Laurier and Chi-                   soil fertility is low48. Such attenuation of the local adaptation
bougamau sites. There is thus an important compromise to be                      effect could be reminiscent of recent work indicating an onto-
made between adaptation and mitigation objectives that                           genic (stem size) limit of trees in their capacity to sequester
strengthens the argument of using multiple facets of tree growth.                carbon49,50. Slow growing trees would take longer to reach the
Our results do indicate that individual-tree diameter growth and                 size threshold needed before switching from a growth strategy to
survival gains can be translated into juvenile productivity gains,               a reproductive strategy and then dying; the influence of clinal
with populations originating from the south having greater pro-                  variation would be perceptible for as long as a majority of
ductivity and plasticity at both sites, especially those populations             populations did not reach this threshold. Competition among
from the Great Lakes and the Saint Lawrence River areas (Fig. 5).                individuals arising with the closure of the forest cover, hence
   Starting approximately 15 years after planting, the relationship              limiting resources to all populations, regardless of their origin and
between productivity (NPP phenotypes) and clinal variations (for                 plantation site, would then come into play and contribute to the
GDD5p and MAPp) and genetic lineage became virtually                             reduction of population differentiation.

NATURE COMMUNICATIONS | (2021)12:1169 | https://doi.org/10.1038/s41467-021-21222-3 | www.nature.com/naturecommunications                                 9
ARTICLE                                                                     NATURE COMMUNICATIONS | https://doi.org/10.1038/s41467-021-21222-3

Fig. 7 Relationships between climate sensitivity traits and phenotypic GDD5p and MAPp clines. CStraits are the t-value scores obtained from GAMM
linking NPP and climatic fluctuations for the a Mont-Laurier and b Chibougamau sites (see Fig. 3). Shown is the CStrait for summer moisture during the
year preceding ring formation, snowfall, and spring moisture for the current year ring formation. The farther from zero is the t-score value, the stronger is
the relationship between NPP and the targeted climate variable. Biplots at left illustrate observations (white dots) along with generalized additive model
(GAM) predictions (red lines), with two-sided 95% confidence intervals (orange shadings). Maps at right illustrate the variability of CStraits in
coordinate space.

   The same 41 provenances represented within the two common                    populations are moved into new climatic environments53. When
gardens that harbor the same gene diversity displayed very dif-                 moved into northern environments, the earlier phenology of
ferent climate responses. Those of the southern Mont-Laurier site               southern provenances increases the risk of frost damage to new
were associated with low energy limitation and high water lim-                  emerging needles. Mild winter temperatures and the presence of
itation on NPP, whereas the northern Chibougamau populations                    abundant snowfall provide protection to the buds and ensure
showed evidence of high energy limitation and low water lim-                    optimal productivity in the spring following bud break. It is
itation. Such a “south-to-north” dipolar pattern in climate                     probably this kind of climate selective pressure related to cold
responses is a typical feature of eastern Canada’s boreal                       adaptation that we see most strongly expressed in our populations
landscapes51,52. It is noteworthy that climate response was a                   at the northern Chibougamau site. However, many of these
precursor for the productivity of a population at the northern site:            populations also expressed a negative correlation between NPP
populations having lower temperature limitations had lower                      and spring soil moisture content (Fig. 3). Snow dynamics influ-
amounts of TotalC during the juvenile stage (Fig. 4). This rela-                ence tree growth and climate–growth relationships at boreal
tionship comes from populations originating from warm and                       latitudes, particularly along altitudinal and latitudinal gra-
moist regions (mostly Atlantic) being strongly dependent upon                   dients54–56. While providing protection, high amounts of snow-
the amount of annual snowfall and, to a lesser extent, warm                     fall and a thick spring snow cover can delay snowmelt and the
winter temperatures for increasing NPP (Figs. 3 and 7). The onset               start of the growing season57 (also see Supplementary Fig. 2). The
of productivity in spring is largely defined by bud phenology53.                 negative correlation of NPP to spring moisture may be indicative
Across the wide range of BS populations, productivity reactiva-                 of such an expression58.
tion in spring occurs under different photoperiods, which could                    The study of NPP and TotalC population phenotypes, using
affect the response of bud break to temperature when these                      this extensive collection of BS provenances, has enabled the

10                  NATURE COMMUNICATIONS | (2021)12:1169 | https://doi.org/10.1038/s41467-021-21222-3 | www.nature.com/naturecommunications
NATURE COMMUNICATIONS | https://doi.org/10.1038/s41467-021-21222-3                                                                                ARTICLE

detection of an adaptive signal related to historical and con-                   sequestered in the soil via the development of the root system. For
temporary factors that translates into different performances                    instance, while some provenances may show lower amounts of
among populations in terms of carbon accumulation. The                           aboveground carbon in the juvenile stage, it may be that more is
reconstruction of BS historical migration (phylogeographic                       allocated to root system development. This is a point for which
structure) in combination with a landscape genomic approach                      there is currently no observational data for mature forests. But
has already allowed Prunier et al.59 to identify genes likely                    recently Sniderhan et al.46 pointed out that the ratio of shoot-to-
involved in adaptation to climate (temperature and/or pre-                       root biomass was the same across three different populations of
cipitation) and this, within and between BS lineages. The same                   BS seedlings. Secondly, our study is based on one species and two
authors concluded that standing adaptive genetic variation                       common gardens planted in a limited continental part of the
observed in modern BS populations was a possible outcome of the                  species’ range. The two common gardens may not be repre-
environmental selective pressures acting on different gene pools                 sentative of climate or soil conditions that can be found in the
(glacial refugia). However, no phenotype data were available at                  driest (northwestern Canada) or wettest (Atlantic Maritimes)
that time to corroborate their findings. Our study based on NPP                   parts of North America. As a consequence, it is not clear how
population phenotypes supports their conclusions since we                        NPP phenotypes of the different provenances would compare in
observed adaptive signals related to specific lineages at the Chi-                other parts of the species’ range and thus how assisted gene flow
bougamau site (harsher conditions) during the juvenile pre-                      would impact long-term carbon sequestration therein. Thirdly,
crown closure phase (see explanations below). This result high-                  tree productivity is used here as a proxy for fitness. However,
lights the need to include species’ phylogeographic structure to                 fitness usually refers to the reproductive success and this is dif-
investigate functional phenotypic divergence and better under-                   ficult to assess with trees65. The time elapsed before populations
stand past global change28. Also, extensive gene flow has not                     begin to produce seeds is a factor to be taken into account in an
impeded local adaptation at the micro-scale since adaptive var-                  ecosystem governed by fire disturbances: the selection of prove-
iations measured in terms of productivity (NPP phenotypes) not                   nances for accelerated carbon uptake could jeopardize the ability
related to specific lineages but to climate factors were also                     of the new populations to maintain themselves in the long term if
found22,36. These results reinforce the idea that species with large             reproductive success is low in the face of frequent disturbances66.
distributions should not be considered as homogeneous                            Finally, climate-induced stresses on tree growth and increased
units43,60. Effective adaptive variations translated into phenotypes             mortality under near-term climate change could offset the ben-
that result from past and recent pre-adapted alleles likely exist                efits of mitigation activities aiming at the enhancement of forest
and could be selected to suit a new climate29,43,60. However,                    carbon stocks. Indeed, provenances in this study have been
complex geographic clines in adaptive traits and poor under-                     analyzed based on previous climatic conditions and there is non-
standing of the genetic and physiological mechanisms underlying                  negligible divergence between these and future climate projec-
species’ responses to changing environmental conditions make                     tions anticipated under continuing emissions of GHGs.
the design of assisted gene flow for adaptation and mitigation                       This study built on data obtained from an existing BS common
measures a challenging task36,43,61. In order to inform adaptive                 garden experiment that was considered as a surrogate for an
forest management strategies such as assisted gene flow and to                    assisted gene flow experiment. There is an urgent need to better
increase their likelihood of success, species-specific adaptive                   comprehend the potential impacts of climate change on forest
genetic heterogeneity should be documented to look for future                    tree species. Tree collections such as provenance trials are by far
optimal genetic composition15,36,60,62. Nowadays, baseline genetic               the best materials to use because they permit the assessment of
data and/or genomic resources (including tools) are available for                adaptive phenotypes over a long period of time30. Indeed, it is
more than 2000 tree species and this number is increasing63                      now possible to combine phenotypes obtained from common
(https://treegenesdb.org/). This information, or at least a part of              gardens with genomic approaches to determine the degree of
it, can be used and/or translated into applications and/or adapted               genomic vulnerability of populations and to look for future
to assess mitigation potential of different forest strategies across             optimal genetic composition across the landscape15,60,62. Ulti-
different tree species15,36. Only then will effective carbon storage             mately, process-based models of tree growth and forest carbon
occur when appropriately adapted genotypes inhabit the climates                  allocation24,67 should be parameterized for the different popula-
to which they are genetically suited43.                                          tions62 using as many traits as possible estimated from common
    Tree-ring information integrated over long-time spans and                    gardens and laboratory experiments (such as timing of bud burst
scaled into forest productivity metrics gives a more exact appre-                and bud set, gas exchange, mortality rates, climate sensitivity,
ciation of tree resilience for adaptation purposes and a better idea             etc.). This would allow assessing the mitigation potential of
of carbon accumulation under varying and extreme climates.                       assisted gene flow in the context of long-term exposure to future
Although we found that the benefit of assisted gene flow is not                    climate change.
long lasting across the lifespan of studied trees and populations,
the practice, if well informed with genetic/genomic data, does                   Methods
fulfill one primary goal of mitigation, which is to accelerate the                Experimental sites and sampling. The study took place at two common garden
transition from carbon source to carbon sink after disturbance.                  sites, one established near the city of Mont-Laurier, Québec (Canada, 46.36°N,
Stand-level carbon dynamics in the boreal forest are characterized               75.48°W, elev. 244 m) and the other near the city of Chibougamau (Canada,
                                                                                 50.18°N, 74.18°W, elev. 411 m). The climate of both sites is typically cool con-
by post-disturbance carbon stock declines as heterotrophic                       tinental, with mean annual temperatures of 4.6 and −0.3 °C, growing degree days
respiration losses from dead organic matter and soil carbon pools                >5 °C (GDD5) of 1635 and 1192 °C, and mean annual precipitation totals (MAP)
exceed carbon uptake rates in regrowing forests17,64. Stands revert              of 986 and 924 mm for the Mont-Laurier and Chibougamau sites, respectively
to a carbon sink as tree growth rates accelerate and respiration                 (period of 1981 to 2010). The climate of the northernmost site is hence cooler by
                                                                                 nearly 5 °C but also slightly drier. Mean annual total radiation is estimated at 4570
losses decline some 10–20 years after disturbance. Our results                   and 4418MJ/m² for the two sites, respectively. Surficial deposits at the experimental
suggest that this delay could be substantially reduced by the                    sites are essentially fluvio-glacial sand and sandy granite till for Mont-Laurier and
influence of informed assisted gene flow on the climate sensitivity                shallow granitic glacial till and sand for Chibougamau. A climate warming
of the selected populations and the overall carbon accumulation                  exceeding 2 °C, and mostly occurring post-1997, was estimated for the Mont-
                                                                                 Laurier site; temperatures remained relatively stable at the Chibougamau site
in the aboveground component.                                                    (Supplementary Table 4 and Supplementary Fig. 3).
    There are some nuances to our study. First, it does not provide                  Both common gardens are part of the Range-Wide Provenance Study
an answer relative to the amount of carbon that can be                           initiated in 1967 by the Petawawa National Forestry Institute of the Canadian

NATURE COMMUNICATIONS | (2021)12:1169 | https://doi.org/10.1038/s41467-021-21222-3 | www.nature.com/naturecommunications                                           11
ARTICLE NATURE COMMUNICATIONS | https://doi.org/10.1038/s41467-021-21222-3
Forest Service33. Seeds from 86 provenances of the coniferous Picea mariana were where i represents age and where wood volumes were calculated using the national
collected from 1967 to 1970 across the majority of its range in Canada’s forests and taper models73:
sown in the spring of 1970. Seedlings were planted in the gardens during 1974. The
design of the gardens consisted of six completely randomized blocks, in which bi ¼
X π b2 b2
V d þ di;jþ1 hi;jþ1 hi;j ð2aÞ
16-tree (4 × 4) square plots were established for each of the seed provenances, with j 80; 000 i;j
trees spaced at 2.45 m × 3.05 m at the Mont-Laurier site and 2.40 m × 2.40 m at the
Chibougamau site. There has been no silvicultural intervention (thinning and The term b
dij2 (cm2) is the prediction of the squared diameter at height hij (m)
application of insecticide/herbicide) since planting. For the current study, three using
blocks were randomly chosen for the sampling of 42 and 45 provenances for the
Mont-Laurier and Chibougamau sites, respectively (Supplementary Data 1). The θ
selection of provenances was made so as to maximize the spatial representativeness θ0 dbhi 1 hij hij 2γ
b
dij2 ¼ dbh2i ð2bÞ
of the species distribution while minimizing local redundancy in the seed sources θ
θ0 dbhi 1 1:3 1:3
(Fig. 1). Forty-one provenances were common to both sites. Throughout the
manuscript we use the term “provenance” when referring to the geographic and binc was then converted into annual biomass
where θ0, θ1 and γ are constants. V
climatic origin of a population, and the term “population” when referring to the
dinc;i ; kg) through multiplication with annual mean wood density (ρ):
increments (BM
trees grown from seed sampled at the provenance level (one population per
provenance)68.
To estimate the NPP composite phenotype for a given population, 6–7 living BM binc;i ρ
dinc;i ¼ V
i ð3Þ
trees were selected for sampling in each plot. This approach allows the capture of a
plot level response that mimics a group of trees growing in the same environment Finally, the annual NPP (kg C m−2 yr−1) was estimated for each year t,
and competing for the same resources. The four trees in the plot center were population p, block b and common garden g using
prioritized, with the additional trees sampled being the largest trees of the plot. In
the autumn of 2015 and 2016, a 5-mm-diameter increment core was taken (from dinc;gpbt ngpbt a
NPPgpbt ¼ BM ð4Þ
bark to pith) from each tree at 1.3 m above ground using a Pressler increment
borer. Cores were extracted from the south facing side of the sampled trees. Each
increment core was stored in a plastic tube and kept frozen until further analyses. A where BMdinc;pbt is the average of BM
dinc;t of the sampled trees within a block b of
total of 754 trees at Mont-Laurier and 806 at Chibougamau were sampled for tree- population p at calendar year t, g is the sampled common garden, n is the density of
ring and further DNA analyses. Tree status (dead/alive) and unusual tree living trees (n per m−2; computed using the repeated censuses, then annually
conditions were also noted, along with tree diameter at breast height (in cm) and resolved using bilinear interpolation), and a is a constant biomass to C conversion
tree height (in m) for each of the trees present in each plot. These inventory data factor (a = 0.5). Values of annual NPP were then summed, starting from year 1974
were compiled with those collected during censuses carried out in 1978, 1985, 1993, to present, to yield estimates of total aboveground carbon (TotalC; kg C m−2) for
and 2006 (2007 for Mont-Laurier). block b of population p.
Foliage from the upper-third of the living crown was also collected for DNA To summarize, NPP population values (hereafter referred to as NPP phenotype)
analyses. Two-inch branch tips were immediately put on ice and stored at −20 °C integrate tree growth, wood density, and other factors such as tree competition and
at the Laurentian Forestry Centre before further processing. To obtain a better mortality. They were estimated at the population block level to mimic NPP values
coverage of the species’ diversity and population structure, and to correctly assign a generally obtained from natural forest permanent plots.
specific population to its genetic cluster, we added trees from three other common
garden experiments (namely Petawawa in Ontario, Acadia in New Brunswick,
Valcartier in Quebec), part of the same range-wide provenance study, for a total of Population structure analysis. The inference of genetic structure was made using
67 provenances and 1628 trees (Supplementary Data 2). the 229 valid SNPs with Structure v2.3.4 (ref. 74). For this analysis, we ran 100,000
MCMC reps after a burn-in period length of 20,000 for 100 independent runs and
used the software default parameters with the exception that we let Structure infer
Laboratory treatments. Increment cores were first conditioned in a chamber at a separate ALPHA for each cluster, as recommended by Wang75. This was
20 °C and 65% relative humidity until they reached an equilibrium moisture especially important since the extreme west of the species distribution was under-
content of 12%. They were then sawn to a 1.7-mm-thick slice longitudinally with a represented in our sampling. The most likely number of assumptive clusters (K)
twin blade sleeve to obtain a smooth surface. The same core was used for ring- was identified by calculating ΔK using the Evanno method76 and resulted in an
width (expressed in mm) and wood-density (expressed in kg m−3) analyses, both optimum K = 3 clusters (hereafter referred to as Western, Central, and Eastern
metrics being necessary for the computation of annual NPP (described below). For lineages; Fig. 1d). The genetic admixture proportions (Q-values) were averaged for
ring-width measurements, the sawn cores were scanned using a 2400 dpi resolu- all trees of the same population block, while samples without genotypes were given
tion. Annual rings of each core were visually cross-dated with skeleton-plots and the average population Q-values of all genotyped trees from the same provenance
pointer-year identification and then measured using the software Coo-Recorder (Supplementary Data 2). One may note that, in a separate analysis including 33
v8.11 (ref. 69) with 10−2 mm precision. Cross-dating was statistically verified with red spruce (P. rubens) individuals, it was established that the proportion of red
CDendro v8.11 and COFECHA v6.06 software69,70. Next, the wood density of each spruce genome admixture among our samples was undetectable. The genetic
thin core slice was measured using a Quintek X-Ray measuring system at Uni- diversity calculation by lineage, pairwise FST between the lineages, and standard
versité Laval (Quebec, Canada). Cores were scanned in 0.02 mm steps, producing hierarchical analysis of the molecular variance (AMOVA77), were all performed
high-resolution wood density profiles. Average annual wood density was deter- using Genodive v3.04 (ref. 78); when applicable, the P values were computed
mined for each tree ring and the correct identification of annual ring boundaries against the distribution of 999 permutations. The aim of the AMOVA was to
was verified using the previously cross-dated ring-width measurements from the describe the partition of the total genetic variance among genetic clusters (FCT)),
analysis of the scanned images. This led to the production of 1560 ring-width and among population within clusters (FSC), among individuals within population
wood density measurement profiles from the innermost to the outermost rings for (FIS), and within individuals (FIT).
each of the sampled trees.
The DNA required for genotyping was extracted from the frozen needle tissues
(50 mg) with a Nucleospin 96 Plant II kit (Macherey-Nagel, Bethlehem, PA) using NPP-climate associations. Daily weather data (maximum and minimum tem-
the centrifugation processing protocol with a cell lysis step with PL2 buffer for 2 h perature, °C), precipitation (sum, mm), relative humidity (%), and vapor pressure
at 65 °C. In total, 1628 trees from 67 provenances were genotyped for 257 known deficits (kPa) were obtained for the two common gardens for the period of
single-nucleotide polymorphisms (SNPs) of the P. mariana species59,71 by the 1976–2016 using BioSIM v10.3.2 (ref. 79). As part of the procedure, daily data were
Génome Québec Innovation Centre genotyping platform (McGill University, interpolated from the eight closest weather stations of the historical weather
Montréal, Canada) using the Sequenom iPLEX Gold technology72. SNPs with more observations of Environment and Climate Change Canada, adjusted for elevation
than 20% missing genotypes (22), and then those with less than 2.5% MAF (minor and location differentials with regional gradients, and averaged using a 1/D2
allele frequency (4)) or more than 55% heterozygotes (2), were removed to leave weight, where D is distance. Next, the quantity of available soil moisture was
229 SNPs for the analysis. Each SNP came from a distinct gene and was not estimated for each month using the quadratic+linear (QL) formulation proce-
preselected based on its putative functions. The average missing genotype dure80, which accounts for water loss through evapotranspiration (simplified
was 3.1%. Penman–Monteith potential evapotranspiration) and gain from precipitation.
Parameter values for maximum and critical available soil water were set at 400 and
300 mm, respectively. Mean annual growing degree days above 5 °C and mean
Computation of annual NPP. Ring-width measurements and wood-density pro- annual precipitation of each provenance (GDD5p and MAPp) were also computed
files were combined to yield estimates of the annual aboveground carbon uptake as and averaged over the 1961−1990 period (i.e. corresponding to seed collection)
follows. First, ring-width measurements were converted into annual volumetric using the BioSIM software. GDD5p was computed from the daily mean tem-
increments (V binc , m3): perature minus the base temperature.
We used generalized additive mixed models (GAMM81) to explore the climate
effects on NPP values in each population (86 analyses in total). This approach is
binc;i ¼ V
V biþ1 V
bi ð1Þ based on modelling of NPPgpbt as a function of tree ages and sizes, and explanatory
12 NATURE COMMUNICATIONS | (2021)12:1169 | https://doi.org/10.1038/s41467-021-21222-3 | www.nature.com/naturecommunicationsYou can also read