The Economic Implications of Climate Change - Moody's Analytics
←
→
Page content transcription
If your browser does not render page correctly, please read the page content below

ANALYSIS                    The Economic Implications of Climate Change
June 2019
                            Introduction
Prepared by
                            In the absence of global pollution mitigation, anthropogenic emission of carbon dioxide
Chris Lafakis               into the Earth’s atmosphere will raise global temperatures. Rising temperatures and shifting
Chris.Lafakis@moodys.com
Director                    precipitation patterns will affect agricultural production and universally hurt worker health
                            and productivity. More frequent and intense extreme weather events will increasingly disrupt
Laura Ratz                  and damage critical infrastructure and property. And sea-level rise will threaten coastal
Laura.Ratz@moodys.com
Economist                   communities and island nations.

Emily Fazio
Emily.Fazio@moodys.com
Economist

Maria Cosma
Maria.Cosma@moodys.com
Associate Economist

Contact Us

Email
help@economy.com

U.S./Canada
+1.866.275.3266

EMEA
+44.20.7772.5454 (London)
+420.224.222.929 (Prague)

Asia/Pacific
+852.3551.3077

All Others
+1.610.235.5299

Web
www.economy.com
www.moodysanalytics.com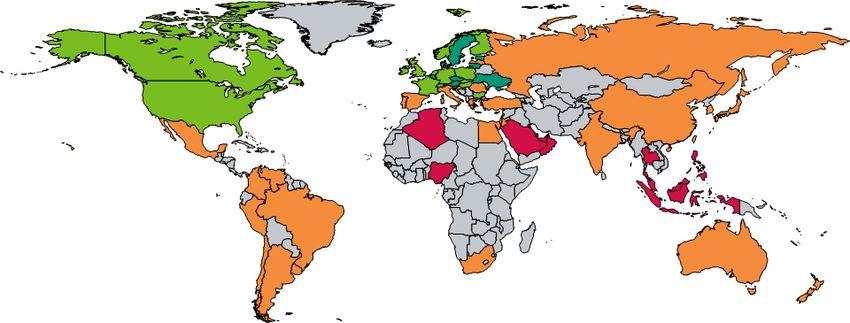
MOODY’S ANALYTICS

The Economic Implications of Climate Change
BY CHRIS LAFAKIS, LAURA RATZ, EMILY FAZIO, MARIA COSMA

I
    n the absence of global pollution mitigation, emission of carbon dioxide from human sources into the Earth’s
    atmosphere will raise global temperatures. Rising temperatures and shifting precipitation patterns will affect
    agricultural production and universally hurt worker health and productivity. More frequent and intense
extreme weather events will increasingly disrupt and damage critical infrastructure and property. And sea-level
rise will threaten coastal communities and island nations.

    These effects will intensify throughout                             Last year, the Intergovernmental Panel            IPCC’s most recent assessment report was
the century, resulting in profound changes in                       on Climate Change released a sweeping re-             a critical input into the UNFCCC’s Paris
climate patterns across the globe. Climate                          port on the impacts of climate change under           climate accord.
change will create many losers, but also                            the Paris Agreement’s target and related                  Increasing global knowledge of climate
some winners.                                                       pathways. The report aggregated existing              change has given rise to three primary sci-
    In this report, we examine the physical                         scientific literature and found that dam-             entific research communities. The Climate
risk of climate change for each country using                       age to ecosystems, humans and economies               Modeling community studies the effects of
the Moody’s Analytics Global Macroeco-                              was significantly larger at 2°C of warming            global warming on the climate and the con-
nomic Model. We quantify the economic                               than at 1.5°C. The report states that global          nection between greenhouse gas emissions
costs of climate change across various im-                          economic damage is estimated to be $54                and the environment. The Impacts, Adapta-
pact channels, and use the global model to                          trillion in 2100 under a warming scenario             tion and Vulnerabilities community studies
produce forecasts consistent with a range                           of 1.5°C and $69 trillion under a warming             these three issues by drawing on other dis-
of climate scenarios. Finally, we discuss the                       scenario of 2°C.2 Warming beyond the 2°C              ciplines such as social sciences, economics,
limitations of our work and considerations                          threshold could hit tipping points for even           engineering and natural sciences. And the
for future work.                                                    larger and irreversible warming feedback              Integrated Assessment Model community
                                                                    loops such as permanent summer ice melt               combines information from diverse fields of
Climate change                                                      in the Arctic Ocean.3                                 study to explore the connection between
    In recent decades, public awareness of                                                                                emissions and public policy. Together, these
the science behind the greenhouse effect                                The climate science community                     communities have been instrumental in
and the potential effects of climate change                             The IPCC was established in 1988 by the           quantifying the risks of climate change.
has grown. Global institutions have formed                          United Nations to provide the world with an
to address the challenge, and many of the                           objective, scientific view of climate change             Representative Concentration
world’s governments have taken steps to                             and to inform the public of its economic                 Pathways
mitigate the potentially adverse outcomes                           impacts. All members of the World Meteo-                  The international climate change research
arising from climate change. These efforts                          rological Organization and the UN are free            community has converged remarkably over
culminated in the landmark Paris Agreement                          to join. IPCC reports are used to produce             the past two decades. The first set of climate
in 2015, which set a goal to limit the global                       the United Nations Framework Conven-                  change scenarios was published by the IPCC
temperature increase to 2°C above pre-                              tion on Climate Change, which is the main             in 1992. The IPCC updated its work in 2000,
industrial levels1 and was signed by virtually                      international treaty on climate change. The           and these initial scenarios have provided
every country on the planet.                                                                                              common reference points for climate re-
                                                                    2   https://www.ipcc.ch/sr15/                         search in the past decade. The IPCC has since
1    The 1850-1900 time period is frequently referenced in IPCC     3   http://science.sciencemag.org/content/sci/sup-
     reports as the time frame for pre-industrial, but some mem-        pl/2017/06/28/356.6345.1362.DC1/aal4369_Hsiang_
                                                                                                                          transitioned into a supportive role in order to
     bers of the scientific community have different definitions.       SM.pdf                                            empower the research community, which is

2      June 2019
MOODY’S ANALYTICS
Chart 1: Temperatures Will Rise ated emissions and introduced the four finalized RCP scenarios.
temperature trajec- Each RCP was designed using a unique IAM
Projected mean global temp. increases relative to 1986-2005, °C
tories. Rather, they component of the CMIP model family:
4.5
4.0 RCP 2.6 work in reverse, tar- »» RCP 2.6. Radiative forcing value in the
3.5 RCP 4.5 geting CO2-equiva- year 2100 is 2.6 watts/meter2. CO2-
3.0 RCP 6.0
lent emissions. This equivalent atmospheric concentration
2.5 framework implicitly reaches 421 parts per million.6 Mean
RCP 8.5
2.0 acknowledges that global temperature increases by 1°C over
1.5 there are many fac- the base period.
Paris Agreement’s target
1.0 tors that determine »» RCP 4.5. Radiative forcing value in the
0.5 emission quantities, year 2100 is 4.5 W/m2. CO2-equivalent
0.0 and the projected atmospheric concentration reaches 538
2005 2015 2025 2035 2045 2055 2065 2075 2085 2095 CO2-equivalent con- parts per million.7 Mean global tem-
Sources: IPCC, Moody’s Analytics centrations can be perature increases by 1.9°C over the
Presentation Title, Date 1 achieved in different base period.
spearheaded by the Integrated Assessment ways. It also allows researchers to test the »» RCP 6.0. Radiative forcing value in the
Model Consortium. The IAMC is a collection effect of different assumptions—technol- year 2100 is 6.0 W/m2. CO2-equivalent
of IAM groups, four of which were responsi- ogy, population growth, public policy—on atmospheric concentration reaches 670
ble for publishing the predecessors to today’s emissions trajectories. In this regard, the parts per million.8 Mean global tem-
globally used climate scenarios. RCP scenarios are much more flexible than perature increases by 2.4°C over the
The IAMC is the IPCC’s main point of their predecessors. base period.
contact. It collaborates with other members Because the RCP scenarios are essentially »» RCP 8.5. Radiative forcing value in the
of the scientific research community: IAV, emissions scenarios, they do not offer an year 2100 is 8.5 W/m2. CO2-equivalent
CM, technology and engineering communi- explicit trajectory for temperature fluctua- atmospheric concentration reaches
ties. Following a stakeholder convention that tions. Different climate models produce 936 parts per million.9 Mean global
was initiated by the IPCC in 2007, it took different temperature trajectories given the temperature increases by 4.1°C over the
two years of collaboration for this mélange same emissions trajectories.4 Moreover, the base period.
of stakeholders to produce their end result: a same models can also be used to produce
set of climate scenarios known as Represen- different scenarios, resulting in different In order to streamline the construction of
tative Concentration Pathways. temperature trajectories.5 The IPCC reports economic scenarios, Moody’s Analytics used
RCPs are climate scenarios that provide the mean temperature trajectories produced the mean global temperature increases for
varying trajectories for greenhouse gas emis- by different models as a deviation from the each RCP scenario as reported by the IPCC in
sions. The scientific community named the base period of 1986-2005. This is slightly AR5 (see Table 1).
scenarios based on the concept of radiative different from the Paris Agreement’s target, Of the four scenarios, it is highly unlikely
forcing, which is the difference between the which expresses temperature change relative that RCPs 8.5, 6.0 or even 4.5 will fall within
energy from the sun absorbed by the Earth to pre-industrial levels (See Chart 1). or under the Paris Agreement’s warming
and the energy the Earth radiates back to Given the hundreds of climate models in targets. The only scenario that is likely to
space. Positive radiative forcing occurs when existence, the scientific community rallied fall between 1.5°C and 2°C of warming rela-
the Earth absorbs more energy on net. The behind a gatekeeper to regulate historical tive to pre-industrial levels is RCP 2.6. The
greenhouse effect is the scientific principle data and provide a framework for coordi- IPCC estimates that at the current rate of
that describes how an increasing concentra- nated climate change experiments. This greenhouse gas emissions, reaching a warm-
tion of greenhouse gases leads to positive ra- gatekeeper is the Coupled Model Intercom- ing path within the range of the RCP 2.6
diative forcing. In its fifth assessment report parison Project. CMIP is supported and main- scenario will require large and immediate
released in 2014, the IPCC identified four tained by the Lawrence Livermore National mitigation efforts.10
RCP scenarios that were crafted by members Laboratory in the San Francisco Bay Area.
of the scientific community. These scenarios CMIP models are a critical component of the 6 Produced using the IMAGE Integrated Assessment Model.
are the international standard for climate IPCC’s Fifth Assessment Report, AR5, which 7 Produced using the GCAM Integrated Assessment Model.
change research. 8 Produced using the AIM Integrated Assessment Model.
9 Produced using the MESSAGE Integrated Assessment
In contrast to its predecessors, the RCP 4 The majority of these models are highly sophisticated and Model.
scenarios do not begin with a set of assump- typically rely upon high computing power and geospatial 10 UNEP (2018). The Emissions Gap Report 2018. United Na-
datasets. tions Environment Program, Nairobi http://wedocs.unep.
tions on economic, demographic, technologi- 5 The IPCC AR5 database comprises 31 models and 1,184 org/bitstream/handle/20.500.11822/26895/EGR2018_Full-
cal or policy factors to produce the associ- scenarios. Report_EN.pdf?sequence=1&isAllowed=y
3 June 2019MOODY’S ANALYTICS
Table 1: RCP Scenarios in 2100 Chart 2: Climate Threats to the Economy
Radiative forcing, CO2-equivalent, Mean global temperature Avg annual damage estimates for the U.S. in 2100, % of GDP
Scenario 4.0
W/m2 ppm increase, °C
RCP 2.6 2.6 421 1 3.5
RCP 4.5 4.5 538 1.9 3.0
RCP 6.0 6.0 670 2.4 2.5
RCP 8.5 8.5 936 4.1 2.0
1.5
Sources: IPCC, Moody’s Analytics
1.0
0.5
0.0
RCP 8.5 is often cited as a business-as- Ocean thermal 1°C (RCP 2.6) 1.5°C (Paris 2°C (RCP 4.5) 4°C (RCP 8.5)
usual scenario, but this is partly a miscon- expansion and gla- Agreement)
ception. The current trend of emissions more cier melting have Sources: Hsiang et al. (2017), IPCC, Moody’s Analytics
closely resembles RCP 4.5 than RCP 8.5.11 been the dominant Presentation Title, Date 2
RCP 8.5 does assume that there is no imple- contributors to sea-level rise.13 Rising sea lev- in water- and vector-borne15 diseases such
mentation of climate-friendly policies, but it els reduce the land stock through the erosion, as malaria and dengue fever will likely be
also assumes the fastest population growth inundation or salt intrusion along the coast- the largest direct effect of changes in human
of the four scenarios, culminating in a dou- line. The extent of land area that may be lost health and the associated productivity loss.
bling of the world’s population by 2100, the to rising sea levels, and the economic damage Rising global temperatures can lengthen the
lowest rate of technological development, this may cause, is driven by a variety of fac- season and increase the geographic range of
slow GDP growth, and high energy use.12 It is tors, including the composition of the shore- disease-carrying insects such as mosquitoes,
closer to a worst-case scenario than a busi- line—cliffs and rocky coasts are less subject to ticks and fleas, allowing them to move into
ness-as-usual case. For example, by some erosion than sandy coasts and wetlands—the higher altitudes and new regions. In addi-
estimates, economic damages to the U.S. total length of the country coast, and how tion, when climate change forces people to
are triple in RCP 8.5 by 2100 than in RCP 4.5 much of the coast is being used for productive migrate, it increases the risk of spreading
(see Chart 2). None of the four RCP scenarios purposes such as agriculture. Changes in land pathogens into new areas. Increased risk of
represent business-as-usual, which would use and the loss of developable land can hurt vector-borne diseases and other heat-related
probably be somewhere between RCPs 4.5 any country with a coastline. morbidity will impact productivity, as work-
and 8.5. Second, the health of human populations ers will require more sick days while battling
Moody’s Analytics used the RCP sce- is sensitive to shifts in weather patterns and illness or work less efficiently due to illness.
narios in its analysis in order to provide other aspects of climate change.14 Rising Frequent and long-term illnesses could also
economic projections consistent with global temperatures will increase heat-relat- degrade workers’ skills. Higher heat-related
international benchmarks. ed mortality and decrease cold-related mor- mortality and morbidity will reduce labor
tality in some regions. However, the change force productivity and likely raise public and
How climate change affects the private spending on health services.
economy Third, rising temperatures will also hurt
13 Church, J.A., P.U. Clark, A. Cazenave, J.M. Gregory, S. Jevre-
This section of our study is dedicated to jeva, A. Levermann, M.A. Merrifield, G.A. Milne, R.S. Nerem, labor productivity. Heat stress, determined
P.D. Nunn, A.J. Payne, W.T. Pfeffer, D. Stammer and A.S.
explaining the channels through which cli- Unnikrishnan, 2013: Sea-Level Change. In: Climate Change
by high temperature and humidity, lowers
mate change affects the economy. We evalu- 2013: The Physical Science Basis. Contribution of Working working speed, necessitates more frequent
Group I to the Fifth Assessment Report of the Intergovern-
ate the economic effects of climate change mental Panel on Climate Change [Stocker, T.F., D. Qin, G.-K.
breaks, and increases the probability of
across these six distinct impact channels: Plattner, M. Tignor, S.K. Allen, J. Boschung, A. Nauels, Y. Xia, injury. Outdoor workers are especially af-
»» Sea-level rise V. Bex and P.M. Midgley (eds.)]. Cambridge University Press,
Cambridge, United Kingdom and New York, NY, USA.
fected. The impact of heat stress on labor
»» Human health effects 14 Smith, K.R., A. Woodward, D. Campbell-Lendrum, D.D. productivity in different countries is highly
»» Heat effect on labor productivity Chadee, Y. Honda, Q. Liu, J.M. Olwoch, B. Revich, and R.
Sauerborn, 2014: Human health: impacts, adaptation, and
dependent on their industrial compositions.
»» Agricultural productivity co-benefits. In: Climate Change 2014: Impacts, Adapta- The workforce in less-developed nations,
»» Tourism tion, and Vulnerability. Part A: Global and Sectoral Aspects.
Contribution of Working Group II to the Fifth Assessment
where a larger share of labor is concentrated
»» Energy demand Report of the Intergovernmental Panel on Climate Change in agricultural activity, has a greater risk of
[Field, C.B., V.R. Barros, D.J. Dokken, K.J. Mach, M.D. Mas-
trandrea, T.E. Bilir, M. Chatterjee, K.L. Ebi, Y.O. Estrada, R.C.
exposure to extreme heat than the workforce
11 https://www.theatlantic.com/science/archive/2019/01/ Genova, B. Girma, E.S. Kissel, A.N. Levy, S. MacCracken, P.R.
rcp-85-the-climate-change-disaster-scenario/579700/ Mastrandrea, and L.L. White (eds.)]. Cambridge University
12 https://link.springer.com/article/10.1007%2Fs10584-011- Press, Cambridge, United Kingdom and New York, NY, USA, 15 Human illnesses transmitted by mosquitoes, flies, ticks,
0148-z pp. 709-754. mites, snails, lice, and other such animals.
4 June 2019MOODY’S ANALYTICS
of more-developed nations that rely more increase energy demand for cooling in the the lever for the tourism channel.19 Oil prices
on services. As a result, the temperature summer while decreasing the demand for are the lever for the energy channel. Real
effects on labor productivity vary widely heating in the winter. Warmer temperatures consumption is the lever for the sea-level
between countries. will increase demand for electricity for air rise channel. And because human health ef-
Fourth, higher temperatures, higher conditioners, and reduce demand for natural fects, heat stress, and agricultural changes all
atmospheric concentrations of CO2, and gas, oil and wood for heating. But because affect productivity, they were combined into
changes in precipitation patterns will directly more energy is used across the globe to heat a shock to real potential productivity, which
impact global crop yields. The changes will spaces than is used to cool them, rising tem- is the final lever.
not be uniform across regions and crops, peratures will on net result in weaker energy The time series of overlays are weighted
however. Growing seasons will lengthen in demand. Changes in demand will have sig- averages of the impact channels per degree
colder climates and shorten in hotter ones. nificant implications for energy prices as well of warming, with the weights being the
The relative importance of temperature and as investment in infrastructure. global mean temperature increases in the
water stress for crop productivity can be as- RCP scenarios, assuming a linear impact. For
sessed using models, making adjustments Methodology example, if a temperature increase is 1.4°C in
for different crops in each region.16 Without Moody’s Analytics created economic sce- a given quarter of an RCP scenario, we added
adaptation, agricultural productivity will de- narios for the countries in its global model 60% of the impact estimate for 1° of change
crease in more regions than it will increase, consistent with the four internationally to 40% of the 2° estimate to determine
especially as the increase in average global recognized RCP scenarios. In this section, we the change in the impact channel relative
temperature rises. describe the complex, multistep process that to the baseline in that quarter. This method
Fifth, tourism and income flows be- we undertook to do so. is used for the tourism and human health
tween countries will be directly impacted The process begins with quantifying the effects channels.
by changes in climate. Climate is one of the six impact channels. To do so, we relied on The process above is also used when
main drivers of international tourism, and the work of Roberto Roson and Martina calculating the productivity impact caused
tourism revenue is a fundamental pillar of Sartori, economists who published a work- by heat stress and changes in agricultural
the economy in many countries.17 Changes ing paper in affiliation with the World Bank productivity, but because these are largely
in climate will lengthen the tourism season in 2016.18 Roson and Sartori summarize the sector-specific shocks we must also account
in some regions while reducing it in oth- results from a series of meta-analyses that for the industrial composition of a country.
ers. It will likely shift tourism toward higher establish a connection between temperature For agricultural productivity, once we have a
altitudes and latitudes, increasing visitors rise and economic implications by impact time series of calculated deviations from the
in colder countries and reducing travelers in channel. Roson and Sartori provide central baseline, we then multiply those by the ag-
warmer countries. Some people may also values of climate change impacts by mak- ricultural share of each particular economy.
choose to forgo international trips in favor of ing interdisciplinary assessments of various Once a time series of impacts has been cal-
staying closer to home if their local climate of studies with different approaches and culated for each sector—agriculture, manu-
improves. This could result in sizable redistri- methodologies. The beauty of the Roson facturing and services—we then multiply
butions of income among various countries and Sartori work is that they synthesized the that series by the size of that sector relative
as flows of tourism spending change. research of academic economists and linked to the size of the overall economy. After cal-
And sixth, changes in climate will also the impact channels to temperature fluctua- culating a time series for the three channels
have substantial effects on household en- tions for all of the world’s major countries. through which climate change impacts pro-
ergy demand. Variations in temperature Moody’s Analytics translated these ductivity, and adjusting them to account for
alter energy needs. Warmer temperatures linkages to the four international RCP sce- their relevant industrial share, these impact
narios. To do so, we first created quarterly channels are aggregated into a single time
16 Porter, J.R., L. Xie, A.J. Challinor, K. Cochrane, S.M. Howden, temperature paths for each RCP scenario to series overlay for real potential productivity.
M.M. Iqbal, D.B. Lobell, and M.I. Travasso, 2014: Food secu-
rity and food production systems. In: Climate Change 2014:
match the Moody’s Analytics global model’s
Impacts, Adaptation, and Vulnerability. Part A: Global and quarterly periodicity. We then constructed Forecasting industrial shares
Sectoral Aspects. Contribution of Working Group II to the
Fifth Assessment Report of the Intergovernmental Panel
time series of overlays to key economic vari- It thus becomes critically important for us
on Climate Change [Field, C.B., V.R. Barros, D.J. Dokken, K.J. ables in the Moody’s Analytics global model. to forecast country industrial shares. To do
Mach, M.D. Mastrandrea, T.E. Bilir, M. Chatterjee, K.L. Ebi,
Y.O. Estrada, R.C. Genova, B. Girma, E.S. Kissel, A.N. Levy, These variables act as levers in the global this, we used historical data from The World
S. MacCracken, P.R. Mastrandrea, and L.L. White (eds.)]. model that can be pulled to craft economic Bank, which measures the share of GDP of
Cambridge University Press, Cambridge, United Kingdom
and New York, NY, USA, pp. 485-533. scenarios. Real intermediate net exports are
17 Roson, Roberto, and Martina Sartori. “Estimation of Cli- 19 This variable does not exist for a select group of countries
mate Change Damage Functions for 140 Regions in the in the global model, including the United States, Germany
GTAP9 Database.” Policy Research Working Paper 7728. 18 https://jgea.org/resources/jgea/ojs/index.php/jgea/article/ and Canada. For those countries, real imports and/or real
World Bank Group. June 2016. view/31 exports are the levers.
5 June 2019MOODY’S ANALYTICS
Chart 3: Emerging Economies Industrialize data issues, the three countries where still-strong growth rates
components do not near the end of the forecasting period were
India, economic concentration by sector, %
always equal 100, so compounded through the end of the century.
120
Service Manufacturing Agriculture they were squeezed to Therefore, for these two countries, we used
100 their sum in the last the OECD’s long-term economic forecasts,
80
historical point. which extend to 2060 and assume slower
Given that the pre- growth halfway through the century as these
60 liminary path of the countries’ economies develop. We then ex-
40 developing countries’ tended the growth rates through the rest of
projections are based the century using a simple trend. As a check,
20
on linear trends, the we made sure that the growth rates did not
0 preliminary projection decay to below the OECD average, or the
1990 2000 2010 2020 2030 2040 2050 would eventually re- average for developed economies.
Sources: World Bank, Moody’s Analytics sult in economies that Roson and Sartori estimated both the
Presentation Title, Date 3 are entirely service- amount of land lost and the impact of
services, agriculture and manufacturing.20 based with no manufacturing or agriculture. sea-level rise on GDP given a temperature
Projections were constructed using two To prevent this, we calculated the average change of 3°C in 2100. We calculated the
methods—one for industrialized countries concentration of each sector across the OECD share of land rent income damaged as a
and another for developing countries. countries and forced the projections to level result of climate change by multiplying the
OECD member countries formed our list off once they reach the OECD’s average con- impact of sea-level rise by GDP in 2100 and
of industrialized countries. Once industrial- centration of each sector (see Chart 3). dividing the result by the amount of land lost
ized, the shares are generally stable but If the share of the service sector of an in the same year.
may to fluctuate by a few basis points from industrializing country was already above the Then, we constructed a time series of
quarter to quarter. For this reason, the pro- OECD average, or if the agriculture or manu- land rent income using the consumer price
jected shares were set to the average of the facturing was already below the OECD aver- index forecasts for each country. The CPIs
past five years, rather than extending the age, the last historical point was extended were similarly forecast through 2100 using
last historical data point across the entire across the forecast horizon. the growth rates in the last five years of
forecast horizon. The five-year average better The World Bank does not publish data the Moody’s Analytics forecasting period.
reflects slight variations in the composition for Taiwan. We based the industrial shares Land rent income was calculated for each
of each economy. on data from the Central Intelligence year by multiplying land rent income in
We also forecast the industrial shares Agency’s World Factbook, and left them 2100 by the ratio of CPI in the given year
for developing countries (those not in the constant, as the shares suggested Taiwan is to CPI in 2100.
OECD). The first step was to estimate simple fully industrialized. The final step was to apply weights for
trend equations. The estimation period for Additionally, World Bank data on Algeria the different RCP temperature paths and in-
most countries was 1990 through the last and Egypt were deemed unreliable. The his- terpolate the data into a quarterly frequency.
historical data point, but for others the torical industrial shares were also obtained To do this, we used the same crosswalking
sample size was truncated to produce more from the CIA’s World Factbook, and grown methodology we used for the productivity
reasonable projections. For example, in a out using the average growth rate of the de- and tourism impact channels.
country that is gradually becoming less reli- veloping country bloc. Once the sea-level rise effects were cal-
ant on agriculture, the projections reduce culated as a percentage of GDP, they were
agriculture’s share of the economy at the Sea-level rise used to shock the Moody’s Analytics global
same pace as recent history. Limits were Because sea-level rise damages land stock model using the real consumption lever.
put in place so that the shares could not fall through erosion, inundation or salt intrusion, Households and businesses will be able to
too low. we needed to calculate land rent income as collect fewer rents and earn less income
The growth rate of trend projections a share of GDP to quantify the effects of sea- because of the land that they have lost. But
was then lined up to the average of the level rise. the decision was made to use consumption
last year. The three sectors in each country To do this, we began by estimating GDP as the lever rather than incomes, because of
were then squeezed so that they would not for every country in 2100 by compounding how the global model is structured. Private
exceed 100%, or the historical sum. Due to the growth rates in the last five years of the consumption is an “upstream” variable with
Moody’s Analytics 30-year forecasts. This stronger connections in the model than total
20 The historical data are as reported by the individual coun-
tries. They are prone to revisions, level shifts and gaps in the
produced reasonable results for all countries personal income, which is a “downstream”
time series. Not all sectors are available for all countries. except India and Indonesia, both developing variable with weaker feedback loops. How-
6 June 2019MOODY’S ANALYTICS
Chart 4: Some Winners, More Losers Chart 5: Climate Change Hurts Nations
GDP % deviation from baseline in 2048, RCP 8.5 Real GDP, % change, RCP 8.5, 2048
Saudi Arabia
Hong Kong
Malta
Malaysia
Algeria
Philippines
Bahrain
≥0.5
Singapore
≥0 toMOODY’S ANALYTICS
Chart 6: Tourism Impacts Chart 7: Falling Demand Cuts Oil Prices
Change in economic output due to tourism by 2048, % of GDP Reduction in oil prices, %
1.0 2
0
0.5
-2
0.0
-4
-0.5 -6
RCP 2.6
-8 RCP 4.5
-1.0
-10 RCP 6.0
Sweden
-1.5 RCP 8.5
Singapore -12
-2.0 -14
RCP 2.6 RCP 4.5 RCP 6.0 RCP 8.5 2018 2023 2028 2033 2038 2043 2048
Sources: World Bank, Moody’s Analytics Sources: World Bank, Moody’s Analytics
Presentation Title, Date 6 Presentation Title, Date 7
The second group of countries that was implied by the reduction in oil demand reach nel, but the stress felt in both countries is
negatively affected in rising temperature nearly 14% by 2048 in the RCP 8.5 scenario less than 0.02% of GDP by 2100 in the RCP
scenarios was oil producers. As the second (see Chart 7). Because of the way oil prices 8.5 scenario (see Chart 8). However, in both
largest oil producer in the world, Saudi Ara- are intertwined with economic variables for of these countries, the other channels have a
bia is the most negatively affected country oil producers in the global model, this cre- larger impact on GDP.
by climate change. Not only does it get hit ates a great deal of economic stress. Not
on tourism and productivity, but the reduc- only is Saudi Arabia’s economy over 10% Winners
tion in oil prices limits government rev- smaller by 2048 in the RCP 8.5 scenario, but Another observation from the scenarios
enue. The last time that oil prices declined even Russia’s forecast is below the baseline is that productivity falls in every country.
significantly was in 2014 and 2015, when (see Table 2). While Russia benefits from a While some countries such as Russia benefit
Saudi Arabia stated that it would flood the longer growing season and positive tourism in terms of higher agricultural productivity,
market with barrels to dry up investment flows, these benefits are more than offset by the drags from heat stress and human health
in exploration and production and secure the loss in income from reduced oil revenues. effects are universally negative: For all coun-
more market share in the future. This strat- Russia’s GDP is 1.4% lower than the baseline tries, they outweigh the positive productivity
egy created a severe disruption to the king- in RCP 8.5 by 2048. effects from the agriculture channel, even for
dom’s finances, to which it had to respond While many of the countries most hurt Russia (see Chart 9).
with fiscal austerity. The country fell into by climate change are characterized by large But for some countries, the benefits of
recession, and it took years of patience and coastlines, this is not primarily due to the lower oil prices and improved tourism flows
a new oil-price strategy for the economy sea-level rise channel. For example, Croatia outweigh the drag of reduced productivity
to stabilize. and Hong Kong are the two countries with growth, allowing output to exceed the levels
Oil demand declines quite dramatically the largest declines relative to the size of in our baseline forecasts. These are mostly in
as temperatures rise, and the price declines their economy from the sea-level rise chan- advanced economies in colder climates such
Chart 8: Cost of Sea-Level Rise Chart 9: Productivity Falls in Countries…
Lost economic output due to sea-level rise by 2100, % of GDP Reduction in potential productivity by 2048, %
0.000 0.00
-0.002
-0.05
-0.004
-0.006 -0.10
-0.008 -0.15
Russia
-0.010 U.S.
Croatia Hong Kong -0.20
-0.012
-0.014 -0.25
RCP 2.6 RCP 4.5 RCP 6.0 RCP 8.5 RCP 2.6 RCP 4.5 RCP 6.0 RCP 8.5
Sources: World Bank, Moody’s Analytics Sources: World Bank, Moody’s Analytics
Presentation Title, Date 8 Presentation Title, Date 9
8 June 2019MOODY’S ANALYTICS
Chart 10: …But Some Will Still Benefit Chart 11: Large Economies, Little Changed
Real GDP, % change, RCP 8.5, 2048 Real GDP, % change, RCP 8.5, 2048
Luxembourg Canada
Austria United Kingdom
Slovenia Germany
Sweden France
Denmark United States
Ukraine Japan
Estonia South Korea
Czech Republic Italy
Lithuania Brazil
Belgium China
Switzerland Russia
Ireland India
0.0 0.2 0.4 0.6 0.8 1.0 1.2 -2.5 -2.0 -1.5 -1.0 -0.5 0.0 0.5
Sources: World Bank, Moody’s Analytics Sources: World Bank, Moody’s Analytics
Presentation Title, Date 10 Presentation Title, Date 11
as Northern Europe (see Chart 10). Luxem- Brazil, Russia, India, China and South time. The degree of economic damage from
bourg, Austria, Slovenia, Sweden and Den- Africa, however, fare worse. Brazil and China these six channels is tied directly to the glob-
mark top the list of countries with the largest decline by roughly 0.5% of GDP. While lower al mean temperature increase, and the tem-
deviation from baseline GDP in the RCP 8.5 oil prices are a great help to the Brazilian perature increase compounds slowly over
scenario by 2048. These advanced countries economy, the negative effects from less time. This analysis reveals no acute effects
suffer less from heat stress, are not major tourism and lower productivity are too much of climate change that could cause reces-
oil producers, and benefit from the tourism to overcome. China actually benefits from a sions. The only source of acute effects would
impact channel. rise in tourism and agricultural productivity, emanate from a heightened occurrence and
along with lower oil prices, but negative heat severity of natural disasters, and those are
Everyone else stress and health effects are more severe. not covered in the scope of this work.
Of the world’s 12 largest economies, all of Russia also benefits from increased tour- The second takeaway is that the more
the industrialized ones feature GDP changes ism and agriculture, but the oil price decline draconian effects of climate change are not
of 0.5% or less in RCP 8.5 by 2048. Canada, more than offsets these positives. felt until 2030 and beyond (see Chart 12).
the U.K., Germany, France and the U.S. Of the world’s 12 largest economies, India And they do not become especially pro-
feature very modest increases while Japan, is hurt the most. Given India’s lower share nounced until the second part of the century.
South Korea and Italy feature very modest of service industry employment, the country Until around 2030, the tangible effects of
declines (see Chart 11). The oil price shock suffers greatly from the heat stress impact climate change will mostly be felt by the
played an instrumental role in mitigating the channel. This is the most significant impact increased incidence and severity of natural
declines in productivity that follow from ris- channel weighing on India’s GDP growth. Ag- disasters, which are not covered in this work.
ing global temperatures. Indeed, France and ricultural productivity also falls, and the hit Third, the heterogeneous effects of
the U.S. would have been net losers were it from human health effects is roughly equiva- climate change create different incentives
not for lower oil prices. lent to the hit from agriculture. Lower oil and disincentives for countries to adopt
prices are not nearly public policies to regulate greenhouse gas
Chart 12: Climate Stress Compounds enough to offset the emissions. There is less of an incentive for
economic damage. advanced Northern European countries to
India, reduction in potential productivity, %
India’s real GDP is adopt policies that mitigate greenhouse gas
2
2.5% lower in RCP 8.5 emissions, while there is a much greater
0 by 2048. incentive for the emerging economies of
-2 Southeast Asia to do so.
Implications Fourth, climate change carries vast geo-
RCP 2.6
-4 There are five ma- political risk. International immigration is not
RCP 4.5
-6 RCP 6.0 jor takeaways from assumed in any of these four scenarios, but
RCP 8.5
our climate change it is a major risk. Slower economic growth in
-8
scenarios. The first is the most affected countries could prompt
-10 that the physical costs residents of those countries to relocate. If
2010 2020 2030 2040 2050 2060 2070 2080 2090 2100 of climate change the degree of emigration is large enough, it
Sources: World Bank, Moody’s Analytics compound slowly over could put strain on certain countries that are
Presentation Title, Date 12
9 June 2019MOODY’S ANALYTICS Table 2: Deviation in Real GDP From Baseline in 2048Q4, % Country RCP 2.6 RCP 4.5 RCP 6.0 RCP 8.5 Luxembourg 0.45 0.69 0.57 1.07 Austria 0.28 0.54 0.40 0.94 Slovenia 0.10 0.29 0.18 0.72 Sweden 0.24 0.42 0.33 0.69 Denmark 0.19 0.37 0.28 0.67 Ukraine 0.21 0.34 0.24 0.61 Estonia 0.01 0.25 0.12 0.60 Czech Republic 0.21 0.37 0.29 0.60 Lithuania 0.05 0.21 0.10 0.53 Belgium 0.20 0.32 0.26 0.52 Switzerland 0.14 0.28 0.21 0.50 Ireland 0.12 0.24 0.16 0.47 Slovak Republic 0.16 0.27 0.21 0.44 Finland 0.07 0.20 0.13 0.42 Canada 0.08 0.16 0.10 0.31 United Kingdom 0.09 0.17 0.13 0.29 Netherlands 0.09 0.17 0.12 0.29 Poland 0.09 0.17 0.13 0.28 Germany 0.06 0.14 0.10 0.28 Bulgaria -0.01 0.11 0.07 0.23 Norway 0.32 0.31 0.34 0.17 Hungary 0.04 0.09 0.06 0.15 France 0.03 0.05 0.04 0.08 United States -0.09 -0.04 -0.09 0.08 Japan -0.02 -0.04 -0.04 -0.03 Korea (Republic of ) (South) 0.01 -0.05 -0.03 -0.13 Turkey -0.05 -0.10 -0.08 -0.15 Italy -0.04 -0.09 -0.06 -0.16 Croatia -0.08 -0.11 -0.09 -0.18 New Zealand -0.06 -0.10 -0.08 -0.19 Peru -0.09 -0.13 -0.08 -0.26 Argentina -0.13 -0.21 -0.18 -0.33 Spain -0.17 -0.27 -0.21 -0.45 Latvia -0.55 -0.51 -0.51 -0.46 Brazil -0.10 -0.25 -0.17 -0.48 Chile -0.20 -0.32 -0.30 -0.49 Venezuela -0.02 -0.20 -0.14 -0.51 Portugal -0.20 -0.33 -0.27 -0.52 Romania -0.24 -0.33 -0.27 -0.53 Mexico -0.19 -0.34 -0.26 -0.56 China, People’s Republic of -0.19 -0.37 -0.30 -0.62 Australia -0.15 -0.35 -0.26 -0.69 Greece -0.29 -0.50 -0.38 -0.86 Colombia -0.18 -0.53 -0.41 -0.92 Egypt -0.54 -0.73 -0.64 -0.97 Uruguay -0.52 -0.73 -0.63 -1.04 South Africa -0.39 -0.66 -0.56 -1.04 Israel -0.56 -0.83 -0.70 -1.25 Russian Federation 0.16 -0.41 -0.04 -1.43 Lebanon -0.14 -0.69 -0.34 -1.64 Taiwan (Province of China) -0.34 -0.96 -0.67 -1.86 Jordan (Hashemite Kingdom of ) -0.93 -1.42 -1.17 -2.19 India -0.49 -1.29 -0.94 -2.45 United Arab Emirates -0.66 -1.39 -1.01 -2.60 Indonesia -0.29 -1.16 -0.70 -2.63 10 June 2019
MOODY’S ANALYTICS

Table 2: Deviation in Real GDP From Baseline in 2048Q4, % (Cont.)
Country                                                                                      RCP 2.6              RCP 4.5              RCP 6.0                    RCP 8.5
Cyprus                                                                                         -1.30                -1.81                -1.53                      -2.70
Kuwait                                                                                         -0.81                -1.57                -1.25                      -2.71
Nigeria                                                                                        -0.05                -1.30                -0.57                      -3.32
Oman                                                                                           -0.46                -1.67                -0.98                      -3.56
Qatar                                                                                          -0.39                -1.73                -0.98                      -3.79
Thailand                                                                                       -0.81                -2.06                -1.47                      -3.89
Singapore                                                                                      -0.63                -2.04                -1.35                      -4.15
Bahrain                                                                                        -0.95                -2.26                -1.48                      -4.61
Philippines                                                                                    -0.87                -2.43                -1.67                      -4.72
Algeria                                                                                        -0.22                -1.73                -0.58                      -5.60
Malaysia                                                                                       -0.80                -3.04                -2.12                      -5.80
Malta                                                                                          -4.00                -4.79                -4.38                      -6.10
Hong Kong Special Administrative Region of China                                               -2.77                -4.03                -3.17                      -6.40
Saudi Arabia                                                                                   -0.65                -4.04                -1.72                     -10.85

Source: Moody’s Analytics

receiving the immigrants. Already in the U.S.,                 consumers. Some of the losses were offset               this analysis to 2100 as we conduct future
the issue of immigration has developed into                    by charity, and others by federal government work to be consistent with the time horizon
one of significant political debate.                           aid. Every dollar that federal lawmakers ap-            most frequently examined in the climate
   And fifth, this analysis does not delve                     propriate for disaster relief is a dollar that          change literature.
into subnational economics, but the effects                    could have otherwise been spent on Social                    We also make no assumptions on the
become far more dire in certain locations                      Security, Medicare, national defense, or re-            adaptation costs that would be accrued in
than across entire countries, particularly for                 bated as a tax cut. Natural disasters drain the order to achieve the RCP radiative forcing
the sea-level rise channel. The Environmental                  federal government of resources and exacer-             trajectories. The RCP trajectories can be
Protection Agency has done work to quantify                    bate the nation’s fiscal situation.                     achieved in many ways—slower population
the economic effects of sea-level rise and                         We plan on incorporating the increased              growth, slower economic growth, public
storm surge at the metropolitan level, and it                  cost of natural disasters in future analysis,           policy, or technology. Through technological
estimates that in the Tampa area alone the                     but this is a very difficult exercise because           innovation, the private sector has dramati-
damage could reach $90 billion by 2100.22                      we lack the counterfactual. It would be a               cally altered the trajectory of greenhouse
                                                               flawed analysis to assume that the $300 bil-            gas emissions in just the last 20 years. The
Limitations                                                    lion of damage to the U.S. economy in 2017              advent of the shale revolution and the sub-
    It would be too simplistic to say that                     was solely or not at all the result of climate          sequent replacement of coal-fired power
climate change does not hurt the U.S. The                      change. We intend on disaggregating the ef-             plants with natural gas combined-cycle
scope of our study was not comprehensive,                      fects of climate change from the economic               plants helped the U.S. become the first na-
and there are a number of factors that were                    damage of natural di-
not considered in this work. The foremost of                   sasters in future work.       Chart 13: Disasters Are Costliest for U.S.
these is the increasing frequency and sever-                       Our economic              Costliest weather events in U.S. history, $ bil
ity of natural disasters. The year 2017 was                    scenarios only go
the costliest on record for the U.S. Natural                   through 2048. Given            Hurricane Katrina, 2005
disasters created $300 billion worth of eco-                   that the distress
nomic damage, including damaged homes,                         compounds over time            Hurricane Harvey, 2017
businesses, infrastructure and goods (see                      and is far more severe
                                                                                                Hurricane Maria, 2017
Chart 13). This amounted to 1.5% of U.S.                       in the second half of
GDP. Some of the damage was insured, but                       the century, draw-            Superstorm Sandy, 2012
those losses create a liability for corporate                  ing binary conclu-
profits and result in higher premiums paid by                  sions from our 2048               Hurricane Irma, 2017
                                                               scenario projections
                                                               misses the mark. We                                        0         50        100        150      200
22 https://www.epa.gov/cira/climate-action-benefits-coastal-
                                                                                             Sources: NOAA, Moody’s Analytics
   property#findings                                           intend to expand
                                                                                                                                                 Presentation Title, Date   13

11    June 2019
MOODY’S ANALYTICS
Chart 14: Innovation Will Lower Emissions there is uncertainty study from multiple disciplines. Researchers
in the link between must rely on others’ work for an understand-
Li-ion battery pack price, volume-weighted avg, 2018 $ per kWh
emissions and tem- ing of the physical relationships that lead
1,200
perature. While the to shifting climate patterns, the economic
1,000 greenhouse effect conditions that lead to various greenhouse
800 establishes a connec- gas emissions paths, and the role of public
tion between carbon policy in response to current and expected
600 dioxide and tempera- changes. The multidisciplinary aspect of
400 ture increase, the climate change research creates an element
quantitative nature of uncertainty.
200
of this connection is
0 still being debated. Conclusion
2010 2011 2012 2013 2014 2015 2016 2017 2018 Some models predict Climate change has disparate effects on
Sources: BloombergNEF, Moody’s Analytics greater temperature the world’s economies. It creates winners
Presentation Title, Date 14 increases given an and losers and varying incentives to act.
tion in the world to comply with the 1997 amount of radiative forcing and some mod- Emerging economies, oil producers, and
Kyoto Protocol. More recently, rapid innova- els predict less. those in warmer climates are most vulner-
tion in electric vehicles has lowered battery Second, the economic effects of global able. Its most draconian effects occur during
pack costs by 86% since 2010 (see Chart temperatures rising to levels never before ex- the second half of this century. The primary
14). We intend to explore the relationship perienced in modern history are far from cer- costs to developed economies in the North-
between public policy and greenhouse gas tain. Economic models help us to make the ern Hemisphere will come via the increased
emissions in future research. most educated guesses on the link between frequency and severity of natural disasters.
Finally, quantifying the economic costs temperature and economic activity, but For these economies, the decline in pro-
associated with climate change is far more there is a great deal of literature on this topic ductivity will be smaller and will be offset
challenging than estimating the effects of and the estimates are not always aligned. by stronger tourism flows and/or lower oil
other events in the economics discipline such Predicting both the vast and uncertain prices. In future work, we intend to lengthen
as a fiscal-stimulus program, immigration changes in the Earth’s climate and the im- our economic analysis and quantify natural
policy, or tariffs for two key reasons. First, pacts of these changes requires research and disaster and adaptation costs.
12 June 2019MOODY’S ANALYTICS About the Authors Chris Lafakis is a director at Moody’s Analytics. His expertise is in macroeconomics, energy economics, model development and model validation. Based in West Chester PA, he also covers the California economy and contributes to Economy.com. Mr. Lafakis has been quoted by media outlets including The Wall Street Journal, CNBC, Bloom- berg, and National Public Radio and often speaks at economic conferences and events. Mr. Lafakis received his bachelor’s degree in economics from the Georgia Institute of Technology and his master’s degree in economics from the University of Alabama. Laura Ratz is an economist at Moody’s Analytics. She covers Maryland and several other regional economies. She also works on the U.S. subnational forecasts and alter- native scenarios. Laura has a master’s degree in economics from the University of Delaware and a bachelor’s degree in economics from Washington College in Maryland. Emily Fazio is an economist at Moody’s Analytics. She covers the economies of Italy, Luxembourg and Tennessee. Her research also extends to demographics and climate change. She received her master’s degree in economics from Boston University. Maria Cosma is an associate economist at Moody’s Analytics. She covers the economies of Ireland, Romania, New Jersey, Wyoming, and several U.S. metro areas. She is also involved in consulting projects, climate change research, and contributes to Economy.com. Maria has a bachelor’s degree in economics from Pennsylvania State University. Her honors thesis focused on the environmental and economic impacts of carbon tax policies. 13 June 2019
About Moody’s Analytics
Moody’s Analytics provides financial intelligence and analytical tools supporting our clients’ growth, efficiency
and risk management objectives. The combination of our unparalleled expertise in risk, expansive information
resources, and innovative application of technology helps today’s business leaders confidently navigate an
evolving marketplace. We are recognized for our industry-leading solutions, comprising research, data, software
and professional services, assembled to deliver a seamless customer experience. Thousands of organizations
worldwide have made us their trusted partner because of our uncompromising commitment to quality, client
service, and integrity.

Concise and timely economic research by Moody’s Analytics supports firms and policymakers in strategic planning, product
and sales forecasting, credit risk and sensitivity management, and investment research. Our economic research publications
provide in-depth analysis of the global economy, including the U.S. and all of its state and metropolitan areas, all European
countries and their subnational areas, Asia, and the Americas. We track and forecast economic growth and cover specialized
topics such as labor markets, housing, consumer spending and credit, output and income, mortgage activity, demographics,
central bank behavior, and prices. We also provide real-time monitoring of macroeconomic indicators and analysis on timely
topics such as monetary policy and sovereign risk. Our clients include multinational corporations, governments at all levels,
central banks, financial regulators, retailers, mutual funds, financial institutions, utilities, residential and commercial real
estate firms, insurance companies, and professional investors.

Moody’s Analytics added the economic forecasting firm Economy.com to its portfolio in 2005. This unit is based in West Chester
PA, a suburb of Philadelphia, with offices in London, Prague and Sydney. More information is available at www.economy.com.

Moody’s Analytics is a subsidiary of Moody’s Corporation (NYSE: MCO). Further information is available at
www.moodysanalytics.com.

DISCLAIMER: Moody’s Analytics, a unit of Moody’s Corporation, provides economic analysis, credit risk data and insight,
as well as risk management solutions. Research authored by Moody’s Analytics does not reflect the opinions of Moody’s
Investors Service, the credit rating agency. To avoid confusion, please use the full company name “Moody’s Analytics”, when
citing views from Moody’s Analytics.

                                          About Moody’s Corporation
Moody’s Analytics is a subsidiary of Moody’s Corporation (NYSE: MCO). MCO reported revenue of $4.4 billion in 2018,
employs approximately 13,100 people worldwide and maintains a presence in 42 countries. Further information about
Moody’s Analytics is available at www.moodysanalytics.com.
© 2019 Moody’s Corporation, Moody’s Investors Service, Inc., Moody’s Analytics, Inc. and/or their licensors and affiliates (collectively, “MOODY’S”). All rights reserved. CREDIT RATINGS ISSUED BY MOODY’S INVESTORS SERVICE, INC. AND ITS RATINGS AFFILIATES (“MIS”) ARE MOODY’S CURRENT OPIN- IONS OF THE RELATIVE FUTURE CREDIT RISK OF ENTITIES, CREDIT COMMITMENTS, OR DEBT OR DEBT-LIKE SECURITIES, AND MOODY’S PUBLICATIONS MAY INCLUDE MOODY’S CURRENT OPINIONS OF THE RELATIVE FUTURE CREDIT RISK OF ENTITIES, CREDIT COMMIT- MENTS, OR DEBT OR DEBT-LIKE SECURITIES. MOODY’S DEFINES CREDIT RISK AS THE RISK THAT AN ENTITY MAY NOT MEET ITS CONTRAC- TUAL, FINANCIAL OBLIGATIONS AS THEY COME DUE AND ANY ESTIMATED FINANCIAL LOSS IN THE EVENT OF DEFAULT. CREDIT RATINGS DO NOT ADDRESS ANY OTHER RISK, INCLUDING BUT NOT LIMITED TO: LIQUIDITY RISK, MARKET VALUE RISK, OR PRICE VOLATILITY. CREDIT RATINGS AND MOODY’S OPINIONS INCLUDED IN MOODY’S PUBLICATIONS ARE NOT STATEMENTS OF CURRENT OR HISTORICAL FACT. MOODY’S PUBLICATIONS MAY ALSO INCLUDE QUANTITATIVE MODEL-BASED ESTIMATES OF CREDIT RISK AND RELATED OPINIONS OR COMMENTARY PUBLISHED BY MOODY’S ANALYTICS, INC. CREDIT RATINGS AND MOODY’S PUBLICATIONS DO NOT CONSTITUTE OR PROVIDE INVESTMENT OR FINANCIAL ADVICE, AND CREDIT RATINGS AND MOODY’S PUBLICATIONS ARE NOT AND DO NOT PROVIDE RECOMMENDATIONS TO PURCHASE, SELL, OR HOLD PARTICULAR SECURITIES. NEITHER CREDIT RATINGS NOR MOODY’S PUBLICATIONS COMMENT ON THE SUITABILITY OF AN INVESTMENT FOR ANY PARTICULAR INVESTOR. MOODY’S ISSUES ITS CREDIT RATINGS AND PUB- LISHES MOODY’S PUBLICATIONS WITH THE EXPECTATION AND UNDERSTANDING THAT EACH INVESTOR WILL, WITH DUE CARE, MAKE ITS OWN STUDY AND EVALUATION OF EACH SECURITY THAT IS UNDER CONSIDERATION FOR PURCHASE, HOLDING, OR SALE. MOODY’S CREDIT RATINGS AND MOODY’S PUBLICATIONS ARE NOT INTENDED FOR USE BY RETAIL INVESTORS AND IT WOULD BE RECKLESS AND INAPPROPRIATE FOR RETAIL INVESTORS TO USE MOODY’S CREDIT RATINGS OR MOODY’S PUBLICATIONS WHEN MAKING AN INVESTMENT DECISION. IF IN DOUBT YOU SHOULD CONTACT YOUR FINANCIAL OR OTHER PROFESSIONAL ADVISER. ALL INFORMATION CONTAINED HEREIN IS PROTECTED BY LAW, INCLUDING BUT NOT LIMITED TO, COPYRIGHT LAW, AND NONE OF SUCH IN- FORMATION MAY BE COPIED OR OTHERWISE REPRODUCED, REPACKAGED, FURTHER TRANSMITTED, TRANSFERRED, DISSEMINATED, REDISTRIB- UTED OR RESOLD, OR STORED FOR SUBSEQUENT USE FOR ANY SUCH PURPOSE, IN WHOLE OR IN PART, IN ANY FORM OR MANNER OR BY ANY MEANS WHATSOEVER, BY ANY PERSON WITHOUT MOODY’S PRIOR WRITTEN CONSENT. All information contained herein is obtained by MOODY’S from sources believed by it to be accurate and reliable. Because of the possibility of human or mechanical error as well as other factors, however, all information contained herein is provided “AS IS” without warranty of any kind. MOODY’S adopts all necessary measures so that the information it uses in assigning a credit rating is of sufficient quality and from sources MOODY’S considers to be reliable including, when appropriate, independent third-party sources. However, MOODY’S is not an auditor and cannot in every instance indepen- dently verify or validate information received in the rating process or in preparing the Moody’s publications. To the extent permitted by law, MOODY’S and its directors, officers, employees, agents, representatives, licensors and suppliers disclaim liability to any person or entity for any indirect, special, consequential, or incidental losses or damages whatsoever arising from or in connection with the information contained herein or the use of or inability to use any such information, even if MOODY’S or any of its directors, officers, employees, agents, representatives, licensors or suppliers is advised in advance of the possibility of such losses or damages, including but not limited to: (a) any loss of present or prospective profits or (b) any loss or damage arising where the relevant financial instrument is not the subject of a particular credit rating assigned by MOODY’S. To the extent permitted by law, MOODY’S and its directors, officers, employees, agents, representatives, licensors and suppliers disclaim liability for any direct or compensatory losses or damages caused to any person or entity, including but not limited to by any negligence (but excluding fraud, will- ful misconduct or any other type of liability that, for the avoidance of doubt, by law cannot be excluded) on the part of, or any contingency within or beyond the control of, MOODY’S or any of its directors, officers, employees, agents, representatives, licensors or suppliers, arising from or in connection with the information contained herein or the use of or inability to use any such information. NO WARRANTY, EXPRESS OR IMPLIED, AS TO THE ACCURACY, TIMELINESS, COMPLETENESS, MERCHANTABILITY OR FITNESS FOR ANY PARTICULAR PURPOSE OF ANY SUCH RATING OR OTHER OPINION OR INFORMATION IS GIVEN OR MADE BY MOODY’S IN ANY FORM OR MANNER WHATSO- EVER. Moody’s Investors Service, Inc., a wholly-owned credit rating agency subsidiary of Moody’s Corporation (“MCO”), hereby discloses that most issuers of debt securities (including corporate and municipal bonds, debentures, notes and commercial paper) and preferred stock rated by Moody’s Investors Service, Inc. have, prior to assignment of any rating, agreed to pay to Moody’s Investors Service, Inc. for appraisal and rating services rendered by it fees ranging from $1,500 to approximately $2,500,000. MCO and MIS also maintain policies and procedures to address the independence of MIS’s ratings and rating processes. Information regarding certain affiliations that may exist between directors of MCO and rated entities, and between entities who hold ratings from MIS and have also publicly reported to the SEC an ownership interest in MCO of more than 5%, is posted annually at www.moodys. com under the heading “Investor Relations — Corporate Governance — Director and Shareholder Affiliation Policy.” Additional terms for Australia only: Any publication into Australia of this document is pursuant to the Australian Financial Services License of MOODY’S affiliate, Moody’s Investors Service Pty Limited ABN 61 003 399 657AFSL 336969 and/or Moody’s Analytics Australia Pty Ltd ABN 94 105 136 972 AFSL 383569 (as applicable). This document is intended to be provided only to “wholesale clients” within the meaning of section 761G of the Corpora- tions Act 2001. By continuing to access this document from within Australia, you represent to MOODY’S that you are, or are accessing the document as a representative of, a “wholesale client” and that neither you nor the entity you represent will directly or indirectly disseminate this document or its contents to “retail clients” within the meaning of section 761G of the Corporations Act 2001. MOODY’S credit rating is an opinion as to the creditwor- thiness of a debt obligation of the issuer, not on the equity securities of the issuer or any form of security that is available to retail investors. It would be reckless and inappropriate for retail investors to use MOODY’S credit ratings or publications when making an investment decision. If in doubt you should contact your financial or other professional adviser. Additional terms for Japan only: Moody’s Japan K.K. (“MJKK”) is a wholly-owned credit rating agency subsidiary of Moody’s Group Japan G.K., which is wholly-owned by Moody’s Overseas Holdings Inc., a wholly-owned subsidiary of MCO. Moody’s SF Japan K.K. (“MSFJ”) is a wholly-owned credit rating agency subsidiary of MJKK. MSFJ is not a Nationally Recognized Statistical Rating Organization (“NRSRO”). Therefore, credit ratings assigned by MSFJ are Non-NRSRO Credit Ratings. Non-NRSRO Credit Ratings are assigned by an entity that is not a NRSRO and, consequently, the rated obligation will not qualify for certain types of treatment under U.S. laws. MJKK and MSFJ are credit rating agencies registered with the Japan Financial Services Agency and their registration numbers are FSA Commissioner (Ratings) No. 2 and 3 respectively. MJKK or MSFJ (as applicable) hereby disclose that most issuers of debt securities (including corporate and municipal bonds, debentures, notes and commercial paper) and preferred stock rated by MJKK or MSFJ (as applicable) have, prior to assignment of any rating, agreed to pay to MJKK or MSFJ (as applicable) for appraisal and rating services rendered by it fees ranging from JPY200,000 to approximately JPY350,000,000. MJKK and MSFJ also maintain policies and procedures to address Japanese regulatory requirements.
You can also read