Summary and synthesis of Changing Cold Regions Network (CCRN) research in the interior of western Canada - Part 1: Projected climate and ...
←
→
Page content transcription
If your browser does not render page correctly, please read the page content below
Hydrol. Earth Syst. Sci., 23, 3437–3455, 2019
https://doi.org/10.5194/hess-23-3437-2019
© Author(s) 2019. This work is distributed under
the Creative Commons Attribution 4.0 License.

Summary and synthesis of Changing Cold Regions Network
(CCRN) research in the interior of western Canada
– Part 1: Projected climate and meteorology
Ronald E. Stewart1 , Kit K. Szeto2 , Barrie R. Bonsal3 , John M. Hanesiak1 , Bohdan Kochtubajda4 , Yanping Li5 ,
Julie M. Thériault6 , Chris M. DeBeer7 , Benita Y. Tam2 , Zhenhua Li5 , Zhuo Liu1 , Jennifer A. Bruneau1 ,
Patrick Duplessis8 , Sébastien Marinier6 , and Dominic Matte9
1 Department   of Environment and Geography, University of Manitoba, Winnipeg, Manitoba, Canada
2 Climate Research Division, Environment and Climate Change Canada, Toronto, Ontario, Canada
3 Watershed Hydrology and Ecology Research Division, Environment and Climate Change Canada,

Saskatoon, Saskatchewan, Canada
4 Meteorological Service of Canada, Environment and Climate Change Canada, Edmonton, Alberta, Canada
5 Global Institute for Water Security, University of Saskatchewan, Saskatoon, Saskatchewan, Canada
6 Centre ESCER, Department of Earth and Atmospheric Sciences, Université du Québec à Montréal,

Montréal, Quebec, Canada
7 Centre for Hydrology and Global Institute for Water Security, University of Saskatchewan, Saskatoon,

Saskatchewan, Canada
8 Dalhousie University, Halifax, Nova Scotia, Canada
9 Niels Bohr Institute, University of Copenhagen, Copenhagen, Denmark

Correspondence: Ronald E. Stewart (ronald.stewart@umanitoba.ca)

Received: 1 February 2019 – Discussion started: 12 February 2019
Revised: 26 June 2019 – Accepted: 17 July 2019 – Published: 23 August 2019

Abstract. The interior of western Canada, up to and in-          as atmospheric forcing of spring floods, although not neces-
cluding the Arctic, has experienced rapid change in its cli-     sarily summer convection. Collective insights of these atmo-
mate, hydrology, cryosphere, and ecosystems, and this is         spheric findings are summarized in a consistent, connected
expected to continue. Although there is general consensus        physical framework.
that warming will occur in the future, many critical issues
remain. In this first of two articles, attention is placed on
atmospheric-related issues that range from large scales down
to individual precipitation events. Each of these is consid-
ered in terms of expected change organized by season and         1   Motivation and objective
utilizing mainly “business-as-usual” climate scenario infor-
mation. Large-scale atmospheric circulations affecting this      Climate and its changes are having huge impacts everywhere.
region are projected to shift differently in each season, with   A particular “hot spot” in Canada in terms of recent temper-
conditions that are conducive to the development of hydro-       ature changes and projections of continuation is the central
climate extremes in the domain becoming substantially more       part of western Canada and its extension to the Arctic Ocean
intense and frequent after the mid-century. When coupled         (DeBeer et al., 2016). Although there is widespread consen-
with warming temperatures, changes in the large-scale at-        sus that warming will continue, there is considerable uncer-
mospheric drivers lead to enhancements of numerous water-        tainty in its magnitude and distribution in time and space.
related and temperature-related extremes. These include win-     There is even greater uncertainty in terms of precipitation, al-
ter snowstorms, freezing rain, drought, forest fires, as well    though it is very likely that there will be less snow and more

Published by Copernicus Publications on behalf of the European Geosciences Union.
3438 R. E. Stewart et al.: Summary and synthesis of Changing Cold Regions Network
rain, and the north will become wetter (Bush and Lemmen,
2019).
All of these changes will likely have a huge impact on wa-
ter resources, the cryosphere, and ecosystems. In terms of
hydrology, this includes the amount of water as well as the
timing of its peak flow; in terms of the cryosphere, this in-
cludes the fate of numerous glaciers, regions of permafrost,
and the duration and amount of snow; in terms of ecosys-
tems, this includes movement of grasslands, tundra, shrubs,
and boreal forests (Bush and Lemmen, 2019).
These critical issues have been the motivation for substan-
tial climate-related research within the central part of west-
ern Canada. Much of this was organized within collaborative
multi-year projects. The first was the Mackenzie GEWEX
Study (MAGS) under the auspices of the Global Energy and
Water Exchanges (GEWEX) project of the World Climate
Research Programme that brought together atmospheric and
hydrological researchers to examine the cycling of water
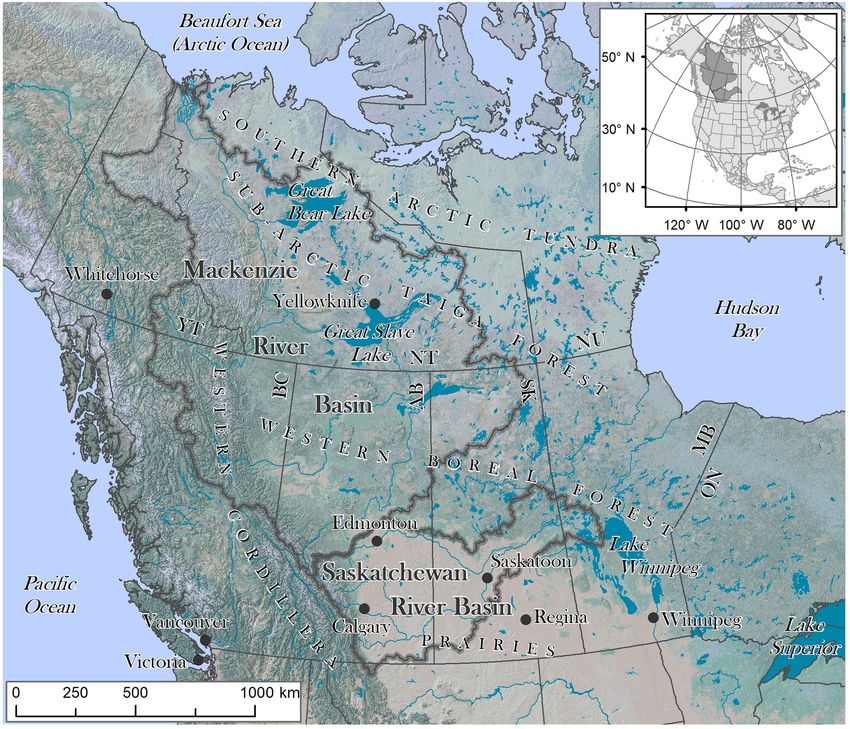
within the Mackenzie River basin (Stewart et al., 1998; Woo Figure 1. The region of concern for this article, with the main
et al., 2008). This was followed by, for example, the Drought focus being on the central region from Alberta to Manitoba and
Research Initiative (DRI) that examined atmospheric, hydro- northwards to the Arctic Ocean. The abbreviations of Canadian
provinces and territories (AB – Alberta; BC – British Columbia;
logic, and land surface processes associated with a devastat-
MB – Manitoba; NT – Northwest Territories; NU – Nunavut; ON
ing 1999–2005 drought across the Canadian Prairies (Stewart
– Ontario; SK – Saskatchewan; YT – Yukon) and names of several
et al., 2011; Hanesiak et al., 2011). In parallel, the West- cities, large water bodies, and several land-cover-related areas are
ern Canadian Cryospheric Network (WC2N) and the Im- also shown. The insert highlights the Mackenzie and Saskatchewan
proved Processes and Parameterization for Prediction in Cold River basins. This map was created using ArcGIS 10.5 under license
Regions Hydrology Network (IP3; http://www.usask.ca/ip3) to the University of Saskatchewan. Shaded relief imagery and wa-
examined hydrologic and cryospheric issues affecting the ter bodies are from the 1 : 10M-scale Natural Earth Raster Data at
western Canadian Cordillera. Major scientific progress was http://www.naturalearthdata.com/downloads/10m-raster-data/ (last
made within these projects, as largely summarized in Sand- access: 13 August 2019). River basins are derived from the National
ford et al. (2018), but their main focus was on examining the Atlas of Canada, Drainage Basins Map at http://atlas.nrcan.gc.ca/
past and present climate and improving the understanding (last access: 13 August 2019).
and modelling of key processes, with relatively little focus
on future conditions.
The importance of these issues and the collaborative foun- most notable, with annual values rising on average 2 ◦ C
dation established by previous projects set the stage for throughout the western interior since 1950. These tempera-
the Changing Cold Regions Network (CCRN). This 5-year ture increases, believed to be mainly due to increased green-
(2013–2018) research program aimed to understand, diag- house and associated atmospheric factors (Bush and Lem-
nose, and predict interactions amongst the cryospheric, eco- men, 2019), have been associated with changes to precipita-
logical, hydrological, and climatic components of the chang- tion regimes and unambiguous declines in snow cover depth,
ing Earth system at multiple scales with a geographical focus persistence, and spatial extent, and it has caused mountain
on western Canada’s rapidly changing cold interior (DeBeer glaciers to recede at all latitudes, permafrost to thaw at its
et al., 2015). Its area of concern is shown in Fig. 1, and this southern limit, and active layers over permafrost to thicken.
includes the Saskatchewan and Mackenzie River systems; Some of these many changes might have accelerated tem-
all geographic locations and terms referred to in this article perature increases largely through ice–albedo feedbacks. De-
are also indicated. CCRN represents a regional hydroclimate spite these changes, integrated effects on annual streamflow
project that was formed under the auspices of the Global En- amounts are complex and often offsetting, but the timing
ergy and Water Exchanges (GEWEX) project of the World of the spring freshet has, in general, advanced to earlier in
Climate Research Programme. the year as a result of rising air temperatures and earlier
Initially, CCRN collated many studies documenting a wide snowmelt.
variety of variables to best characterize recent change over As indicated above, one of the key goals of CCRN is
this region (DeBeer et al., 2016). Widespread change was linked with future conditions. Many articles have utilized cli-
documented in air temperature, precipitation, seasonal snow mate model projections using, for example, Coupled Model
cover, mountain glaciers, permafrost, freshwater ice cover, Intercomparison Project Phase 5 (CMIP5) information (Tay-
and river discharge. Increases in air temperature were the lor et al., 2012) and Intergovernmental Panel on Climate
Hydrol. Earth Syst. Sci., 23, 3437–3455, 2019 www.hydrol-earth-syst-sci.net/23/3437/2019/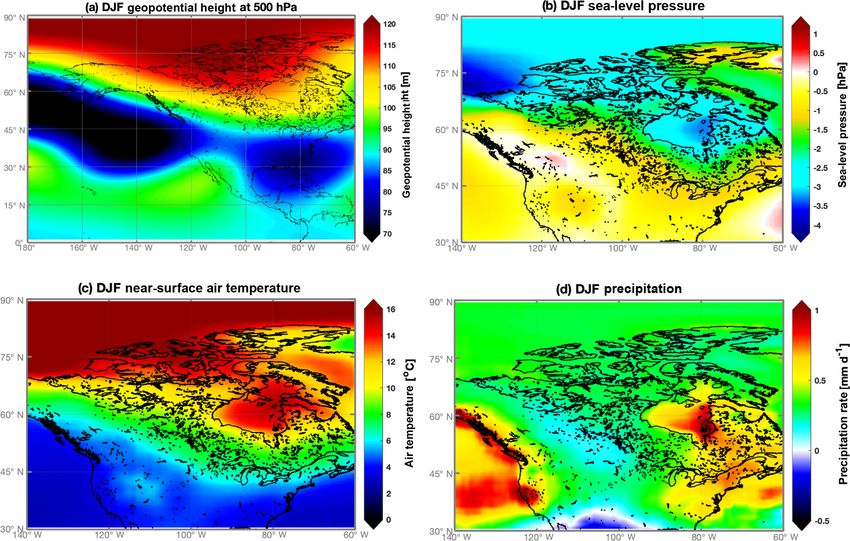
R. E. Stewart et al.: Summary and synthesis of Changing Cold Regions Network                                                    3439

Change (IPCC) reports (such as IPCC, 2013). A summary               Table 1. Model products used in this study as well as time periods
of such studies has recently been developed by Environment          used for mean historical and future conditions. Abbreviations are
and Climate Change Canada (Bush and Lemmen, 2019); the              defined in the text.
CCRN region of interest is projected to continue being sub-
jected to increasing temperatures and associated changes in              Model            Scenario           Time periods
many surface variables, although there is considerable uncer-            CMIP 5           RCP8.5       1981–2000     2081–2099
tainty.                                                                  CRCM5            RCP8.5       1981–2000     2081–2100
   But more insight is required into the processes and drivers           NARCCAP          SRES A2      1971–2000     2041–2070
of this change over the CCRN region, including, for example,             NCEP/NCAR        –            1976–2005     –
physically based examination of features in the future and
conceptual models of change. Such insight provides guid-
ance as to the reliability of models and to research focal
points for improving future projections. We follow this av-         alyzed to gain insight into the cascading processes that link
enue by examining projected changes in several, often re-           regional responses to changes in the large-scale circulations.
lated, phenomena in a physically consistent manner through          In particular, this information was used to generate ensem-
a cascade of scales and through physical understanding.             ble mean, median, as well as the top and bottom 25th per-
   With this background, our objective is to summarize and          centile values. The evolution of several standard and derived
synthesize our collective assessments of future conditions          variables over the 21st century was examined and there was
across the CCRN domain. The breadth of CCRN is so large             a particular focus on differences between mean 2081–2099
that this overall issue cannot be addressed within one article.     and mean 1981–2000 values (Table 1). Similar 20-year long
It is broken into parts as follows: Part 1: climate and mete-       periods were used within the recent Canada’s Changing Cli-
orology and Part 2: terrestrial ecosystems, cryosphere, and         mate Report (Bush and Lemmen, 2019).
hydrology.                                                             This approach does not capture the impacts arising from a
   The specific objective of this first article is to illustrate    full range of emission scenarios. It nonetheless allows for a
how changing large-scale conditions will affect regional and        physically based analysis and interpretation of a business-as-
storm scales with a general, although not exclusive, focus          usual scenario, although it is recognized that there is consid-
on precipitation-related phenomena. This approach facili-           erable uncertainty within this one scenario. The results can
tates increasing our insights into regional hydroclimate re-        be used as a basis for follow-on studies that explore a wider
sponse to projected large-scale circulation changes. Overall        range of possible futures.
warming will be associated with changes in large-scale atmo-           Given the distinct seasonal differences in the study re-
spheric circulations and moisture, but it is critical to quantify   gion’s present and projected climate, results are organized
these changes and to examine consequences on smaller-scale          largely by seasonal change. It is well known that the cli-
features. The article is comprised of key outcomes from com-        mate of the region is strongly influenced by teleconnection
pleted studies, new analyses, as well as an overall synthesis.      patterns that occur on a wide range of spatiotemporal scales
   The article is organized as follows. Section 2 provides a        (Bonsal et al., 2001; Bonsal and Shabbar, 2008; Szeto, 2008).
summary of model datasets and analysis, Sect. 3 examines            In accordance with the objectives of CCRN, we will fo-
issues at seasonal scales, and Sect. 4 addresses phenomena in       cus on intra-annual timescales where the large-scale circu-
more detail within the cold season, spring and early summer,        lation variability exerts the most direct influences on hydro-
as well as summer periods. Section 5 presents a synthesis and       climate extremes within the domain. In particular, emphases
Sect. 6 contains the concluding remarks and sets the stage for      are placed on the analysis of future changes in the Pacific
the second article focused on surface-related issues.               North American (PNA) pattern (Wallace and Gutzler, 1981)
                                                                    which strongly affects the cold-season climate of the region
                                                                    (see for example Table 2 of Szeto, 2008) and quasi-stationary
2   Model datasets and analysis                                     upper-air circulation features over the northwestern USA that
                                                                    exert strong influences on the hydroclimate of southwest-
Given that the main objective of this article is to attain a        ern Canada during the warm seasons (Shabbar et al., 2011;
deeper and more coherent understanding of different regional        Brimelow et al., 2015; Szeto et al., 2015, 2016).
aspects of climate change in western Canada, we adopt the              The projected changes in these cold- and warm-season cir-
notion that climate change alters large-scale circulations that     culation features are examined by calculating the “4-point”
govern much of the climate variability and extremes at re-          PNA index as formulated in Wallace and Gutzler (1981)
gional and smaller scales. This premise provides a perspec-         and the H index introduced in Szeto et al. (2016) using the
tive for analyzing the CMIP5 data and it also provides a dy-        CMIP5 500 hPa geopotential height data, respectively. The
namically based conceptual framework to synthesize the di-          “4-point” PNA index quantifies the amplitude of the PNA
verse regional climate change results. Monthly projections          wave train by comparing the 500 hPa height at four differ-
using the RCP8.5 scenario from 39 CMIP5 models were an-             ent fixed locations and the H index quantifies the magnitude

www.hydrol-earth-syst-sci.net/23/3437/2019/                                      Hydrol. Earth Syst. Sci., 23, 3437–3455, 2019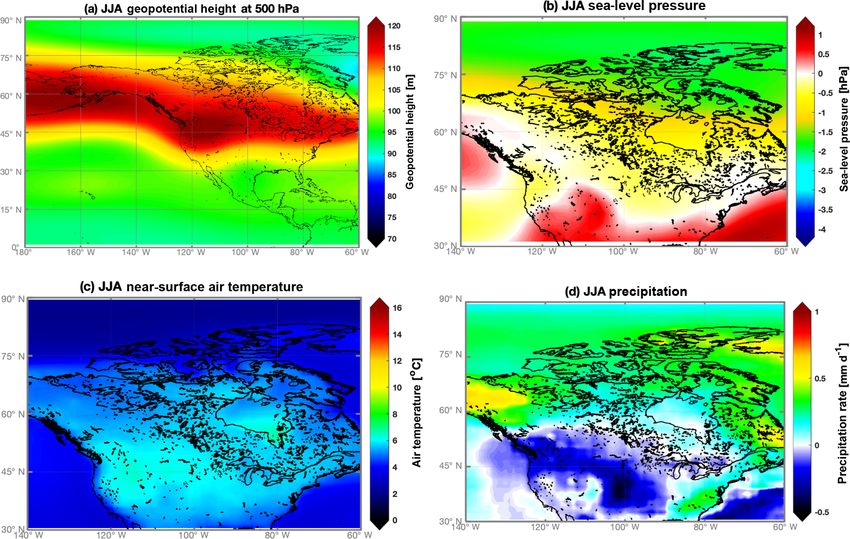
3440                                      R. E. Stewart et al.: Summary and synthesis of Changing Cold Regions Network

of an upper-level circulation feature by comparing the height     of synoptic systems that affect significantly the warm-season
field at the center and enclosing areas of the feature. In ad-    hydroclimate of southwestern Canada are strongly affected
dition to focusing on the most prominent large-scale circula-     by the large-scale upper-level pressure anomaly over the
tions that affect the region, this approach also simplifies the   northwestern US. In particular, anomalously wet (dry) con-
interpretation of the influences of these features on regional    ditions are typically found to be associated with upper low-
warming distribution and future high-impact climate extreme       (high-)pressure anomalies over the region.
events in western Canada. As appropriate, this insight is sup-       Results in Szeto (2008) and Szeto et al. (2015, 2016) show
plemented by those from previous, related studies as well as      that significant correlations are exhibited between hydrocli-
analyses conducted with CMIP5 daily data.                         mate variables in the domain and the intensities of these
   Global climate model (GCM) information is essential, but       seasonal circulation features. In addition, cold- and warm-
additional datasets are needed because the analysis considers     season extreme conditions are often associated with intense
regional and storm scales. New analyses were conducted by         respective circulation anomalies as reflected in extremity of
using regional data to fill in critical research gaps that had    the corresponding PNA and H indices that measure the in-
not been addressed in previous regional studies (Table 1).        tensity of these circulation anomalies. Since there are physi-
Those include dynamically downscaled regional and storm-          cal bases for such associations between regional climate vari-
scale datasets such as CRCM5 (Canadian Regional Cli-              ability and extremes in the domain and these large-scale cir-
mate Model version 5, Martynov et al., 2013 and Šeparović        culation anomalies, it is not unreasonable to assume that such
et al., 2013), NARCCAP (North American Regional Cli-              relationships will also hold for future changes in these large-
mate Change Assessment Program, Mearns et al., 2013),             scale drivers and the regional climate responses. We further
NCEP/NCAR (National Centers for Environmental Predic-             assume that any significant future changes in the mean circu-
tion/National Center for Atmospheric Research) re-analysis        lation pattern will, at least partially, be manifested in changes
(Kalnay et al., 1996), and Environment and Climate Change         in the intensity and/or the frequency of similar anomalous
Canada (ECCC) weather station information.                        circulation patterns with respect to current conditions. This
   As appropriate, the historical period is generally consid-     assumption will be verified with model data in the follow-
ered to be 1981–2000, although some Fourth Assessment Re-         ing and the validity of this assumption will lend support to
port (AR4) analyses have used 30-year averages with 1971–         the idea that changes in the mean circulation could be linked
2000 as the base period. Temporal changes are examined            with extreme climate responses in the area.
over various domains, although one focus is the southern
Prairies bounded here by the latitude–longitude box (95–          3.1   Autumn
115◦ W, 47.5–55◦ N).
                                                                  Projected mid-tropospheric (500 hPa) circulation changes re-
                                                                  semble a westward-shifted negative PNA pattern (Fig. 2a).
3   Large- and regional-scale patterns                            An anomalous trough is projected to occur above British
                                                                  Columbia/Yukon and extend into the Pacific off the western
As we are focusing the discussion on projected changes in         coast of the US, while an anomalous high is projected to oc-
the PNA pattern and quasi-stationary upper-air circulation        cur over the southwestern vicinity of the Aleutian Islands.
features over the northwestern US, it is appropriate to briefly   These circulation anomalies, as well as those to be discussed
summarize how these large-scale drivers affect the current        below for other seasons, are deep structures that extend to the
hydroclimate climate over western Canada during the cold          top of the troposphere. Similar circulation patterns are typi-
and warm seasons, respectively.                                   cally found during negative PNA conditions, with an anoma-
   The autumn and winter positive (negative) PNA pattern is       lous low centered above the southern Prairies and a high
characterized by large-scale upper-level negative (positive)      above the Aleutians. Corresponding changes in anomalous
and positive (negative) height anomalies centered above the       mean sea-level pressure (MSLP) include a projected high
Aleutian Islands and the western Canadian Prairies, respec-       centered just east of the upper high and a trough that extends
tively. At the surface, a broad anomalous low (high) centered     from the Arctic Ocean into central northern Canada. Circula-
just south of the Aleutians and extending into the Macken-        tion changes at higher levels effectively reduce the waviness
zie basin is typically found during the positive (negative)       of the upper flow and jet stream by weakening both the cli-
phase. The warm (cold) temperature advections associated          matological Aleutian low and the upper ridge over western
with the low-level southwesterly (northwesterly) anomalous        Canada.
flow typically induces warm (cold) temperature anomalies             The time series of the SON PNA index (Fig. 3a) sug-
over northwestern Canada during positive (negative) PNA.          gests that the afore-mentioned circulation change is projected
In addition, dry (wet) conditions over the western Prairies       to commence around the mid-century. Although inter-model
are associated with the positive (negative) pattern.              spread as measured by the interquartile range is large, a sta-
   As shown in Shabbar et al. (2011), Brimelow et al. (2015),     tistically significant (at 5 % level) decreasing trend of the en-
and Szeto et al. (2015, 2016), the tracking and development       semble median is projected to occur during the second half

Hydrol. Earth Syst. Sci., 23, 3437–3455, 2019                                   www.hydrol-earth-syst-sci.net/23/3437/2019/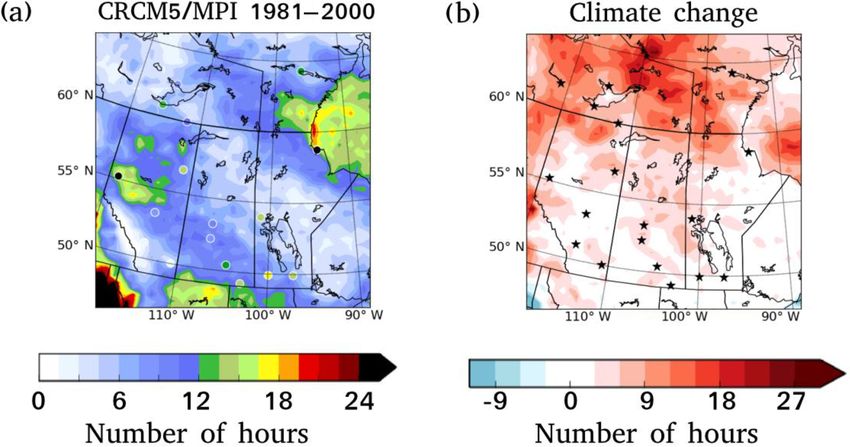
R. E. Stewart et al.: Summary and synthesis of Changing Cold Regions Network 3441
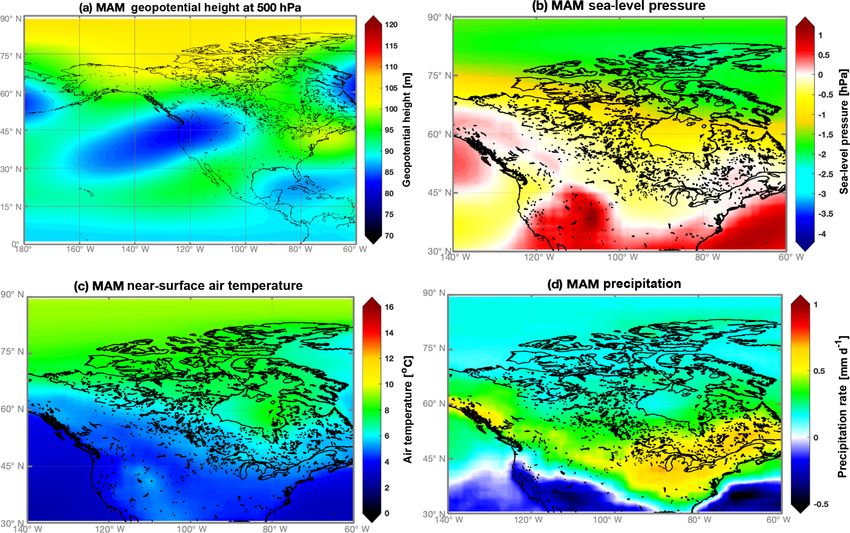
Figure 2. CMIP5 RCP8.5 projected changes in the 39-model ensemble mean between the periods (2081–2099) and (1981–2000) for autumn
(SON). For each 3-month period, the four panels show differences in (a) 500 hPa height (m), (b) sea-level pressure (hPa), (c) near-surface
(2 m) air temperature (◦ C), and (d) precipitation rate (mm d−1 ).
of the century. The mean near-neutral PNA condition that level background baroclinicity and synoptic storms that af-
characterizes the first half of the century is replaced by mean fect southwestern Canada.
negative (−0.26) conditions and 9 out of the 10 strongest Quasi-geostrophic theory (e.g., Holton, 1979) predicts that
negative PNA autumns are found after 2060; this latter result cyclone activities would be enhanced in the downstream
provides support to the assumption that changes in the mean vicinity of the upper anomalous trough, i.e., over southwest-
circulation pattern are partly manifested in changes in the ern Canada. Despite the potential increases in autumn cy-
frequency and/or intensity of the extreme similar anomaly clones and atmospheric moisture in the warming environ-
patterns. ment, Prairie precipitation is projected to increase by only
Projected regional climate responses to the circulation ∼ 10 %. This is likely related to the significant depletion of
changes are consistent with those found during negative Pacific moisture over the coastal mountains and enhanced
PNA, but are shifted in association with the projected cir- lee-side subsidence that are associated with the enhanced
culation features. In particular, the cold air advection into cross-barrier flow discussed earlier. As a result, although the
northwestern Canada by the anomalous anti-cyclonic flow precipitation increase is statistically significant (i.e., the in-
associated with the surface North Pacific high found in typ- crease is larger than the natural variability of historical mod-
ical negative PNA conditions is much reduced due to the elled precipitation for the region), it is substantially lower
westward-shifted location of the high. Instead, the surface than the relative increases projected for the winter and spring.
high enhances low-level flows towards the Pacific coast of These results indicate that the complex topography of the re-
Canada, which when combined with the upper low over gion, as well as changes in the synoptic-scale forcing, could
British Columbia would substantially enhance precipitation play an important role in affecting the autumn precipitation
over the coastal regions (Fig. 2d). The enhanced cross-barrier over the Prairies under this warming scenario.
flow and associated precipitation induce subsidence and adi-
abatic warming over the Prairies (Szeto, 2007; Szeto et al., 3.2 Winter
2007; Szeto, 2008). The warming over the south effectively
reduces the S–N gradient of net anthropogenic warming The winter anomaly pattern is projected to be characterized
(Fig. 2c) and partly offsets its detrimental effects on the low- by a pronounced upper low centered in the eastern Pacific
and enhanced ridging over central northern Canada (Fig. 4a).
In contrast to projected SON changes, the circulation change
www.hydrol-earth-syst-sci.net/23/3437/2019/ Hydrol. Earth Syst. Sci., 23, 3437–3455, 2019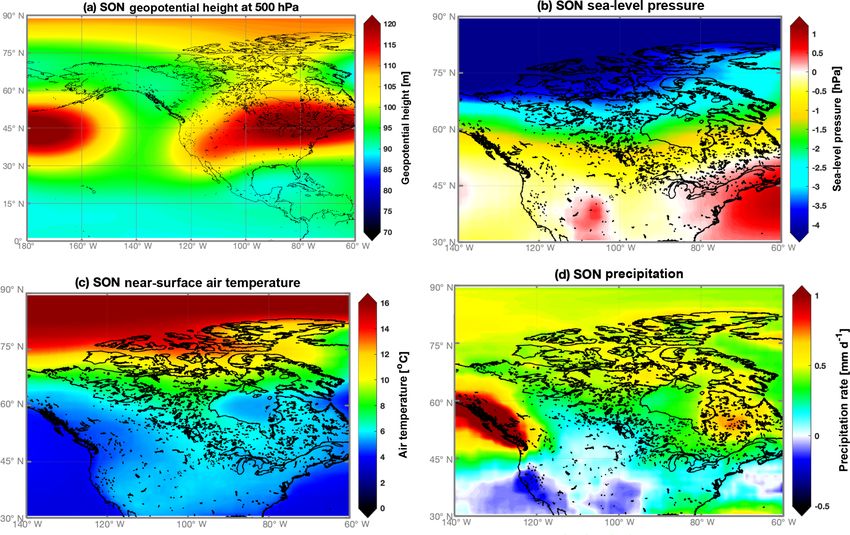
3442                                          R. E. Stewart et al.: Summary and synthesis of Changing Cold Regions Network

                                                                         strengthening and broadening the North Pacific upper trough
                                                                         towards the western coast of the US while broadening the
                                                                         climatological upper ridge and making the flow more zonal
                                                                         over northwestern Canada. Some changes at the lower lev-
                                                                         els (Fig. 4b) are similar to those found in positive PNA con-
                                                                         ditions, with an anomalous trough extending from the Aleu-
                                                                         tians into areas off the western coast of North America. But a
                                                                         strong anomalous surface ridge that is typically located over
                                                                         the western US under positive PNA conditions is projected
                                                                         to be centered over southwestern Canada.
                                                                            Similar to positive PNA conditions, the low-level high–
                                                                         low couplet allows the warm Pacific air to be advected into
                                                                         the Yukon and the Mackenzie basin. On the other hand, the
                                                                         reduced onshore flow could decrease the precipitation along
                                                                         the British Columbia coast and the associated weakening of
                                                                         adiabatic warming and lee cyclogenesis over the southern
                                                                         Prairies. These combined effects enhance the S–N anthro-
                                                                         pogenic warming gradients (Fig. 4c), weaken the background
                                                                         surface frontal zone, and contribute to the development of the
                                                                         anomalous surface ridging in the region. For example, the
                                                                         mean DJF N–S near-surface temperature gradient over the
                                                                         southern Prairies is projected to decline by ∼ 25 % towards
Figure 3. The (a) autumn (SON) and (b) winter (DJF) PNA in-              the end of the century. In addition, the weakened mean up-
dex over the 21st century computed by applying CMIP5 ensem-              per northwesterly flow over northwestern Canada reduces the
ble model information to the formula given in Wallace and Gut-           number of North Pacific systems that enter Alaska to migrate
zler (1981). The lines indicate the median, 25th percentile, and 75th    down to the southern Mackenzie basin. Collectively, these
percentile. Also shown are piecewise linear regression lines sepa-       changes in circulation and dynamic features are expected to
rated at the “break” year indicated by the dashed line. Assessments      reduce the frequency and intensity of weak cyclones that typ-
using the Mann–Kendall method (Kendall, 1955) show that the af-          ically affect the region in winter.
ter (before) break trend for SON (DJF) is significant at 5 % (10 %),        Despite these considerations, winter precipitation at the
while the other trends are not significant. The before and after break
                                                                         end of the century is projected to increase by approximately
trends are significantly different at 5 % (10 %) for SON (DJF).
                                                                         19 % over the Prairies and by larger amounts at higher lat-
                                                                         itudes. This 19 % increase is significantly higher than that
                                                                         predicted for SON. This result can be explained by consider-
resembles an eastward-shifted positive PNA pattern. An in-               ing the anomalous upper- and low-level troughs projected to
creasing trend, albeit merely significant at the 10 % level, in          occur off the US western coast which allow more moisture-
the ensemble-median DJF PNA index is found only during                   laden Pacific systems to develop and affect the western US,
the first half of the century (Fig. 3b). An abrupt “jump” is             as reflected in the enhanced troughing and precipitation pro-
projected to occur at the end of the increasing trend during             jected over this region (Fig. 4b and d). With the weakened
the late 2050s where the piecewise linear regression lines               mean upper northwesterly flow over western Canada, some
over the two periods are separated by a statistically signifi-           of these moisture-laden southern systems could be able to
cant gap that is larger than the variability of the index. The           track into the Prairies and produce more frequent extreme
significance of the mid-century change is reflected in the               winter precipitation events.
marked increase in the mean PNA index from 0.10 in the                      Preliminary analysis of projected daily Prairie precipita-
first half of the century to 0.37 in the second half as well as          tion provides strong support for the above inference. It is a
in the fact that all of the 10 projected strongest PNA win-              preliminary analysis because we only have access to daily
ters occur after 2060. This latter result also provides support          data for 21 out of the 39 models for this analysis. The re-
to the assumption we made about the relationship between                 sults show that, although the ensemble mean frequency of
changes in the mean and extreme patterns.                                precipitation days (daily precipitation P > 0.5 mm d−1 ) only
   These results might be related to those of Zhou et                    increases marginally from 743 d during 2006–2020 to 778 d
al. (2014), who showed that the eastward shift of tropical               during the last 15 years of this century, the corresponding fre-
convective anomalies under climate warming would cause                   quency of extreme precipitation days (daily P > Pc, the 99th
the ENSO-forced winter PNA pattern to move eastward and                  percentile of daily P during DJF 2006–2020) increases from
intensify. These projected changes effectively enhance the               10 to 29. In addition, although the mean frequency of ex-
waviness of the upper flow and jet over the North Pacific by             tended (longer than 1 d) precipitation events hardly changes

Hydrol. Earth Syst. Sci., 23, 3437–3455, 2019                                          www.hydrol-earth-syst-sci.net/23/3437/2019/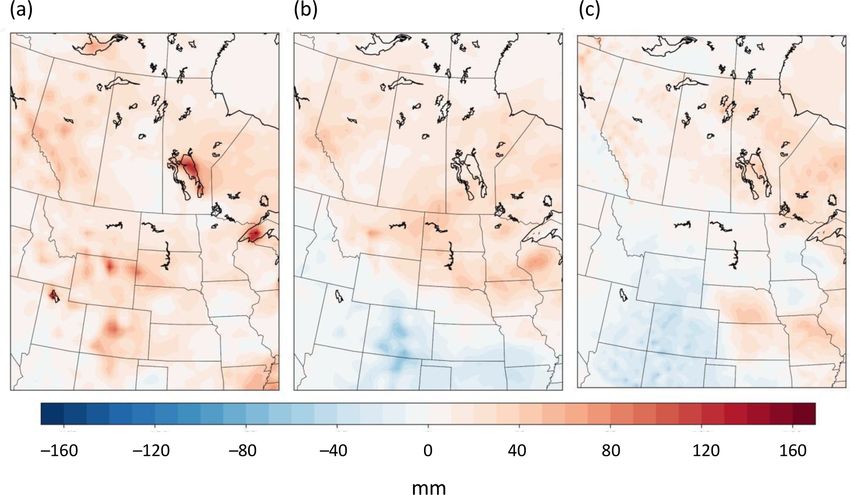
R. E. Stewart et al.: Summary and synthesis of Changing Cold Regions Network                                                3443

Figure 4. As in Fig. 2 but for winter (DJF).

between the two periods (157 versus 158), the frequency of        Canadian regions. As a result, cyclone activity that affects the
extended extreme precipitation events (multi-day events with      region is expected to increase, as reflected in the anomalous
daily P > Pc) increases 5-fold from 0.6 to 3.3 between these      N–S surface trough that extends from Hudson Bay into the
two periods.                                                      eastern Prairies and central US (Fig. 5b).
                                                                     Consequently, spring precipitation is projected to increase
3.3   Spring                                                      significantly over southern Canada in general (Fig. 5c). For
                                                                  example, Prairie MAM precipitation increases by 26 %, the
                                                                  largest among the seasons. This Prairie spring precipitation
The most prominent circulation anomaly feature is the quasi-
                                                                  is projected to increase starting from the 1990s and continue
stationary upper low centered over the northwestern US
                                                                  until around 2060 (not shown) following the stabilization of
(Fig. 5a). This large-scale setting favors the development of
                                                                  the anomalous upper low. It is noteworthy that the predicted
cyclones that bring warm-season precipitation to southwest-
                                                                  intensification of the upper low and associated increasing
ern Canadian regions (Szeto et al., 2011, 2015, 2016). The
                                                                  trends of mean and extreme precipitation over the eastern
intensity of the low can be quantified by the H index as de-
                                                                  Prairies during the turn of the century are also evident in ob-
tailed earlier and the development of this feature is shown in
                                                                  servations (Szeto et al., 2015).
Fig. 6. The low is a robust feature projected by most models
                                                                     Results from the analysis of daily Prairie precipitation pro-
(Fig. 6a). The mean magnitude of the low (i.e., negative H in-
                                                                  vide further insight into the regional precipitation response
dex) is projected to intensify mainly during the mid-century
                                                                  to the circulation change. In particular, the frequency of
(Fig. 6a). In fact, the 20-year mean H (not shown) decreases
                                                                  extreme precipitation days (daily P > Pc, where Pc is the
by 15 m (from −10 to −25 m) during 2045–2065, suggesting
                                                                  99th percentile of daily P during MAM 2006–2020) doubles
that some radical changes in the MAM large-scale circula-
                                                                  from 10.5 d during the early century period to 20.4 d towards
tions are projected to occur mid-century. It is noteworthy that
                                                                  the end of the century (2086–2100). In addition, although
this mid-century decrease in 20-year mean H is even larger
                                                                  the mean frequency of extended precipitation events hardly
than the standard deviation of H over the century (13.9 m).
                                                                  changes between the two periods (153 versus 156), the fre-
In addition, 8 of the 10 lowest H index springs, i.e., springs
                                                                  quency of extended extreme precipitation events increases 3-
that are likely to be associated with extreme wet conditions
                                                                  fold from 1.2 to 3.7 between these two periods. Although
over the Prairies, occur after 2040. At the lower levels, the
                                                                  both the DJF and MAM results suggest substantial future
S–N warming gradient is relatively weak (Fig. 5c) and thus
                                                                  increases in extreme precipitation events, it is noteworthy
has little effect on the mean frontal zone across the southern

www.hydrol-earth-syst-sci.net/23/3437/2019/                                    Hydrol. Earth Syst. Sci., 23, 3437–3455, 2019
3444                                       R. E. Stewart et al.: Summary and synthesis of Changing Cold Regions Network

Figure 5. As in Fig. 2 but for spring (MAM).

that, although the relative seasonal precipitation increase for    3.4   Summer
MAM is higher, the increase in extreme precipitation event
frequency is somewhat higher for DJF. The apparent discrep-        In contrast to the projected spring conditions, the most
ancy is likely related to the difference in the model ensem-       prominent circulation anomaly feature is the quasi-stationary
bles (21 versus 39 members for daily and monthly analysis,         upper high centered over the northwestern US and south-
respectively) that were used in the assessments.                   ern British Columbia (Fig. 7a). This blocks cyclones that
   The long-term mean large-scale upper low pressure               bring warm-season precipitation to southwestern Canadian
anomaly would allow more upper low systems to enter the            regions. The decreased summer cyclone activity is also re-
continent through the northwestern US. Analyses of histori-        flected in the anomalous N–S surface ridge over the west-
cal extreme Prairie precipitation events (not shown) suggest       ern continent (Fig. 7b). Schubert et al. (2016) had previously
that the location of heavy precipitation is sensitive to the lo-   pointed out that SST values over the Pacific also affect pre-
cation of the upper low due to the topography that character-      cipitation deficits over the continent, and Li et al. (2018) in-
izes the region. In particular, strong upslope rainstorms over     dicated that expected higher SST values in the central Pacific
southern Alberta, similar to the one that caused the 2013 Cal-     by the end of the century will affect the Madden–Julian Os-
gary flood (Pomeroy et al., 2015; Liu et al., 2016; Kochtuba-      cillation in a manner conducive to reduced summer precipita-
jda et al., 2016; Li et al., 2017), could result from upper lows   tion over the Canadian Prairies. It is not clear though whether
that are located over the northwestern US, whereas flood-          the anomalous upper high is related to such pattern changes
producing extreme rain events over the eastern Prairies (see       over the central Pacific.
for example Brimelow et al., 2014; Szeto et al., 2015) could          The development of the anomalous upper high is evident
result from upper lows that were centered only slightly to         in the time series of the JJA H index (Fig. 6b). Unlike the
the east. Furthermore, some systems that track slowly across       spring upper low that is projected to be located at the same
the region could bring extreme precipitation to both the east-     general location, the intensification of the high is expected
ern and western regions (e.g., Szeto et al., 2011). When           to accelerate after the mid-2040s when a significant (at 5 %)
combined with the increased winter precipitation and earlier       increasing trend commences. The mean index increases by
snowmelt and freshet in a warmed climate, the expected in-         19.1 after the “break” which is larger than the standard devi-
crease in extreme spring precipitation could substantially in-     ation of the index during the century (17.2). It is also notable
crease the risk of extreme Prairie spring floods over both the     that all of the top 10 highest H index summers, i.e., sum-
western and eastern Prairies.                                      mers with extreme warmth and dryness likely occurring in
                                                                   the Prairies, occur after 2050.

Hydrol. Earth Syst. Sci., 23, 3437–3455, 2019                                    www.hydrol-earth-syst-sci.net/23/3437/2019/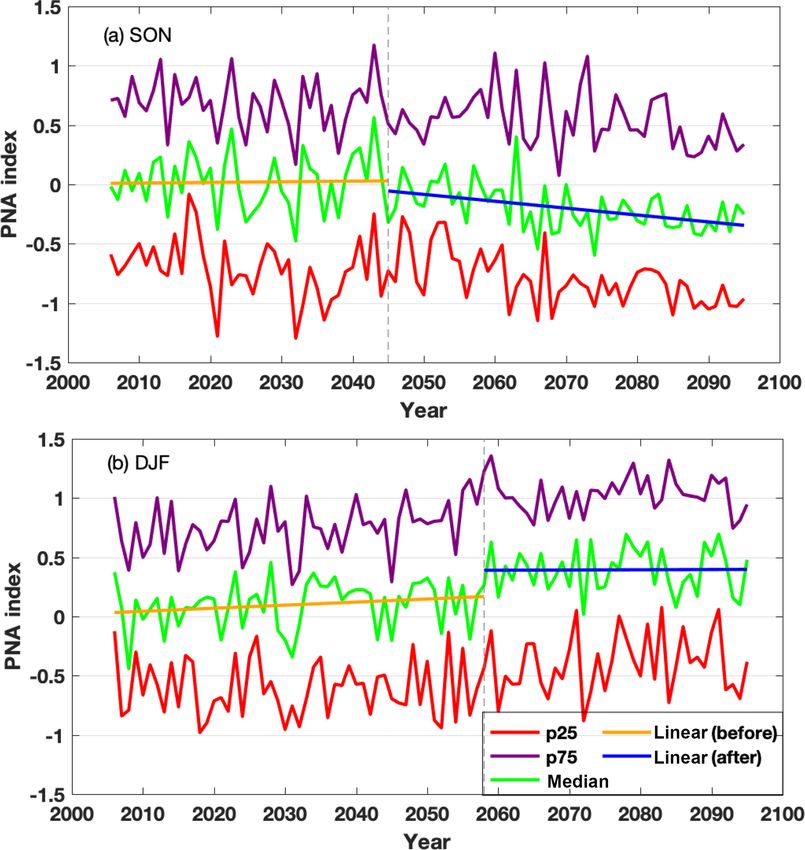
R. E. Stewart et al.: Summary and synthesis of Changing Cold Regions Network                                                        3445

                                                                           warming, could increase the potential for summer drought
                                                                           and wildfires over western Canada. Increases in surface sen-
                                                                           sible and latent heat fluxes that would accompany the pro-
                                                                           jected strong warming could also enhance convective activ-
                                                                           ity. On the other hand, the projected upper high is expected
                                                                           to suppress convection when fully developed. As a result, it
                                                                           is not clear how summer convection might change during the
                                                                           mid-to-late century; it may be enhanced or suppressed.

                                                                           4     Examination of critical phenomena

                                                                           Although Sect. 3 addressed numerous phenomena, three
                                                                           overarching categories were investigated in more detail. They
                                                                           are organized under cold season, spring, and early summer,
                                                                           as well as summer issues.

                                                                           4.1     Cold season and near 0 ◦ C conditions

                                                                           The location of the 0 ◦ C isotherm is a critical aspect of this
                                                                           region’s climate. It is closely linked with the melting of snow
                                                                           at the surface which in turn affects albedo, land–atmospheric
                                                                           energy exchange, and precipitation runoff (Jennings et al.,
Figure 6. H index for (a) the spring (MAM) anomalous low and
                                                                           2018). Precipitation near this temperature furthermore varies
(b) summer (JJA) anomalous high centered over the northwest-
ern USA during the 21st century projected from CMIP5 ensemble              greatly in occurrence and type and can be linked with major
model information. The lines indicate the median, 25th percentile,         hazards (e.g., freezing precipitation). Changes in these fea-
and 75th percentile. Also shown are piecewise linear regression            tures are examined here.
lines separated at the “break” year indicated by the dashed line. As-
sessments using the Mann–Kendall method (Kendall, 1955) show               4.1.1    0 ◦ C isotherm movement and pattern
that only the after break trend for JJA is significant at the 5 % level.
The before and after break trends are significantly different at 5 %       In association with overall warming, the near 0 ◦ C region will
for JJA only.                                                              move northward. To quantify this, monthly average locations
                                                                           of the 0 ◦ C isotherm were calculated from different model
                                                                           datasets. The NCEP/NCAR re-analysis was used to compute
   Under the influence of the upper high, downward solar ra-               locations for 1976–2005. The future time periods were com-
diation is projected to increase up to ∼ 5 W m−2 over the                  puted by adding the CMIP5 39-model ensemble median of
southern Prairies by 2100. JJA near-surface air temperature                the RCP8.5 10-year mean air temperature delta (future period
is expected to increase by ∼ 2 ◦ C over the next 30 years (by              – 1976–2005 historical) projected for three different periods
2050) and by an additional 4 ◦ C over the following 50 years               (2046–2055, 2066–2075, 2086–2095) to the NCEP/NCAR
(by 2100) along with even stronger warming over its south-                 climatology. Locations of the isotherm for each ensemble
ern vicinity. As a result, a “hot spot” with maximum summer                member were estimated by interpolating air temperatures
warming that extends into southwestern Canada is projected                 onto a 1◦ by 1◦ latitude–longitude grid.
to be induced under the upper high (Fig. 7c). The projected                   Results of these calculations are shown for 2 months
large-scale changes induce a significant decrease in precip-               (March and November) that illustrate some of the greatest
itation over the Great Plains (Fig. 7d). In accordance with                movements (Fig. 8). In central regions of the country, the
the temporal development of the upper high, the Prairie JJA                movement of the 0 ◦ C isotherm is of order 50–100 km per
precipitation is projected to remain rather constant until ap-             decade (especially in November), although it is much less in
proximately 2070 and then decrease by 5 % towards the end                  some areas of high terrain in the western Cordillera. The high
of the century. Although this is not a significant decrease,               terrain means that the near 0 ◦ C region would move vertically
summer is the only season with projected reduction in pre-                 but little horizontally.
cipitation over the study region. In contrast, evapotranspira-                Note that there is considerable variation between models
tion (not shown) is projected to increase slowly until 2060                in the actual locations of this isotherm. Some of the narrowest
(∼ 6 % of historical values) and then decrease very slowly                 spreads occur in the interior of the country, far from oceans
again towards the end of the century.                                      and mountains. In the western Cordillera, the spread is large
   The reduction in summer precipitation, along with the                   in part due to different regions having high terrain which
enhanced evapotranspiration induced by the strong surface                  strongly influences the locations of this isotherm. Oceanic

www.hydrol-earth-syst-sci.net/23/3437/2019/                                              Hydrol. Earth Syst. Sci., 23, 3437–3455, 2019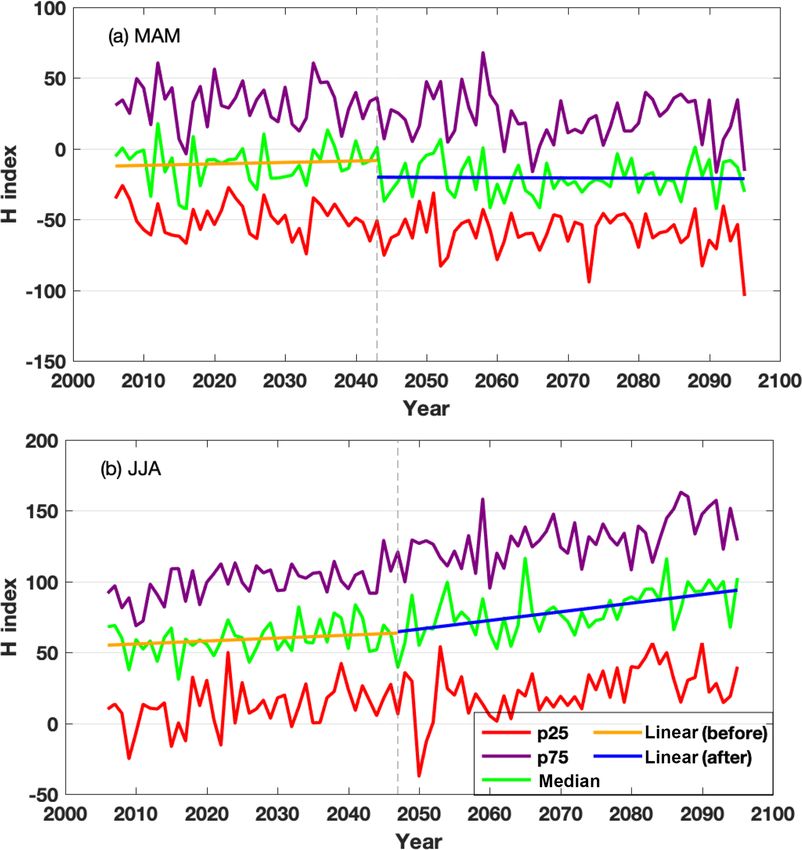
3446                                           R. E. Stewart et al.: Summary and synthesis of Changing Cold Regions Network

Figure 7. As in Fig. 2 but for summer (JJA).

                                                                       regions also exhibit large spreads, with the East Coast and
                                                                       Hudson Bay being impacted by variable sea-ice cover.
                                                                          This large spread in projected western Cordillera patterns
                                                                       is accentuated when considering whether rain or snow will
                                                                       fall. For example, in the spring of 2015 in the Kananaskis
                                                                       area of the Alberta foothills, a mixture of rain and snow has
                                                                       been observed at temperatures as high as 9 ◦ C in some events,
                                                                       whereas it only occurred below 2–3 ◦ C in other events (Théri-
                                                                       ault et al., 2018).
                                                                          Critical factors behind such varying observations include
                                                                       the near-surface vertical profiles of temperature and atmo-
                                                                       spheric moisture as well as the density of the falling solid
                                                                       precipitation. For example, low (high) values of particle den-
                                                                       sity lead to rapid (slow) melting and a low (high) upper
                                                                       temperature threshold. This dependence of surface precip-
                                                                       itation phase on particle density has been quantified using
                                                                       a one-dimensional column cloud model coupled to a micro-
                                                                       physical scheme (Sankaré and Thériault, 2016). Snow pellets
                                                                       (high density of 400 g m−3 ) would fall approximately 200 m
Figure 8. Locations of the 0 ◦ C isotherm during (a) March and         more before melting than would snowflakes (low density of
(b) November over four different time periods. The NCEP/NCAR           100 g m−3 ) under the same vertical temperature and moisture
re-analysis was used to compute locations for 1976–2005. The fu-
                                                                       profile (Duplessis et al., 2016). This can lead to solid, instead
ture time periods were computed by adding the CMIP5 39-model
                                                                       of liquid, precipitation at the surface. Such factors make the
ensemble median of the RCP8.5 10-year mean air temperature delta
(future period – 1976–2005 historical) projected for three different   determination of the rain–snow transition a challenging issue
periods to the NCEP/NCAR climatology. The grey area shows the          even in the present climate, let alone the future one.
region bounded by the 0 ◦ C isotherms in the 25th and 75th ensemble
percentiles of the 2086–2095 mean air temperatures.

Hydrol. Earth Syst. Sci., 23, 3437–3455, 2019                                        www.hydrol-earth-syst-sci.net/23/3437/2019/
R. E. Stewart et al.: Summary and synthesis of Changing Cold Regions Network 3447
4.1.2 Freezing rain et al., 2015). Such persistent patterns were linked with spring
or early summer rainfall that contributed to flooding on the
The movement of near 0 ◦ C conditions must be linked with Assiniboine River in 2011 and 2014; this precipitation also
changes in freezing rain occurrence. This type of precip- coincided with snowmelt.
itation, not even considering its accumulation, is difficult A few studies have examined how such persistent pat-
to simulate and project into the future. Atmospheric fac- terns are expected to change across different regions of
tors driving its formation over the CCRN region typically the Prairies. Szeto et al. (2015) found that persistent pat-
include extra-tropical cyclones with warm fronts, although terns conducive to eastern Prairie spring and early sum-
chinook-associated patterns are also important (Kochtuba- mer enhanced precipitation and flooding may become
jda et al., 2017a); surface factors include the degree of sea more pronounced. Using 500 hPa output from several
ice over Hudson Bay that, when present, acts to maintain RCM/GCM combinations, Bonsal et al. (2017) and Bon-
the necessary cold near-surface temperatures. The generally sal and Cuell (2017) identified future (2041–2070) changes
low occurrence of freezing precipitation, in comparison with to the frequency of key summer (JJA) circulation patterns
other regions, is partially attributable to particle sublimation associated with extreme dry and wet conditions over the
or evaporation below cloud (Kochtubajda et al., 2017a). southwestern Canadian Prairies and the Athabasca River
To assess future changes in the occurrence of freezing basin (ARB), respectively. Most of the models simulated
rain, the fifth generation of the Canadian Regional Climate general features of observed circulation patterns, and these
(CRCM5) model with a 0.44◦ grid mesh was used (Fig. 9). also occur in the future but with some changes to their aver-
CRCM5 was driven by the GCM from the Max Planck Insti- age frequency. However, there was considerable inter-model
tute for Meteorology Earth System Model (MPI-ESM-MR) variability.
for the 1981–2000 and 2081–2100 periods using the RCP8.5 Flooding events in Canada are often associated with nu-
scenario (Moss et al., 2010). Freezing rain was diagnosed merous factors (including extreme precipitation) that oc-
using the technique developed by Bourgouin (2000); this cur in combination. For example, one critical aspect of the
approach is used operationally at ECCC. Results shown in 2014 Assiniboine flood was a cool spring followed by rapid
Fig. 9a indicate that the model driven by MPI-ESM-MR re- snowmelt combined with above-normal precipitation (Szeto
produced the general pattern of the mean annual number of et al., 2015). MAM temperatures were approximately 2.5 ◦ C
hours of freezing rain over the domain and basically shows below the 1995–2014 normal and AMJ precipitation was ap-
the same features as a hindcast simulation driven by reanal- proximately equal to the 90th percentile of AMJ precipitation
ysis data (not shown), but somewhat weaker. The main dif- that occurred during 1950–2005.
ferences are a strong negative bias west of Hudson Bay as CMIP5 information was examined to determine whether
well as in an area stretching from northern Alberta to south- the likelihood of this combination would change in the fu-
ern Manitoba. This latter area is likely due to the cold bias for ture. Comparisons of historical and projected future surface
that region as suggested by Šeparović et al. (2013); it is pro- temperatures over the eastern Prairies (not shown) suggest
duced by the cold sea surface temperature bias in the North that spring melt would commence in February and be com-
Pacific in the driving data. pleted in March towards the end of the century. As such,
Projections suggest little change in the southern portion of the frequency of wet MAM and cool FM during 2081–2100
the region but increases in excess of 20 h yr−1 in the North- is compared to historical (1986–2005) wet AMJ combined
west Territories. Such increases are comparable to current with cool MA, using the anomalous conditions for the 2014
annual values. This pronounced increase in the north is due, flood as criteria for each model. The focus area is the eastern
at least in part, to the northward movement of near 0 ◦ C tem- Prairies (47.5–55◦ N latitude by 255–262.5◦ E longitude).
peratures (Sect. 4.2.1). Results indicate that the ensemble mean frequency of wet
MAM (i.e., MAM with a P > 90th percentile of MAM pre-
4.2 Spring and early summer flooding cipitation during 1950–2005) is projected to be 4.6 seasons
per decade, which is substantially higher than the corre-
Flooding often occurs across this region in the spring and sponding mean frequency of 1.2 seasons per decade for wet
early summer. One such area is the eastern Prairies and it AMJ during 1986–2005. In addition, the mean frequency
has experienced devastating events recently. Future aspects of combined wet MAM and cool FM (i.e., FM temperature
of these floods are examined here from an atmospheric per- 2.5 ◦ C cooler than the 2081–2100 mean) was projected to
spective. be 0.8 seasons per decade, which is 8 times larger than the
Large- to synoptic-scale atmospheric forcing is critical to frequency of 0.1 seasons per decade estimated for the co-
the likelihood of spring and early summer flooding over the occurrence of wet AMJ and cool MA during 1986–2005.
eastern Prairies. In particular, persistent atmospheric patterns The results suggest that the projected large-scale atmospheric
often bring extended periods of precipitation extremes, either conditions that are favorable for the development of wet
wet or dry, depending on location across the region relative MAM could substantially increase the risk for eastern Prairie
to the circulation pattern (Brimelow et al., 2014, 2015; Szeto floods that are associated with cool and wet springs.
www.hydrol-earth-syst-sci.net/23/3437/2019/ Hydrol. Earth Syst. Sci., 23, 3437–3455, 20193448 R. E. Stewart et al.: Summary and synthesis of Changing Cold Regions Network
Figure 9. The mean annual number of hours of freezing rain (a) observed and simulated by the CRCM5 driven by MPI-ESM-MR for the
1981–2000 period, and (b) the change in the number of hours based on the difference between 2081–2100 and 1981–2000 assuming the
RCP8.5 scenario. Observational locations are indicated by circles in (a) and stars in (b).
4.3 Summer severe conditions annual and summer scales for the periods 2041–2070 and
2071–2100 (relative to 1971–2000) using the RCP4.5 and
Summer across the region can be associated with severe con- RCP8.5 emission scenarios. They found that southern wa-
ditions ranging from widespread drought to severe thunder- tersheds showed a gradual increase in annual water deficit
storms. Their combination can furthermore be key factors throughout the 21st century, whereas the opposite was true
linked with forest fires. Expected changes in these phenom- for northern basins. In contrast, for summer, all river basins
ena are examined here. with the exception of the extreme northern ones were ex-
pected to experience decreasing water availability.
4.3.1 Drought A comprehensive Canada-wide drought study assessed
changes in the SPEI using outputs from 29 CMIP5 models
The projected large-scale summer changes (Fig. 7) are ex- (Tam et al., 2018). In agreement with Fig. 7, results showed
pected to impact future drought conditions. Given that past strong relative summer drying during the 21st century over
droughts over western Canada have been associated with a much of western Canada, including interior southern British
persistent mid-tropospheric (500 hPa) large-amplitude ridge Columbia, as well as western–central portions of the country
centered over the area (e.g., Bonsal et al., 1999), it is an- from the Prairies to the Arctic. In addition, the frequency of
ticipated that the quasi-stationary anomalous upper high extended relatively dry periods (e.g., consecutive years that
centered over the northwestern US and southern British are characterized by strongly negative summer SPEI) is pro-
Columbia (Fig. 7a) will result in more drought-like condi- jected to increase markedly during the second half of this
tions in this region. Some evidence for these changes was century. Compared to other locations in Canada, the south-
found by Bonsal et al. (2017) and Bonsal and Cuell (2017), ern Prairies exhibit the largest likelihood of extended se-
who examined future (2041–2070) changes to summer (JJA) vere drought during the latter part of this century under the
Standardized Precipitation Evapotranspiration Index (SPEI, RCP8.5 scenario (Fig. 10a). The intensification, following
Vicente-Serrano et al., 2010) values over two southern Cana- approximately 2050, is consistent with the accelerated inten-
dian Prairie watersheds and the ARB, respectively. For the sification of the upper ridge during the second half of the
southern basins, results indicated an uncertain future rang- century (Figs. 6b and 7a).
ing from a substantial increase in drought, with a higher de- On annual scales, a dry-south–wet-north pattern charac-
gree of inter-annual variability, to relatively no change from terizes projected drought changes over the CCRN domain
current conditions. Farther north in the ARB, projections re- (see Fig. 10b for drying over the south) (Tam et al., 2018).
vealed an average change toward more drought-like sum- This pattern is largely accounted for by the combined results
mer conditions, but there was a substantial range among the of projected dry conditions during the summer and autumn
climate models. Over a larger study area that included all over southern regions, and the projected wet conditions dur-
western Canadian river basins, Dibike et al. (2018) incorpo- ing winter and spring over the northern and coastal regions of
rated six CMIP5 GCMs to assess future SPEI changes on Canada. The projected surface water deficit during summer
Hydrol. Earth Syst. Sci., 23, 3437–3455, 2019 www.hydrol-earth-syst-sci.net/23/3437/2019/R. E. Stewart et al.: Summary and synthesis of Changing Cold Regions Network 3449
convective precipitation and hail for the regions of interest
herein included MM5-HadCM3, MM5-CCSM, and HRM3-
HadCM3, based on their ability to reproduce the precipita-
tion climatology. No other NARCCAP studies focused on
hail or warm season convection-only precipitation, although
Mearns et al. (2013) and Mailhot et al. (2011) looked at en-
semble summer total precipitation and annual maximum pre-
cipitation, respectively, while other studies focused on other
seasons (e.g., Gutowski et al., 2010; Kawazoe and Gutowski,
2013).
Changes in future summer (JJA) convective precipitation
are shown in Fig. 11 for three NARCCAP model pairs under
the SRES A2 scenario. All three model pairs show increases
over much of the Prairies but with varying amounts (near
zero to 50 mm). MM5-CCSM and HRM3-HadCM3 are con-
sistent with CMIP5 RCP8.5 results for the same future period
Figure 10. CMIP5 29-model ensemble medians of projected
(a) summer (JJA) and (b) annual SPEI for RCP8.5 from 1900 to (not shown) and the spatial patterns in other studies (that is,
2100 over the southern Prairies (defined in Sect. 2). Negative (red) increases in Canada but decreases in the central/southern US
values indicate surface water deficit relative to 1950–2005 condi- Plains) (e.g., Mearns et al., 2013; Mailhot et al., 2011). These
tions. Grey lines denote the 25th and 75th percentiles. results are also consistent with general increases in CAPE
and surface dew points in a warming climate over much of
the Prairies (e.g., Brimelow et al., 2017).
and autumn would thus play a dominant role in affecting the The future occurrence of hail is also important. A re-
future annual water budget over the southern domain. cent study by Brimelow et al. (2017) highlighted future
An important issue concerning drought is its future intra- changes (2041–2070 minus 1971–2000) in hail character
seasonal character. Many droughts tend to be hot with almost over North America based on simulations from a one-
no precipitation. In contrast, others are not associated with dimensional cloud–hail model (HAILCAST; Brimelow et al.,
especially elevated temperatures and can even have cool pe- 2002) forced with the same three NARCCAP model pairs
riods (Stewart et al., 2012), can have rain showers (Evans et discussed above. Over the CCRN domain, results show that
al., 2011), and/or can experience occasional large precipita- the number of hail days generally declines in Manitoba and
tion events (Szeto at al., 2011) that may or may not increase Saskatchewan in summer (JJA), while increases occur in the
in a warmer world (as discussed in Sect. 4.2.2). Such differ- western half of Alberta and extreme southwestern Northwest
ences in character can substantially affect their impact, but Territories (see Brimelow et al., 2017, Fig. 1). Over much of
the CMIP5 information does not have sufficient resolution to Alberta and the southwestern Northwest Territories, there are
resolve this issue. general increases in accumulated kinetic energy (AKE) and
maximum hail size, even in some regions where the number
4.3.2 Convection and hail of hail days does not change in the future. That is, when it
does hail, it will potentially be larger and more destructive
Analysis of future convection-related precipitation requires (larger AKE). Parts of Saskatchewan and central to northern
higher spatial resolution than available from global cli- Manitoba may also see increases in AKE and hail size even
mate models. Suitable datasets are available with dynami- though the number of hail days decreases. This is thought to
cally downscaled RCMs, such as NARCCAP (Mearns et al., be primarily due to more moisture and energy available to
2012), previously mentioned in Sect. 2. However, future sce- summer storms when they do occur (Brimelow et al., 2017).
narios are only available to mid-century when, as discussed
in Sect. 3.4, dry conditions are not expected to be so domi- 4.3.3 Lightning and wildfires
nant over the southern Prairies (Fig. 10).
NARCCAP historic (1971 to 2000) and mid-century fu- As indicated in Sect. 3.4, convection may be enhanced or
ture (2041 to 2070) model output was used to assess future suppressed by the latter part of the century. A related issue
changes in convective precipitation and hail over the Cana- is lightning. Since long-term observations by satellite-based
dian Prairies, southern Northwest Territories, and US north- or ground-based lightning location systems of lightning do
ern plains. Convective precipitation is defined as occurring not exist, studies assessing past trends around the world have
when the model convective scheme is triggered to release used thunderstorm day records (Changnon and Changnon,
latent energy and convective instability through simulated 2001; Pinto et al., 2013; Huryn et al., 2016), although none of
vertical motion. Brimelow et al. (2017) suggested that the these was carried out over the CCRN region. In terms of fu-
three most consistent NARCCAP model pairings to assess ture occurrence, climate model simulations using parameter-
www.hydrol-earth-syst-sci.net/23/3437/2019/ Hydrol. Earth Syst. Sci., 23, 3437–3455, 2019You can also read