WEATHER RADAR DATA REQUIREMENTS FOR CLIMATE MONITORING - GCOS-223 - WORLD METEOROLOGICAL
←
→
Page content transcription
If your browser does not render page correctly, please read the page content below
WORLD METEOROLOGICAL                INTERGOVERNMENTAL
    ORGANIZATION                      OCEANOGRAPHIC
                                        COMMISSION

  WEATHER RADAR DATA REQUIREMENTS FOR CLIMATE
                 MONITORING

                        GCOS-223

     UNITED NATIONS                INTERNATIONAL COUNCIL
ENVIRONMENT PROGRAMME                   FOR SCIENCE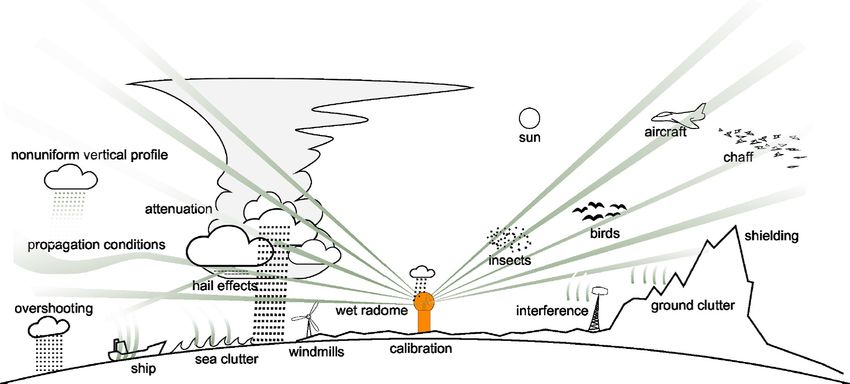
© World Meteorological Organization, 2019
The right of publication in print, electronic and any other form and in any language is reserved by WMO. Short extracts from WMO
publications may be reproduced without authorization, provided that the complete source is clearly indicated. Editorial correspondence
and requests to publish, reproduce or translate this publication in part or in whole should be addressed to:
Chair, Publications Board
World Meteorological Organization (WMO)
7 bis, avenue de la Paix                                                 Tel.: +41 (0) 22 730 84 03
P.O. Box 2300                                                            Fax: +41 (0) 22 730 80 40
CH-1211 Geneva 2, Switzerland                                            E-mail: Publications@wmo.int

NOTE
The designations employed in WMO publications and the presentation of material in this publication do not imply the expression of any
opinion whatsoever on the part of WMO concerning the legal status of any country, territory, city or area, or of its authorities, or
concerning the delimitation of its frontiers or boundaries.
The mention of specific companies or products does not imply that they are endorsed or recommended by WMO in preference to
others of a similar nature which are not mentioned or advertised.
The findings, interpretations and conclusions expressed in WMO publications with named authors are those of the authors alone and
do not necessarily reflect those of WMO or its Members.
This publication has been issued without formal editing.
Background Information for the mandate of the GCOS Task Team on the use of weather radar for
climatological studies.

Action A24 of the GCOS Implementation Plan (GCOS-200), calls for the implementation of an archive for
radar reflectivities. The Commission for Basic Systems (CBS) at its Sixteenth session (WMO-1183) endorsed
the GCOS Implementation Plan and “Decides to support Members, as appropriate, in the implementation
of the actions identified in the GCOS Implementation Plan”. EC-69 (WMO, 2017 - WMO, 1196) invited
members “To work towards the full implementation of the Global Climate Observing System (GCOS)
implementation plan.”

At the 22nd Session of the GCOS/WCRP Atmospheric Observation Panel for Climate (AOPC-22, Exeter, UK,
March 2017), AOPC agreed on the creation of a dedicated task-team to work on a proposal on how best to
proceed on the use of radar data for climate studies. The Task Team was established jointly with the
Commission of Climatology (CCl).

The Task Team was charged with:
•        Define climate monitoring requirements for precipitation radar data, define relevant metadata, and
define best practices. Propose key parameters to be used for climate monitoring. Identify procedures for
quality control of radar data specifically for climate applications.
•        Propose recommendation on how to harmonize retrieval and calibration methods, taking into
account existing working groups.
•        Archives: Assess the status of existing international and national archives, including their extent
and quality. Study whether existing data centres should be expanded or new structures should be created.
Identify how to facilitate proper and standardized storage of local radar data for eventual reprocessing at a
later stage to support climate monitoring.
•        Suggest procedures for handling historical data, e.g. how to document the existing data,
requirements for reprocessing with new algorithms, processing for extracting data from archives for quality
control of the data.

The Task Team consists of Andreas Becker (Deutscher Wetterdienst (DWD)-Germany), Katja Friedrich
(University of Colorado, USA), Rainer Hollmann,(Deutscher Wetterdienst (DWD)-Germany), Elena Saltikoff
(Finnish Meteorological Institute (FMI), Finland), Joshua Soderholm (Bureau of Meteorology, Australia),
Bernard Urban (MeteoFrance, France).

The Executive Council in 2018 was informed that AOPC had taken the lead to explore how to use radar to
compliment precipitation climatology and requested that the work be undertaken in collaboration with CCl.
The report of the first meeting of the task team was made available.

The Task Team has worked closely with the Commission for Instruments and Methods of Observation
(CIMO) Inter-Programme Expert Team on Operational Weather Radars (IPET-OWR).

This report summarizes the recommendations of the task team. Further work should be carried on in
collaboration with the WMO Integrated Global Observing System (WIGOS), CIMO IPET-OWR and CCl.
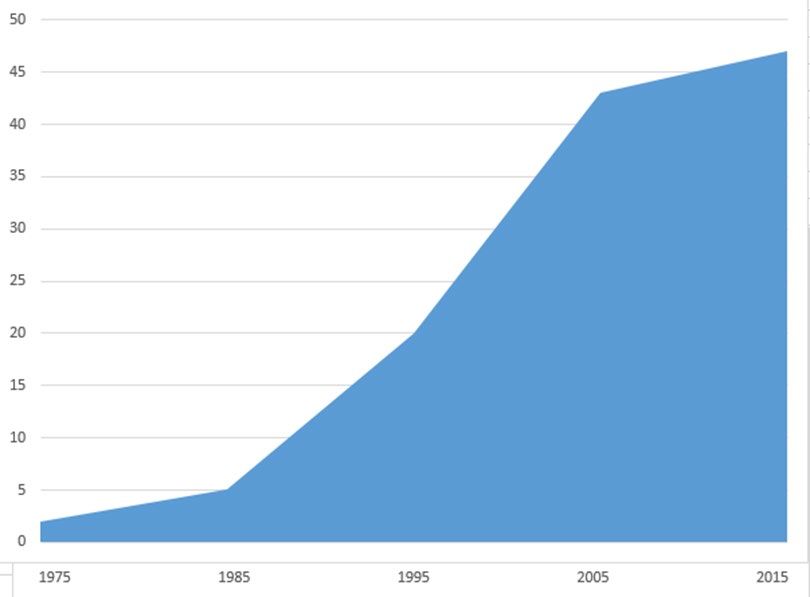
Table of Contents

1.       EXECUTIVE SUMMARY ............................................................................................................................. 5
2.       INTRODUCTION ........................................................................................................................................ 5
3.       WEATHER RADAR DATA REQUIREMENTS FOR CLIMATE MONITORING .................................................. 6
3.1      Definition of key parameters .................................................................................................................. 6
3.2      Metadata relevant for climate ................................................................................................................ 7
3.3      Quality control and its documentation ................................................................................................... 8
3.4      Application of GCOS climate monitoring principles to radar data .......................................................... 8
4.       Assessment of the status of existing archives.......................................................................................... 8
5.       GUIDANCE ON HOW TO ORGANIZE PROPER AND STANDARDIZED STORAGE AND USER INTERFACE OF
         LOCAL RADAR DATA AND METADATA ...................................................................................................11
5.1      General principles ................................................................................................................................. 11
5.2      Storage organization ............................................................................................................................. 11
5.3      User interface to the data and metadata ............................................................................................. 12
6.       GUIDANCE TO HANDLE HISTORICAL DATA ............................................................................................12
6.1      Background............................................................................................................................................ 12
6.2      Inventory ............................................................................................................................................... 13
6.3      Data rescue / conversion ...................................................................................................................... 13
6.4      Analysis .................................................................................................................................................. 14
6.5      Useful links ............................................................................................................................................ 14
7.       Summary and recommendations ...........................................................................................................14
ANNEX 1:              Draft for Mandatory Weather Radar Metadata for International Exchange by IPET-OWR ....16
ANNEX 2:              Survey and results ....................................................................................................................18
ANNEX 3:              Use of Weather Radar Data for Climate Data Records in WMO Regions IV and VI-URSDCM
report                25
1.       Introduction and scope of this paper .....................................................................................................26
2.       Motivation for the Use of Weather Radar Data for Climatological Purposes ........................................26
3.       Encountered Challenges.........................................................................................................................27
4.       Activities and Experiences of Deutscher Wetterdienst (DWD) ..............................................................28
5.       Use of Weather Radar for Climate Data Records in WMO Region VI ....................................................29
6.       Conclusion ..............................................................................................................................................33
References ........................................................................................................................................................36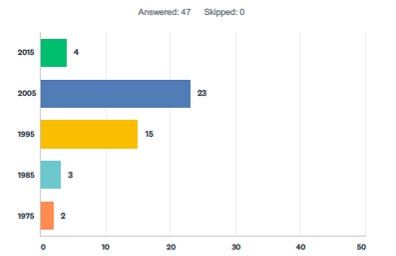
1. EXECUTIVE SUMMARY
An international task team, consisting of both radar experts and climate specialists, has defined
requirements for radar data to be used for climate monitoring. The most essential parameter is radar
reflectivity, dBZ, to be saved as 3-dimensional volumes (known as Level 2 data – note, the definitions for
ground based radars are different from those used for satellites). For essential metadata, requirements for
climate do not differ from other applications, but it is essential to save the history of metadata related to
different measurement configurations over the years.
Processing historical data is an effort of considerable manpower that requires careful planning. It is
suggested to follow the general recommendation for data rescue and harmonization and to provide special
documentation. It is recommended that the rescue projects produce and save Level 2 data, which allows
future reanalysis with newest algorithms
In a survey executed during 2017, several WMO members reported decade-long archives allowing access
for researchers. It is recommended, as a next goal, to establish an international portal to allow harmonized
access to radar data, metadata and documentation.
2. INTRODUCTION
Since the 1950s, weather radars have been widely used to detect and quantify precipitation and severe
weather. The phenomena monitored with weather radar include in addition to precipitation also severe
mesoscale phenomena such as hailstorms and tornadoes and issuing warning of severe hail, tornadoes,
blizzards, and flooding has become impossible without the four-dimensional, high resolution data from
operational state-of-the-art weather radar networks. Target applications are extreme precipitation
statistics, long-term aggregations, severe convection statistics and reanalysis. The statistics are also useful
for ground validation of satellite precipitation products, and development of hydrological models.
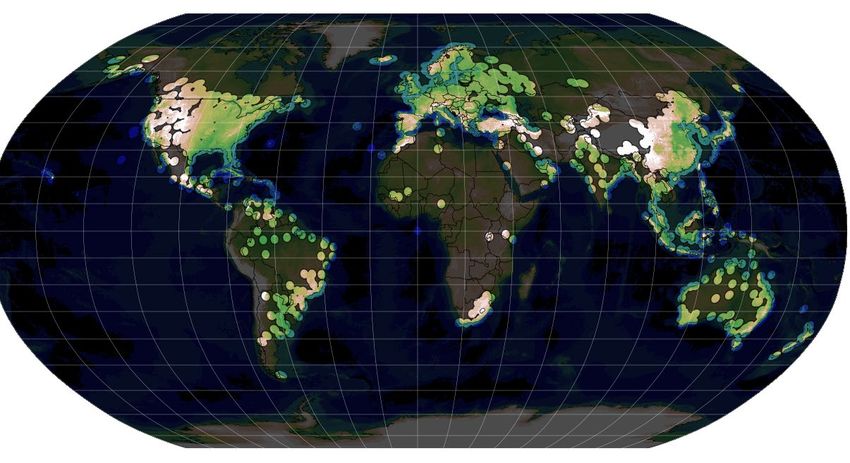
Radar networks are now covering large parts of the densely-populated areas of the world (See Figure 1).
Some of the networks have collected data for over 30 years, and in spite of some of the older radar
information having been lost due to the rapid growth of information technology, scientists have started to
use the information for climate studies.
The long time series needed for climate studies require a considerable effort in homogenization, and
current reanalysis project have challenges in spatial harmonization. Recovery of past data can be successful
in some areas, but the global challenge is to manage the data archived today so more homogenous time
series will be available for the future generation.
In 2016, the Global Climate Observing System (GCOS) Atmospheric Observations Panel for Climate (AOPC)
established a task team to assess the weather radar data requirements for climate monitoring. This report
documents the results of that task team. Its objective is to widely establish weather radar information for
the climate science community by providing an overview of what is currently available, defining standards
for storing historic and future radar data, and giving recommendations for managing historic and future
radar data.
Task Team Members
• Andreas Becker, Deutscher Wetterdienst (DWD), Germany
• Katja Friedrich, University of Colorado, USA
• Rainer Hollmann, Deutscher Wetterdienst (DWD), Germany
• Elena Saltikoff, Finnish Meteorological Institut (FMI), Finland
• Joshua Soderholm, Bureau of Meteorology, Australia
• Caterina Tassone, GCOS, Switzerland
-5-• Bernard Urban, Meteo France, France
Figure 1. A map of radar coverage in the world by Maik Heistermann, from an articlesubmitted to
Bull.Am.Met.Soc. (Saltikoff et al., 2019)
3. WEATHER RADAR DATA REQUIREMENTS FOR CLIMATE MONITORING
In a nutshell
• The following information should be saved:
Radar parameters (e.g., reflectivity in dBZ NOT accumulated rainfall rate in mm) as 3-
dimensional volume scans in the highest resolution possible (NOT 2-dim images or composites).
Log of changes of important metadata (e.g., upgrades to Doppler).
• Minimum recommendations for metadata needed for radar data should be defined as in Annex 1 of
this document.
• A terminology for radar matters, including metadata elements and quality control terms, should be
defined jointly with the Commission for Instruments and Methods of Observation (CIMO) Inter-
Programme Expert Team on Operational Weather Radars (IPET-OWR).
3.1 Definition of key parameters
Data for the following key radar parameters* should be saved as Level 2 files:
• Horizontal Reflectivity (ZH)
• Radial Velocity (VRAD)
• Spectrum Width (WRAD)
• Differential Reflectivity (ZDR)
• Correlation Coefficient (RhoHV)
• Differential phase (PhiDP)
-6-*It is acknowledged, that single polarization radars cannot provide ZDR, RhoHV or PhiDP and that VRAD and WRAD are
available only for Doppler radars.
For quality control purposes, when feasible, it is recommended saving uncorrected reflectivity (TH), signal
quality index (SQI), and clutter-to-signal ratio (CSR).
For the level definitions we refer to the definitions in the WMO Integrated Global Observing System
(WIGOS) guidance by IPET-OWR (see Table 1). It is noted that both international satellite and operational
weather radar community in USA have also defined “Level 2”. The definitions of levels in satellite
terminology are fundamentally different due to different measurement and processing approaches.
To ensure that radar data can be easily used by the research community and other relevant parties, it is
necessary to produce and store Level 3 products, such as rainfall rate or hydrometeor classification, and
level 4 products, such as gauge adjusted rainfall. However, as processing algorithms develop over years,
maintaining homogeneity in the time series is challenging, and for reprocessing purposes it is mandatory to
save also Level 2 data. The difference in amounts of stored data is not significant and the problem is not
the disk space, but rather the management of data.
Table 1 Full set of definitions of Data Levels
The table below is proposed by WMO IPET-OWR as the standard wording to describe 'levels' of weather
radar data.
Definition
Level 0 Data at full resolution as received at the sampling rate of the receiver. Generally only
available internal to the system. Special equipment may be required to measure and
record such data.
Level 1 Data in sensor units also known as "time series" or "I/Q" (in-phase and quadrature) data.
Produced and processed by the instrument's signal processor. Generally not recorded
except for limited durations on operational radars. Commonly recorded on research
radars.
Level 2 Derived radar variables or moments (reflectivity, radial velocity, differential reflectivity,
etc.) at full resolution after aggregation and filtering. Organized in polar coordinates by
rays, range bins and quantities. Also, known as "sweep" and “volume scan" data.
Level 3 Radar products which are derived primarily from level 2 data. May be in the level 2 polar
coordinates (particle ID, quality metrics, etc.), or in other coordinates systems such as
vertical profiles or Cartesian grids (CAPPI, rain rate estimates, etc.).
Level 4 Higher order products which may include data from multiple measurements. This includes
products which composite multiple radars (mosaics) as well as those that blend data from
other sources (satellites, rain gauges, NWP etc.).
3.2 Metadata relevant for climate
The metadata needed for climate monitoring are not different from those for other applications, with the
additional requirement for climate monitoring to keep track of the history of hardware and algorithm
changes and make sure that data can still be processed in the future.
It is important to define a common data format and we endorse the efforts of IPET-OWR.
Conversion of old stored data to new formats defined after the data was originally stored can be supported
and made easier by collecting and sharing the links to conversion software among the radar community
-7-The modern data models and formats include some metadata in connection with actual data, which is not
the case for historical data. In the future, not all metadata should be included in the data files and some of
the more static metadata should be available separately (for example the model type of the radar at a
given time can help define the properties of a dataset used in a certain study).
IPET-OWR has defined a set of metadata (Annex 1) which are considered mandatory for the international
exchange of weather radar data. These values define the used instrument, and they are essential in
describing its abilities to measure precipitation, especially the extreme values and small-scale variability.
3.3 Quality control and its documentation
The methods which should be used for quality control for climate monitoring are no different than those
for other applications, with the additional requirement mostly related to the need to keep track of the
history of changes in the quality control. This has to be recorded in the documentation of the applied
quality control methods.
A special challenge when preparing or using the documentation, is the definition of terminology. For
example, the term “Doppler filter 3 applied” has not been defined universally and it may have a different
meaning for different radar manufacturers or software versions. Another example is the use of the term
“clutter removed” which is completely ambiguous: different types of clutter have been removed during the
decades of development of clutter cancellation methods, with some methods also removing valid weather
signals. This can lead to a wrong interpretation of trends in precipitation climatology. And in this specific
example, and valid also for other cases, it is also preferred to rather than remove data to flag data.
Therefore, in order to have accurate documentation, it is mandatory to agree on a terminology which also
includes metadata elements and quality control terms.
3.4 Application of GCOS climate monitoring principles to radar data
Most of the GCOS climate monitoring principles 1 are applicable to radar data.
The GCOS climate monitoring principle No. 2 states that “A suitable period of overlap for new and old
observing systems is required”. However, radars are advanced electronic devices with a limited lifetime
which cannot be prolonged, and technology is advancing at such a speed that typically any outdated
instrument is replaced with a next generation system, not an identical one. Therefore, due to high cost of
radars and their infrastructures, overlapping time series are seldom available. According to GCOS climate
monitoring principle No. 7 “High priority for additional observations should be focused on data-poor
regions, poorly observed parameters, regions sensitive to change, and key measurements with inadequate
temporal resolution.” This is often not possible for radar observations, as regions with poor coverage
cannot afford the high cost related to the purchase and maintenance of radars.
4. ASSESSMENT OF THE STATUS OF EXISTING ARCHIVES
Current interest of using radar data for climate monitoring and reanalysis is increasing. Knowledge of what
is available at the present in existing archives is fundamental, as it contributes in providing guidance for the
future use of radar for climate applications.
In 2014, the WMO Commission for Climatology (CCl) Task team on the Use of Remote Sensing Data for
Climate Monitoring (TT-URSDCM), decided to prepare an overview of the activities within WMO Regions on
radar climatologies. The information was compiled through personal communication, by examining the
1
The ten basic principles (in paraphrased form) were adopted by the Conference of the Parties (COP) to the United Nations Framework Convention
on Climate Change (UNFCCC) through decision 5/CP.5 at COP-5 in November 1999. This complete set of principles was adopted by the Congress of
the World Meteorological Organization (WMO) through Resolution 9 (Cg-XIV) in May2003; agreed by the Committee on Earth Observation Satellites
(CEOS) at its 17th Plenary in November 2003; and adopted by COP through decision 11/CP.9 at COP-9 in December 2003
-8-webpages of the Region VI Members’ NMHS and by reviewing the existing literature on the use of weather
radar for climate data records. Most of the countries used radar only for weather observations and
forecasting, however 10 countries (Belgium, Denmark, France, Germany, Ireland, Italy, The Netherland,
Sweden, Switzerland, the United Kingdom and Northern Ireland) used weather radar data for climate
applications. Literature included studies about severe storm occurrence, hail events, convection studies
and thunderstorms activities. The TT-URSDCM report included a detailed account of the activities and
experiences of DWD, that has started to reprocess and analyze the radar-based reflectivity measurements
of the German network starting in 2001. Germany, together with Switzerland, were the only countries
performing projects regarding generating, provision and archiving of long time series of adjusted radar
precipitation. The report can be found in Annex 3.
As part of the process of assessing the existing archives, the GCOS radar task team prepared a survey on
radar data archives. The survey consisted of 7 questions aimed at learning the existence of the archive, its
completeness, the record length, the existence of metadata and the availability and access of the data. It
was designed such that it would be possible to complete the whole survey in less than 10 minutes. The
survey questions and the answers, are provided in Annex 2.
The survey was sent out on October 2017 to radar experts, to national focal points of the weather radar
metadata group, as well as to the members of the Inter-Programme Expert Team on Operation Weather
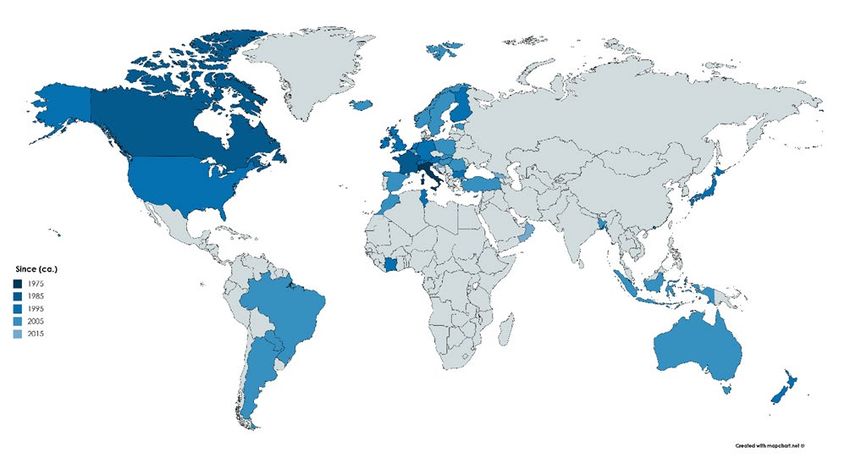
Radars (IPET- OWR). Figure 2 shows the map of the 47 countries who responded to the survey.
Figure 2. The oldest radar data by WMO member.
-9-Figure 3. Cumulative sum of members archiving radar data since a particular year.
Question 1 asked to specify the earliest data in the archive. Results are summarized in figure 3. Note that
even if the archives cover only one radar, or do not continue until present date, the entire country is
shaded according to the oldest data. Twenty countries out of 47 have archives older than 1995. Each of the
responsible person who had answered indicating that the archive went back to 1995 or more, was
contacted via email requesting additional information on whether the archive had continuous digital
records, since when and for how many radars.
From the individual comments of those members who have over 20 years of data we can summarize the
following:
• Data from 1970s to 1990s is often patchy. Some of the oldest data is stored as images, and
usually the resolution in vertical, horizontal and temporal directions is worse than in the later
archives;
• Climate studies with the data from the first decades would in most cases not be cost-effective
due to patchiness of the data;
• The continuous time series of reasonable quality start typically around 1998, so 20 years of
data could be used already. However, during this period radar locations have changed, the
coverage has increased and processing methods have improve, so the time series are by no
means homogenous.
Results from the survey show also that 90% of the archives have saved dBz in original coordinates, 16
archives have recorded metadata inside the archive, 21 only partly and 10 do not have any. Almost every
archive has metadata specifying the position of the radar, half of them have also metadata on the scanning
strategy, while only 4 have electronic calibration results. The format of the archive content is documented
in 25 archives, while 14 have only partial information and 7 do not document the format of. The data in 17
archives are available and regularly used, other 19 archives make the data available but recognize that it
might be complicated to get access to the data. Only for data in 10 of the archives, retrieving one year of
data requires the effort of having to ask IT people to mount disks or tapes. However, for more than 80% of
- 10 -the reviewed archives data are accessible to be used for researchers out of the institute. As data stretching
in the past is very important for climate studies, this is a very encouraging result.
5. GUIDANCE ON HOW TO ORGANIZE PROPER AND STANDARDIZED STORAGE
AND USER INTERFACE OF LOCAL RADAR DATA AND METADATA
5.1 General principles
NMHS spend in general a lot of resources to keep old climatological records safe (using backup storage
locations for example) and usable in the future. This is not necessarily the case for radar data archives in
other organizations. Many radar installations were originally made for real time applications only, and the
storage strategy was not defined taking into account the climatological application. However, if an
organization is serious about radar data archives, storage strategy should include the additional needs for
climate studies.
5.2 Storage organization
The storage organization of an archive can have a big impact on access performance and load on the
archiving system.
Meteorological measurements are obtained by transmission channels which are often specific of the type
of the data (e.g. GTS for AWS stations and direct link to satellite). Meteorological measurements are also
sorted simply by the type of the message carrying them. Climatological archiving is most naturally done by
reproducing a division of the input data stream into a corresponding section of archived data.
Radar data is collected at once over a large spatial domain, and therefore the archive could be organized to
ensure that the use of the radar data in the archive over this large domain is easier. This nominal high geo-
temporal resolution of radar data, which is more difficult to find for traditional climate archive, is a
particular strength and allows quality control based on stability over both time and space to be
implemented.
The chunks of data of the archive have at least two “dimensions”: one dimension for the type of data and
the other dimension for the time interval. For costly observation systems gathering huge amount of data,
like satellite or radars, there can be other dimensions such as the name of the system and the kind of
subtype of data archived. For a long time, due to the existing technologies, it was not possible to use a real
database system, and the archive was file system based: one file contains one of the above chunk of data
(in original or radar-specific data format), and the elements of the pathname of the file identifies the
dimensions cited above.
The radar archive organization at Meteo France is used as an example below:
Files are in the archiving computer with pathnames like:
/RADAR/LOCAL/MOMU/2015/0208_1 which means it is a tar file of all reflectivity radar data for the 8
February 2015 for the radar of Momuy.
/RADAR/LAME_EAU/LOCAL/NIME/2016/0423_000005 which means it is a tar file of all 5 minutes QPE radar
data for 23 April 2016 for the radar of Nîmes.
If a study focuses on a limited area (say 100 km2) covered by a few radars, all the data available for these
radars will need to be downloaded, which is 3 order of magnitude more (the area covered by a radar is
typically around 200 km x 200 km = 40 000 km2) than what is really needed.
The situation at the Deutscher Wetterdienst is similar and not likely to change soon. There the storage
demanding data files are kept on a flat-file system and the database is limited to the pointers to these files.
This puts a high demand on the format used for the data files, namely to stay de- and encodable for a long
time if not forever, weighing sustainability of a format higher than the compression rate associated. Their
- 11 -reason for using a zipped clear-text format is that a zipped clear-text format might lose a bit on
compression but will still be usable in 30 years, which is much more important.
With the new technologies, it is theoretically now possible to organize radar archives differently: database
records having columns for name of radar, pixel location, date of pixel value, reflectivity value of pixel and
metadata can now be used and this would eliminate the need to document and maintain decoders for the
data formats used in the file system based archiving method. However, for the foreseeable future, the
implementation of this more efficient archive in the NMHS will be prevented by the amount of work
required to convert the existing file system archive to the new structure, and the need to plan for a
migration path to a new database system if the old one becomes obsolete. The implementation of this
more efficient archive in the NMHS would require extensive work.
5.3 User interface to the data and metadata
The way data are extracted from an archive by NMHS can vary wildly, as shown by the survey results about
existing archives. The following recommendation would help improve this process:
• Automate access to the data, avoiding the involvement of a human operator. Widely used data
access protocols (DAP) are encouraged. DAP services have significant interoperability and can
provide both programmatic and web-based access.
• Homogenize the user interface to the catalogue of data and their related metadata. The obvious
candidate would be a Global Information System Center (GISC), encompassed in WMO Information
System (WIS). NMHS will have to add radar archives to the existing GISC catalogue, with at least the
metadata in Annex 1.
• For increased efficiency, access to radar data of larger regions could be organized using WMO’s
Data Collection and Production Centres (DCPC).
• Improve data transfer capacity. The bandwidth requirements (capacity of computer system for data
transfer) between a NMHS and an external user to download even small areas of interest for the
studies can be problematic and various bandwidth throttle tricks are used to limit the risk of
overloading the NMHS transmission lines, resulting in a poor end user experience. Copying the
radar archives to a cloud service and downloading data requests from there could improve the
situation.
• Establish a global portal to allow harmonized access to radar data, metadata and documentation.
This will require a lot of transcoding work, as the underlying formats and aggregation granularity
for the data are very diverse depending on the source but could be a more easily achievable goal
once the suggestion made above to structure the archives as real databases will be implemented.
6. GUIDANCE TO HANDLE HISTORICAL DATA
6.1 Background
During the first decades of digital weather radar networks, radar measurements were sometimes saved as
2-dimensional image files. Even though these images are often problematic for reconstruction of
precipitation records, they may have value as sources of qualitative interpretation, such as monitoring
frequency of severe weather phenomena. In the same category are dataset without the minimum
metadata described in annex 1. These cannot be used for quantitative studies, and should be at best be
considered qualitative data similar to image files (or photographs).
The technology needed for reading very old media (such as magnetic tapes) may not be available in the
future decades. Reprocessing of historical data should therefore be a repeated activity and it is advisable to
- 12 -save intermittent products comparable to Level 2 data, including at least minimal metadata with a
posteriori analysis
Digital Archiving is a subject of existing standards, recommendations as well as national and international
legislation. Some links of material are provided in end of this document.
Handling of historical weather radar consists of three major tasks:
• Inventory
• Data rescue
• Analysis
It is recommended that a NMHS planning to start a project to handle historical data, nominates an internal
interdisciplinary team for planning the entire project, and especially for the inventory.
Homogenization and potential reanalysis of archives containing several years and several radars, similar to
those reported in chapter 2, is an effort of several man months. For example, the operational Australian
radar archive consists of approximately 800 years of data across more than 50 sites. Consolidation, quality
control and post-processing of multiple archive sources has required several months of full-time work and
remains an ongoing effort.
6.2 Inventory
The inventory should be documented carefully and in an unambiguous and uniform way. It may be fruitful
to plan how inventory should be designed and executed through international projects to ensure
uniformity across borders and agencies, especially if data from several countries or institutes will be
archived in the same inventory. An example of a simple inventory table is in table 2.
In our example case in Australia the radar data was stored across a number of digital archives (maintained
by different forecasting offices). Most of the data is overlapping, however some archives fill gaps in other
archives. Careful analysis was required to source and merge the multiple sources.
As part of the inventory, it is also important to label the physical media (magnetic tapes, CD disks) in an
uniform, unambiguous, clear and sustainable way.
Even though very few people will digitalize analogue radar data, it is often worth to document even the
archives of analogue data. It might also be worth noting when reconstructing historical metadata, this
information is generally found in engineering logs and reports (which is generally a separate database).
6.3 Data rescue / conversion
Urgency of rescue and conversion of different data sets depends among other things on vulnerability of the
physical media (magnetic tapes become unreadable and the devices for reading them are rare),
compatibility of software and hardware, and the availability of people who know and understand the
contents. Due to a variety of issues (communications, software changes, user error) corruption is common
in historical data. The data corruption can vary from a single sample, to essential metadata for an entire
volume. Careful diagnostics is required to identify the types of frequency of corruption. Either the
corrupted data can be rectified (e.g., headers) or removed depending on feasibility.
For several decades, there has been a big uncertainty of which media will stay readable after decades.
Radar meteorologists are by no means the only people thinking about it, hence following national and
international efforts and lessons learned thereof is recommended. After physical rescue (say, from
magnetic tapes to disks), there is usually the need for converting data to widely known formats, Level 2
data if feasible, to allow later reprocessing. This is also the time to carefully document metadata. The goal
is to preserve and document historic data for the next decades and make sure is usable to the current and
next generation of researchers.
- 13 -6.4 Analysis
As discussed in section 3, it is strongly recommended to archive level 2 data. In addition to that, many users
want to convert the entire time series to climate variables such as precipitation amounts, which can require
using external data sources such as gauge data for adjustment. This is a step that most likely will be
repeated in the future, so it is crucial that it is well documented, including details such as the type of
corrections that have been applied, and that the Level 2 data be saved for possible for future re-analysis.
6.5 Useful links
• Digital Preservation Handbook https://dpconline.org/handbook
• http://ec.europa.eu/research/participants/docs/h2020-funding-guide/cross-cutting-issues/open-
access-dissemination_en.htm
• https://en.wikipedia.org/wiki/Digital_preservation
• Something about which media will stay readable after decades:
• https://www.pcworld.com/article/2984597/storage/hard-core-data-preservation-the-best-media-
and-methods-for-archiving-your-data.html
• https://www.digitaltrends.com/computing/keeping-data-safe-eternity/
Table 2: Example of inventory table.
Radar name Years Parameters Availability Notes Media
John Doe Hill 1985-1990 Mm/h 60% Gif images CD disks
1990-2007 dBZ, VRAD, 80% Lowest sweep Tape
WRAD
2007-2017 dBZ, VRAD, 90% Full volumes Disk
WRAD
Enannanstad 1992-1998 dBZ 40% Cartesian CAPPI Disk
1998-2002 dBZ 20% Disk
2003-2010 dBZ, VRAD 80% The new Radar Disk
2010-2017 dBZ, VRAD, ZDR 80% Dualpol Disk
upgrade
7. SUMMARY AND RECOMMENDATIONS
The key points discussed and the recommendations from the task team are as follows:
1. Key radar parameter: the most important key radar parameter is horizontal reflectivity, ZH, which is the
basis of precipitation estimates. The other key radar parameters are radial velocity (VRAD), spectrum
width (WRAD), differential Reflectivity (ZDR), correlation Coefficient (RhoHV) and differential phase
(PhiDP) and are important to improve the quality of precipitation estimates as well as independent
variables related to mesoscale phenomena. It is recommended to save these key parameters as three-
dimensional Level 2 data. This allows homogenization of the time series when more advanced
methodologies are developed and supports studies related to three-dimensional structure of the
atmosphere.
2. Metadata: mandatory metadata parameters for radar data for use in climate are as defined by IPET-
OWR (Annex 1). We recommend that metadata includes the history of hardware and algorithm
changes so that data can be processed in the future;
- 14 -3. Quality control: quality control of radar data is mandatory for climate application and should be
recorded in the documentation. We recommend that the radar community agrees on a terminology
which also includes metadata elements and quality control terms.
4. Radar data archives: for radar data archives, storage strategy has to take into account the additional
needs for climate studies. We suggest a real database system rather than the file system based used for
radar archives so far. We also suggest a series of steps that will make extracting data from an archive
more efficient.
5. Historical data: when handling historical data, the goal is to preserve and document historic data for
the next decades and make sure is usable to the current and next generation of researchers. Three
tasks are important when handling historical weather radar: inventory, data rescue and analysis. We
recommend an interdisciplinary team composed by a scientist, an IT specialist and a professional in
digital archiving, for planning the entire project.
6. Results from the survey showed that two decades time series are available at several NMHSs and
coverage is soon ready to address climate requirements. Many NMHS have conducted promising
prototype studies and are ready to invest into the development and generation of multi-decadal radar
databases to support climate requirements. On the global scale the effort to address climate
requirement is huge and several approaches are feasible. We recommend to establish an international
portal to allow harmonized access to radar data, metadata and documentation, that should start with a
proof of concept structure. We recommend adopting a standard open data format (e.g. ODIM H5 or
CfRadial) and a widely used data access protocol.
7. Reprocessing and data rescue activities should build on experiences and lessons learned from other
similar projects, e.g. in the context of satellite data archives.
This report is focusing on Level 2 data, acknowledging that Level 1 is generally not recorded on operational
radars. In the case development of data transfer and storage will make this technically feasible, there may
be a need to reconsider these recommendations.
- 15 -ANNEX 1: DRAFT FOR MANDATORY WEATHER RADAR METADATA FOR
INTERNATIONAL EXCHANGE BY IPET-OWR
This table lists weather radar related metadata which are considered mandatory for the international
exchange of weather radar data. The metadata are listed according to their definition in the WMO
Information Model for Radial Radar and Lidar Data. An additional column 'CfRadial' identifies the
corresponding dimension, variable or attribute name which implements the metadata within the CfRadial
2.0 file format. Note that this is still work in progress.
IMID Description CfRadial
Volume metadata
1.0 Instrument type, distinguishing between “radar” and instrument_type
“lidar”
1.1 Site identifier, WIGOS identifier (see below) instrument_name
1.2 Volume start time time_coverage_start
1.3 Volume end time time_coverage_end
2.0 Site longitude longitude
2.1 Site latitude latitude
2.2 Site altitude above geodetic datum. For a scanning altitude
instrument this is the center of rotation of the antenna.
2.3 Geodetic datum name
3.2 Antenna beam width H radar_beam_width_h
3.3 Antenna beam width V radar_beam_width_v
3.5 Frequency frequency
Sweep metadata
5.1 Target fixed angle fixed_angle
5.4 PRT mode prt_mode
5.5 Distance to centre of first range bin meters_to_center_of_first_gate
Ray metadata
8.0 Elevation angle elevation
8.1 Azimuth angle azimuth
8.2 Time of acquisition (relative to volume start time) time
8.8 Pulse repetition time(s) prt
8.9 Nyquist velocity nyquist_velocity
Range bin metadata
11.0 Length of range bin meters_between_gates
Dataset metadata
12.0 Dataset identifier (user specified) variable name
12.1 Quantity name standard_name
12.2 Quantity units units
12.3 Quantity value used to indicate missing data _FillValue
12.4 Quantity value used to indicate no signal _Undetect
13.0 Identifiers of datasets which are qualified by this qualified_variables
dataset
The site shall be identified (IMID 1.1) by its WIGOS identifier, the structure of which consists of four parts 2 .
The part of the structure called “Local identifier” is the only part consisting of characters. Following the
2
http://wis.wmo.int/page=WIGOS-Identifiers
- 16 -ODIM NOD identifier convention (Michelson et al., 2014) 3, it is suggested as a best practice that the local
identifier be harmonized to a five-character string, where the first two characters are the member
country’s ISO 3166-1 alpha 2 ccTLD 4 code (lower case), and the latter three characters are freely-selectable
(also lower case).
3
Michelson D.B., Lewandowski R., Szewczykowski M., Beekhuis H., and Haase G., 2014: EUMETNET OPERA weather radar information model for
implementation with the HDF5 file format. Version 2.2. EUMETNET OPERA Output O4. 38 pp.
4
http://www.iso.org/iso/country_codes
- 17 -ANNEX 2: SURVEY AND RESULTS
Q1: From when is the earliest radar data in your archives (approximately)
ANSWER CHOICES RESPONSES
2015 8.51% 4
2005 48.94% 23
1995 31.91% 15
1985 6.38% 3
1975 4.26% 2
Total Respondents: 47
- 18 -Q2: Which parameters have you saved
ANSWER CHOICES RESPONSES
dBz, original coordinates 89.13% 41
dBZ, Cartesian (xy, lat-long) coordinates 34.78% 16
Rainrates (mm/h), original coordinates 26.09% 12
Rainrates (mm/h, Cartesian coordinates 28.26% 13
Doppler winds, original coordinates 52.17% 24
Wind profiles 15.22% 7
Categorical images (gif, jpg, png, geoTIFF, …) 43.48% 20
Total Respondents: 46
- 19 -Q3: Which parameters have you saved
ANSWER CHOICES RESPONSES
Yes 34.04% 16
No 21.28% 10
Partly (some information available elsewhere) 44.68% 21
Total Respondents: 47
- 20 -Q4: What kind of metadata is available
ANSWER CHOICES RESPONSES
Position of radar (geographic and height) 95.65% 44
Scanning strategy 43.48% 20
Major upgrades (e.g. new hardware or new software processing releases) 28.26% 13
Applied processing (ZR, VPR) 23.91% 11
Minor changes (e.g. new ZR relation) 19.57% 9
Electronic calibration results 8.70% 4
Total Respondents: 46
- 21 -Q5: Is the format of the archive content document
ANSWER CHOICES RESPONSES
Yes 54.35% 25
No 15.22% 7
Partly (ex.: lost BUFR tables, only binary software available to read the data) 30.43% 14
Total Respondents: 46
- 22 -Q6: Is the data available for researchers outside of your institute
ANSWER CHOICES RESPONSES
Yes, and they use it regularly 36.17% 17
Probably yes, but it may be complicated 40.43% 19
No 14.89% 7
I do not know 8.51% 4
Total Respondents: 47
- 23 -Q7: How would you describe the effort of retrieving one year of old data from your archives?
(Select the option which is closest to the real procedure for a person who has the needed
permissions.)
ANSWER CHOICES RESPONSES
Type a command line on terminal, ftp 58.70% 27
The Zipped file. Use graphical interface. 19.57% 9
To define what data. 21.74% 10
Ask IT people to mount the media (disks, tapes)
Total Respondents: 46
- 24 -ANNEX 3: USE OF WEATHER RADAR DATA FOR CLIMATE DATA RECORDS IN
WMO REGIONS IV AND VI-URSDCM REPORT
Use of Weather Radar Data for Climate Data Records in WMO
Regions IV and VI
Luzia Keupp, Tanja Winterrath, and Rainer Hollmann For WMO CCl TT-URSDCM
3. February 2017 Version 1.2
- 25 -1. INTRODUCTION AND SCOPE OF THIS PAPER
During the first meeting of the WMO CCl Task team on the Use of Remote Sensing Data for Climate Monitoring
(TT-URSDCM) in 2014, the team recognized the increasing availability of radar data and emerging interest of
Members to establish radar climatologies. Consequently, as part of the work plan of TT-URSDCM a task to
create an overview of activities within Members on radar climatologies has been agreed.
This document provides the information which is available for WMO Region VI (Europe). The information has
been compiled through personal communication and a literature survey, however it cannot guarantee
completeness. The given examples provide a starting point in summarizing best practices of Member states to
establish own climatologies. The authors are looking forward to further entrances and updates of list entries.
The document is structured as follows: After recalling the motivation in section 2, the challenges are shortly
summarized in section 3, section 4 provides an example for Germany providing a few more details about the
procedure followed and plans. Then section 5 gives an overview for several Members from Region VI. Finally,
section 6 concludes this document.
2. MOTIVATION FOR THE USE OF WEATHER RADAR DATA FOR CLIMATOLOGICAL
PURPOSES
While weather radar data is widely employed for Numerical Weather Prediction, climatological use is still not
common. And yet, radar data holds many advantages when compared to other sources of precipitation data.
The high temporal and spatial resolution as well as coverage of radar-based data, for example, enables the
study of small-scale atmospheric structures and dynamics (e.g. of convective systems) (e.g. Berg et al. 2015,
Goudenoofdt & Delobbe 2013, Marra & Morin 2015, Tabary 2007). This implies that also in regions without
observational network, area-wide coverage is attained and extreme events – which occur regional and
temporary – are captured. Furthermore, the data is often provided in near real-time (Ruber & Brugger 2009).
In contrast to this, the oftentimes small density (and irregularity) of gauge networks results in point data with
debatable reliability and representativeness for the surrounding area. The variability of precipitation is
therefore not reflected in the spatially interpolated data, especially regarding regions with heterogeneous
topography (e.g. Berndt et al. 2014, Goudenhoofdt & Delobbe 2013, Ruber & Brugger 2009, Rudolph et al.
2011, Tabary 2007, Tapiador et al. 2012). Until now, satellite-derived precipitation data is no suitable
alternative for regional studies of precipitation climatology, as temporal and/or spatial resolutions are still too
low (e.g. Goudenoofdt & Delobbe 2013, Tapiador et al. 2012).
Altogether, radar data holds large potential for climatological applications which is far from being fully exploited until
now. Thus, this paper aims to provide an insight in the possibilities of climatological use of weather radar data.
- 26 -3. ENCOUNTERED CHALLENGES
By now, many classic problems regarding weather radar measurements like e.g. ground clutters, shielding or
non-uniform vertical profiles of reflectivity (see Figure 1, e.g. Fairman et al. 2015, Overeem et al. 2009, Yuter
2015), can be solved – particularly by using long time series as well as Doppler and polarimetric radars (cp.
Tabary 2007, Tabary et al. 2007, Winterrath et al. 2015).
Concerning the climatological analysis of radar data, some other issues arise which, however, can also be
overcome by proper processing of the data:
As with all other data sources, in the context of data harmonization, difficulties emerge from the removal or
replacement of sensors as well as the change of sensor calibrations (Overeem et al. 2009). Furthermore,
originally hidden systematic errors can be amplified when applying long-term means (Wagner et al. 2014).
Hence pre-processing needs to be conducted before using the data (cp. Kronenberg & Bernhofer 2015).
To derive robust data, validation and calibration is essential. Unfortunately, many regions feature a lack of
gauge data and especially during times of intense wind or rainfall errors occur in the gauge measurements
(e.g. Fairman et al. 2015, Hollman et al. 2006). Additionally, calibrations as well as retrieval algorithms have to
be harmonized and orographic corrections need to be performed to ensure data comparability (Berg et al.
2015, Fairman et al. 2015). Missing data must not be treated as zero precipitation as this would falsify
climatological assertions but be amended in an adequate way (Fairman et al. 2015).
The considered studies (see section 5) show the existence of a large number of techniques for the correction
of systematic biases (e.g. Berndt et al. 2013, Fairman et al. 2015, Overeem et al. 2009, Wagner et al. 2014) as
well as for radar-gauge merging respectively adjustment (e.g. Berndt et al. 2013, Goudenhoofdt & Delobbe
2009, Paulat et al. 2008, Winterrath et al. 2012). Regarding this, it is important to bear in mind that for using
climatological radar data from different sources, comparable processing methods need to be applied to gain
matchable results.
Figure 1: Phenomena Affecting Radar Data Quality (Holleman et al. 2006).
- 27 -4. ACTIVITIES AND EXPERIENCES OF DEUTSCHER WETTERDIENST (DWD)
The DWD radar network currently consists of 17 C-band Doppler radar systems. All but one of the former 16
single-polarization ones have been replaced by dual-pol ones between 2011 and 2015. In the RADOLAN
(Radar-Online-Adjustment) project, methods for the production of hourly gauge- adjusted quality-controlled
radar data based on five-minute terrain-following precipitation scans have been developed. For the real-time
adjustment, approx. 1300 automatic gauges are available (Effective 2016). The project being finalized,
processed data is now made available to DWD users every hour.
To analyze the radar-based precipitation data, a new project on the “Generation of a decadal radar- based
high-resolution precipitation climatology for Germany for the retrieval of recent changes in precipitation
extremes” has started in June 2014 and is ongoing until August 2016. In the course of this undertaking three
project modules are elaborated. First, a complete reprocessing of the radar- based precipitation data is
performed, second, a statistical analysis of the 15-year precipitation data is executed, and third, client-specific
products are generated. The reprocessing of the data comprises the application of one software version to all
the data to improve homogeneity, the usage of all available gauge data in the adjustment procedure, as well
as the design and application of (automatic) procedures for different kinds of data corrections to remove or at
least reduce errors arising from different kinds of sources (Winterrath et al. 2015, Winterrath & Schmitt 2015).
While well-known radar-specific false enhanced signals, e. g. clutter, are clearly visible in single real-time
products, signal reductions become visible only in the long-term totals. Therefore, besides applying the state-
of-the-art real-time correction methods, DWD develops specific climatological correction algorithms. For
artefacts originating from beam blockage by (permanent) obstacles and also distant-dependent signal
enhancement, which is a permanent feature, long term means can be used for corrections. More complex
climate-data corrections which are to be developed and applied in the future concern non-permanent periodic
spokes as well as season- or intensity-dependent distance effects, the latter one being associated with deep
convection (Winterrath et al. 2015). Furthermore, it is planned to perform a statistical analysis of the 15-year
radar climatology for Germany and to examine extreme events by the use of objective indices. Additionally,
the results are combined with non-meteorological data for impact and vulnerability studies.
The radar-based precipitation climatology is planned to be extended on an annual basis. Based on the dual-pol
technology, new data products will be included in the future.
- 28 -5. USE OF WEATHER RADAR FOR CLIMATE DATA RECORDS IN WMO REGION VI
The following statements on the recent state of weather radar use for climatological data records in the WMO
Region VI is based on an examination of the webpages of the Region VI Members’ national meteorological and
hydro-meteorological services (NMHSs) (as listed online at WMO 2016), the WMO World Radar Database
(WRD 2016) as well as a review of literature. Until now, little activity can be observed in terms of the use of
radar for the establishment of precipitation time series sufficiently long for the use in climate research. Most
of the Region VI countries employ radar data merely for weather observation and forecasting. Climate
applications by means of weather radar data are pursued by ten countries (Belgium, Denmark, France,
Germany, Ireland, Italy, Netherlands, Sweden, Switzerland, and United Kingdom of Great Britain and Northern
Ireland).
Use of radar data for the compilation of climatologies of high precipitation events, convective events or hail is
mainly listed for countries with no available information on radar precipitation climatologies, showing that
multi-annual time series of radar data are existent. No claim to completeness is raised.
A summary is given in Table 1 and in Figure 2, while the following paragraphs present the situation for the
different countries in more detail:
Figure 2: Use of Weather Radar Data in WMO Region VI Countries. Climate: multi-annual time
series produced – events: climatologies of hail, convective or high precipitation events compiled but
no information on radar-based precipitation climatologies – weather: only information on radar
use for weather purposes – no info: no information on weather radar use at all.
- 29 -Austria. Kaltenboeck & Steinheimer (2015) examine intensive convective events of the warm seasons 2008–
2012 using C-band weather radar in combination with ERA-Interim Reanalysis data over Austria. Separating
Austria in three different regions, they analyze severe storm occurrence regarding the different
combinations of deep layer wind shear and CAPE strength.
Belgium. In their study, Goudenhoofdt & Delobbe (2009) examine and perform various radar- gauge merging
methods and contrast the results with independent gauge data. The work is based on radar data from the
Wideumont Radar in south-western Belgium, covering the years 2005 to 2008. Records of the same radar
station but for 2002–2011 are also used by Goudenhoofdt & Delobbe (2013) for the analysis of convective
storms. Furthermore, a reprocessing of the QPE (quantitative precipitation estimation) for the 2005–2015
period including different correction techniques and gauge-merging is conducted by Goudenhoofdt &
Delobbe (2016a) (using DWD RADOLAN Z-R relationships), leading to a marked enhancement of the data
when compared to (independent) rain gauge measurements. Extreme values are also analyzed (cp.
Goudenhoofdt & Delobbe 2016b).
Czech Republic. Bližňák et al. (2016) examine the gauge-merged data of two radar stations for the warm
seasons 2002–2011. Besides the derivation of a MJJAS total precipitation climatology, sub-daily extreme
events as well as small-scale differences in precipitation amounts are investigated. Seven algorithms for hail
detection from single-polarisation radar data are examined by Skripniková & Řezáčová (2014) regarding hail
events in the Czech Republic and SW Germany evidenced by data from insurance companies and other
sources. From this, criteria are defined to delineate hail occurrence and thus construct a 2007–2011 hail
climatology for the Czech Republic.
Denmark. A ten year radar-based precipitation climatology (2002–2012) for Denmark is derived by
Thorndahl et al. (2014). Using data from the Stevns C-band radar, various bias adjustment methods are
examined revealing better results for hourly compared to daily adjustment. Additionally, it is shown that at
least 10 to 20 randomly distributed rain gauges are necessary for valid mean field bias adjustment.
France. For France, Tabary et al. (2012) report about the production and validation of a decadal time series
of radar-gauge merged precipitation spanning 1997–2006, intended to be used as a reference database.
Weckwerth et al. (2011) study convection in parts of France and Germany (Vosges Mountains, Rhine Valley,
Black Forest Mountains, Swabian Mountains) in the May to August periods 2000–2006 as well as 2008 based
on radar data. This work is conducted in relation to the COPS (Convective and Orographically-induced
Precipitation Study) field campaign in summer 2007.
Germany. As the current approach at DWD has been described in detail above (see section 4), here only
additional work is cited. Hourly RADOLAN-QPEs of the German Free State Saxony covering the 4.2004–
12.2009 period are processed by Kronenberg & Bernhofer (2015) to be suitable for analyses of annual or
bigger timescales of precipitation. Error accumulation is prevented by a detection and elimination of
outliers, adaption by means of elevation data and bias- adjustment using independent gauge data. The
resulting dataset is then compared with two datasets covering the same domain. The utilization of the
applied method for other study areas is limited as it is only valid for regions with high correlations between
precipitation and elevation. Wagner et al. (2014) examine the 2005–2009 period of the German radar
composite RX. Long-term means are used to detect systematic biases, and the susceptibility of the data
regarding climatologically amplified formerly minor systematic errors is highlighted. Three different
geostatistical interpolation techniques are employed by Berndt et al. (2014) for the merging of radar
and rain
- 30 -You can also read