RENEWABLE ENERGY JOBS: FUTURE GROWTH IN AUSTRALIA - CLIMATECOUNCIL.ORG.AU - Climate ...
←
→
Page content transcription
If your browser does not render page correctly, please read the page content below

RENEWABLE
ENERGY JOBS:
FUTURE GROWTH
IN AUSTRALIA

CLIMATECOUNCIL.ORG.AU

Thank you for
supporting the
Climate Council.
The Climate Council is an independent, crowd-funded organisation
providing quality information on climate change to the Australian public.

    Published by the Climate Council of Australia Limited
    ISBN:    978-0-9945973-4-2 (print)
             978-0-9945973-3-5 (web)
    © Climate Council of Australia Ltd 2016.
    This work is copyright the Climate Council of Australia Ltd. All material contained in this work is copyright the
    Climate Council of Australia Ltd except where a third party source is indicated.
    Climate Council of Australia Ltd copyright material is licensed under the Creative Commons Attribution 3.0
    Australia License. To view a copy of this license visit http://creativecommons.org.au
    You are free to copy, communicate and adapt the Climate Council of Australia Ltd copyright material so long as
    you attribute the Climate Council of Australia Ltd and the authors in the following manner:
    Renewable Energy Jobs: Future Growth in Australia by Ernst & Young and the Climate Council of Australia.
    Lead authors: Dr Graham Sinden and Zoë Leffler.
    Contributors: Georgina Coggins, Monica Dasgupta, Dr Arne Geschke, Neetu Mysore, Helen Pinch,
    Dr Martin Rice, Andrew Stock, Petra Stock and Marian Woodward.
    The Climate Council extends its thanks to Ernst & Young and the EY Foundation for their support and
    contributions to this report, and to KGM and Associates Pty Ltd for its modelling support. We are also grateful to
    the three anonymous reviewers for their insightful comments and suggestions which improved the report.
    EY is a registered trademark. This report is provided to the Climate Council of Australia for the purpose of
    exploring the employment impacts of a high-renewable electricity generation scenario to 2030 vs a business
    as usual scenario for Australia, only pursuant to the terms of our engagement letter dated 18 December 2015.
    EY disclaims all responsibility to any other party for any loss or liability that the other party may suffer or incur
    arising from or relating to or in any way connected with the contents of this report, the provision of this report to
    the other party or the reliance upon the report by the other party. Liability limited by a scheme approved under
    Professional Standards Legislation.

    —
    Image credit: Cover Photo: "Installing alternative energy photovoltaic solar panels on roof" by Federico Rostagno
    from Adobe Stock Photos licensed under Standard license.
    This report is printed on 100% recycled paper.

         facebook.com/climatecouncil                     info@climatecouncil.org.au

         twitter.com/climatecouncil                      climatecouncil.org.au
CLIMATE COUNCIL                   i

Contents
Key Findings .............................................................................................................................................................. ii

1. Introduction .......................................................................................................................................................... 1

2. International and National Climate Policy ................................................................................................... 4

3. Modelling Approach ............................................................................................................................................ 5
     Electricity Model                                                                                                                                                      6
     Employment Model                                                                                                                                                       7
     Employment Multipliers                                                                                                                                               10

4. Australia’s Electricity Market........................................................................................................................... 11
     Electricity Generation and Demand                                                                                                                                     11
     Coal Fired Electricity Generation in Australia                                                                                                                       13
     Renewable Energy Resources in Australia                                                                                                                               14

5. Employment Effects from 50% Renewable Electricity ............................................................................ 15
     National Employment Effects                                                                                                                                          15
     BAU, 50RE and Coal                                                                                                                                                   18
     State Employment Effects                                                                                                                                             19
     Type of Renewable Electricity and Employment Effects                                                                                                                 24
     Employment Effects of Decommissioning Coal Plants                                                                                                                    29

6. Transitioning to a New Employment Landscape .................................................................................... 30
     Energy Transition Translated: Real Life Effects on Communities                                                                                                       32
     Policy Considerations                                                                                                                                                37
     A Long-term Approach                                                                                                                                                 38
     Market-led or Government Intervention                                                                                                                                39
     Retraining                                                                                                                                                            41
     Fostering Innovation and Entrepreneurship                                                                                                                            42

7. Conclusion .......................................................................................................................................................... 43

Annex 1: EY Modelling for BAU Scenario of Electricity Generation to 2030                                                                                                  44

Annex 2: Forecasting for 50RE Scenario in 2030                                                                                                                            46

Annex 3: Summary Table of Main Components of Australia’s Climate Policy                                                                                                   47

Annex 4: Coal in Australia                                                                                                                                                48

List of Abbreviations                                                                                                                                                     50

References                                                                                                                                                                51

Image Credits                                                                                                                                                             55
ii   RENEWABLE ENERGY JOBS:
     FUTURE GROWTH IN AUSTRALIA

     Key Findings
     1       2
     This report compares two              The net effect on jobs of 50RE
                                                                                3
                                                                                Unlike other industry
     scenarios for the national            is positive across Australia         transitions such as in
     energy sector - business              and each individual state:           automotive manufacturing
     as usual renewable energy             every state will experience          and steel smelting, which have
     growth (34% renewable                 net job growth.                      seen many jobs move offshore,
     electricity in 2030) and 50%                                               a transition to 50RE will create
     of electricity derived from           ›› New South Wales (NSW) and         jobs in Australia.
     renewable sources in Australia           Queensland will have the
     by 2030. Both scenarios show             largest net growth in jobs,       ›› A large proportion of new jobs
     increased uptake of renewable            around 11,000 and 6,000              gained in the electricity supply
     electricity will create                  respectively.                        sector by 2030 will stem from
     employment nation-wide.                                                       construction and installation
                                           ›› South Australia and NSW              activities related to renewable
     ›› 50% Renewable Electricity             will experience the largest          energy infrastructure. Many of
        (50RE) scenario in 2030 will          per capita jobs growth.              these jobs will be additional to
        lead to over 28,000 new jobs,                                              the economy, though location
        nearly 50% more employment         ›› Victoria will see a net gain of      and skills may differ from those
        than a business as usual (BAU)        around 4,000 jobs by 2030.           currently in demand.
        scenario.
                                                                                ›› Most states will see half of all
     ›› Jobs are created in the                                                    new jobs created in rooftop
        construction, operation and                                                solar photovoltaics (PV): rooftop
        maintenance of renewable                                                   solar PV jobs are generally
        energy installations, as well as                                           accessible, being located in
        in related industries.                                                     areas where people already live
                                                                                   and work.
     ›› Across the period 2014-
        2030, over 80% of full-time                                             ›› Utility scale renewable power
        employment created by 50RE is                                              in regional and remote Australia
        additional to the economy.                                                 may well offer opportunities to
                                                                                   increase employment in those
     ›› Job losses in coal fired                                                   regions.
        electricity generation are
        more than compensated for                                               ›› Job creation and job transition,
        by increased employment in                                                 together with infrastructure
        the renewable energy sector.                                               planning, would benefit from
        However, the transition for                                                a long-term, sector-wide
        employees in the fossil fuel                                               approach to managing the
        sector must be planned well.                                               accelerated renewable electricity
                                                                                   deployment.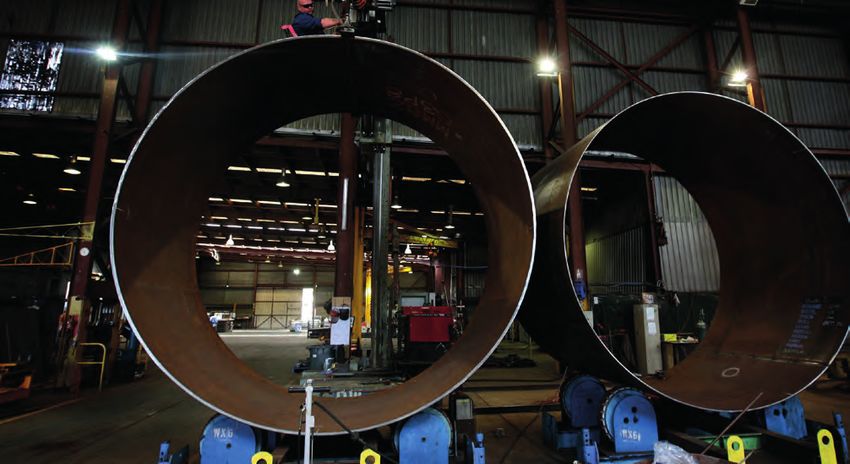
INTRODUCTION         1

1.    Introduction
      Climate change is happening now                     A transition to renewable energy from fossil
      and must be tackled effectively.                    fuels is a key strategy to tackle climate change.

      Many consequences of climate change, driven         Last year, nations world-wide agreed to act to
      largely by the burning of fossil fuels (coal, oil   limit global warming to less than two degrees
      and gas) for electricity, are already evident.      Celsius (2°C). To meet this goal and to limit
                                                          the impacts of climate change, the global
      Average surface temperature over the                economy will require deep reductions in
      Australian continent has increased by               greenhouse gas emissions.
      0.9°C since 1910. In Australia, the incidence
      of extreme temperatures has increased               In addition to reducing emissions from
      markedly over the last 50 years, while              the electricity sector, other factors such as
      heatwaves have become hotter, are lasting           steep declines in the cost of wind and solar
      longer and occur more often.                        are driving record investment and capacity
                                                          additions in renewable energy. As a result,
      Projections of the escalating risks of climate      more than eight million people are now
      change under a business as usual, high              employed across the globe in the renewable
      emissions scenario are becoming more                energy industry (REN21 2016).
      certain and more disturbing. More extreme
      heat is virtually certain across the continent,     With electricity generation accounting
      and southern and eastern Australia will             for around 40% of global greenhouse gas
      experience harsher fire weather. Extreme            emissions, reducing emissions in this sector
      rainfall will likely become even more intense.      is a critical component. Australia does not
      Time in drought is expected to increase in          face this challenge alone; however, with
      southern Australia, with a greater frequency        an electricity sector that is one of the most
      of severe droughts. Coastal flooding is very        emissions-intensive in the world, Australia
      likely to increase as sea level rises at an         may see a greater scale of change than
      increasing rate. However, there are clear           some other industrialised countries where
      solutions to the climate change challenge.          the transition is already progressing. Yet as

Attaining at least 50% renewable
electricity generation by 2030 is a key
action to help Australia meet its share
of the global commitment to tackle
climate change.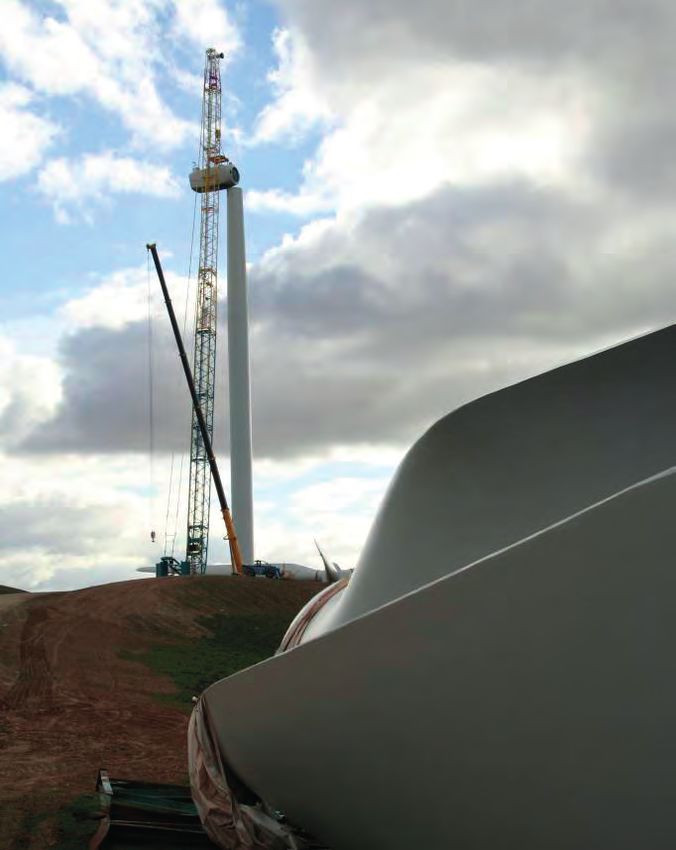
2   RENEWABLE ENERGY JOBS:
    FUTURE GROWTH IN AUSTRALIA

                one of the sunniest and windiest countries        generation by 2030 through existing,
                in the world, Australia has enormous              available technologies and practical, cost-
                potential to transition to an economy             effective measures, with additional capacity
                powered increasingly by renewable energy.         requirements able to be met through existing
                Moreover, some states and territories, such       identified projects (ClimateWorks 2015;
                as the Australian Capital Territory and South     IRENA 2016).
                Australia, are already leading the way.
                                                                  Employment over the energy transition is an
                Australia’s electricity market can move quickly   important issue to explore.
                from fossil fuels to renewable electricity.
                                                                  The physical implications of a move
                Australia’s electricity market is currently       towards greater renewable electricity – new
                dominated by ageing fossil fuel-based             generating capacity, significant investment,
                electricity generators, with only 14.6% of        reduced greenhouse gas emissions – have
                electricity coming from renewable energy          been explored for a range of scenarios in
                like solar and wind (Clean Energy Council         many countries. However, employment
                2016). At the same time, research suggests        associated with the electricity sector, and
                that Australia would need to source a             the impact of an accelerated uptake of
                minimum of 50% of its power from renewable        renewables on employment in the sector,
                sources by 2030 to achieve emissions              has received considerably less attention. As
                reductions consistent with a 2°C pathway          in other economic and technology shifts,
                (ClimateWorks 2014). Decarboninising              jobs will be lost and new jobs will be created.
                Australia’s electricity sector is critical to     Some jobs will be easy to replace, while
                reducing emissions in both that sector, and       others may require re-training, upskilling or
                also enables other areas such as transport        relocation, or may disappear.
                to dramatically reduce emissions. Australia
                can achieve over 50% of its electricity

    More electricity-sector related jobs are
    created through the 50% renewables
    scenario than in the business as usual
    scenario across Australia.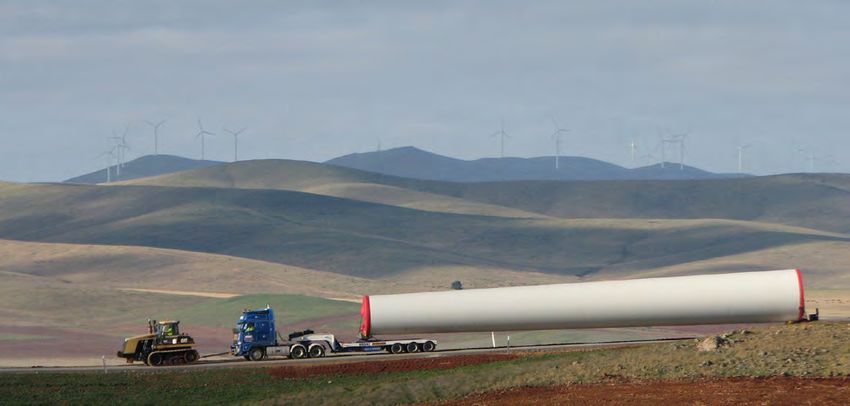
INTRODUCTION     3

Change accompanying industrial transition                      There are ethical, environmental and
is not new or unique to the electricity sector.                health reasons for transitioning away from
However, in common with other industries,                      fossil fuel electricity generation. However,
employment changes also impact directly                        the focus of this report is narrowly on
on people and communities, for whom the                        employment, and does not explore these
whole of economy perspective may well be                       wider issues. Neither does it consider
a secondary concern. This report explores                      the broader system effects of large-scale
some of the employment opportunities, and                      renewable electricity generation, or policy
challenges, that Australia may face as the                     settings that would accompany a transition
electricity sector transitions. We examine                     from coal and gas-fired electricity generation
how the transition will affect the economy                     to renewable electricity generation. Rather,
as a whole, but also how individuals and the                   this report focuses on the comparative
communities that they are part of might be                     employment effects of accelerated renewable
affected, and what type of measures might be                   electricity uptake, including both the new
taken to mitigate this.                                        employment generated in the renewables
                                                               sector, and also the consequences for
This report focuses on the employment                          employment in both fossil fuel generators
impact of an accelerated uptake of                             and their fuel supply streams.
renewable electricity generation that sees
Australia derive 50% of its electricity from                   At a national level, both the BAU and 50RE
renewable sources by 2030 (50RE), against                      scenarios lead to additional employment in
a business as usual (BAU) scenario of 34% of                   the electricity sector, resulting from both
electricity from renewable sources by 2030¹.                   construction of new electricity generating
This report explores the employment effects                    infrastructure and from the operation of
that are likely to flow from this increase in                  existing and new generating capacity. The
renewable electricity, and corresponding                       accompanying job losses due to reduced coal
decrease in the use of fossil fuelled                          fired electricity generation are more than
electricity, referencing similar transitions                   compensated for by additional jobs created
that are underway in other sectors and                         in renewables energy construction and
countries. Based on this, this report sets out                 operation. Jobs are created in both scenarios
to better understand how Australia can best                    in all states, although some more than others.
manage the employment implications of                          The BAU scenario illustrates that Australia
this transition.                                               is already moving away from coal energy to
                                                               renewables.

1
 Business as usual renewable energy increases are driven by a combination of the 33,000 GWh by 2020 large-scale component of the national
Renewable Energy Target, continuing rooftop solar PV deployment plus some additional wind and utility scale solar PV.
4   RENEWABLE ENERGY JOBS:
    FUTURE GROWTH IN AUSTRALIA

    2. International and
       National Climate
       Policy
                At an international level, the United              would be expected (Climate Action Tracker
                Nations Framework Convention on                    2015). Stronger action is clearly required to
                Climate Change (UNFCCC) is the                     tackle climate change.
                primary inter-governmental forum
                for international climate policy                   While a 2°C rise in temperature above pre-
                development and agreement.                         industrial levels has been established as a
                                                                   policy target, even this level of warming
                The most recent Conference of the Parties to       may drive significant impacts. As scientific
                the UNFCCC held in Paris in December 2015          knowledge improves, it is becoming clear
                (COP21), was widely seen as a milestone in         that risks previously considered to lie only
                international climate policy. World leaders        above 2°C may occur at lower temperatures.
                committed to work together to tackle climate       With just 0.9°C of warming to-date,
                change in a strong agreement that requires         Australia has already experienced adverse
                countries, big or small, rich or poor, to          consequences (CSIRO and BoM 2015).
                pursue efforts to limit global warming. The        Hot days have doubled in the last 50 years
                Paris agreement is a universal agreement           (CSIRO and BoM 2012), while heatwaves have
                involving over 190 countries around the            become hotter, last longer and occur more
                world (including Australia) to limit the           often (Perkins et al. 2012; Climate Council
                temperature increase to well below 2°C             2014a). Similarly, extreme fire weather has
                above pre-industrial levels, and to pursue         increased over the last 35 years in southeast
                efforts to limit the increase to 1.5°C. Almost     Australia, putting people and property
                all nations have submitted pledges to reduce       at risk (Johnston 2009; Climate Council
                their emissions over the next 10-15 years and      2013). Property and infrastructure across
                have committed to continually review and           Australia has been built for previous climatic
                strengthen their emissions reduction targets.      conditions, and is ill-prepared to cope with
                                                                   increasingly frequent and/or intense extreme
                Analysis of the Intended Nationally                weather. For instance, over $226 billion
                Determined Contributions (INDCs) -                 in commercial, industrial, road, rail and
                emission reduction targets each country            residential assets around Australian coasts
                intends to contribute - indicates that, with all   are potentially exposed to a sea-level rise of
                current INDCs being ratified and delivered,        1.1 metres, possible by the end of the century
                warming of between 2.4°-2.7°C by 2100              under a high emissions scenario (DCCEE
                compared with the pre-industrial levels            2011; Climate Council 2014b).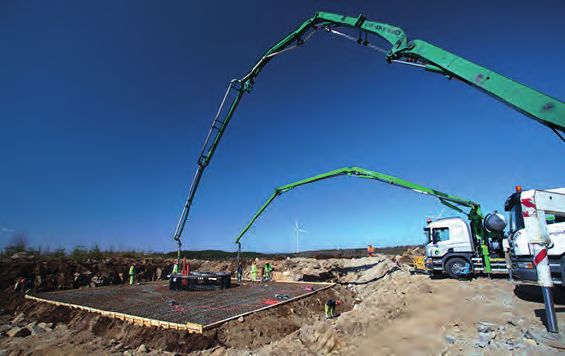
CHAPTER 03         5
                                                                                                                      MODELLING APPROACH

                      As part of the COP21 agreement, Australia                         Emissions Reduction Fund, to purchase
                      has committed to a 26-28% reduction                               abatement from a range of activities in
                      in greenhouse gas emissions by 2030                               Australia, and; the Safeguard Mechanism,
                      (compared to 2005). This is less ambitious                        which aims to limit future greenhouse gas
                      than emissions reductions recommended by                          emissions from large businesses in Australia.
                      the Climate Change Authority (CCA), which
                      advised Australia’s post- 2020 target should                      Of these three pillars, the Renewable Energy
                      include: a 2025 target of a 36% reduction                         Target is most clearly focused on the electricity
                      compared to 2005, and; further reductions of                      sector. The target is split in two, with demand
                      between approximately 45 to 65% below 2005                        for large-scale renewable electricity supported
                      levels by 2030².                                                  by requiring retailers to source an increased
                                                                                        share of renewable energy, which is supplied
                      To achieve a 26-28% reduction in greenhouse                       by new renewable generation assets like
                      gas emissions by 2030, the Australian                             wind and solar farms. Small-scale generation,
                      government is pursuing a range of policies,                       such as rooftop solar PV, is supported via a
                      including: the Renewable Energy Target                            similar but uncapped mechanism, and this
                      to encourage the additional generation of                         generation does not form part of the 33,000
                      electricity from sustainable and renewable                        GWh 2020 renewable electricity target.
                      sources (Clean Energy Regulator 2015); the

3. Modelling Approach
                      This report compares employment3                                  To achieve this, two interlinked models are
                      arising in Australia from                                         used to estimate the comparative impact of
                      development, construction                                         accelerated uptake of renewable electricity in
                      and generation activities in the                                  Australia: an electricity generation forecast
                      electricity sector in Australia under                             model, and a sectoral employment model.
                      BAU and 50RE scenarios by 2030.                                   Combined, these models allow employment
                                                                                        (construction, operation and maintenance
                                                                                        jobs) to be estimated for both the BAU and
                                                                                        50RE scenarios in 2030.

2
  The CCA’s recommendations are based on a two-thirds chance of limiting warming to 2°C above long-term levels.
For a greater chance of meeting this ambition, emission reduction targets would need to increase further.
3
 In this report, ‘employment’ and ‘jobs’ are used interchangeably to refer to employment in a particular year (or the difference in employment
between two years). FTE (full time equivalent) employment typically refers to the total employment years occurring over a given period.
6 RENEWABLE ENERGY JOBS:
FUTURE GROWTH IN AUSTRALIA
Electricity Model
This report uses EY’s Australian electricity 50% Renewable Electricity (50RE)
forecast model to forecast electricity capacity Generation Scenario
and generation in Australia to 2030 on an
annual basis. This model forms the basis of The 50RE scenario models a potential
both the BAU and 50RE scenarios. pathway for accelerated renewable energy
deployment in Australia. The BAU and
Business as Usual (BAU) Generation 50RE scenarios are identical prior to 2020;
Scenario however, for the period 2020-2030 the 50RE
scenario sees significantly more renewable
Under current policy settings, Australia is electricity generating capacity being built
forecast to increase its renewable electricity and operated in Australia. To achieve this,
generation from producing around 15% of the model increases the rate of renewable
electricity today to 34% in 2030, including electricity new-build (wind, utility scale and
large-scale hydro, wind, utility scale and rooftop PV) linearly from 2020 to 2030, scaled
rooftop photovoltaic (PV) panels, and to deliver 50% of electricity from all renewable
biomass. This is the BAU scenario. electricity sources in 2030⁵,⁶.
The BAU scenario shows a likely evolution Due to the extra electricity generation
of the Australian electricity network, from renewables, less fossil fuel electricity
based on current policy settings, known generation (black and brown coal, combined
retirement of existing coal and gas fired cycle gas turbines and open cycle gas
generators, demand forecasts provided by turbines) is required. In the 50RE scenario,
the Australian Electricity Market Operator coal capacity has been reduced (through
(AEMO), and other assumptions regarding plant closures) such that the remaining
future build decisions (see Annex 1 for plant achieves the same average power
further details). The model anticipates that output over time (capacity factor) as under
in 2030, renewable electricity will contribute the BAU scenario7.
around 34% of total electricity demand
for the National Electricity Market (the The 50RE scenario retains the forecasts for
electricity grid connecting Queensland, hydro, diesel, cogeneration and biomass
New South Wales, Victoria, South Australia that are assumed for the BAU scenario. The
and Tasmania) plus the South West contributions from diesel, cogeneration and
Interconnected System (the electricity grid biomass were less than 2% of total generation
connecting southwest Western Australia)⁴. in 2030 under the BAU scenario.
4
This report does not consider current or future generation in the Northern Territory or Australian Capital Territory as comparable AEMO data is not
available for the territories.
5
An increasing proportion of renewable electricity on an existing electricity network can impose additional network requirements, such balancing,
frequency control and other reserve services. While the BAU scenario addresses these requirements, the network and security of supply implications
of the 50RE scenario have not been investigated. It is possible that the 50RE scenario may require additional capital or operational activities, including
the potential for battery storage, to ensure an equivalent level of security of supply. By excluding the employment impacts associated with any
additional network service requirements under the 50RE scenario, this report takes a conservative approach of potentially underestimating the
employment that would arise from these activities under the 50RE scenario.
6
While additional policy settings would likely be required to achieve this higher rate of renewables uptake, this report is not prescriptive as what
those policy settings should be. Achieving the 50RE scenario will require additional renewable electricity generation, which will have impacts on
employment: this employment impact will be in proportion to the type and degree of renewables uptake, but is broadly insensitive to the policy
settings used to drive the additional renewables uptake.
7
Employment creation from decommissioning activities, whether under the BAU or 50RE scenarios, is not included in the scenarios modelled. As
increased decommissioning would be anticipated under the 50RE scenario in comparison to the BAU scenario, the exclusion of decommissioning
employment takes a conservative approach that potentially underestimates the additional employment that would arise from these activities under a
50RE scenario.CHAPTER 03 7
MODELLING APPROACH
Employment Model
Economic activity, such as planning, Scope 1 employment refers to labour
building and operating electricity generators, associated directly with the economic
creates employment. Some employment activity of a sector. For the electricity
is long-term, some is shorter-term: some industry these jobs include employment
employment is directly associated with the associated with the construction, operation,
economic activity, while some additional maintenance and development of electricity
employment occurs indirectly in other generators, be they coal fired power stations,
sectors of the economy. wind farms or solar PV plants.
This report considers the economy-wide Scope 2 employment results from a direct
employment that flows from economic relationship between the electricity project or
activity associated with electricity company and a supplier. This might include
construction and generation under the BAU jobs associated with mining coal (for a coal
and 50RE scenarios, including jobs that are fired power station) or those that are involved
directly linked to the activity and those that in producing solar PV panels. Scope 1 and
have a less immediate connection. These 2 jobs are often referred to as direct and
different types of employment generation are indirect employment, with the important
referred to as Scope 1, 2 and 3 employment, distinction between the two being their
described below (and illustrated using the relation to a product, project or business.
example of a wind farm in Box 1).
Scope 3 employment is the total employment
that occurs along the entire supply chain
of a product. Scope 3 employment includes
scope 1 and 2 employment, but additionally
includes all employment occurring further
up the supply chain.8 RENEWABLE ENERGY JOBS:
FUTURE GROWTH IN AUSTRALIA
BOX 1: ILLUSTRATING EMPLOYMENT TYPES USING THE EXAMPLE CASE OF A WIND FARM
›› Scope 1 includes employment associated
with project development, construction
of access tracks, erecting wind turbines
and ongoing operational employment
such as site managers.
›› Scope 2 includes the manufacturers
who supply turbine parts or equipment
that contributes to the development and
construction of the wind farm.
›› Scope 3 employment would include
(for example) employment in the steel
industry to produce the raw material
inputs for wind turbines, together with
wider employment generation⁸.
8
Economic activity in the electricity sector in Australia can also generate employment outside of Australia: examples would include employment
associated with the overseas manufacture of solar PV panels for rooftop or utility-scale solar electricity systems, or steam turbines for thermal power
stations which are imported into Australia. The employment analysis in this report does not include jobs created outside of Australia as a result of
economic activity in the electricity sector in Australia.CHAPTER 03 9
MODELLING APPROACH
BOX 1: CONTINUED
Figure 1: Wind farm employment associated with construction and manufacturing activities.10 RENEWABLE ENERGY JOBS:
FUTURE GROWTH IN AUSTRALIA
Employment Multipliers
To determine the Scope 1, 2 and 3 of wind turbines drives economic activity
employment impacts for the BAU and 50RE across a range of different sectors. The
scenarios, employment multipliers were capacity multipliers derived from the Eora
taken from the Eora input-output model9. model were weighted (using data from the
Employment multipliers were derived International Renewable Energy Agency -
for operational expenditure in electricity IRENA) to reflect the contribution of different
generation and capital expenditure for new sectors to the construction of wind farms.
build: further refinements were carried out to Further, not all employment associated
derive employment multipliers for generation with wind farm construction would be
(GWh/y) and new build capacity (MW/y). generated in Australia: for example, while
laying foundations and access tracks for
Employment multipliers are expressed wind turbines needs to occur locally, the
per MW of new build capacity. However, wind turbine generator itself (blades and
considerably more solar PV or wind power nacelle) are usually manufactured overseas.
capacity is required to produce the same Expenditure splitting was carried out by
amount of energy as from conventional analysing capital costs associated with
coal or gas fired power stations. As a technology types to distribute the total
result, future scenarios with significant costs across the participating sectors. These
renewable electricity generation tend to be sectors were also analysed in relation to the
associated with significant job creation from activities occurring within Australia and
construction. those occurring internationally. International
employment driven by local investment (for
For the construction employment example, manufacturing of solar PV panels,
multipliers, the economic activity that drives wind turbine generator blades and nacelles)
employment does not occur within a single has not been included in the jobs figures
sector only: for example, the construction associated with BAU and 50RE scenarios.
9
While the Eora model provides a highly disaggregated view of the Australian economy, it does not directly provide separate employment multipliers
by electricity generating technology. To address this, additional employment data was obtained from the Department of Industry, Innovation and
Science, and from IbisWorld, and used to further refine the employment multipliers obtained from Eora.CHAPTER 04 11
AUSTRALIA’S ELECTRICITY MARKET
4. Australia’s
Electricity Market
Electricity Generation
and Demand
Despite an increase in the share of renewable for 85.4% of Australia’s annual electricity
electricity over the past five years from generation and renewables accounted for
7.5% (in 2009) to 14.6% (in 2015), Australia’s the remainder (Clean Energy Council 2016).
electricity market remains dominated by Black and brown coal makes up the largest
fossil fuels (Australian Government 2015a; proportion of Australia’s energy production
Clean Energy Council 2016). In 2014, fossil (Figures 2 and 3).
fuels (mainly coal and natural gas) accounted
WA
TAS
SA
VIC
NSW
QLD
0 MW 3,000 MW 6,000 MW 9,000 MW
Black Coal Brown Coal Gas Liquid Fuel Other
Hydro Wind Large Solar APVI Small Solar
Figure 2: Australia's live electricity production by energy sources in 2014 (REneweconomy 2016).12 RENEWABLE ENERGY JOBS:
FUTURE GROWTH IN AUSTRALIA
A primary consideration for forecasting Government 2016) (following the repeal of
changes in the electricity market is future the Carbon Pricing Mechanism).
electricity demand, including the magnitude
of peak electricity demands. Except for the Australia currently has an excess of electricity
period 2010 to 2013, electricity consumption generating capacity (McConnell 2014;
in Australia has been rising (Australian AEMO 2015) - that is, it has more generating
Energy Regulator 2015), and is forecast capacity than needed to meet electricity
to continue to rise over the next 40 years demand. AEMO’s Electricity Statement of
(Bureau of Resources and Energy Economics Opportunities reported surplus generating
2014). Increasing energy efficiency in capacity of around 7,400 megawatts (MW)
businesses and households, as well as in the National Electricity Market by 2023-
significant uptake of distributed generation 24, primarily in Victoria, New South Wales
technologies, such as rooftop solar PV, has and Queensland. AEMO has subsequently
impacted demand for electricity. However revealed that the market has responded
overall electricity demand grows due to to this surplus by notifying its intent to
population growth and increased industrial withdraw approximately half the surplus
consumption from Queensland liquefied capacity by 2022 (predominantly through
natural gas projects (AEMO 2015). Domestic the closure of coal fired power stations). This
consumption of coal-based electricity surplus capacity is partly a consequence of
has generally decreased over the years, lower than forecast electricity consumption
although in the past year consumption of over recent years, and increased renewable
black and brown coal increased (Australian electricity generation.
100
90
80
70
60
Per cent
50
40
30
20
10
0
NSW NT QLD SA TAS VIC WA Aus
Coal Natural Gas Oil Wind Hydro Other Renewable
Figure 3: Electricity generation by fuel type, and by state and territory, 2013–14.
Notes: NSW includes ACT. Source: Department of Industry and Science (2015) Australian Energy Statistics, Table O.CHAPTER 04 13
AUSTRALIA’S ELECTRICITY MARKET
Coal Fired Electricity
Generation in Australia
Australia’s coal fired power plants are among
the oldest and least efficient in the world.
The average age of Australia’s coal-fired
power stations is currently around 30 years,
with almost all (89%) of Australia’s coal
power stations using older, subcritical steam
technology (Caldecott et al. 2015).
Coal plant closures are already underway,
driven in part by age and by system-wide
excess capacity. In the past year, generation
companies have announced plans to retire
3,275 MW of coal capacity before 2022. A
further 1,276 MW of gas plant closures have
been announced. These closures total around
7% of Australia’s total generating capacity of
62,984 MW (AEMO 2015). At the same time
Australia’s thermal coal production and
exports have continued to grow (Table 5 in
Annex 4: Coal in Australia).
Australia’s coal-fired power
plants are among the oldest
and least efficient in the world.14 RENEWABLE ENERGY JOBS:
FUTURE GROWTH IN AUSTRALIA
Renewable Energy
Resources in Australia
Australia has been ranked among the that solar PV (both rooftop and utility-scale)
top three countries in four categories for will be the major generator of renewable
renewable energy production potential electricity in Australia.
from solar and wind energy (Beyond Zero
Emissions 2015: see Table 1). Australia has Australia is a world leader in household solar
the potential to generate a much higher PV, with double the rate of uptake (15% of
proportion of our electricity from renewable households on average) compared to the
energy. Our renewable energy resources are next country, Belgium where about 7.5% of
potentially capable of providing 500 times households have solar (ESAA 2015). High
the amount of electricity we currently use retail electricity prices, competitively priced
(AEMO 2013; Commonwealth of Australia solar panels and government incentives
2014). However, compared to similar (such as the small-scale component of the
countries, Australia has one of the lowest Renewable Energy Target and state-based
levels of renewable electricity generation feed-in tariffs) have led more than 1.5 million
(ESAA 2015a). While hydro and wind Australian households to install solar PV
currently dominate renewable electricity panels (by March 2016) (Australian Energy
generation in Australia, in 2030 it is expected Council 2016; Clean Energy Regulator 2016).
Table 1: Australia's potential to become a renewable energy "superpower" – top ten ranked nations for wind and solar energy
resources (Beyond Zero Emissions 2015).
Energy production Energy production Energy production
Energy production potential from potential from potential from
Rank potential per square km total land area unutilised land area rural land area
1 Egypt Russia Russia Australia
2 Saudi Arabia Australia Canada China
3 Australia China Australia United States
4 Kenya Brazil China Russia
5 Zimbabwe United States United States Canada
6 South Africa Canada Iran Brazil
7 Malta India Egypt Saudi Arabia
8 Cuba Argentina Argentina Argentina
9 Israel Saudi Arabia Saudi Arabia India
10 Mexico Mexico Brazil IranCHAPTER 05 15
EMPLOYMENT EFFECTS FROM 50% RENEWABLE ELECTRICITY
5. Employment Effects
from 50% Renewable
Electricity
The comparative employment effects
of the BAU (34% renewable electricity
in 2030) and 50RE (50% renewable
electricity in 2030) scenarios are
explored at a national level, state
level, and technology level.
National Employment Effects
At a national level, both the BAU and 50RE Nationally, the net additional employment
scenarios lead to additional employment in associated with the electricity sector in
the electricity sector, resulting from both Australia in 2030 would be around 44%
construction of new electricity generating higher than in 2014 under a BAU scenario,
infrastructure, and from the operation of and around 90% higher under a 50RE
existing and new generating capacity. Even scenario (Figure 4).
with some job losses due to reduced coal fired
electricity generation, these losses are more
than compensated for by additional jobs
created in renewables energy construction
and operation.
50% renewable electricity in 2030 will
lead to nearly 50% more employment
from electricity generation than
business as usual.16 RENEWABLE ENERGY JOBS:
FUTURE GROWTH IN AUSTRALIA
Net additional employment in 2030 (versus 2014)
30,000 90%
Construction
25,000
Operation
20,000
15,000 44%
10,000
5,000
0
BAU 50RE
Scenario
Figure 4: Net additional employment in the electricity sector in 2030 versus 2014, BAU and 50RE scenarios10.
In both BAU and 50RE scenarios, jobs in
renewable energy grow substantially.
For both BAU and 50RE scenarios, growth wind and solar facilities peaks in 2019, and
in electricity demand and new renewable sees average levels of renewable electricity
generating capacity over the period to 2030 construction employment in 2028-30 about
will drive additional employment. However, 30% lower than during the peak in 2019. By
the 50RE scenario sees significantly more contrast, renewable electricity construction
construction employment associated with employment under a 50RE scenario
new renewable electricity capacity than continues to increase over the 2020s,
would occur under a BAU scenario. Under the peaking in 2029 at levels around 60% higher
BAU scenario, construction employment for than in 2019 (the peak under BAU).
¹⁰ Shows total additional employment in Australia in 2030 (versus 2014) arising from construction of wind power, rooftop solar PV, utility scale
solar PV and new CCGT, and operation of conventional and renewable generators (excludes minor employment in operating diesel, biomass and
cogeneration).CHAPTER 05 17
EMPLOYMENT EFFECTS FROM 50% RENEWABLE ELECTRICITY
Figure 5: Wind farm construction - pouring concrete for a wind turbine foundation.
This net employment impact combines In 2030, around 80% of all new jobs under the
both employment creation and job losses. 50RE scenario are additional to the economy
Under the BAU and 50RE scenarios, (versus 2014), with the balance substituting
electricity generation from black coal and for existing jobs that were lost due to the
brown coal-fired power stations falls over shift away from conventional generation and
the period 2014-2030. However these job towards renewables.
losses are more than compensated for
by increased employment in renewable These results (Figure 4) are consistent with
electricity. In addition to construction research assessing perceived economic
employment associated with renewable losses and gains associated with deep
energy, further construction employment is decarbonisation of the Australian economy,
anticipated from new-build combined cycle which found “some technologies and
gas turbine facilities11 . activities decline, others expand and
contribute to continued economic growth”
(ClimateWorks 2014, p. 4).
11
The employment effects of new builds accelerate under both the BAU and 50RE scenarios included in the analysis.18 RENEWABLE ENERGY JOBS:
FUTURE GROWTH IN AUSTRALIA
BAU, 50RE and Coal
There is a direct link between coal-fired Under the 50RE scenario, domestic
electricity generation in Australia, and the consumption of thermal coal electricity
Australian coal mining sector. While the would be 22% lower in 2030 than under the
national employment impacts presented BAU scenario, and 28% less than in 2014.
above include flow-on impacts in related While these reductions are significant
sectors such as coal mining, it is useful to in terms of domestic thermal electricity
give a sense of scale to these effects. consumption (and Australia’s emissions from
coal electricity generation), the reductions
represent a much smaller proportion (3.5%) of
total coal production in Australia12 .
Australia would consume 22% less
black coal in 2030 under a 50%
renewables by 2030 scenario.
12
Based on FY16 forecast production of thermal and metallurgical coal from the Australian Government (2016b).CHAPTER 05 19
EMPLOYMENT EFFECTS FROM 50% RENEWABLE ELECTRICITY
State Employment Effects
Of course, Australian states vary markedly: Overall, New South Wales and Queensland
they have different population levels, see more net job increases from a 50RE
different electricity generation and demand scenario (versus 2014) than all other states
characteristics, and different levels of combined (Figure 6): New South Wales and
renewable resource availability. The changes Queensland are also the largest net recipients
to electricity generation employment under of additional jobs under a BAU scenario (not
BAU and 50RE scenarios will therefore be shown). Net job growth is largest for New
experienced differently in different states. South Wales, with a 50RE scenario seeing
over 11,000 more jobs in the electricity sector
All Australian states experience a net increase in 2030 (versus 2014) (Figure 6).
in employment in the electricity sector in
2030 (versus 2014) under both the BAU and
50RE scenarios. Over this period:
›› New South Wales and Queensland have
the largest net jobs growth.
›› South Australia and New South Wales have
the largest per capita jobs growth.
›› Victoria experiences the biggest transition
in employment from coal to renewable
electricity jobs.
All states benefit more under a
50% renewables scenario than by
continuing business as usual.20 RENEWABLE ENERGY JOBS:
FUTURE GROWTH IN AUSTRALIA
On a per-capita basis, South Australia is likely base than in Victoria, a larger and potentially
to experience the greatest net growth in jobs more cost effective renewable energy resource
under both the BAU and 50RE scenarios (2030 in SA, together with Victoria experiencing a
versus 2014), with New South Wales seeing the larger proportion of job losses as brown coal
second-greatest relative impact (Figure 7). electricity generation declines under the 50RE
scenario (thus reducing the net employment
South Australia could see around four times gains of the 50RE scenario). Despite these
the number of jobs per capita compared differences, Victoria still gains more jobs in
to Victoria: this likely reflects a number renewable energy than it loses in brown coal
of drivers, including renewable energy generation, with around 4,000 net additional
generation levels in SA growing from a higher jobs created in 2030 under the 50RE scenario.
Figure 6: Distribution of net additional jobs in 2030 under 50RE scenario (against 2014).
50% RENEWABLES
BY 2030
22%
EMPLOYMENT NATIONWIDE
7%
13% 28,000
41% Additional jobs in the states
(2030 versus 2014).
14%
2%
JOBS AND GROWTHCHAPTER 05 21
EMPLOYMENT EFFECTS FROM 50% RENEWABLE ELECTRICITY
All states benefit more under 50RE than BAU as coal generation declines under both BAU
in terms of job creation. South Australia and 50RE scenarios.
benefits proportionately more than other
states from a higher proportion of renewable In absolute terms, New South Wales not only
electricity, with Tasmania and New South has the largest net additional employment
Wales the next most positively impacted gain under the 50RE scenario, but it also
states (Figure 7). While still benefiting overall loses relatively fewer jobs compared to this
from 50RE compared with BAU, Western gain (Figure 8). Indeed, New South Wales,
Australia and Victoria see the most modest much like Queensland, South Australia,
increases in employment (under either Tasmania and Western Australia, will be
scenario as a proportion of population) creating a substantial number of new jobs,
compared to other states. many more than simply compensating
for job losses from the reduced fossil-fuel
These factors will be significant for states electricity generation anticipated under both
when assessing policy opportunities to the BAU or 50RE scenarios.
minimise the potential impacts experienced
Figure 7: Net additional employment per state in 2030 as a proportion of population, versus 2014 (% and employment per one
million inhabitants)13.
2,000
50RE
BAU
Additional employment per million
1,500
population, in 2030, versus 2014
59%
1,000
51%
71% 40%
500
41% 53% 56%
49% 60%
29%
47% 44%
0
SA NSW TAS QLD WA VIC
Population (millions) in 2030 (forecast)
13
Shows electricity sector construction and generation jobs in Australia, including employment from CCGT, as well as from wind power and solar PV
construction (utility and rooftop; and generation employment from all major generating technologies). Data excludes construction employment from
decommissioning. Construction job totals are the difference in average annual employment between FY14-16 and FY28-30 to remove some volatility
in these figures. Population projections are drawn from ABS 2013, for June 2030, Series A.22 RENEWABLE ENERGY JOBS:
FUTURE GROWTH IN AUSTRALIA
30,000
Change in employment in 2030 (versus 2014), by state
25,000
20,000
50RE gain/loss (additional)
15,000
BAU gains/loss
10,000
5,000
0
NSW NSW QLD QLD VIC VIC SA SA WA WA TAS TAS AU
(gained) (lost) (gained) (lost) (gained) (lost) (gained) (lost) (gained) (lost) (gained) (lost)
Region
Figure 8: Jobs gained and lost in 2030 versus 2014, BAU and 50RE14.
Victoria will see net employment increases employment, particularly associated with
under both BAU and 50RE scenarios. reduced generation from brown coal-fired
However, Victoria will experience the power stations. The majority of losses in
largest overall exchange of jobs from coal- Victoria are set to take place under the BAU
fired electricity generation to renewable scenario (Figure 8), with the shift to a 50RE
electricity generation under both the BAU scenario having limited further impact on
and 50RE scenarios. Job losses in Victoria employment in the brown coal generation
are expected to occur mostly in operation sector in Victoria.
14
Shows construction employment for wind, utility and rooftop solar PV and CCGT, and operation employment from all major generating
technologies. Construction jobs were calculated as the difference in average annual employment between FY14-16 and FY28-30 to remove some year
on year volatility in these figures. Excludes employment from decommissioning.CHAPTER 05 23
EMPLOYMENT EFFECTS FROM 50% RENEWABLE ELECTRICITY
50% RENEWABLES
BY 2030
ROOFTOP SOLAR
SOLAR 9%
HYDRO 9%
SOLAR 4%
BROWN
CCGT 3%
OCGT 2%
CCGT 3%
ROOFTOP SOLAR WIND BLACK COAL WIND
11%
COAL
70% 17% 39% 19%
SOLAR
14%
Contruction Jobs Operational Jobs
EMPLOYMENT: 2014-2030 NATIONWIDE
Figure 9: 50% Renewables by 2030 - employment by technology. (May not add up to 100% due to rounding).24 RENEWABLE ENERGY JOBS:
FUTURE GROWTH IN AUSTRALIA
Type of Renewable Electricity
and Employment Effects
In addition to national and state employment Within operations employment, brown
effects, there is a third dimension to and black coal-based electricity generation
the employment effects of the BAU and combined are responsible for just over half
50RE scenarios: the differing impact of of all operation jobs over the 16 year period.
different renewable energy technologies on By comparison, rooftop solar PV accounts for
employment (Figure 9). around 11% of operation jobs.
For the 50RE scenario, the majority of FTE Wind power accounts for the second-highest
jobs occurring in the electricity sector results proportion (19%) of generation employment,
from operations, with just over 40% of FTEs responsible for slightly more operations jobs
arising from construction (Figure 10)15. than brown coal (14%), with gas operations
jobs (open cycle gas turbine and combined
cycle gas turbine) being on a similar scale
to solar PV (2%, 3% and 4% of operations jobs
respectively).
15
FTE figures here relate to the total person – years of employment occurring over the period 2014-2030, not the employment in a specific year or the
difference in employment between specific years.CHAPTER 05 25
EMPLOYMENT EFFECTS FROM 50% RENEWABLE ELECTRICITY
TOTAL FTE (JOBS), FY14 TO FY30
100% 100% 100%
OCGT 2% CCGT 3%
Construction
CCGT 3%
Solar PV 4%
Solar PV 9%
Hydro 9%
Rooftop 42% Wind 17%
11%
PV
Brown 14%
Coal
Rooftop
Wind 19%
PV
70%
Operation
58%
Black
Coal 39%
Operation Total Construction
Employment Employment Employment
Figure 10: Total full-time employment over the scenario period 2014-2030, by activity and technology, 50RE scenario.
(May not add up to 100% due to rounding).26 RENEWABLE ENERGY JOBS:
FUTURE GROWTH IN AUSTRALIA
Large-scale renewable energy projects Figure 11 combines construction and
tend to be more labour intensive during the operation employment by technology for
development and construction phase than the 50RE scenario to show the relative
the operation of existing coal fired power contribution of employment by generating
stations (International Renewable Energy technology type in each state. In this
Agency, 2012). With most renewable energy overall view, conventional generators
generating capacity forecast for 2030 yet to (coal, gas and hydro) appear to be minor
be built, achieving a higher proportion of overall contributors to employment. This
renewable electricity will require additional is due both to their relative generation –
construction work to build the additional for example, combined cycle gas turbine
generating capacity. Further, to achieve generators deliver around half the electricity
the same long term energy output, more of utility solar PV generators in 2030 - but
renewable energy capacity such as wind it is also due to employment resulting from
and solar PV is required than for coal plants. the construction of additional renewable
generating capacity in 2030.
The majority of new electricity generating
capacity in the 50RE scenario and in In 2030, most states will see close to half
the identified investment pipeline is for of all jobs associated with rooftop solar PV:
renewable energy projects, with limited in Tasmania and New South Wales, the
additional combined cycle gas turbine proportion is around one quarter. As rooftop
capacity anticipated to 2030. As a result, most solar PV is generally located in areas where
of the construction jobs in the electricity people already live and work, employment
supply sector will stem from renewable generated from rooftop solar PV is likely to be
electricity. Under a 50RE scenario, 97% of accessible to people seeking employment. On
total construction FTEs (jobs) over the period the other hand, employment associated with
2014-2030 are forecast to be associated with projects in regional and remote locations (for
renewable energy. By contrast, a significant example, wind farms and utility scale solar
proportion of full time employment from PV) can also be an opportunity for those
the operation of electricity generators over communities, as in the case of the Oaklands
that period will still relate to black coal (39%), Hill Wind Farm.
brown coal (14%) and gas (5%) (Figures 9 and
10). This has important consequences for the
distribution and longevity of the jobs created
through the deployment of renewable energy
technologies (and reduction in fossil fuel
based generation).CHAPTER 05 27
EMPLOYMENT EFFECTS FROM 50% RENEWABLE ELECTRICITY
EMPLOYMENT IN 2030
Breakdown of total jobs in the electricity sector in 2030 by state
34% 25% 20% 10% 7% 4%
12%
15% 12%
18
%
Wind 29%
12% 5%
38%
24
%
Utility 25% 42%
Solar PV 57%
46%
47%
Rooftop 24%
Solar PV
58
23% %
7%
CCGT
27%
Other
20% 22%
Thermal 12%
13%
Hydro 4%
NSW QLD VIC SA WA TAS
Wind Rooftop Solar PV Other Thermal
Utility Solar PV CCGT Hydro
Figure 11: Breakdown of total jobs in electricity construction and operation in 2030 under the 50RE scenario, by state and
technology16, 17.
16
Including construction and operation jobs from wind power, solar PV (rooftop and utility) and CCGT, and operation jobs from other thermal (black &
brown coal, and OCGT) and hydro. Operational jobs for thermal generators include jobs in the fuel supply chain (coal mining and gas extraction). The
diagram represents total electricity supply sector employment in 2030 under a 50RE scenario.
¹⁷ The net increase in employment is shown in Figure 6.28 RENEWABLE ENERGY JOBS:
FUTURE GROWTH IN AUSTRALIA
Figure 12: Installing rooftop solar.
Employment from rooftop solar PV is
generally accessible, being located in areas
where people already live and work.CHAPTER 05 29
EMPLOYMENT EFFECTS FROM 50% RENEWABLE ELECTRICITY
Employment Effects of
Decommissioning Coal Plants
Decommissioning of conventional Aside from the number of additional jobs
electricity generators can be both lengthy decommissioning would create, these
and expensive. For example, research jobs would be focussed in areas where
has forecast that the market for coal plant employment is most likely to be affected
decommissioning in North America and by the closure of coal-fired generators.
Europe will grow from $455 million in 2013 Decommissioning jobs could form part of
to $1.6 billion by the end of 2016 (Maize the post-generation employment structure,
2014). An adequate policy response will possibly smoothing the employment
therefore need to include a cost effective transition that will occur under both the BAU
plan for decommissioning coal plants and 50RE scenarios. This effect is likely to
in Australia as part of a broader strategy be discussed on particular regions, such as
towards clean energy. Victoria’s Latrobe Valley.
This report has taken a conservative
approach to employment from
decommissioning, and does not include the
employment impacts of decommissioning
coal-fired power stations. As a result, overall
employment figures modelled for BAU
and 50RE will tend to be understated, and
as it is anticipated that some additional
decommissioning activities and jobs would
accompany the 50RE scenario.30 RENEWABLE ENERGY JOBS:
FUTURE GROWTH IN AUSTRALIA
6. Transitioning to a
New Employment
Landscape
The modelling and analysis New renewable energy jobs associated
presented here finds accelerated with this transition may have similar
uptake of renewable electricity is characteristics to current electricity
a scenario for overall employment generation jobs, but some will differ.
generation and employment Similarly, while some skills may be common,
transition, not reduced employment. this transition will likely alter the mix
of skills required, potentially creating a
mismatch between existing skills and
the needs of new electricity employment
opportunities (Cai et al. 2014).
The long-term and significant infrastructure
requirements of the 50RE scenario
create employment associated with the
construction of renewable electricity
generating capacity. Most construction
employment is generated from rooftop solar
PV installation, and this is neither remote
nor transient. Rooftop solar PV will be built
where people live and work – existing cities
and towns – resulting in construction
employment (and longer-term operational
support) for existing population centres.
The modelling finds accelerated
uptake of renewable electricity is
a scenario for overall employment
generation.You can also read