Gas Statement of Opportunities - For eastern and south-eastern Australia March 2019 - Australian Energy Market ...
←
→
Page content transcription
If your browser does not render page correctly, please read the page content below

Gas
Statement of
Opportunities
March 2019

For eastern and south-eastern Australia

Important notice

PURPOSE
AEMO publishes the Gas Statement of Opportunities under the National Gas Law and Part 15D of the
National Gas Rules.
This publication has been prepared by AEMO using information available at 10 December 2018, although
AEMO has endeavoured to incorporate more recent information where practical.

DISCLAIMER
This document or the information in it may be subsequently updated or amended. This document does not
constitute legal or business advice, and should not be relied on as a substitute for obtaining detailed advice
about the National Gas Law, the National Gas Rules, or any other applicable laws, procedures or policies or
for obtaining detailed business advice. AEMO has made every effort to ensure the quality of the information
in this document but cannot guarantee its accuracy or completeness.
Accordingly, to the maximum extent permitted by law, AEMO and its officers, employees and consultants
involved in the preparation of this document:
• make no representation or warranty, express or implied, as to the currency, accuracy, reliability or
  completeness of the information in this document; and
• are not liable (whether by reason of negligence or otherwise) for any statements or representations in this
  document, or any omissions from it, or for any use or reliance on the information in it.

VERSION CONTROL
Version        Release date             Changes

1.0            28/03/2019               New document

© 2019 Australian Energy Market Operator Limited. The material in this publication may be used in
accordance with the copyright permissions on AEMO’s website.
Executive summary

The 2019 Gas Statement of Opportunities (GSOO) contains AEMO’s projections for demand, and information
from gas producers about reserves and forecast production, to assess the projected supply-demand balance
and potential supply gaps under a range of plausible scenarios for the outlook period to 2038, for the eastern
and south-eastern Australian gas markets.

     The 2019 GSOO highlights that the gas supply-demand balance remains tight, with gas production in
     southern Australia continuing to decline, and supplies from Queensland limited by pipeline capacity:
     • Supply from existing and committed gas developments is forecast to provide adequate supply to
       meet gas demands until 2023. However, risks remain that any weather-driven variances in
       consumption or electricity market activity could increase gas demand, creating potential peak-day
       shortages as outlined in AEMO’s 2019 Victorian Gas Planning Report 1.
     • While new gas development is continuing in Victoria, reserve estimates have reduced, and producers
       are declaring more gas resources commercially unviable. Consequently, production from the southern
       gas fields is expected to decline over the 20-year outlook.
          – From 2021 to 2023, this decline in production will reduce Victoria’s ability to export surplus gas
            supplies to South Australia and New South Wales, placing more reliance on Queensland supplies
            to meet gas demand in these states. It will also increase reliance on the Iona underground gas
            storage facility to meet winter demand in Victoria.
          – From 2024, major southbound pipeline infrastructure upgrades would be required to deliver more
            gas from northern to southern states (predominantly over the winter months when southern
            demand is highest). AEMO forecasts potential for supply gaps from 2024 onwards, unless
            additional southern reserves and resources, or alternative infrastructure, are developed.
     • This GSOO confirms trends identified in the 2018 GSOO, including short-term reductions in demand
       for gas for gas-powered generation of electricity (GPG) and increases in demand for liquefied natural
       gas (LNG) exports. Longer-term, based on updated industry data and advice, this GSOO projects
       reduced demand and production in the LNG sector compared to the 2018 forecasts.
     • The Northern Gas Pipeline (NGP) has commenced operation and has started flowing gas from
       Northern Territory to Mount Isa, Queensland at up to 90 terajoules (TJ) per day, with delivery contracts
       locked in for around 26 petajoules (PJ) per year. This frees up equivalent capacity on the South West
       Queensland Pipeline (SWQP) to supply the southern states (New South Wales, Victoria, South
       Australia, and Tasmania) as the capacity is no longer required to supply Mount Isa. However, the
       pipeline capacities into Sydney and Adelaide then start limiting imports from Queensland.
     • Continued interest in LNG import terminals, particularly in Victoria, New South Wales, and South
       Australia, would be expected to help relieve pressure on meeting southern gas demand during peak
       periods and assist in reducing pipeline constraints, but may do little to ease gas pricing pressures.

1
    See AEMO’s 2019 Victorian Gas Planning Report for more discussion on peak day gas concerns in Victoria. Available at http://www.aemo.com.au/Gas/
     National-planning-and-forecasting/Victorian-Gas-Planning-Report.

© AEMO 2019 | Gas Statement of Opportunities                                                                                                           3
Forecast demand
Figure 1 shows gas consumption forecasts by demand sector for the 2019 GSOO2. It highlights that:
• Total demand trends continue to be driven by trends in LNG export demand, given its relative volume.
• Short-term trends in the total east coast gas consumption forecasts are for a small total increase, similar to
those forecast in the 2018 GSOO, mainly due to an increase in projected LNG exports.
• Longer-term forecasts show a reduction in total demand projected, and a lower total forecast than in the
2018 GSOO from the mid-2020s, mainly due to a decrease in projected LNG exports.
Figure 1 Gas consumption actual and forecast, 2019-38, all sectors, Neutral scenario (PJ)
Short-term trends in east coast gas consumption forecasts are:
• LNG exports are forecast to increase slightly in the short term to capitalise on global spot market
opportunities beyond their long-term contractual obligations.
• Industrial consumption continues to be relatively flat as this sector seeks ways to maintain current
operating levels in an increasingly challenging economic environment.
• Residential and commercial sector consumption is projected to have stronger growth than forecast in the
2018 GSOO. Drivers of this change include updated population projections from the Australian Bureau of
Statistics (ABS)3 and greater consideration of consumption patterns impacting residential forecasts.
However, the materiality to total trends is relatively small, given the size of the residential and commercial
sector relative to the total consumption forecast.
• As forecast in the 2018 GSOO, demand for GPG is declining, due to increased penetration of renewable
generation. In the 2018 calendar year, nearly 2,000 megawatts (MW)4 of new utility-scale renewable
capacity was installed in the National Electricity Market (NEM), while distributed energy resources such as
rooftop photovoltaics (PV) continued to grow. This contributed to reduced demand for GPG of 130 PJ in
2
Demand forecasts are available on the Forecasting Data Portal http://forecasting.aemo.com.au/. Select ‘GSOO 2019’ from the publication drop-down.
3
This projection reflects the latest census population projections released by the ABS in 2018.
4
See AEMO’s generation information page, 21 January 2019 compared to 29 December 29 2017, at http://www.aemo.com.au/Electricity/National-Electricity-
Market-NEM/Planning-and-forecasting/Generation-information.
© AEMO 2019 | Gas Statement of Opportunities 42018, 54 PJ (29%) lower than in 2017. This trend is forecast to continue in the short term, with over
7,000 MW5 of additional renewable generation either committed or under construction.
In the medium to longer term, although growth is expected from higher population projections, there is a
slight reduction in forecast total gas demand relative to the 2018 GSOO, arising from:
• Slowing growth in demand for international LNG as well as more international competition to supply LNG,
reducing the incentive for east coast LNG to ramp up to full train capacity.
• Increased vulnerability of some industrial loads in the face of increasing gas prices.
GPG is expected to continue to provide a reliability and security role to complement variable renewable
energy, therefore demand for gas from this sector is expected to stabilise in the medium term, with slight
growth forecast in the longer term.
Forecast supply
AEMO has been provided with updated production forecasts and gas reserve and resource information from
gas producers to inform the 2019 GSOO. This new information reflects the industry’s current best view of gas
resources and production expectations as at December 2018.
Table 1 shows the production forecast between 2019 and 2022 provided to AEMO by gas producers as their
current best estimate.
These production forecasts contain volumes of undeveloped reserves and contingent resources. Some of
these reserves and resources are associated with anticipated projects that are actively under development
planning utilising existing production infrastructure (and therefore considered reasonably likely to proceed),
while others have increased uncertainty, because they are not as far along the path to development.
Gas production from the southern states includes new gas projects, such as Cooper Energy’s Sole project and
Esso-BHP’s West Barracouta project (which are forecast to begin production in 2019 and 2021 respectively),
offsetting the continued decline in southern production. Northern production is expected to continue
increasing between 2019 and 2022.
Production forecasts as provided by producers are very similar to those provided for the 2018 GSOO. The
largest difference between the forecasts in the next four years is in 2020, where the net production forecast is
31 PJ lower than in the 2018 GSOO, with the forecasts from fields in the northern states decreasing by 23 PJ,
and the forecasts from fields in the southern states decreasing by 8 PJ. The smallest difference is in 2019,
which is 5 PJ lower than the 2018 forecast, as the southern fields are 8 PJ lower while the northern fields see
an increase of 3 PJ forecast in that year.
Table 1 Production forecasts to 2022 (PJ) as provided by gas producers, with 2018 actual production
2018 actual 2019 2020 2021 2022
production
VIC/NSW/SAA 433 444 475 480 456
Southern states difference from 2018 GSOO forecast -8 -8 17 -23
QLD/NTA 1,386 1,489 1,538 1,593 1,607
Northern states difference from 2018 GSOO forecast 3 -23 -43 4
Total production 1,818 1,933 2,013 2,072 2,063
Total difference from 2018 GSOO forecast -5 -31 -27 -19
A. The Queensland component of the Cooper Eromanga basin appears in the SA category.
5
See AEMO’s generation information page, 21 January 2019, new wind and solar projects with commitment status ‘Committed’ and ‘Com*’ in regional
spreadsheets under “New developments” tab, at http://www.aemo.com.au/Electricity/National-Electricity-Market-NEM/Planning-and-forecasting/
Generation-information.
© AEMO 2019 | Gas Statement of Opportunities 5Producers also advise that rates of drilling in coal seam gas (CSG) fields continue to increase, while
production rates are holding steady, or only increasing at a slower rate. That is, increasing amounts of
investment are required to keep the same amount of production. Unless new sources of gas are discovered,
this trend is unlikely to change.
Meeting northern producers’ forecasts of production by 2022 will require a 17% increase in annual production
relative to actual levels observed in 2018. If these annual production increases are not achievable, spot
quantities of LNG export demand may need to be foregone, reducing the flex in LNG exports if increased
quantities are needed to supply domestic demand. As pipeline constraints are expected to limit the quantity
of Queensland supply that can be sent south, the overall impact on LNG exports is expected to be limited.
As forecast in the 2018 GSOO, the NGP was commissioned in December 2018, and began commercial
operation on 3 January 2019. Following the Northern Territory government’s decision in 2018 to lift a
moratorium on hydraulic fracturing, gas supply certainty has increased. This has led to speculation of an
upgrade of the NGP, which may be able to send up to 700 TJ per day of gas to the eastern gas markets.
While not included in the GSOO’s base modelling, this expansion – and others – have been tested as
sensitivities to the GSOO outcomes.
Quantities of 2P6 developed and undeveloped reserves have reduced slightly (roughly 5% and 6%,
respectively) compared to the reserves reported in the 2018 GSOO. The reported 2C 7 contingent resources
have increased by around 27% as some 2P reserves have been downgraded as less economical, and further
exploration drilling has increased quantities of contingent resources. While it is positive that an increasing
amount of contingent resources has been recorded, these resources are not yet considered by producers to
be commercially viable, and there is no guarantee that these quantities will become economic and developed
by the time they are required to meet demand.
This shift from 2P reserves to 2C resources is most noticeable in the southern states, where quantities of 2P
developed reserves have dropped by 32% – nearly 1,100 PJ in the past year – with only a 270 PJ rise in 2P
undeveloped reserves. This pushes forward the time when contingent resources from southern basins, or
alternatively gas imports from northern states or LNG imports, will be required to meet domestic demand.
Based on information provided by producers, reported 2C contingent resources in southern states have
increased 71% compared to the 2018 GSOO.
Supply and infrastructure adequacy assessment
Supply from existing and committed gas developments8 is forecast to provide adequate supply to meet gas
demands until 2023 under Neutral scenario demand conditions, although supply-demand conditions are
finely balanced.
Victoria has supplied, on average, 150 PJ per year to Tasmania, New South Wales, and South Australia from
production surplus to Victorian gas consumption requirements over the last five years. Without new reserves
and resources being developed in Victoria, this production surplus is projected to erode to 23 PJ in 2023. As a
result, New South Wales and South Australia will need to source more gas from Queensland. Pipeline
infrastructure constraints (particularly the Moomba to Sydney Pipeline, Moomba to Adelaide Pipeline, and
later the SWQP if Moomba production is reduced) start limiting the amount of gas able to be transported
from the north to meet southern domestic demand or refill storages.
As production from southern fields further declines, and pipeline capacity from Queensland becomes fully
constrained, AEMO forecasts supply gaps from 2024, requiring new infrastructure development, new
commitments to develop reserves and contingent resources, or the discovery and development of
6
Gas reserves and resources are categorised according to the level of technical and commercial uncertainty associated with developing them. Reserves are
quantities of gas which are anticipated to be commercially recovered from known accumulations, and proved and probable (2P) is considered the best
estimate of commercially recoverable reserves.
7
Contingent resources are not yet considered commercially viable, and 2C is considered the best estimate of those sub-commercial resources.
8
For the purpose of this assessment, committed projects are those that have reached final investment decision.
© AEMO 2019 | Gas Statement of Opportunities 6prospective resources9 in the south to meet forecast demand. Figure 2 shows the expected production
forecast if only existing and committed projects eventuate.
Figure 2 Projected eastern and south-eastern Australia gas production (export LNG and domestic),
2019-38; supply from existing projects and committed developments
Producers have indicated to AEMO that 34 PJ of gas from anticipated projects10, or uncertain, not yet
commercial, contingent resources, may become available for production in 2020, increasing up to 87 PJ by
2023. These resources are included in Table 1, but are not included in the above assessment due to the
development uncertainty. Approximately 90% of these uncertain reserves and resources are located in
the south.
The reserve mix required to meet forecast demand is shown in Figure 3 below, for the case that assumes all
anticipated projects and uncertain reserves and resources are developed as needed to avoid early shortfalls.
This projection of forecast production is directly comparable to the supply adequacy assessment presented in
the 2018 GSOO.
Figure 3 shows:
• The rapid decline in production from 2P developed reserves forecast by producers, mostly from fields
located within the southern states.
• Projected reliance on less certain 2C contingent and prospective resources to meet demand, beginning in
2024 and increasing over time.
Assuming all projects are developed, supply gaps are projected to emerge from 2030, as also forecast in the
2018 GSOO.
9
Prospective resources are even more uncertain than contingent resources, with exploratory drilling required to confirm presence and develop
reserve estimates.
10
For the purpose of this assessment, anticipated projects are defined as projects actively under development planning, utilising existing production
infrastructure.
© AEMO 2019 | Gas Statement of Opportunities 7Figure 3 Projected eastern and south-eastern Australia gas production (export LNG and domestic),
2019-38; supply from all available resources (including uncertain undeveloped projects)
As existing fields decline, exploration and development will be needed to deliver these contingent and
prospective resources to market. These new gas supplies will help improve adequacy of supply but, as
flagged in the 2018 GSOO, supply from these fields is likely to be more costly than existing production. Within
the next five years, domestic gas demand, particularly in the southern states, will be difficult to meet in its
entirety without either:
• Exploration and development of new southern resources, or
• New gas supplies delivered via LNG import terminal, or
• Major pipeline infrastructure expansions to deliver Queensland and Northern Territory gas southwards, or
• A combination of all three.
Further storage facilities may help meet peak demand once increased gas is made available.
Uncertainties that may impact supply adequacy
While no shortfalls are forecast in the next several years under expected conditions, uncertainties that may
impact gas consumption trends in all demand sectors may further tighten the supply-demand balance, and
create issues with meeting peak demand.
Table 2 highlights some of these risks facing the short-term gas supply adequacy outlook.
The key uncertainty that could have a material impact on gas supply adequacy in the short-term is the level
of GPG demand. Demand for GPG in the NEM is highly variable, and is influenced by weather conditions, the
reliability of coal-fired generation and coal supplies, the timing of new generation and transmission
development, and the retirement of ageing thermal generation.
The gas supply-demand outlook is finely balanced by 2023, just after the closure of the Liddell coal-fired
power station. If the initial transmission developments identified in AEMO’s 2018 Integrated System Plan (ISP)
are not operational prior to Liddell’s closure, this will place greater demand on GPG at a time when gas
supply sources are scarce.
© AEMO 2019 | Gas Statement of Opportunities 8Table 2 Risks, likelihood, and probable impact of uncertainties to supply adequacy in the short term
Risk Likelihood Impact
Higher than expected GPG Possible Analysis takes into account current drought conditions, but if generation
demand from wind farms or solar generators is lower than expected (within the
normal range of annual variability), or 10% of committed renewable
generation projects are delayed, GPG demand could be up to 22 PJ higher.
An unexpected six-month unavailability of coal-fired generation, or
reductions in coal supplies for generation, could increase GPG demand by up
to 10 PJ.
Higher than expected gas Low Minor impact, as significant increases in demand (LNG or industrial sector)
demand (excluding GPG) are unlikely without discovery of new lower-cost gas supply sources.
Faster than expected decline in Possible Depending on the rate of decline, this could have a major impact on
southern production domestic gas supply adequacy if new sources of gas are not developed in
time to fill the decline.
Underperforming Queensland Possible In the short term to 2023, CSG underperformance is not likely to have an
CSG fields impact on meeting domestic demand, although LNG exports may have to be
reduced to ensure domestic demand is met.
Failure of critical gas infrastructure Low Any failure of a critical gas supply infrastructure could also have short-term
impacts on supply adequacy, depending on the exact nature of the failure.
About 27 PJ of additional gas is forecast to be available in 2019, should demand be higher than forecast. If
demand increases further than that, or further development or exploration of new supply is delayed, then
increased rates of production would be required, or spot quantities of LNG export demand may need to be
foregone, to ensure all domestic demand is met.
The growing importance of integrated system planning
The 2019 GSOO highlights the growing importance of a fully integrated planning view to be taken across the
energy sector, to ensure efficient, reliable, and secure supply of both gas and electricity, as the two sectors
are intrinsically linked.
Investment decisions in either sector impact supply adequacy in the other:
• Availability of gas reserves, resources and pipeline capacities influence the cost and availability of gas and
consequently the viability of future GPG to supply electricity consumption in volume.
• Timings of new transmission and renewable generation development in the power system influence GPG
forecasts and gas supply adequacy.
AEMO’s modelling approach therefore provides a fully integrated perspective across both demand and
supply across the electricity and gas sectors, through publications such as the Electricity Statement of
Opportunities, GSOO, and ISP.
Within the gas sector, there is also a growing need to take a holistic planning view, so future gas demand can
be met in an efficient and timely manner. The 2019 GSOO analysis indicates there is no one single new supply
source or infrastructure development that would be able to fill the gap to meet all Australia’s domestic and
export gas demand over the next 20 years. Instead, a combination of developments to the gas system is
projected to be needed to improve both infrastructure and resource adequacy and avoid shortfalls.
To facilitate more co-ordinated planning, greater information transparency is required, as highlighted in
recommendations from the Australian Competition and Consumer Commission (ACCC) and Gas Market
Reform Group on east coast gas market transparency11. In 2019, AEMO will explore use of mechanisms that
improve access to, and the quality of, information made available for future GSOOs.
11
Further details are available on the website of the Council of Australian Governments (COAG) Energy Council, at http://www.coagenergycouncil.gov.au/
publications/energy-council-web-text-%E2%80%93-accc-gmrg-recommendations-east-coast-gas-market-transparency.
© AEMO 2019 | Gas Statement of Opportunities 9Contents
Executive summary 3
1. Introduction 13
1.1 Demand forecasts for eastern and south-eastern Australia 13
1.2 The Australian Domestic Gas Security Mechanism 13
1.3 Scenarios 14
1.4 New approach to assessing gas supply adequacy 15
2. Demand forecasts 17
2.1 Eastern and south-eastern demand forecast trends 17
2.2 Consumption forecasts by sector and region 19
2.3 Maximum daily demand forecasts 31
3. Supply outlook 33
3.1 Production categories 33
3.2 Status of reserves and resources 34
3.3 Changing infrastructure limitations 35
3.4 Short-term supply outlook 38
4. Supply adequacy 40
4.1 Supply from existing and committed gas developments 40
4.2 Supply from existing, committed, and anticipated gas developments 43
4.3 Supply from all projects including uncertain developments 45
4.4 Short-term uncertainties that may impact supply adequacy 47
5. Potential new sources of supply 53
5.1 LNG import terminals 54
5.2 Northern Gas Pipeline upgrade and extension 56
5.3 Further Queensland – New South Wales interconnection 57
5.4 Further Queensland – New South Wales interconnection in addition to NGP/Galilee
expansion 58
5.5 Supply options comparison 58
A1. Forecast accuracy 60
Glossary 65
© AEMO 2019 | Gas Statement of Opportunities 10Tables
Table 1 Production forecasts to 2022 (PJ) as provided by gas producers, with 2018 actual production 5
Table 2 Risks, likelihood, and probable impact of uncertainties to supply adequacy in the short term 9
Table 3 Scenario drivers of most relevance to the gas market 15
Table 4 Comparison of 2018 GSOO and 2019 GSOO Neutral gas consumption forecasts for 2020 (PJ) 18
Table 5 Percentage splits of gas consumption by sector (not including UAFG), 2018 20
Table 6 Estimated impact on forecasts due to changes to residential and commercial drivers 21
Table 7 Total 1-in-2 and 1-in-20 forecast maximum demand, summer, all sectors excluding GPG,
including UAFG (terajoules (TJ)/day) 32
Table 8 Total 1-in-2 and 1-in-20 forecast maximum demand, winter, all sectors excluding GPG,
including UAFG (TJ/day) 32
Table 9 Actual 2018 production and production forecasts to 2022 (PJ), as provided by gas producers,
including undeveloped and contingent resources 38
Table 10 Breakdown of production forecast in southern fields, between existing and committed
projects and anticipated projects to 2022 (PJ) 38
Table 11 Impacts of considered risks and uncertainties on GPG demand between 2019 and 2023 48
Figures
Figure 1 Gas consumption actual and forecast, 2019-38, all sectors, Neutral scenario (PJ) 4
Figure 2 Projected eastern and south-eastern Australia gas production (export LNG and domestic),
2019-38; supply from existing projects and committed developments 7
Figure 3 Projected eastern and south-eastern Australia gas production (export LNG and domestic),
2019-38; supply from all available resources (including uncertain undeveloped projects) 8
Figure 4 Gas consumption actual and forecast, 2010-38, all sectors, Neutral scenario (petajoules [PJ]) 17
Figure 5 Gas consumption forecast in all scenarios, and compared to forecasts in 2018 GSOO (PJ) 19
Figure 6 Gas consumption actual and forecast, 2010-38, all sectors except LNG, Neutral scenario, for
north (left) and south (right) regions 20
Figure 7 Residential/commercial annual consumption actual and forecast, 2010-38, all scenarios, and
compared to 2018 GSOO 22
Figure 8 Industrial annual consumption actual and forecast, 2010-38, all scenarios, and compared to
2018 GSOO 23
Figure 9 Annual consumption actual and forecast for Manufacturing sector, 2017-38, all scenarios,
and compared to 2018 GSOO 24
Figure 10 Annual consumption actual and forecast of Other business sector, 2017-38, all scenarios, and
compared to 2018 GSOO 25
Figure 11 Wholesale eastern and south-eastern Australian gas prices averaged across all states,
2018-38 26
© AEMO 2019 | Gas Statement of Opportunities 11Figure 12 GPG annual consumption actual and forecast, 2010-38, all scenarios, and compared to
2018 GSOO 27
Figure 13 LNG annual consumption actual and forecast, 2010-38, all scenarios, and compared to
2018 GSOO 29
Figure 14 Reserves and resources reported in the 2018 GSOO and 2019 GSOO 34
Figure 15 Percentage change in reserve and resource quantities from northern and southern natural
gas reserves, 2019 GSOO compared to 2018 GSOO 35
Figure 16 Flows along the SWQP from 1 January 2016 to 31 December 2018 36
Figure 17 Gas producing basins and infrastructure supplying eastern and south-eastern Australia 37
Figure 18 Projected gas production, 2019-38 – supply from existing projects and committed
developments 41
Figure 19 Historical actual daily supply and demand balance in the southern states, 2018 41
Figure 20 Forecast daily supply and demand balance in the southern states including existing and
committed projects, 2025 42
Figure 21 Shortfalls forecast to 2030 in all scenarios if only existing projects and committed
developments are available 43
Figure 22 Shortfalls forecast if supply from anticipated southern projects is available, 2019-30A 44
Figure 23 Projected supply to meet demand in the southern states, considering existing, committed,
and anticipated gas projects, 2019-38 44
Figure 24 Projected gas production, 2019-38 – supply from all available resources (including
anticipated and uncertain projects) 45
Figure 25 Projected supply available to meet demand in the southern states, 2019-38 – supply from all
available resources (including anticipated and uncertain projects) 46
Figure 26 Shortfalls forecast where supply is from all available resources (including uncertain
undeveloped projects), 2019-38 47
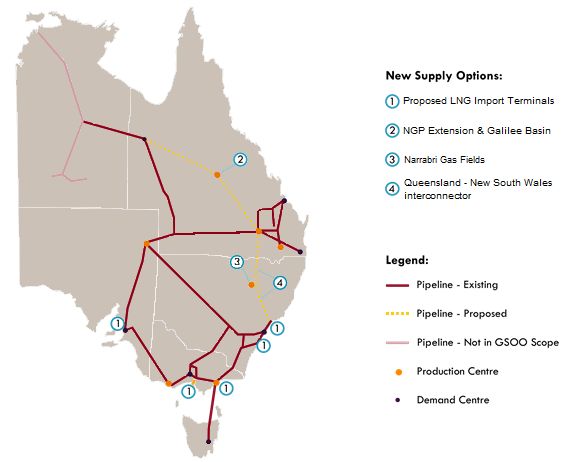
Figure 27 Potential new supply options 54
Figure 28 Forecast daily supply and demand balance in the southern states in 2025 with additional
supply from Melbourne LNG import terminal 55
Figure 29 Forecast daily supply and demand balance in the southern states in 2025 with additional
supply from the NGP upgrade and extension 57
Figure 30 Forecast daily supply and demand balance in the southern states in 2025 with additional
supply from the Narrabri project and further Queensland – New South Wales
interconnection 58
Figure 31 Forecast shortfalls of the new supply options, compared to the Neutral existing and
committed projects only shortfalls, 2019-30 59
Figure 32 Gas annual consumption forecast comparison, total for eastern and south-eastern Australia 60
Figure 33 Gas annual consumption forecast comparison, LNG 61
Figure 34 Gas annual consumption forecast comparison, residential/commercial 62
Figure 35 Gas annual consumption forecast comparison, industrial 62
Figure 36 Gas annual consumption forecast comparison, GPG 63
Figure 37 Gas monthly consumption forecast comparison, GPG, 2017-18 64
© AEMO 2019 | Gas Statement of Opportunities 121. Introduction
The 2019 Gas Statement of Opportunities (GSOO) assesses the adequacy of eastern
and south-eastern Australian gas markets to meet forecast domestic gas demand
while delivering expected export quantities to international markets, over a 20-year
outlook period.
The GSOO analyses a range of potential futures that may impact the gas market in the
next 20 years. It is focused on providing an adequacy assessment in the short to medium
term, and identifying longer-term development needs.
This report is based on information available to AEMO as of December 2018, although AEMO has
endeavoured to incorporate more recent information where practical.
Information on the demand and supply forecasting methodologies used for this GSOO is available on the
2019 GSOO webpage12.
1.1 Demand forecasts for eastern and south-eastern Australia
The GSOO provides updated forecasts of annual gas consumption and maximum daily demand, over a
20-year outlook period, for consumers in eastern and south-eastern Australia.
Chapter 2 summarises the forecasts and key demand drivers affecting forecast gas demand to 2038. Detailed
data is available on AEMO’s forecasting portal13. AEMO’s gas demand forecasting performance since 2014 is
summarised in Appendix A1.
1.2 The Australian Domestic Gas Security Mechanism
The Australian Domestic Gas Security Mechanism (ADGSM) was introduced by way of regulations14 which
empower the Federal Minister to impose liquefied natural gas (LNG) export restrictions in a ‘domestic shortfall
year’. That is, a calendar year where the Minister has reasonable grounds to believe that the export of LNG
would contribute to a lack of supply of natural gas for consumers and that there will not be a sufficient supply
unless exports are controlled. Guidelines15 made under those Regulations provide that, unless the Minister
determines that it is not necessary to consider whether a year is a domestic shortfall year, the Minister
commences the process between July and October by issuing a notification of his intention to consider
whether the following calendar year will be a domestic shortfall year, and consulting with a range of
stakeholders to seek their views.
The objective of the ADGSM is to ensure there is sufficient supply of natural gas to meet the forecast needs of
12
AEMO’s 2019 GSOO and supporting documents, and previous GSOOs, are available at https://www.aemo.com.au/Gas/National-planning-and-
forecasting/Gas-Statement-of-Opportunities.
13
Gas demand forecasts are available on the forecasting data portal http://forecasting.aemo.com.au/. Select ‘GSOO 2019’ from the publication drop-down.
14
Introduced in 2017 by way of the insertion of a new Division 6 in Part 3 of the Customs (Prohibited Exports) Regulations 1958.
15
Customs (Prohibited Exports) (Operation of the Australian Domestic Gas Security Mechanism) Guidelines 2017.
© AEMO 2019 | Gas Statement of Opportunities 13Australian consumers by requiring, if necessary, LNG projects which are drawing gas from the domestic
market to limit exports.
In 2018, the Federal Government decided not to apply export controls for the 2019 year following its
considerations under the ADGSM. However, a new Heads of Agreement16 was made between the Prime
Minister and the east coast LNG consortia under which they made commitments in relation to the domestic
supply of gas in 2019 and 2020 calendar years.
1.3 Scenarios
The demand and supply inputs for the 2019 GSOO present three alternative futures for gas supply and
demand in eastern and south-eastern Australia. These alternative futures are based on scenarios considering
different rates of change impacting Australia’s energy infrastructure, including Australia’s eastern and
south-eastern gas markets and the National Electricity Market (NEM).
The 2019 GSOO scenarios are a continuation of the themes and drivers considered in AEMO’s 2018 Integrated
System Plan (ISP)17, and include a holistic view of the pathway for energy market change as well as the
transformation of the physical infrastructure required in the NEM to support this change:
• The Neutral scenario reflects an energy system based around central estimates of all key drivers. This
scenario ultimately reflects a moderate rate of change in Australia’s energy sector. Drivers of energy
consumption growth are offset by deployment of distributed energy resources (DER) and increasing
energy efficiency advancements, while increasing energy prices are expected to play a role in stifling
growth. Significant capacities of ageing coal and gas generation assets require re-investment or
replacement over the longer term.
• The Fast change scenario is characterised by stronger domestic-led economic and population growth,
faster decarbonisation of stationary energy and transportation sectors, faster development of renewable
generation, and decentralisation.
– Importantly, economic growth in the Fast change scenario is primarily driven by growth in the services
sector rather than growth in commodities. Despite reasonable resilience to increasing energy costs in
recent years, there persists a degree of fragility to rising energy costs affecting Australia’s industrial
sector, particularly energy-intensive industries with exposure to competitors in mature and emerging
economies. A scenario with high commodity prices may lead to increases in gas price and resulting
demand destruction of energy-intensive industrials, which would weaken the growth forecast. This
represents a change relative to the 2018 scenarios, which considered that industrials’ energy cost
increases could be more successfully passed through to end consumers.
– AEMO no longer considers LNG export expansion, through debottlenecking of existing facilities and
development of an additional seventh export train, as a reasonable development in this scenario, given
alternative international supply opportunities and the relatively high cost of developing only one
additional train.
– Before implementing these changes, AEMO consulted broadly with the industry via a dedicated
workshop which, among other focus areas, reflected on the drivers that may increase gas
consumption. AEMO’s 2019 forecasts now show less difference between the Fast change scenario and
the Neutral scenario than was considered reasonable in 2018.
• The Slow change scenario is characterised by weaker domestic-led economic and population growth,
slower decarbonisation of stationary energy and transport sectors, and less decentralisation.
– This year AEMO has revised its assumptions regarding LNG minimum export levels, increasing
consideration of contractual commitments made by the LNG exporters. This has reduced the
16
See https://www.industry.gov.au/regulations-and-standards/australian-domestic-gas-security-mechanism.
17
AEMO, Integrated System Plan, July 2018, available at https://www.aemo.com.au/Electricity/National-Electricity-Market-NEM/Planning-and-
forecasting/Integrated-System-Plan.
© AEMO 2019 | Gas Statement of Opportunities 14bandwidth of uncertainty in the short to medium term as compared to the 2018 GSOO, particularly as
the size of the LNG sector dominates any other scenario-driven differences across sectors.
Table 3 below summarises key energy drivers considered across the three scenarios. Where appropriate, the
2019 GSOO also considers various sensitivities of these drivers, to further increase understanding and
materiality of key assumptions.
Table 3 Scenario drivers of most relevance to the gas market
Driver Slow change scenario Neutral scenario Fast change scenario
Population growth Low Medium High
Economy Weak global and domestic Neutral global and domestic Strong global and domestic
demand demand demand
Energy efficiency Weak energy efficiency Moderate energy efficiency Aggressive energy efficiency
measures adopted measures adopted measures adopted
Fuel switching Weak economic case for fuel Average economic case for Strong economic case for fuel
switching fuel switching switching
Gas price Low gas prices Medium gas prices Medium gas pricesA
Commodity price Low Medium Medium
Foreign Exchange Rate – Weak Medium Strong
AUD to USD
Large-scale renewable Medium Medium High
generation uptake
A. AEMO has identified that high gas prices may lead to price-driven demand destruction, particularly for vulnerable large industrial
loads.
The 2019 scenarios are based on different scenario narratives than the scenarios used in the 2018 planning
and forecasting publications. Therefore, the 2019 Fast change and 2018 Strong scenarios, and the 2019 Slow
change and 2018 Weak scenarios, may not be directly comparable, although the individual drivers that make
up the scenarios can be compared.
1.4 New approach to assessing gas supply adequacy
AEMO’s approach to projecting supply adequacy has changed this year, making a greater point of
acknowledging uncertainties associated with future development of 2P reserves and contingent resources,
and the exploration and development of prospective resources.
In the first instance, supply adequacy has been assessed based only on existing and committed supplies that
are projected to be developed with a high degree of certainty. This provides readers with clearer information
about where future investment is required to meet projected demand.
To allow 2019 GSOO forecasts to be directly comparable with the 2018 GSOO, supply adequacy has also been
projected assuming all identified 2P reserves and contingent and prospective resources are developed.
Esso’s decision not to proceed with its Dory project after failing to yield commercial quantities of gas
demonstrates the inherent uncertainty in forecasts of reserves and resources, and highlights the risk in
assuming uncertain reserves and resources will be developed when assessing supply adequacy.
This is discussed further in Section 4.3.
1.4.1 Northern and southern demand and supply
Parts of the analysis in this GSOO provide assessments of demand and supply across northern and southern
regions of Australia’s eastern and south-eastern gas markets.
The northern region includes:
© AEMO 2019 | Gas Statement of Opportunities 15• Demand for all Queensland consumers, including demand for liquefied natural gas (LNG) exported from Curtis Island. • All gas fields and basins in Queensland, as well as those Northern Territory fields likely to deliver gas to eastern and south-eastern markets. The southern region includes demand and supply sources located in New South Wales, South Australia, Victoria, and Tasmania, although there are no gas basins or fields in Tasmania that have been considered for this GSOO. © AEMO 2019 | Gas Statement of Opportunities 16
2. Demand forecasts

Demand for gas in eastern and south-eastern Australia has evolved in recent years, from
mainly serving domestic consumers, to now servicing a growing LNG export market.
Export LNG demand will continue to dominate forecast trends, representing approximately
70% of total annual gas consumption across the 20-year outlook.

The demand forecasts for this year’s GSOO continue to show modest growth in gas
exports, as well as risks and uncertainties around future gas to produce electricity.

2.1                Eastern and south-eastern demand forecast trends
Figure 4 shows the 20-year total demand forecast for eastern and south-eastern gas markets under the
Neutral scenario, and the breakdown of the forecasts by consumer types.

Figure 4         Gas consumption actual and forecast, 2010-38, all sectors, Neutral scenario (petajoules [PJ])
        2,250

        2,000

        1,750

        1,500

        1,250
PJ

        1,000

          750

          500

          250

            0

                            Industrial           Residential / Commercial               GPG             LNG             GSOO 2018

Data files and further figures for the 2019 GSOO are available on the AEMO Forecasting data portal18.

18
     Demand forecasts are available on the forecasting data portal at http://forecasting.aemo.com.au/. Select ‘GSOO 2019’ from the publication drop-down.

© AEMO 2019 | Gas Statement of Opportunities                                                                                                                17
Key insights
• The Neutral gas consumption forecasts feature:
– Moderate growth in the short term (2019-24) from 1,905 petajoules (PJ) to 2,017 PJ, reflecting
modest growth in expected LNG exports and relative stability in residential, commercial, and
industrial demand, offsetting reductions from gas-powered generation (GPG).
– Slower growth in the medium term (2025-29), increasing to 2,068 PJ, mainly due to increased GPG
demand, with relative stability in the other sectors. LNG exports are no longer expected to reach
full production capacity.
– In the long term (2030-38), consumption continuing to grow slowly to 2,158 PJ, with increased GPG
output continuing to drive the majority of this growth.
• The magnitude of potential pathways for GPG represents the largest uncertainty in the forecast, as this
will depend directly on the level of electricity consumption in the NEM, the reliability of coal-fired
generation and timing of retirements, and future renewable generation developments.
Comparison of 2019 GSOO and 2018 GSOO Neutral gas demand forecasts
The difference in demand forecasts across the 2018 GSOO and the 2019 GSOO is shown in Table 4 (for
forecasts of the 2020 calendar year) and Figure 5 (for the 20-year outlook). The key points are:
• Less actual gas was consumed in 2018 than 2017, primarily due to decreased NEM GPG consumption,
which dropped from 184 PJ in 2017 to 130 PJ in 2018 (see Section 2.2.3 for more information).
• In the short term (2019-24), the 2019 Neutral forecast is very similar to the 2018 forecast, as AEMO
continues to forecast lower consumption from GPG due to higher forecast penetration of renewable
electricity generation in the NEM. Refer to Section 4.4 for a detailed discussion on forecast uncertainties
for GPG.
• In the medium term (2025-29), the Neutral forecast is slightly lower than the 2018 forecast. This is mainly
due to a revised LNG forecast of reduced incentive to increase production to capitalise on further spot
market opportunities during this period.
• In the long term (2030-38), AEMO’s updated forecasts continue the outlook for growth in the Neutral
scenario, as more coal-fired generation is expected to retire, resulting in projected GPG consumption
increases, projected growth in the residential and commercial sector, and relative stability in the
industrial sector.
Table 4 Comparison of 2018 GSOO and 2019 GSOO Neutral gas consumption forecasts for 2020 (PJ)
Sector 2019 GSOO 2018 GSOO Change
Residential, commercial, and industrial 448.0 445.6 + 2.4
GPG 71.9 65.9 +6
LNG 1,382.4 1,371.9 + 10.5
Losses 16.5 16.4 + 0.1
Total 1,918.8 1,899.8 + 19
Comparison of 2019 GSOO and 2018 GSOO Fast change and Slow change forecasts
The 2019 Fast change and Slow change scenarios are based on different scenario narratives than the 2018
Strong and Weak scenarios, meaning that the 2019 Fast change and 2018 Strong scenarios, and the 2019 Slow
change and 2018 Weak scenarios, may not be directly comparable although the individual drivers that make
up the scenarios can be compared.
© AEMO 2019 | Gas Statement of Opportunities 18At a high level, the most obvious difference is that the dispersion between scenarios is now much narrower, with little forecast upside for gas demand above Neutral projections. This is primarily due to: • Revised assumptions to increase consideration of LNG minimum contracted quantities (MCQ) in all scenarios, • Consideration that LNG export facility expansion to deliver a seventh export train is no longer a plausible outcome for inclusion in any scenario; and • A projected stronger role for energy storage to complement intermittent renewable energy, based on updated technology cost assumptions. The strongest effect relative to 2018 is captured in the Fast change scenario, with much lower GPG forecast in response. Figure 5 Gas consumption forecast in all scenarios, and compared to forecasts in 2018 GSOO (PJ) Note: 2019 scenarios are not directly comparable to 2018 scenarios due to changes in scenario formulation. 2.2 Consumption forecasts by sector and region Gas is used in different ways across Australia. For example, in Victoria, gas consumption is dominated by the residential/commercial sector with heating representing a significant usage proportion, but in Queensland, this sector has a very small proportion of regional gas consumption, with markedly less gas used for heating. Table 5 shows the breakdown of gas consumption in 2018 for each region by sector. © AEMO 2019 | Gas Statement of Opportunities 19
Table 5          Percentage splits of gas consumption by sector (not including UAFGA), 2018

     Regional                       Residential /            Industrial             GPG                     LNG                     Regional gas
                                    commercial                                                                                      consumptionB

     Queensland                     < 1%                     7%                     2%                      90%                     1,380 PJ

     New South Wales                42%                      48%                    10%                     0%                      116 PJ

     South Australia                12%                      27%                    62%                     0%                      93 PJ

     Tasmania                       8%                       51%                    41%                     0%                      10 PJ

     Victoria                       58%                      31%                    11%                     0%                      212 PJ

     Total                          10%                      14%                    7%                      68%                     1,811 PJ

A. UAFG, or Unaccounted for Gas, refers to metered gas that enters the gas network but that does not reach consumers.
B. Consumption totals are based on metered load for the full 2018 calendar year, except for:
  • Transmission-connected industrial consumers, based on survey (estimated for October-December 2018).
  • GPG, based on estimated gas usage for each plant’s metered electricity generation into the NEM.

Figure 6 shows the gas consumption forecast across northern (Queensland 19) and southern (Victoria/New
South Wales/South Australia/Tasmania) regions, and demonstrates the diversity of each consumer sector
across geographic boundaries.

Figure 6         Gas consumption actual and forecast, 2010-38, all sectors except LNG, Neutral scenario, for north
                 (left) and south (right) regions

          600
                                         North                                                                       South
          500

          400

          300
     PJ

          200

          100

             0

                   Industrial     Residential / Commercial        GPG
                                          Industrial         Residential / Commercial                 GPG

19
     For the purposes of forecasting demand, the 'northern region' includes only Queensland consumers. The Northern Gas Pipeline (NGP) has provided access
     for Northern Territory producers to export additional gas to Queensland, thus when considering supply available to meet eastern and south-eastern
     Australian demand, the 'northern region' includes this Northern Territory supply.

© AEMO 2019 | Gas Statement of Opportunities                                                                                                           20
2.2.1 Residential and commercial consumption
Key insights
• Residential and commercial sector gas consumption is projected to grow from 190 PJ in 2018 to 201 PJ
in 2038, with much of this growth forecast in the short term (2019-24). This forecast by 2038 is
approximately 17 PJ higher than projected in the 2018 GSOO, reflecting both:
– A higher forecast of new dwellings connecting to the gas network.
– A higher expected average usage for new dwellings. Compared to metro regions, proportionally
more new connections in greenfield areas are houses rather than multi-story apartments, requiring
larger space conditioning requirements.
• In the medium to long term (2025-38), this growth is forecast to be partly offset by forecast reductions
from increasing impacts of expected energy efficiency measures, fuel switching, and price response.
• Despite the increased number of forecast gas connections, residential consumption still represents less
than 10% of eastern and south-eastern Australia gas demand through the 20-year outlook period.
AEMO developed residential and commercial forecasts using forward estimates of consumption on a per
connection basis. The type and forecast number of new connections therefore drives the growth trajectory,
subject to other behavioural influences, such as in response to pricing stimuli, appliance fuel switching, and
broader energy efficiency impacts.
Table 6 below summarises the estimated impact of changes in key drivers on the residential gas demand
forecasts, compared to the 2018 GSOO forecast.
Table 6 Estimated impact on forecasts due to changes to residential and commercial drivers
Driver Estimated Explanation
impact on
forecasts by
2038 (PJ)
Increase in population +9 The new gas connection forecasts reflect higher population forecasts in the
forecasts November 2018 Australian Bureau of Statistics (ABS) updated forecast. In the
Neutral scenario, approximately 150,000 additional new gas connections by
2038 are now modelled, compared to the 2018 GSOO.
Consumer trends +21 Updated analysis of historical residential meter data shows that recent demand
growth in regional greenfield areas has largely offset the long-term reductions
observed in metropolitan areas, when averaged on a per connection level.
Reflecting this update of the mix in consumer base, the Neutral scenario
forecast (for this component) has increased by about 21 PJ in 2038, compared
to the 2018 GSOO forecast.
Energy efficiency, fuel -13 AEMO has identified an increased risk of demand reductions of approximately
switching and price 13 PJ in the Neutral scenario compared to the 2018 GSOO, reflecting price and
response consumer behaviour influences (see discussion below table).
Net impact on +17
residential forecasts
Details of factors reducing projected consumption, that have been updated in the 2019 GSOO, are:
• Energy efficiency impacts – these are linked to current or planned energy efficiency schemes, as forecast
for AEMO by Strategy.Policy.Research20. The Neutral scenario impact is similar to the 2018 GSOO at the
20
Strategy.Policy.Research, Energy Efficiency Impacts on Electricity and Gas Demand to 2037-38, June 2018, available at https://www.aemo.com.au/-/media/
Files/Electricity/NEM/Planning_and_Forecasting/NEM_ESOO/2018/Energy-Efficiency-Impacts-on-Electricity-and-Gas-Demand-to-2037-38-by-Strategy-
Policy-Research.pdf.
© AEMO 2019 | Gas Statement of Opportunities 21end of the forecast horizon, although there are year-on-year timing differences between the forecasts.
The main areas of increasing energy efficiency are gas heaters, insulation, and instant gas hot water.
• Electric to gas fuel-switching – the potential has increased approximately 2 PJ, with some schemes
encouraging switching from electricity to gas appliances. The larger expectation continues to be that
appliance-driven fuel-switching from gas to electricity, particularly affecting space heating and water
heating appliances, will have a higher impact on residential consumption compared to other sectors.
• Higher gas prices are forecast to lower overall consumption by approximately 4 PJ per annum by 2038 for
the Neutral scenario, relative to the 2018 forecasts.
Figure 7 shows the higher overall trend in forecast residential/commercial gas consumption for all scenarios
compared to the 2018 GSOO demand forecast, particularly due to the higher forecast connections.
Figure 7 Residential/commercial annual consumption actual and forecast, 2010-38, all scenarios, and
compared to 2018 GSOO
250
200
150
PJ
100
50
0
2022
2025
2026
2029
2030
2033
2034
2035
2038
2020
2023
2024
2027
2028
2032
2036
2037
2021
2031
2012
2013
2016
2010
2014
2015
2017
2018
2019
2011
GSOO 2019 - Neutral GSOO 2019 - Fast Change GSOO 2019 - Slow Change
GSOO 2018 - Neutral GSOO 2018 - Strong GSOO 2018 - Weak
Actual
Note: 2019 scenarios are not directly comparable to 2018 scenarios due to changes in scenario formulation.
2.2.2 Industrial consumption
Key insights
• Minimal change in industrial consumption is forecast in the Neutral scenario over the 20-year outlook,
with total industrial consumption projected to be 262 PJ in 2038 compared to 263 PJ in 2018.
– Minor variations in trends are projected by state, with less industrial demand in Queensland and
more in South Australia in the near term, but the net impact of these variations is minimal.
• The Slow change scenario forecasts a degree of decline in the short to medium-term (2019-29),
reflecting the perceived increased vulnerability for some industrial loads and risks of closures due to a
mild economic outlook.
• The manufacturing sector is projected to be relatively flat, while other industrial businesses
(dominated by the services sector) are projected to grow moderately over the 20 years, mostly due to
increasing economic activity in the services sector.
© AEMO 2019 | Gas Statement of Opportunities 22AEMO forecasts the consumption of industrial sector sub-sectors, for:
1. The Manufacturing sector, which is typically more energy-intensive, and
2. ‘Other business’ sectors.
The underlying drivers affecting these two sectors are discussed separately below.
Figure 8 shows the overall trend in forecast industrial gas consumption for the three scenarios compared to
the 2018 GSOO demand forecast.
Figure 8 Industrial annual consumption actual and forecast, 2010-38, all scenarios, and compared to
2018 GSOO
350
300
250
200
PJ
150
100
50
0
2020
2023
2026
2029
2030
2033
2036
2022
2024
2027
2025
2028
2032
2034
2037
2035
2038
2021
2031
2010
2011
2013
2014
2016
2019
2012
2015
2017
2018
GSOO 2019 - Neutral GSOO 2019 - Fast Change GSOO 2019 - Slow Change
GSOO 2018 - Neutral GSOO 2018 - Strong GSOO 2018 - Weak
Actual
Note: 2019 scenarios are not directly comparable to 2018 scenarios due to changes in scenario formulation.
Comparison between scenarios shows more downside risk associated with the potential closure of large
industrial loads and declining production due to weakening global and domestic demand in the Slow change
scenario, compared with the Neutral.
As discussed in Section 1.3, the Fast change scenario deliberately avoids scenario drivers that may increase
commodity prices above the Neutral scenario. Strong commodity prices may drive up gas prices, potentially
leading to large industrial load closures, which may reduce gas consumption in the Fast change scenario to
below the Neutral scenario. Based on surveys conducted with industry, anecdotal evidence suggests that
more industrial gas users would suffer from higher energy costs than would benefit from stronger commodity
prices. As such, AEMO considers the greatest driver for gas consumption growth is a future which involves
greater economic transformation to a services-based economy, given the perceived fragility of many large
industrials to pricing risks. This is different to the 2018 GSOO.
Industry feedback suggests there is little incentive currently for major new investments to large industrials
users. Therefore, the upside consumption uncertainty is a lot smaller than the downside uncertainty, where
industrial loads may close due to milder21 economic outlook conditions.
While consumption is forecast to be relatively flat in the Neutral scenario, variations are possible across
regions, particularly given the different types of manufacturing and industrial processes across eastern and
south-eastern gas markets.
21
The Slow change scenario does not reflect recessionary conditions as economic growth remains positive, but mild.
© AEMO 2019 | Gas Statement of Opportunities 23You can also read