Victorian Gas Planning Report Update - Gas Transmission Network Planning for Victoria - AEMO
←
→
Page content transcription
If your browser does not render page correctly, please read the page content below

Victorian
Gas
Planning
Report
Update
March 2020

Gas Transmission Network Planning for Victoria
Important notice

PURPOSE
AEMO publishes this Victorian Gas Planning Report Update in accordance with rule 323 of the National Gas
Rules. This publication is based on information available to AEMO at 31 January 2020, although AEMO has
endeavoured to incorporate more recent information where practicable.

DISCLAIMER
AEMO has made every reasonable effort to ensure the quality of the information in this publication but
cannot guarantee that information, forecasts and assumptions are accurate, complete or appropriate for your
circumstances. This publication does not include all of the information that an investor, participant or
potential participant in the Declared Wholesale Gas Market (DWGM) might require and does not amount to a
recommendation of any investment.
Anyone proposing to use the information in this publication (which includes information and forecasts from
third parties) should independently verify its accuracy, completeness and suitability for purpose, and obtain
independent and specific advice from appropriate experts.
Accordingly, to the maximum extent permitted by law, AEMO and its officers, employees and consultants
involved in the preparation of this publication:
 • make no representation or warranty, express or implied, as to the currency, accuracy, reliability or
   completeness of the information in this publication; and
 • are not liable (whether by reason of negligence or otherwise) for any statements, opinions, information
   or other matters contained in or derived from this publication, or any omissions from it, or in respect of
   a person’s use of the information in this publication.

ACKNOWLEDGEMENT
AEMO acknowledges the support, co-operation and contribution of all participants in providing data and
information used in this publication.

VERSION CONTROL
 Version        Release date             Changes

 1              March 2020               Initial release

© 2020 Australian Energy Market Operator Limited. The material in this publication may be used in
accordance with the copyright permissions on AEMO’s website.
Executive summary

The 2020 Victorian Gas Planning Report Update (VGPR Update) provides information about changes in the
supply-demand balance over the next five years (2020-24, called the outlook period) and the Victorian
Declared Transmission System (DTS), since AEMO published the 2019 VGPR in March 2019 1.
The 2020 VGPR Update complements AEMO’s 2020 Gas Statement of Opportunities (GSOO)2, which assesses
wider gas supply adequacy in eastern and south-eastern Australia to 2039.

     The 2020 VGPR Update highlights that:
     • Committed annual gas supply forecasts provided to AEMO by Victorian gas producers have increased
       by approximately 10% for 2020-23 compared to the 2019 VGPR, due to some anticipated projects
       progressing into committed projects. Despite the near-term increase in forecasts, committed supply is
       forecast to reduce by 37% from 2022 to 2024 due to field decline. Without additional gas supply,
       removal of pipeline constraints, or a liquefied natural gas (LNG) import terminal, gas supply
       restrictions and curtailment may be necessary from 2024.
     • While the peak day supply forecasts provided to AEMO by gas producers have increased slightly for
       2022 and 2023 since the publication of the 2019 VGPR, there is a significant reduction in 2024 due to a
       key Gippsland gas field and several smaller gas fields being forecast to cease production sometime
       between mid-2023 and mid-2024.
     • The forecast Victorian supply shortfall for a 1-in-2 year peak system demand day during winter 2024 is
       27 terajoules (TJ), while the forecast shortfall on a 1-in-20 year peak day is 153 TJ. System demand
       does not include gas for gas-powered generation (GPG) of electricity, which peaked at 242 TJ a day
       (TJ/d) during winter 2019.
     • There are several anticipated projects (projects considered reasonably likely to proceed during the
       outlook period) which could improve the annual supply balance. The majority of these projects are
       located in the Otway Basin, which would be constrained by the capacity of the South West Pipeline
       (SWP), hence forecast peak day supply issues would not be resolved without an expansion of the SWP.
     • Resolving forecast peak day shortfalls will require the progression of potential projects (currently not
       considered likely to proceed during the outlook period), the expansion of pipelines for importing
       additional gas supply, or an LNG import terminal.
     • The Victorian gas supply adequacy forecasts are becoming increasingly uncertain:
          – It is difficult to determine precisely when gas fields will cease producing, which creates some risks
            to supply for 2023 and 2024. If the fields cease production earlier than forecast, then there are risks
            to the security of supply during 2023.
          – There has been a substantial drop in international LNG spot prices. While eastern Australia exports
            few spot cargoes, there may be impacts due to oil-linked LNG contracts and further reductions in
            international LNG demand with the spread of the coronavirus (COVID-19).

1
    The 2019 VGPR forecast supply and demand, and pipeline capacity adequacy, for the outlook period 2019-23.
2
    At https://www.aemo.com.au/energy-systems/gas/gas-forecasting-and-planning/gas-statement-of-opportunities-gsoo.

© AEMO 2020 | Victorian Gas Planning Report Update                                                                    3
○ In the short term, low international LNG prices are likely to increase supply from Queensland
                into the domestic market, potentially reducing Victorian production down to minimum
                contracted levels and extending the life of fields.
              ○ In the long term, lower international prices may suppress exploration and development
                expenditure, reducing the longer-term supply outlook.
          – This supply uncertainty is exacerbated by demand uncertainty. Fluctuating gas prices, uncertainties
            around renewable energy output, coal generation outages or closures, and the timing of proposed
            investments in new generation and electricity transmission could all materially impact GPG
            consumption.
          – The Victorian Government has lifted the ban on onshore conventional gas exploration and
            development from July 2021, although the timing of any new supply and the quantities of gas that
            may become available are still unclear.

Actual demand and consumption trend
Annual Victorian gas consumption 3 continues to be relatively constant at approximately 200 petajoules (PJ)
per year since 2014, as shown in Table 1. GPG consumption increased significantly in 2019 to support
electricity demand during a high number of unplanned coal-fired generation outages. GPG consumption has
increased since the March 2017 closure of the Hazelwood Power Station, with demand peaking during
periods of high demand and reduced variable renewable generation in the National Electricity Market (NEM).
The 2019 DTS peak demand day occurred on Friday 9 August 2019. The total demand 4 on this day of 1,308 TJ
comprised 1,199 TJ of system demand and 109 TJ of GPG demand. This was the highest demand day on
record for the Victorian DTS.

Table 1          Annual gas consumption and peak gas total demand, 2014-19

                                                         2014             2015             2016             2017             2018              2019
    DTS system consumption (PJ)                                    191              205              200              203              194             197
    DTS GPG consumption (PJ)                                         4                3                3               15                 10            20
    Victorian non-DTS consumption            (PJ)A                  22               10                8               23                 16            16
    Total Victorian consumption (PJ)                               217              218              211              241              220             233
    Annual cumulative        EDDB                                1,163            1,472            1,331            1,447            1,372            1,432
    Actual DTS peak total demand (TJ/d)                          1,214             1,179            1,187           1,279            1,132            1,308
A. Non-DTS consumption is predominantly gas use at the Mortlake and Bairnsdale power stations.
B. EDD (effective degree days) is a measure of coldness. The higher the EDD, the more gas is typically used for heating.

Forecast annual production
Figure 1 shows forecast and actual annual production, with additional information provided in Table 2. Actual
production was slightly lower in 2019 than in 2018 and was close to the 2019 VGPR forecast.
Forecast production has increased from the 2019 VGPR due to most of the anticipated supply projects
reaching Financial Investment Decision (FID) stage (this is a trigger for inclusion in the committed production
forecast). This is consistent with the findings in the Australian Competition and Consumer Commission (ACCC)
Gas Inquiry January 2020 interim report5.
A steep decline in production is projected towards the end of the outlook period, with total committed
Victorian production reducing from 318 PJ in 2022 to 201 PJ in 2024. This is due to a key Gippsland gas field

3
    Demand refers to capacity or gas flow on an hourly or daily basis. Consumption refers to gas usage over a monthly or annual period.
4
    Total demand is equal to the sum of system demand (which is residential, commercial, and industrial gas use) plus GPG, but excludes exports.
5
    At https://www.accc.gov.au/system/files/Gas%20inquiry%20January%202020%20interim%20report.pdf.

© AEMO 2020 | Victorian Gas Planning Report Update                                                                                                            4
and several smaller Gippsland fields being forecast to cease production sometime between mid-2023 and
  mid-2024. All Otway Basin gas fields are also forecast to cease production during the outlook period unless
  anticipated gas field development and plant modification projects proceed. If all the anticipated Otway Basin
  projects proceed, gas production in the Port Campbell region would remain at 2019 levels through to 2024.

  Figure 1                       Annual Victorian production (PJ per year) and 2019 VGPR vs. 2020 VGPR Update forecasts
                           500
                           450
                           400
Annual production (PJ/y)

                           350
                           300
                           250
                           200
                           150
                           100
                            50
                             0
                                 2016     2017     2018      2019              2020                  2021             2022           2023               2024
                                        2019 VGPR Committed Supply                                       2019 VGPR Anticipated Supply
                                        2020 VGPR Committed Supply                                       2020 VGPR Anticipated Supply
                                        Production Actuals                                               2020 VGPR Forecast Victorian Consumption
                                        Actual Victorian Consumption

  Gas reserves and their production profiles are always subject to some uncertainty, with field owners bringing
  differing assumptions and perspectives to their estimates. This in turn creates uncertainty and risk in
  forecasting supply adequacy. Gas fields’ remaining life could extend well past their forecast depletion date, as
  the Minerva gas field did6, or could deplete earlier than forecast, as one of the large original Gippsland Basin
  fields processed by the Longford Gas Plant did7.

  Table 2                        Forecast Victorian annual consumption and production supply, 2020-24, with 2019 actuals (PJ)

                                                                2019 (actual)         2020               2021         2022          2023            2024
            DTS system consumption                                            197              197              196          196            195                195
            DTS GPG consumption                                                20                8                5            5               6                 8
            Victorian non-DTS consumption                                       16              11                7            7               6                 5
            Total Victorian consumption                                       233              216              209          208            207                208
            Total available Victorian production                              343             361               333          318            260                201
            Surplus / shortfall quantity                                      111             145               124          111             54                 -7
            Anticipated supply projects                                                         10               54           56             101                88
  Note: totals may not add up due to rounding.

  The coronavirus (COVID-19) is causing disruptions to the global LNG market 8. Depending on the extent and
  duration of the virus-induced downturn, this may reduce global LNG demand and impact LNG exports from

  6
          BHP, “BHP Operational Review for the quarter ended 30 September 2019”, 17 October 2019, at https://www.bhp.com/-/media/documents/media/reports-
           and-presentations/2019/191017_bhpoperationalreviewforthequarterended30september2019.pdf?la=en.
  7
          ACCC, 2017-2020 Gas Inquiry: Interim report, p. 30, at https://www.accc.gov.au/publications.
  8
          Reuters, “Global LNG-Asian LNG prices fall to $2.70/mmBtu amid coronavirus outbreak”, 14 February 2020, at https://www.reuters.com/article/global-
           lng/global-lng-asian-lng-prices-fall-to-2-70-mmbtu-amid-coronavirus-outbreak-idUSL4N2AE2BM.

  © AEMO 2020 | Victorian Gas Planning Report Update                                                                                                                 5
Queensland, as well as reduce domestic demand. The Queensland producers may then choose to sell
additional gas into the domestic market while global LNG demand is reduced, which would reduce the
amount of Victorian gas supplied to New South Wales and South Australia, potentially reducing Victorian
production down to minimum contracted levels. These potential impacts were not modelled in the 2020
GSOO or this 2020 VGPR Update.
Forecast annual supply adequacy
AEMO highlighted declining Victorian production in the 2018 VGPR Update, which forecast shortfalls in 2022
without commitment to additional gas supply projects. The 2019 VGPR forecast improved annual supply with
several projects reaching FID, but a tight peak day supply-demand balance was forecast in 2023.
A shortfall in meeting annual Victorian gas consumption is now forecast from 2024 without additional gas
supply. If the Victorian gas fields deplete earlier than forecast, there is a risk of an annual supply shortfall in
2023, with shortfalls most likely to occur on winter peak days.
Anticipated (that is, not committed) Victorian production projects could increase 2024 production from 201 PJ
to 289 PJ. Some anticipated projects noted in previous VGPRs have transitioned into committed projects,
however this typically only occurs within the first two years of the outlook period. This can be seen in Figure 1,
where the 2019 VGPR committed plus anticipated supply forecast for 2020 equals the new 2020 VGPR
committed supply forecast. This means supply adequacy for 2023-24 may be uncertain for another couple of
years.
While Victoria is forecast to have enough production to supply all forecast Victorian demand on an annual
basis from 2020 to 2023, the supply-demand balance is tightening. Winter monthly gas consumption in
Victoria is up to three times (typically 25-30 PJ/month) summer monthly gas consumption (of approximately
10 PJ/month). This is expected to result in:
• A tight winter gas supply-demand balance in Victoria.
• Increased reliance on the Iona Underground Storage (UGS) facility in 2023.
• Reduced gas available for export to New South Wales and South Australia on peak days, making these
regions more reliant on Queensland gas supplies towards the end of the outlook period. Without supply
from Victoria, supply to these states would be limited by the capacity of the South West Queensland
Pipeline, and the Moomba to Sydney and the Moomba to Adelaide pipelines. The impacts of reduced
Victorian supplies for these states, including supporting GPG demand and pipeline transportation capacity
limitations, are explored in the 2020 GSOO.
Forecast GPG consumption
DTS-connected GPG consumption is forecast to decline from 20 PJ in 2019 to 8 PJ in 2020, and to stay
relatively flat around this level to 2024 (see Table 2), due to the increased amount of renewable generation
that is forecast to be commissioned during the outlook period to meet the Victorian Renewable Energy
Target (VRET).
There is, however, forecasting uncertainty for GPG. Factors that could increase GPG consumption include:
• Coal-fired generators operating with lower than forecast reliability (more outages).
• Coal-fired generators closing earlier than forecast.
• Weather patterns that result in lower than forecast solar or wind generation.
• Delays in the connection or commissioning of new renewable generation.
• Delays in electricity transmission investments noted in AEMO’s Draft 2020 Integrated System Plan (ISP)9.
• Lower than forecast gas prices.
9
See p. 11-14, at https://aemo.com.au/-/media/files/electricity/nem/planning_and_forecasting/isp/2019/draft-2020-integrated-system-plan.pdf?la=en.
© AEMO 2020 | Victorian Gas Planning Report Update 6If GPG consumption is higher than forecast, this would increase the risk of a supply shortfall towards the end
of the outlook period.
Forecast peak day supply
Gas producers have advised that the total daily Victorian production capacity will reduce from 1,214 TJ/d in
2020 to 631 TJ/d in 2024, driven mainly by a decrease in Gippsland peak day supply capacity. The production
decline is accentuated in the peak day supply forecast, because an increasing number of the remaining fields
are only able to produce gas at a constant rate 10.
Peak day supply adequacy
Forecast peak day supply has increased compared to the 2019 VGPR, while forecast 1-in-2 and 1-in-20 year
peak day demand forecasts have reduced slightly. The significant change is that forecast data for 2024 (not
included in the 2019 VGPR outlook period), which is shown in Figure 2, highlights that without additional gas
supply, gas supply restrictions and curtailment are likely in 2024.
The large reduction in 2024 is due to several fields being forecast to cease production across 2023 and 2024.
This includes advice from Esso Australia Resources that another of the key Gippsland Basin fields (processed
by the Longford Gas Plant) is forecast to cease production during this period. If offshore fields deplete earlier
than forecast, there is a risk of insufficient peak day supply and the curtailment of GPG during winter 2023.
In winter 2023 and 2024, there will be an increased reliance on gas storage to meet winter demand. This
increases the risk of the storage inventory being depleted if it is not carefully managed, or if there is an
unexpected gas supply reduction or if GPG consumption is higher than forecast.
Figure 2 Actual and forecast peak day supply capacity (including pipeline constraints) by location, and
peak day demand, 2013-24 (TJ/d)
1,800
1,600
1,400
Supply capacity (TJ/d)
1,200
1,000
800
600
400
200
0
2013 2014 2015 2016 2017 2018 2019 2020 2021 2022 2023 2024
Gippsland Peak Day Supply Actuals Gippsland Peak Day Supply Forecast
Port Campbell Peak Day Supply Actuals Port Campbell Peak Day Supply Forecast
Dandenong LNG Actuals Dandenong LNG Forecast
Prospective Victorian Supply Projects Actual Peak Day Total Demand
Forecast 1-in-2 Year System Demand Forecast 1-in-20 Year System Demand
10
BHP media release, “Longford Gas Conditioning Plant Project Approval”, 13 December 2012, at https://www.bhp.com/media-and-insights/newsreleases/
2012/12/longford-gas-conditioning-plant-project-approval.
© AEMO 2020 | Victorian Gas Planning Report Update 7The Western Outer Ring Main (WORM) is a planned augmentation of the DTS that will increase the Iona UGS
refilling capacity and increase the capacity of the SWP to support peak day demand.
In December 2019, the Victorian Government determined that an Environmental Effects Statement (EES) will
be required for the WORM project11. AEMO has assumed a delay from asset owner APA Group’s target
mid-2021 completion date12, and that the WORM will not be available until mid-2022. Delays beyond this date
will increase the risk of depleting Iona storage levels and reduce the available peak day supply capacity,
further tightening the supply-demand balance.
Table 3 summarises forecast DTS supply adequacy under 1-in-2 and 1-in-20 peak day system demand
forecasts13. This does not include DTS GPG demand, which peaked at 242 TJ/d during winter 2019.
Table 3 Forecast DTS peak day supply adequacy excluding GPG, 2020-24 (TJ/d)
2020 2021 2022 2023 2024
Total supply capacity (including Victorian LNG) 1,781 1,746 1,703 1,576 1,238
DTS available supply including pipeline constraints 1,508 1,457 1,442 1,431 1,093
1-in-2 peak DTS system demand 1,136 1,136 1,135 1,131 1,131
Surplus/shortfall quantity on 1-in-2 peak day 372 321 306 327 -27
1-in-20 peak DTS system demand 1,249 1,252 1,252 1,245 1,246
Surplus/shortfall quantity on 1-in-20 peak day 259 205 190 185 -153
Anticipated supply projects including constraints 73 82 82 87
Note: totals may not add up due to rounding. DTS peak day demand in this table is slightly lower than the 2020 GSOO Victorian peak
day demand forecast, due to non-DTS Victorian gas demand.
Additional supply options within the outlook period
The production forecasts in this report only include projects that are currently producing or those that have
committed timeframes for development. New supplies from currently uncommitted projects can still be
brought into production during this five-year period and change the supply adequacy outlook.
AEMO has been advised by producers that a number of projects are currently being investigated that could
improve the forecast annual supply; however none of these projects could resolve the peak day supply issues,
due to either the relatively flat production profiles available from these projects, or SWP capacity constraints.
Resolving the forecast peak day shortfall will require one of the following options:
• An LNG import terminal:
– AGL has proposed the development of a floating LNG import terminal at Crib Point, near Hastings.
AGL continues to progress the EES process, with an outcome expected in mid-2020.
– AIE’s proposed floating LNG import terminal at Port Kembla in Wollongong in New South Wales could
provide peak day supply capacity into Victoria, if subsequent projects facilitated southbound flows on
the Eastern Gas Pipeline and expanded the VicHub connection into the DTS.
11
Victoria Land, Water and Planning, “Reasons for decision under Environment Effects Act 1978”, 22 December, at https://www.planning.vic.gov.au/__data/
assets/pdf_file/0039/446979/Reasons-for-Decision.pdf.
12
APA, “Western Outer Ring Main Pipeline”, December 2019, at https://www.apa.com.au/globalassets/documents/our-current-projects/worm/worm_a3_
update-01.pdf.
13
A 1 in-2 forecast means the forecast is expected to be exceeded, on average, one year in every two, and represents demand in average weather
conditions. A 1-in-20 forecast means the forecast is expected to be exceeded, on average, one year in every 20 years, and represents extreme weather
conditions.
© AEMO 2020 | Victorian Gas Planning Report Update 8– Esso is no longer progressing plans for an import terminal at Longford 14, however, other new parties
have contacted AEMO and expressed interest in the feasibility of an import terminal.
• One of the following pipeline expansions for importing additional gas supply:
– Increase in the SWP capacity (beyond the capacity increase provided by the WORM) to utilise the
anticipated and potential projects proposed in the Port Campbell region.
– Increase in the pipeline capacity between Wallumbilla and Culcairn (via Moomba), or the construction
of a new pipeline to increase the supply capacity from Queensland.
• A combination of projects, which would need to include some additional pipeline capacity along with
additional gas storage capacity such as the Golden Beach gas storage project 15.
The Victorian Gas Program has assessed the potential for onshore conventional gas in Victoria and
determined that the moratorium on conventional exploration and development should cease on 1 July 2021.
The report concluded that the prospective resource estimate for onshore Victoria ranges from 128 PJ to
830 PJ, with the most likely estimate (P50) of 547 PJ. Prospective resources16 are quantities of gas that are
estimated to be potentially recoverable from undiscovered accumulations identified on the basis of indirect
evidence, but exploration wells have not yet been drilled.
The Victorian Gas Program Progress Report No. 417 noted that: “The additional 128-830 petajoules of gas that
could be produced in the state would contribute to gas supply but would not meet Victoria’s forecasted
shortfalls. The additional gas would improve energy security by increasing the diversity of gas supply. It would
also benefit industrial users, particularly in regional areas, by providing new options for local gas supplies”.
AEMO will continue to monitor developments and work with industry on any future sources of gas supply.
14
The Sydney Morning Herald, “ExxonMobil shelves Victorian gas import terminal plan”, 2 December 2019, at https://www.smh.com.au/business/
companies/exxonmobil-shelves-victorian-gas-import-terminal-plan-20191201-p53fri.html.
15
Golden Beach Gas Production and Storage Infrastructure Project, at https://gbenergy.com.au/s/Golden-Beach-Gas-Production-and-Infrastructure-
Project.pdf.
16
Society of Petroleum Engineers (SPE) Petroleum Resources Management System (PRMS) standards at https://www.spe.org/industry/docs/PRMS-Guide-for-
Non-Technical-Users-2007.pdf.
17
Victorian Government, Victorian Gas Program, at https://earthresources.vic.gov.au/__data/assets/pdf_file/0005/524489/VGP_PR04-120320-Low-Res.pdf.
© AEMO 2020 | Victorian Gas Planning Report Update 9Contents Executive summary 3 1. Introduction 13 1.1 Review of 2019 13 1.2 The Victorian Declared Transmission System 14 1.3 Gas planning in Victoria 15 2. Gas usage forecast 17 2.1 Forecast consumption 18 2.2 Peak day demand forecast 22 3. Supply adequacy 24 3.1 DTS supply sources 24 3.2 Annual supply demand balance 25 3.3 Peak day supply demand balance 28 4. Potential future gas supply sources 32 4.1 Anticipated supply 32 4.2 Potential projects 35 4.3 Exploration projects 39 4.4 Onshore projects 40 4.5 Gas storage 41 4.6 Imports into the DTS 41 4.7 LNG import terminals 41 4.8 Distributed gas supply 42 5. Declared Transmission System adequacy 44 5.1 System augmentations 44 A1. Gas supply classifications definitions 46 A2. Gas demand forecast data by system withdrawal zone 48 A2.1 Annual consumption and demand 48 A2.2 Monthly consumption and demand for 2020 50 A3. Victorian gas planning approach 52 A3.1 DTS system withdrawal zones 52 A3.2 DTS supply sources 54 Measures, abbreviations and glossary 56 © AEMO 2020 | Victorian Gas Planning Report Update 10
Tables
Table 1      Annual gas consumption and peak gas total demand, 2014-19                         4
Table 2      Forecast Victorian annual consumption and production supply, 2020-24, with 2019
             actuals (PJ)                                                                       5
Table 3      Forecast DTS peak day supply adequacy excluding GPG, 2020-24 (TJ/d)                8
Table 1      Gas supply classification definitions for VGPR, PRMS and GSOO                     16
Table 2      Total annual gas consumption forecast, 2020-24 (PJ/y)                             18
Table 3      Forecast annual Tariff V consumption by SWZ, 2020-24 (PJ/y)                       19
Table 4      Forecast annual Tariff D consumption by SWZ, 2020-24 (PJ/y)                       20
Table 5      1-in-2 year peak day system demand forecasts, 2020-24 (TJ/d)                      22
Table 6      1-in-20 year peak day system demand forecasts, 2020-24 (TJ/d)                     23
Table 7      Forecast monthly peak day system demand, 2020 (TJ/d)                              23
Table 8      Total gas production by SWZ (PJ/y), 2020-2024                                     27
Table 9      Peak day maximum daily quantity (MDQ) capacity by supply source (TJ/d), 2020-24   28
Table 10     DTS capacities and expected supply on a 1-in-20 peak demand day, 2020 (TJ/d)      30
Table 11     DTS capacities and expected supply on a 1-in-20 peak demand day, 2024 (TJ/d)      31
Table 12     GSOO gas supply classifications definitions                                       46
Table 13     PRMS gas supply classifications definitions                                       46
Table 14     Annual system consumption (PJ/y) by SWZ (Tariff V and D split)                    48
Table 15     Annual 1-in-2 peak daily demand (TJ/d) by SWZ                                     49
Table 16     Annual 1-in-20 year peak daily demand (TJ/d) by SWZ                               49
Table 17     Annual 1-in-2 Non-DTS and Victoria peak day demand forecast (TJ/d)                50
Table 18     Annual 1-in-20 Non-DTS peak day demand forecast (TJ/d)                            50
Table 19     Monthly gas system consumption (PJ/month) for 2020 by SWZ                         50
Table 20     Monthly gas consumption (PJ/month) for 2020                                       50
Table 21     Monthly GPG consumption (TJ/month) in 2020 by SWZ                                 51
Table 22     Monthly peak daily demand (TJ/d) in 2020 by SWZ                                   51
Table 23     DTS production facilities by SWZ                                                  54

© AEMO 2020 | Victorian Gas Planning Report Update                                                  11
Figures
Figure 1 Annual Victorian production (PJ per year) and 2019 VGPR vs. 2020 VGPR Update
forecasts 5
Figure 2 Actual and forecast peak day supply capacity (including pipeline constraints) by
location, and peak day demand, 2013-24 (TJ/d) 7
Figure 3 The Victorian Declared Transmission System 14
Figure 4 Total annual DTS consumption, actual 2015-19 and forecast 2020-24 (PJ/y) 18
Figure 5 Monthly DTS-connected GPG consumption, actual 2018-19 and forecast 2020
(TJ/month) 21
Figure 6 Victorian electricity generation, actual 2015-19 and forecast 2020-24 (GWh/year) 21
Figure 7 Average daily demand compared to peak day system demand forecasts 23
Figure 8 Annual production (PJ per year) and 2019 VGPR vs. 2020 VGPR Update forecasts 25
Figure 9 Peak day supply capacity by location (TJ/d) 29
Figure 10 Gippsland Basin titles map 33
Figure 11 Otway Basin titles map 34
Figure 12 Bass Basin titles map 38
Figure 13 Victorian Northern Interconnect import capacity 45
Figure 14 System Withdrawal Zones in the DTS 53
© AEMO 2020 | Victorian Gas Planning Report Update 121. Introduction
The Victorian Gas Planning Report Update (VGPR Update) assesses the adequacy of the Victorian Declared
Transmission System (DTS) to supply peak day gas demand and annual consumption over a five-year outlook
period. The most recent VGPR was published in March 2019 18.
Where AEMO becomes aware of any information that materially alters the most recently published VGPR, the
National Gas Rules (NGR) require AEMO to update the report as soon as practicable. The material changes
that prompted this VGPR Update are:
• Updated gas production forecasts indicate that without additional supply, winter peak day shortfalls are
expected from 2024.
• Updates to projects within the DTS since the 2019 VGPR was published.
All times in this report are Australian Eastern Standard Time (AEST).
1.1 Review of 2019
Total DTS gas consumption during 2019 was slightly higher than in 2018, due to increased gas-powered
generation (GPG) for electricity supply for the National Electricity Market (NEM), and was similar to total gas
consumption in 2017. DTS system consumption in 2019 was 197 petajoules (PJ), with total consumption of
217 PJ19. This is higher than the 193 PJ of system consumption and 203 PJ of total consumption recorded
in 2018.
The 2019 Victorian DTS peak demand day occurred on Friday 9 August, which was also the highest ever total
demand, at 1,308 terajoules (TJ). This demand comprised 1,194 TJ of system demand and 109 TJ of GPG
demand. The Effective Degree Day (EDD)20 on this day was 15.0.
Total DTS GPG consumption doubled from 10 PJ in 2018 to 20 PJ in 2019, and peaked during the winter and
shoulder period from August to October. This increase in DTS GPG consumption was due to the extended
outages of the Loy Yang A2 coal-fired generator and Mortlake unit 2 gas-fired generator and other coal
generator issues across several units within Victoria and New South Wales during 2019.
Key observations for the peak demand winter period of 2019 include:
• Average system demand was 780 TJ a day (TJ/d), which is slightly below the average 791 TJ/d observed
in 2018.
• Cumulative EDD for the period was 1,195, which is below the 2018 value of 1,234.
• Net injections from New South Wales via Culcairn into the Victorian Northern Interconnect (VNI) totalled
12 PJ, which is over three times higher than for the same period in 2018. This is the first time since 2009
that there was an overall net supply from New South Wales via Culcairn. Exports to New South Wales via
the Eastern Gas Pipeline (EGP) over the peak period totalled 32.5 PJ, which is below the 41.8 PJ exported in
2018 for the peak period.
18
The VGPR is required every second year. Recent publications are at https://www.aemo.com.au/energy-systems/gas/gas-forecasting-and-planning/
victorian-gas-planning-report.
19
System consumption means residential, commercial, and industrial gas usage. Total consumption combines system consumption and consumption by GPG
for generating electricity in Victoria.
20
EDD (effective degree days) is a measure of coldness. The higher the forecast EDD, the more gas is expected to be used for heating.
© AEMO 2020 | Victorian Gas Planning Report Update 13• Net supply from Queensland to the southern states (predominantly New South Wales and South Australia)
via the South West Queensland pipeline (SWQP) was 33.2 PJ over the peak demand period, up from
16.7 PJ in 2018 and 5.2 PJ in 2017.
• Longford Gas Plant production was approximately 5% higher in 2019 than in 2018.
• The Iona Underground Storage (UGS) facility was utilised less than in 2018, with 11.0 PJ drawn down from
storage in 2019, compared to 14.5 PJ drawn down in 2018.
• Peak shaving liquefied natural gas (LNG) was injected in response to a Threat to System Security on three
separate gas days:
– 20 TJ on 27 May 2019 due to high demand combined with an under delivery from Longford.
– 12 TJ on 29 May 2019 due to underforecast demand because of colder than forecast temperatures.
– 12 TJ on 19 June 2019 due to underforecast demand because of colder than forecast temperatures
coinciding with higher than forecast GPG due to the unplanned outage of a coal-fired generator.
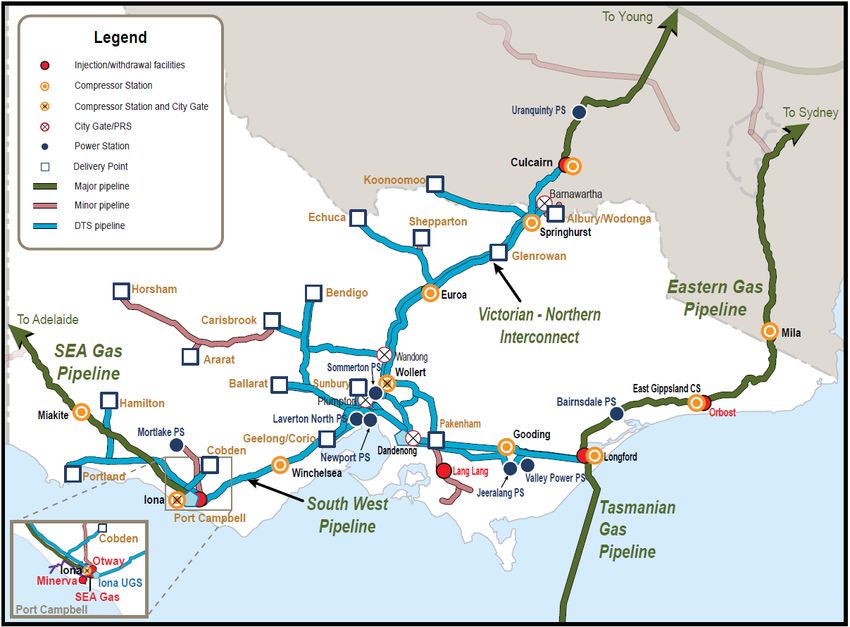
1.2 The Victorian Declared Transmission System
The DTS supplies natural gas to the majority of households and businesses in Victoria, and in addition, to
communities in New South Wales between Moama and Albury. Gas is transported from the Longford and
Lang Lang gas plants in the east, to and from Culcairn in the north (connecting to the New South Wales gas
transmission system), and Port Campbell in the west (connecting to the Otway and Minerva gas production
facilities, the Iona UGS facility, and to South Australia via the SEA [South East Australia] Gas Pipeline).
Figure 3 provides a high-level map of the Victorian gas transmission network, including the DTS (in blue) and
other gas transmission pipelines. The DTS comprises the following six system withdrawal zones (SWZs),
defined in Appendix A3: Ballarat; Geelong; Gippsland; Melbourne; Northern; and Western (the Western
Transmission System or WTS).
Figure 3 The Victorian Declared Transmission System
© AEMO 2020 | Victorian Gas Planning Report Update 141.3 Gas planning in Victoria
1.3.1 Roles and responsibilities
AEMO operates the Victorian DTS and provides information about gas supply and demand, system
constraints, capability, and development proposals, to assist in the efficient planning and development of gas
markets and facilities.
The DTS service provider, APA Group, owns and maintains the DTS assets. As the asset owner, APA must
submit an Access Arrangement proposal to the Australian Energy Regulator (AER) every five years, which
contains their proposed capital and operating expenditures for the period. The AER assesses the proposal
and then provides APA with an appropriate cost recovery structure to fund the continued service of the
network and any approved projects.
The timing of any capital investment in the DTS is ultimately decided by APA Group. Under the framework set
out in the National Gas Law (NGL) and the NGR, APA Group may adjust actual capital expenditure from that
assessed by the AER during the Access Arrangement period.
Third-party asset owners maintain and augment connected infrastructure, including production and storage
facilities and interconnected pipelines.
1.3.2 Planning basis and definitions
AEMO prepares and publishes a planning review (in the form of the VGPR) once every two years by 31 March,
in accordance with NGR rule 323.
Where AEMO becomes aware of any information that materially alters the most recently published planning
review, rule 323(5) requires AEMO to update the planning review as soon as practicable.
In accordance with rule 324 of the NGR, participants are required to provide AEMO with forecast information.
Under rule 324(6), AEMO must keep this forecast information confidential except to the extent of the
information that AEMO is required to provide in the VGPR.
In producing the VGPR, AEMO assesses DTS supply and system adequacy to meet a forecast 1-in-2 year and
1-in-20 year peak system demand day over the outlook period:
• A 1-in-2 year forecast is defined as a peak day system demand forecast with a 50% probability of
exceedance (POE). This means the forecast is expected, on average, to be exceeded once in two years,
and is considered the most probable peak day system demand forecast.
• A 1-in-20 year forecast is defined as a peak day system demand forecast for severe weather conditions,
with a 5% POE. This means the forecast is expected, on average, to be exceeded once in 20 years. This
forecast is used for DTS capacity planning.
System demand does not include supply for GPG 21. Under rule 323(3), AEMO is also required to assess the
impact of GPG demand on 1-in-2 year peak system demand days.
AEMO uses the term “demand” to describe hourly and daily usage of gas, and the term “consumption” to
refer to monthly and annual usage of gas.
The Gas Industry Act 2001 (Vic) and the Gas Safety Act 1997 (Vic) impose obligations on network operators
and owners relating to the reliability of gas supply. The reliability of gas supply refers to the continuity of
supply to customers. Energy Safe Victoria (ESV) regards an unplanned loss of supply (or interruption) to a
customer in any circumstance as a potentially dangerous and undesirable event.
AEMO uses these legislative requirements, along with the planning standard, to assess the adequacy of the
DTS to support peak day demand. This assessment is used to recommend augmentations or additional gas
21
Total demand is the sum of system demand and GPG demand.
© AEMO 2020 | Victorian Gas Planning Report Update 15supplies that are required to reduce the risk of an unplanned loss of supply and subsequent risks to public
safety.
1.3.3 Gas supply classification definitions
The classifications of gas supply used in the 2020 VGPR Update are defined in Table 1. The gas supply
category “prospective”, referred to in the NGR, is now called “anticipated supply” to establish consistent
terminology with the Gas Statement of Opportunities (GSOO) for eastern and south-eastern Australia. Other
supply classifications are unchanged from the 2019 VPGR.
Table 1 also shows the corresponding terms from the Petroleum Resources Management System (PRMS) and
GSOO. Full definitions can be found in Appendix A1. Note that the PRMS definition of ‘Development not
viable’ is not included in the gas supply classifications.
Table 1 Gas supply classification definitions for VGPR, PRMS and GSOO
VGPR 2020 VGPR description PRMS GSOO
Available supply Comprises developed gas reserves and committed new Reserves: On Committed supply
gas supply projects, including developments or projects Production,
which have successfully passed a financial investment Approved for
decision (FID), and are progressing through the Development
engineering, procurement and construction (EPC) phase,
but are not currently operational.
Anticipated supply Considers gas supply from undeveloped reserves or Reserves: Justified for Anticipated supply
contingent resources that producers forecast to be Development
available as part of their best production estimates
provided to AEMO. It includes projects or developments
which have not reached FID but are anticipated to
proceed during the outlook period (using existing
infrastructure). This supply is discussed in Chapter 3.
Potential projects Uncommitted gas supply projects that have not reached Contingent Uncertain supply
FID, which could potentially proceed during the outlook Resources:
period. These projects have not been included in the Development
anticipated supply forecast and are discussed in Chapter 4. Pending,
They are considered less likely than the anticipated supply Development on
projects to proceed in the outlook period, due to: Hold, Development
• The discovered gas fields being classified as contingent Unclarified
resources (not proven reserves) where commercial
recovery is dependent on the development of new
technology or where evaluation of the gas resource is
still at an early stage, or
• Insufficient gathering pipeline or appropriate gas
processing capacity being available, or
• The project requiring new infrastructure that currently
does not have approved planning permits or
environmental approvals.
Exploration projects These projects are associated with undiscovered gas Prospective
resources that are usually mapped using seismic data. resources:
These have not been physically proven with exploration Prospect/Leads/Plays
wells, so commercial quantities of hydrocarbons may not
actually be present. Neighbouring wells and seismic data
are used to estimate the 'gas in place', with the reported
prospective resource volumes usually representing the
estimated recoverable volume of hydrocarbons. These are
not included in any of the supply forecasts but are
discussed in Chapter 4.
© AEMO 2020 | Victorian Gas Planning Report Update 162. Gas usage forecast
Key findings
• Annual system consumption is forecast to remain relatively flat over the outlook period, decreasing
from 197 PJ in 2020 to 195 PJ in 2024. This contrasts with the 2019 VGPR, where a slight increase in
annual system consumption was forecast.
• The forecast peak system demand for 2020 is:
– 1,136 TJ for a 1-in-2 year peak system demand day.
– 1,249 TJ for a 1-in-20 year peak system demand day.
• Tariff D (large customers) consumption is forecast to decrease 3.9% over the outlook period, due to
changing behaviours of large commercial and industrial customers.
• DTS-connected GPG consumption is forecast to decrease from 2020, primarily due to new renewable
generation that is forecast to come online, however, an increase is predicted following the planned
staged closure of the Liddell Power Station between 2022 and 2023. There is high uncertainty around
the GPG forecast, due to a number of factors.
Background
The gas usage forecasts in the 2020 VGPR Update were produced using the GSOO demand forecasting
methodology22. The VGPR forecasts are a subset of the gas usage forecasts for eastern and south-eastern
Australia in the 2020 GSOO, also published in March 2020.
Updated monthly peak day GPG demand and peak hourly system demand forecasts are not included in this
VPGR Update. Updates to these forecasts will be provided in the 2021 VGPR.
System demand refers to daily gas consumption by residential, commercial, and industrial gas users, including
compressor and heater fuel gas usage.
GPG is not included in system demand. Total demand refers to the sum of system demand and GPG demand.
System demand is further classified into Tariff V demand and Tariff D demand, defined as follows:
• Tariff V demand – residential and small commercial customers, each normally consuming less than 10 TJ
per year (TJ/y) of gas
• Tariff D demand – large commercial and industrial customers, each normally consuming more than 10 TJ/y
of gas.
Compressor and heater fuel gas use are proportionally allocated by energy volume to both Tariff V and
Tariff D demand.
System demand is primarily driven by Tariff V gas usage for heating, which depends on a number of
variables. To forecast system demand, AEMO uses a measure known as the EDD, which takes into account the
temperature profile, average wind speed, and sunshine hours for the gas day.
22
AEMO, Demand Forecasting Methodology Information Paper, 2018, at http://aemo.com.au/Gas/National-planning-and-forecasting/Gas-Statement-of-
Opportunities.
© AEMO 2020 | Victorian Gas Planning Report Update 172.1 Forecast consumption
This section presents the DTS total annual consumption forecasts. Total annual consumption includes:
• System consumption (Tariff V, Tariff D, compressor fuel gas, and unaccounted for gas [UAFG]).
• DTS-connected GPG consumption.
It also presents total Victorian consumption, which includes:
• Total DTS consumption.
• Non-DTS Tariff V and Tariff D consumption at Bairnsdale, Lang Lang, and demand off the South
Gippsland pipeline.
• GPG consumption at Bairnsdale and Mortlake.
2.1.1 Annual consumption
Annual DTS total gas consumption is projected to decrease slightly over the outlook period, from 205 PJ in
2020 to 203 PJ in 2024, as shown below in Table 2 and Figure 4.
Table 2 Total annual gas consumption forecast, 2020-24 (PJ/y)
2020 2021 2022 2023 2024 Change over outlook
Tariff V 130 131 131 131 131 0.4%
Tariff D 67 65 65 64 64 -3.9%
System consumption 197 196 196 195 195 -1.0%
DTS GPG consumption 8 5 5 6 8 6.5%
Total DTS consumption 205 201 201 201 203 -0.7%
Non-DTS system consumption 1 1 1 2 2 6.1%
Non-DTS GPG consumption 9 6 5 4 3 -65%
Victorian GPG consumption 17 11 10 10 12 -32%
Total Victorian consumption 216 209 208 207 208 -3.5%
Note: totals and change over outlook percentage may not add up due to rounding.
Figure 4 Total annual DTS consumption, actual 2015-19 and forecast 2020-24 (PJ/y)
250
200
Consumption (PJ/y)
150
100
50
0
2015 2016 2017 2018 2019 2020 2021 2022 2023 2024
Tariff V Actuals Tariff D Actuals GPG Actuals Tariff V Forecast Tariff D Forecast GPG Forecast
© AEMO 2020 | Victorian Gas Planning Report Update 18This decrease is primarily attributed to a decrease in forecast Tariff D and GPG consumption over the outlook
period. It differs from the 2019 VGPR, which projected total consumption increasing to 212 PJ in 2023.
2.1.2 Tariff V consumption
Tariff V consumption (by residential and small commercial customers) is forecast to remain relatively flat, with
a predicted increase of just 0.4% over the outlook period. This slight increase is mainly driven by population
growth, which is forecast to increase the number of Tariff V connections. The impact of population growth is
projected to be offset by decreasing gas consumption per household, as a result of increased energy
efficiency and electric appliance use in high density developments.
This increase is lower than the 2% increase projected in the 2019 VGPR. Updated advice from distributors
resulted in a lower forecast number of commercial Tariff V connections this year compared to last year.
Table 3 depicts the projected Tariff V consumption by SWZ. It can be seen that demand behaviour varies in
the different SWZs:
• In the Melbourne zone, Tariff V consumption is forecast to decrease slightly, as the projected number of
new connections is offset by reduced consumption per household, reflecting the greater proportion of
high-density developments that generally use electrical appliances.
• In all other zones, Tariff V consumption is forecast to increase due to the number of new connections in
the low-density population growth corridors on the fringe of Melbourne that are expected to continue to
install mainly gas appliances.
Table 3 Forecast annual Tariff V consumption by SWZ, 2020-24 (PJ/y)
2020 2021 2022 2023 2024 Change over outlook
Ballarat 8.6 8.8 8.9 9.1 9.2 6.9%
Geelong 11.0 11.2 11.3 11.4 11.6 5.1%
Gippsland 5.6 5.7 5.8 5.9 6.0 7.9%
Melbourne 93.0 93.1 92.7 92.1 91.6 -1.5%
Western 1.4 1.4 1.4 1.5 1.5 6.0%
Northern 10.8 10.9 11.0 11.0 11.1 3.1%
DTS Tariff V system consumption 130.3 131.2 131.2 131.0 130.9 0.4%
Non-DTS Tariff V system consumption 0.47 0.49 0.52 0.54 0.56 19%
Total Victorian Tariff V 130.8 131.7 131.7 131.6 131.5 0.5%
Note: totals and change over outlook percentage may not add up due to rounding.
2.1.3 Tariff D consumption
Tariff D (large commercial and industrial) consumption, as shown in Table 4, is projected to continue to
decline, with a 3.8% reduction over the outlook period. The 2019 VGPR predicted a decline in annual Tariff D
consumption of 0.5% over the five-year period. The increased decline is driven by changing behaviour by
large industrial consumers, and the 2019 closure of large industrial customer Norske Skog Albury Paper Mill23.
The forecasting methodology used for Tariff D consumption differs from previous years. In previous years,
Tariff D usage was forecast based only from survey information from large industrials. This year, large
industrial customer usage was predominately forecast using individual surveys and interviews, whereas
smaller customers were forecast using a separate economic aggregate model. This change in methodology
has highlighted a long-term trend in smaller Tariff D customers with an increased number of connections but
a lower consumption per customer.
23
Norske Skog, “Norske Skog announces sale and closure of Albury Mill”, 3 October 2019, at https://www.norskeskog.com/About-Norske-Skog/Press-room/
Press-releases/English-press-releases/Norske-Skog-announces-sale-and-closure-of-Albury-mill?Action=1&PID=4123.
© AEMO 2020 | Victorian Gas Planning Report Update 19Recent high gas prices have resulted in manufacturers and industrial users looking to gas use reduction
strategies to decrease operating costs. In some cases, customers have expanded overseas operations instead
of increasing Australian operations, and explored fuel switching, energy efficiency, or waste-to-energy
technologies24. In extreme cases, manufacturers have announced intentions to shut down. This includes Dow
Chemicals in Altona, Melbourne, which cited rising gas prices as one of the main factors in its decision to
close25.
Table 4 Forecast annual Tariff D consumption by SWZ, 2020-24 (PJ/y)
2020 2021 2022 2023 2024 Change over outlook
Ballarat 1.6 1.6 1.5 1.5 1.5 -2.3%
Geelong 11.8 11.1 11.1 10.9 10.9 -7.9%
Gippsland 8.5 8.3 8.1 7.9 7.7 -9.2%
Melbourne 34.4 34.0 33.8 33.4 33.7 -2.2%
Western 2.6 2.6 2.5 2.5 2.5 -4.8%
Northern 7.7 7.8 7.8 7.8 7.8 0.7%
DTS Tariff D system consumption 66.6 65.2 65.0 64.0 64.0 -3.9%
Non-DTS Tariff D system consumption 0.97 0.98 0.98 0.98 0.97 -0.1%
Total Victorian Tariff D 67.6 66.2 65.9 65.0 65.0 -3.8%
Note: totals and change over outlook percentage may not add up due to rounding.
2.1.4 Annual GPG consumption
Victorian gas usage for power generation is driven by events and conditions in the NEM. For example, in
2017, GPG consumption increased to 15 PJ/y, 500% above the 2016 demand, due to the March 2017 closure of
the Hazelwood Power Station.
Total DTS GPG consumption doubled from 10 PJ in 2018 to 20 PJ in 2019. This was largely due to a 16%
reduction in brown coal generation, with the main cause being extended outages of the Loy Yang A2
coal-fired generator. Other contributing factors included the extended outage of the Mortlake unit 2
gas-fired generator and coal issues across several units within Victoria and New South Wales.
The GPG forecasting methodology assumed generation and transmission assets are developed in line with
the Central scenario detailed in the Draft 2020 Integrated System Plan (ISP), which provides a least-cost-based
engineering optimisation plan for the NEM transmission system26.
As shown in Table 2, Victorian DTS GPG consumption is forecast to decrease by 32% over the outlook period.
The initial decrease in all Victorian GPG is driven by an increase in the amount of renewable generation
forecast to be commissioned over the outlook period. However, this trend is forecast to slow and then
reverse slightly with the staged closure of the coal-fired Liddell Power Station in New South Wales across
2022 and 202327.
Figure 5 shows monthly DTS GPG consumption for 2018 and 2019, and the predicted monthly forecast for
2020. Monthly GPG consumption can be significant during the winter and shoulder periods, and has the
potential to coincide with a 1-in-2 or 1-in-20 peak winter demand day.
24
The Australian Competition & Consumer Commission, Gas Inquiry 2017-2025 Interim Report, January 2020, at https://www.accc.gov.au/system/files/
Gas%20inquiry%20January%202020%20interim%20report.pdf.
25
The Sydney Morning Herald, “Altona site to shit: Union sounds jobs alarm on gas crisis”, 28 May 2019, at https://www.smh.com.au/business/companies/
altona-site-to-shut-union-sounds-jobs-alarm-on-gas-crisis-20190528-p51s2s.html.
26
AEMO, Draft 2020 Integrated System Plan, 2020, at: https://aemo.com.au/-/media/files/electricity/nem/planning_and_forecasting/isp/2019/draft-2020-
integrated-system-plan.pdf?la=en.
27
AGL, Schedule for the closure of AGL plants in NSW and SA, 2 August 2019, at https://www.agl.com.au/about-agl/media-centre/asx-and-media-
releases/2019/august/schedule-for-the-closure-of-agl-plants-in-nsw-and-sa.
© AEMO 2020 | Victorian Gas Planning Report Update 20Figure 5 Monthly DTS-connected GPG consumption, actual 2018-19 and forecast 2020 (TJ/month)
3000
2500
DTS GPG Demand (TJ/month)
2000
1500
1000
500
0
Jan Feb Mar Apr May Jun Jul Aug Sep Oct Nov Dec
2018 2019 2020 (Forecast)
These DTS GPG consumption forecasts are subject to a range of uncertainties.
First, the Draft 2020 ISP (Central scenario) forecasts a large amount of additional renewable generation in
Victoria over the next decade, to meet the Victorian Renewable Energy Target (VRET)28,29. As shown in Figure
6, utility-scale solar and wind generation is forecast to substantially increase from 2019 to 2021 in Victoria. If
forecast investments in renewable energy generation are delayed or do not proceed, GPG consumption is
likely to be higher than the forecast in Table 2.
Figure 6 Victorian electricity generation, actual 2015-19 and forecast 2020-24 (GWh/year)
60000
50000
40000
Generation (GWh)
30000
20000
10000
0
2015 2016 2017 2018 2019 2020 2021 2022 2023 2024
Wind & Solar Forecast Wind & Solar Hydro Forecast Hydro
Coal Forecast Coal Gas Forecast Gas
28
AEMO, Draft 2020 Integrated System Plan, 2020, at: https://aemo.com.au/-/media/files/electricity/nem/planning_and_forecasting/isp/2019/draft-2020-
integrated-system-plan.pdf?la=en.
29
Victoria State Government, Victoria’s Renewable energy targets, at https://www.energy.vic.gov.au/renewable-energy/victorias-renewable-energy-targets.
© AEMO 2020 | Victorian Gas Planning Report Update 21Second, as outlined in the 2020 GSOO, annual GPG gas consumption is forecast to be increasingly sensitive
to year-on-year variations in weather conditions. Weather patterns (rainfall, wind, and solar) affect not only
consumer demand for electricity, but also the output of renewable generation in the NEM, which
subsequently impacts the amount of gas required for GPG.
Other factors that may result in GPG demand varying from forecasts include:
• The reliability of coal-fired generators in the NEM.
• Changes to the expected closure dates of coal-fired generators.
• Gas prices varying from projected levels.
• Delays in any electricity transmission investments that were assumed to proceed in the Draft 2020 ISP.
Additionally, a 220 megawatt (MW) gas-fired power station at Dandenong, proposed by APA Group, has
been selected as one of two projects to progress to the next stage of the Federal Government’s Underwriting
New Generation Investments (UNGI) program 30. No details have been provided on when the plant is likely to
be operational, however, if it progresses during the outlook period, this may also affect the GPG consumption
forecast.
2.2 Peak day demand forecast
This section reports:
• Annual DTS peak day system demand forecasts over the five-year outlook period from 2020.
• Monthly peak day gas demand forecasts from January 2020 to December 2020.
These forecasts are reported by SWZ in Appendix A2. The 1-in-2 year and 1-in-20 year non-DTS Victorian
peak day system demand forecasts are also included in Appendix A2A2.1.
2.2.1 Peak day system demand
Peak day system demand is primarily driven by Tariff V gas usage for space heating, which significantly
increases as temperature decreases.
The 1-in-2 year and 1-in-20 year peak day system demand forecasts, summarised below in Table 5 and Table
6 respectively, show a projected decrease in Tariff D peak day demand, while Tariff V peak day demand is
forecast to remain relatively stable. The total peak day system demand is forecast to remain flat over the
outlook period, decreasing by just 0.4%.
This contrasts to the 2019 VGPR, which projected an increase in Tariff V peak day forecast over the outlook
period. The slight decrease in peak day consumption is largely due to the predicted decrease in Tariff D
consumption, as discussed in Section 2.1.3.
Table 5 1-in-2 year peak day system demand forecasts, 2020-24 (TJ/d)
2020 2021 2022 2023 2024 Change over outlook
Tariff V 903 909 908 907 908 0.5%
Tariff D 233 227 228 224 224 -3.9%
System demand 1,136 1,136 1,135 1,131 1,131 -0.4%
Note: totals and change over outlook percentages may not add up due to rounding.
30
APA, “APA project selected for government power scheme”, 24 December 2019, at https://www.apa.com.au/news/media-statements/2019/apa-project-
selected-for-government-power-scheme/.
© AEMO 2020 | Victorian Gas Planning Report Update 22Table 6 1-in-20 year peak day system demand forecasts, 2020-24 (TJ/d)
2020 2021 2022 2023 2024 Change over outlook
Tariff V 1,009 1,016 1,018 1,015 1,015 0.6%
Tariff D 240 235 234 230 231 -3.8%
System demand 1,249 1,252 1,252 1,245 1,246 -0.3%
Note: totals and change over outlook percentage may not add up due to rounding.
2.2.2 Monthly peak day forecast
Table 7 shows the forecast peak day system demand for each month during 2020. The peak day system
demand is expected to occur during the winter period, from June to September. Monthly peak day system
demand is influenced by weather conditions and seasonal industrial demand changes.
Figure 7 shows the forecast peak day system demand compared to the forecast average daily system demand
for each month in 2020.
Monthly forecast peak day system demand by SWZ for 2020 is reported in Appendix A2.
Table 7 Forecast monthly peak day system demand, 2020 (TJ/d)
Jan Feb Mar Apr May Jun Jul Aug Sep Oct Nov Dec
1-in-2 year 378 394 463 638 896 1,070 1,094 1,068 883 734 570 422
1-in-20 year 429 477 598 810 1,029 1,172 1,215 1,224 1,013 846 727 556
Figure 7 Average daily demand compared to peak day system demand forecasts
1,400
1,200
1,000
Demand (TJ/day)
800
600
400
200
0
Jan Feb Mar Apr May Jun Jul Aug Sep Oct Nov Dec
Average Daily Residential and Small Commercial Demand (Tariff V)
Average Daily Industrial and Large Commercial Demand (Tariff D)
1-in-2 year peak system demand day
1-in-20 year peak system demand day
© AEMO 2020 | Victorian Gas Planning Report Update 23You can also read