Impact of ionizing radiation on superconducting qubit coherence
←
→
Page content transcription
If your browser does not render page correctly, please read the page content below
Impact of ionizing radiation on superconducting
                                            qubit coherence
                                            Antti P. Vepsäläinen1,* , Amir H. Karamlou1 , John L. Orrell2,** , Akshunna S. Dogra1,4 , Ben
                                            Loer2 , Francisca Vasconcelos1 , David K. Kim3 , Alexander J. Melville3 , Bethany M.
                                            Niedzielski3 , Jonilyn L. Yoder3 , Simon Gustavsson1 , Joseph A. Formaggio1 , Brent A.
                                            VanDevender2 , and William D. Oliver1,3
                                            1 Massachusetts  Institute of Technology, Cambridge, MA 02139, USA
                                            2 PacificNorthwest National Laboratory, Richland, WA 99352, USA
                                            3 MIT Lincoln Laboratory, Lexington, MA 02421, USA
                                            4 Harvard University, Cambridge, MA 02138, USA
arXiv:2001.09190v2 [quant-ph] 27 Aug 2020

                                            * Corresponding author for qubit operations: avepsala@mit.edu
                                            ** Corresponding author for radiation exposure: john.orrell@pnnl.gov

                                               The practical viability of technologies that rely on            very recently confirmed19 that high-energy cosmic rays result
                                            qubits requires long coherence times and high-fidelity op-         in bursts of quasiparticles that reduce the quality factor in su-
                                            erations1 . Superconducting qubits are one of the lead-            perconducting granular aluminum resonators, to date there has
                                            ing platforms for achieving these objectives2, 3 . However,        been no quantitative model or experimental validation of the
                                            the coherence of superconducting qubits is impacted by             effect of environmental ionizing radiation on superconducting
                                            broken Cooper pairs 4–6 , referred to as quasiparticles,           qubits.
                                            whose experimentally observed density is orders of mag-               In this work, we measure the impact of environmental radi-
                                            nitude higher than the value predicted at equilibrium by           ation on superconducting qubit performance. We develop a
                                            the Bardeen-Cooper-Schrieffer (BCS) theory of supercon-            model and determine its parameters by measuring the effect
                                            ductivity7–9 . Previous work10–12 has shown that infrared          of radiation from a calibrated radioactive source on the qubit
                                            photons significantly increase the quasiparticle density,          energy-relaxation rate. We use this model to infer the energy-
                                            yet even in the best isolated systems, it still remains much       relaxation rate Γ1 ≈ 1/4 ms−1 for our qubit if it were limited
                                            higher10 than expected, suggesting that another genera-            solely by the measured level of naturally occurring cosmic
                                            tion mechanism exists13 . Here, we provide evidence that           rays and background environmental radiation present in our
                                            ionizing radiation from environmental radioactive mate-            laboratory. We then demonstrate that the deleterious effects
                                            rials and cosmic rays contributes to this observed differ-         of this external radiation can be reduced by protecting the
                                            ence. The effect of ionizing radiation leads to an elevated        device with a lead shield. The improvement in qubit energy-
                                            quasiparticle density, which we predict would ultimately           relaxation time from this independent shielding measurement
                                            limit the coherence times of superconducting qubits of the         is consistent with the radiation-limited Γ1 inferred from the
                                            type measured here to the millisecond regime. We further           model. Furthermore, we show that our estimate of the quasi-
                                            demonstrate that introducing radiation shielding reduces           particle density due solely to the ionizing radiation agrees
                                            the flux of ionizing radiation and positively correlates           with the observed surplus quasiparticle density in qubits that
                                            with increased energy-relaxation time. Albeit a small ef-          are well-isolated from thermal photons7, 10 . This finding is
                                            fect for today’s qubits, reducing or otherwise mitigating          of crucial importance for all superconducting applications in
                                            the impact of ionizing radiation will be critical for realiz-      which quasiparticle excitations are harmful, such as supercon-
                                            ing fault-tolerant superconducting quantum computers.              ducting quantum computing, superconducting detectors20, 21 ,
                                               Over the past 20 years, superconducting qubit coherence         or Majorana fermion physics22 .
                                            times have increased more than five orders of magnitude due           For emerging quantum processors, one of most commonly
                                            to improvements in device design, fabrication, and materials,      used modalities is the superconducting transmon qubit23 ,
                                            from less than one nanosecond in 199914 to more than 100 µs        which comprises one or more Josephson junctions and a shunt
                                            in contemporary devices15, 16 . Nonetheless, to realize the full   capacitor. The intrinsic nonlinear inductance of the junction in
                                            promise of quantum computing, far longer coherence times           combination with the linear capacitance forms an anharmonic
                                            will be needed to achieve the operational fidelities required      oscillator24 . The non-degenerate transition energies of such
                                            for fault-tolerance17 .                                            an oscillator are uniquely addressable, and in particular, its
                                               Today, the performance of superconducting qubits is limited     ground and first excited states serve as the logical |0i and |1i
                                            in part by quasiparticles - a phenomenon known colloquially        states of the qubit, respectively. In an ideal situation, qubits
                                            as “quasiparticle poisoning.” Although it was suggested18 and      would suffer no loss of coherence during the the run-time
In Out
Josephson junction
Beta particles -
x-rays interact in the surface
R2
create ionization β γ-rays are deeply penetrating
R1
electron-hole
pairs (e- / h+) e- e- x-ray γ-ray
e- e-
continuously in
dense materials
-
Al h+ e e- e- e- h+ e- e-
Q1 Q2 e - e- e- e- e- e-
e- e-
Si
In Out Phonons created by e- / h+ pairs h+ e-
Lid
7.5 mm can transport energy through bulk e- h+
3.3 mm Sample
R1 R2 Superconducting phenomenon
Impinging radiation Energy relaxation carriers
5 mm
Sample holder Photon (γ): Ionization: -
e /h + Cooper pair: e- e-
Q1 Q2
21 mm Beta (β-/+): Phonon: Quasiparticle: e-
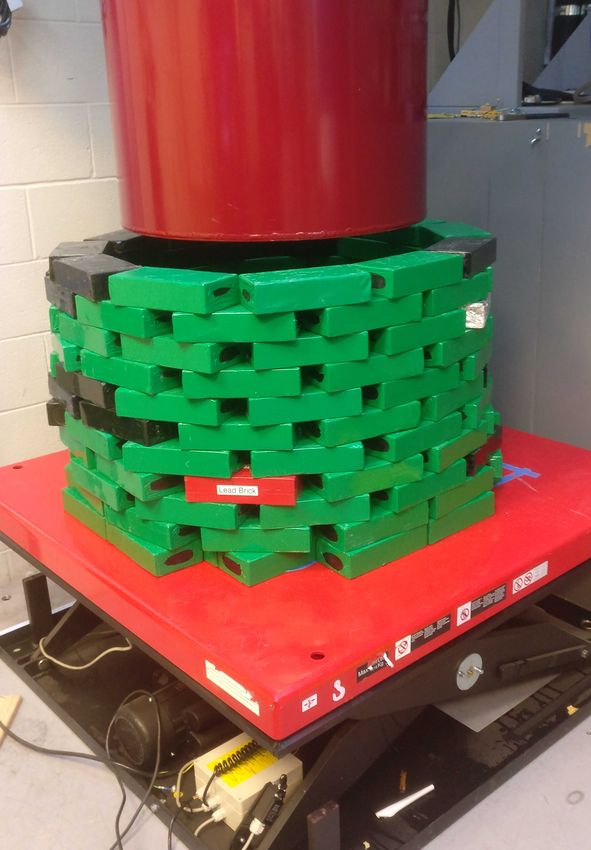
Figure 1. Schematic of the experiment. a) Illustration of the sample holder and the 64Cu radiation source. The source is
mounted 3.3 mm above the silicon chip containing the superconducting aluminum transmon qubits. b) False-color micrograph
and circuit schematic of the qubit sample. The sample consists of two transmon qubits, Q1 (blue, left) and Q2 (orange, right).
The resonators used to readout the qubits are shown with red and cyan. The resonators are inductively coupled to a common
microwave transmission line, through which both qubit control and readout pulses are sent. The control pulses and the
measurement pulses are generated using microwave sources and arbitrary waveform generators at room temperature (not
shown, see Extended Data Fig. 1a). c) Diagram of the possible quasiparticle generation processes. Incoming ionizing radiation
(from β ± , γ, and cosmic rays) interact with the Al qubit and Si substrate, creating electron-hole pairs due to the ionization of
atoms and phonons (see text). The subsequent energy cascade of these particles ultimately breaks Cooper pairs and thereby
generates quasiparticles.
of a quantum computation. However, interactions with the relation allows us to use the energy-relaxation time of a trans-
environment introduce decoherence channels, which for the mon as a sensor for quasiparticle density in the superconductor
case of energy decay, result in a loss of qubit polarization over as well as to estimate the maximum energy-relaxation time of
time, a transmon given a certain quasiparticle density. The thermal
equilibrium contribution to xqp is vanishingly small at the
p(t) = e−Γ1 t , (1) effective temperature of the sample, Teff ≈ 40 mK, compared
with the other generation mechanisms we shall consider here.
where p(t) is the excited-state probability and Γ1 ≡ 1/T1 is the
energy relaxation rate corresponding to the relaxation time T1 , Currently, there exists no quantitative microscopic model
which limits the qubit coherence time. For such processes, the directly connecting interactions of ionizing radiation (e.g.,
total energy relaxation rate is a combination of all individual betas, gammas, x-rays, etc.) to quasiparticle populations in
rates affecting the qubit, superconductors. However, a phenomonological picture de-
scribing the processes involved in this connection is shown
Γ1 = Γqp + Γother , (2) in Fig. 1c. The energy of ionizing radiation absorbed in the
aluminum metal and silicon substrate is initially converted
where Γqp is the energy relaxation rate due to the quasipar- into ionization electron-hole pairs. We purposefully distin-
ticles and Γother contains all other loss channels, such as ra- guish these high-energy excitations due to the ionization of
diation losses, dielectric losses, and the effect of two-level atoms – which occur in both aluminum and silicon – from the
fluctuators in the materials25 . In the transmon, the quasipar- lower-energy quasiparticle excitations resulting from broken
ticle energy-relaxation rate Γqp depends on the normalized Cooper-pairs in aluminum. Thereafter, a non-equilibirum re-
quasiparticle density xqp = nqp /ncp and the frequency of the laxation cascade involving secondary ionization carrier and
qubit ωq , such that26 phonon production serves to transfer the absorbed radiation
r power to and within the aluminum qubit, where it breaks
2ωq ∆ Cooper pairs and generates quasiparticles27, 28 .
Γqp = xqp . (3)
π 2}
To estimate the effect of the radiation intensity measured
The Cooper pair density (ncp ) and the superconducting gap in the laboratory, we employ a radiation transport simulation
(∆) are material-dependent parameters, and for thin-film alu- (see Methods for details) to calculate the total quasiparticle-
minum they are ncp ≈ 4 × 106 µm−3 and ∆ ≈ 180 µeV. This generating power density Ptot close to the qubit due to ra-
2/24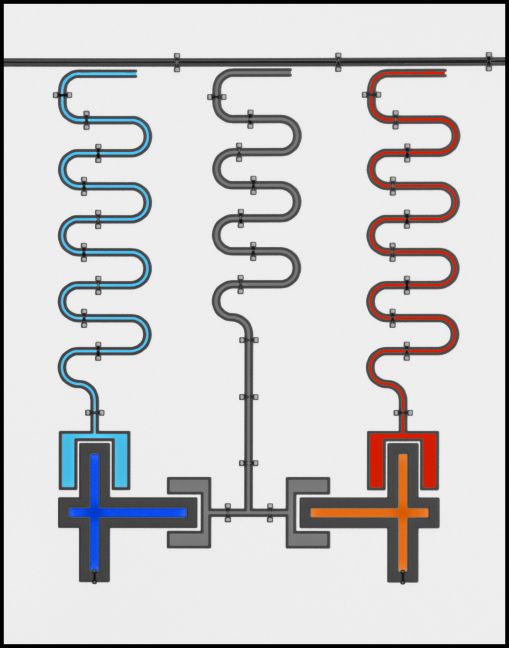
diation sources. We use a simple model for quasiparticle
dynamics,26
                   2
     ẋqp (t) = −rxqp (t) − sxqp (t) + g,                     (4)

where g is the quasiparticle generation rate, which linearly
depends on Ptot , r is the recombination rate, and s is the quasi-
particle trapping rate. A steady state solution
                                         p      for the quasipar-
ticle density is given by xqp = (−s + s2 + 4rg)/2r, p      and if
quasiparticle trapping is neglected (s = 0), then xqp = g/r.
In a separate quasiparticle injection experiment, we verified
that this is a valid approximation in our devices, see Extended
Data Fig. 2 and Supplementary material for discussion. By
substituting the model for xqp into Eq. (3) and using Eq. (2),
the qubit decay rate is given by
              p
      Γ1 = a ωq Ptot + Γother ,                               (5)

where a is a coefficient accounting for unknown material
parameters and the conversion from absorbed radiation power
to quasiparticle generation rate. In addition to the materials of
the chip, the conversion efficiency depends on the phononic
losses and the thermalization of the sample. The value of a
can be experimentally determined by exposing the qubit to a
known source of ionizing radiation.

Results
Radiation exposure experiment
To quantify the effect of ionizing radiation on superconduct-
ing qubits and to measure the coefficient a in Eq. (5), we
inserted a 64Cu radiation source in close proximity to a chip        Figure 2. 64Cu radiation exposure experiment. a)
containing two transmon qubits, Q1 and Q2, with average              Measured energy relaxation rates Γ1 = 1/T1 of qubits Q1
                               (Q1)                     (Q2)         (blue) and Q2 (orange) as a function of time when exposed to
energy-relaxation rates of Γ1 = 1/40 µs−1 and Γ1 =
                                        (Q1)                         the 64Cu source. The inset shows an example of the raw data
1/32 µs−1 , and transition frequencies ωq = 2π × 3.48 GHz            used for fitting the energy relaxation rates. Blue points are the
        (Q2)
and ωq       = 2π × 4.6 GHz, see Figs. 1a and 1c. 64Cu has           median of 20 measured qubit excited-state populations p(t)
a short half-life of 12.7 h, which permits an observation of         at various times after the excitation pulse. Blue bars indicate
the transition from elevated ionizing radiation exposure to          the 95% confidence interval for the median. The orange line
normal operation conditions within a single cooldown of the          is the exponential fit to the data, given in Eq. (1). The
dilution refrigerator. 64Cu was produced by irradiating high-        super-exponential decay at short measurement times results
purity copper foil in the MIT Nuclear Reactor Laboratory (see        from statistical fluctuations in the quasiparticle-induced
Methods for details).                                                energy-relaxation rate during the 20 measurements29 . b)
   The energy relaxation rate Γ1 of both qubits was repeatedly       Power density of the radiation during the experiment derived
measured for over 400 hours during the radioactive decay of          from radiation transport simulations (see text). c) Energy
the 64Cu source (see Fig. 2a, Methods and Extended Data              relaxation rates Γ1 as a function of radiation power density.
Fig. 3b). During this interval of time, the energy relaxation        The solid lines show the fit to the model of Eq. (5). The
       (Q1)
rate Γ1 of Q1 decreased from 1/5.7 µs−1 to 1/35 µs−1 due             dashed lines show the fit to model of Eq. (5) with Γother = 0
to the gradually decreasing radioactivity of the source, and         and Pint = 0. The vertical red line is the radiation power
similarly for Q2. The half-life was long enough to measure           density level due to the external radiation Pext .
individual Γ1 values at essentially constant levels of radioac-
tivity, yet short enough to sample Γ1 over a wide range of
radiation powers, down to almost the external background             of Eq. (4). Similarly, we observed a slight shift in the qubit fre-
level. In addition to affecting qubit energy-relaxation time,        quencies and a reduced T2 time (see Supplementary material
the resonance frequencies ωr of the readout resonators shifted       and Extended Data Figs. 4 and 5).
due to quasiparticle-induced changes in their kinetic induc-            The intensity of the radiation source used in the experiment
tance, consistent with the quasiparticle recombination model         was calibrated as a function of time using the gamma-ray

                                                                                                                                  3/24
spectroscopy of a reference copper foil that had been irradiated
concurrently. The foils included a small amount of longer-
lived radioactive impurities that began to noticeably alter the
radiated power density expected for 64Cu about 180 hours
into the measurements (see Fig. 2b). For both the 64Cu and
the long-lived impurities, the radiation intensities from the
different isotopes were converted to a single ionizing radiation
power density using the radiation transport simulation package
Geant430, 31 (see Methods for details). The contributions of the
different isotopes (dashed lines) and the resulting net power
density (solid line) of the radiation from the source, Psrc , are
shown in Fig. 2b over the measurement time window.
Using the data in Fig. 2b as a method for calibrated time-
power conversion, the energy relaxation rates of qubits Q1
and Q2 are presented as a function of the radiation power
density Psrc (Fig. 2c). In the high-Psrc limit (short times), the
model of Eq. (5) can be fit to the data to extract the value
for the conversion coefficient a = 5.4 × 10⁻³ mm3 /keV by
p
Figure 3. Environmental radioactivity assessment. a)
assuming Ptot ≈ Psrc dominates all radiation sources that gen- Spectrum of γ-radiation in the laboratory measured with NaI
erate quasiparticles as well as all other decay channels. In the scintillation detector, binned in 8192 energy bins. The data is
low-Psrc limit (long times), the qubit energy-relaxation rate is fit to the weighted sum of simulated spectra from 238U, 232Th,
limited predominantly by the decay rate Γother and, to a lesser and 40K progenitors convolved with a response function of
extent, by the long-lived radioactive impurities in the foil. the NaI detector. These isotopes are typical contaminants in
Having determined the coefficient a in Eq. (5), we now concrete. b) Simulated spectral density of power absorbed in
remove the calibrated radiation source. In its absence, the the aluminum film that comprises the qubit, calculated with
total radiation power density that generates quasiparticles can Geant4 using the measured spectrum shown in panel a) and
be categorized into two terms, Ptot = Pint + Pext . The term Pint the emission spectra of the 64Cu source and its impurities. At
accounts for radiation power sources that are internal to the t = 0, the spectrum is dominated by 64Cu, after 12 days by
dilution refrigerator, such as infrared photons from higher 198Au impurities, and after 36 days by 110mAg. 32Si is a
temperature stages or radioactive impurities present during radioactive contaminant intrinsic to the silicon substrate32 .
the manufacturing of the refrigerator components. Pext is the The fluctuations in the simulated spectra are due to finite
external ionizing radiation source outside the dilution refriger- simulation statistics.
ator whose influence on the qubits we attempt to determine in
the shielded experiment described in the next section.
To estimate the contribution of external radiation power Pext Using the model in Eq. (5) with the determined parameters
to the data shown in Fig. 2, we directly measured the energy for a and Pext and the known qubit frequencies, the lower limit
from the radiation fields present in the laboratory arising from on the total energy relaxation rate due to the external radiation
γ-rays (see Fig. 3) and cosmic rays, including those due to Pext in the absence of all other energy-relaxation mechanisms
(Q1) (Q2)
secondary processes, such as muon fields, using a NaI radia- is Γ1 ≈ 1/3950 µs−1 and Γ1 ≈ 1/3130 µs−1 , correspond-
tion detector (see Methods and Extended Data Fig. 6e). The ing to where the dashed lines would intersect the vertical
spectra were used to determine the radiation intensities from red band in Fig. 2c. These rates correspond to the point
cosmic rays and naturally occurring radioactive isotopes in at which naturally occurring radiation from the laboratory
the laboratory. These measured intensities were then used in would become the dominant limiting contributor to the qubit
a Geant4 radiation transport simulation to estimate the total energy-relaxation rate. Although its effect on the energy-
external power density Pext = (0.10 ± 0.02)keV mm−3 s−1 de- relaxation time is not dominant for today’s qubits, ionizing
posited in the aluminum that constitutes the resonators and radiation will need to be considered when aiming for coher-
qubits. About 60% of the external radiation power density ence times required for fault-tolerant quantum computing. We
results from the radioactive decays within the concrete walls can furthermore apply Eq. (3) to estimate the quasiparticle
of the laboratory (0.06 keV mm−3 s−1 ), with cosmic rays con- density caused by the ionizing radiation background, giving
tributing the remaining 40% (0.04 keV mm−3 s−1 ). This ex- xqp ≈ 7 × 10⁻⁹ , which agrees well with the lowest reported
ternal power level is indicated with a vertical red band in Fig. excess quasiparticle densities10 .
2c. Although statistical errors in the measured intensities are
small, we find a combined systematic uncertainty of approxi- Shielding experiment
mately 20%. The different sources’ contributions to the total We sought to verify the above result by shielding the qubits
systematic uncertainty are detailed in the Methods section. with 10 cm thick lead bricks outside the cryostat to reduce
4/24the external radiation and thereby improve the qubit energy-
Shield down
relaxation times, see Fig. 4. The shield was built on a scissor
Q
lift to be able to cyclically raise and lower it to perform an
A/B test of its effect. By using the parameters extracted from
the radiation exposure measurement and the model in Eq. (5),
the expected improvement of the energy relaxation rate due
to the shield can be estimated from
Q
δ Γ1 ≡ Γd1 − Γu1
q Shield up
√ p
= a ωq Pint + (1 − η d )Pext − Pint + (1 − η u )Pext ,
(6)
where η is the fraction of ionizing radiation blocked by the
shield and the label u (d) corresponds to the parameters when
the shield is up (down). We can make a realistic estimate of
the efficiency of the shield by measuring the radiation energy
spectrum with and without the shield using a NaI detector,
giving η u = 46.1%. The shield blocks approximately 80% of
the radiation from the nuclear decay events in the laboratory,
but is inefficient against the cosmic rays, see Methods for
details. From Eq. (6), in the absence of internal radiation
sources (Pint = 0), the expected effect of the shield on the
energy-relaxation rate of Q1 is δ Γ1 ≈ 1/15.5 ms−1 , which is
only 0.26 % of the energy-relaxation rate of qubit Q1.
To detect a signal this small, we measured the energy relax-
ation rates of the qubits while periodically placing the shield
in the up and down positions and then comparing their dif-
ference over many cycles, similar in spirit to a Dicke switch
radiometer measurement33 , see Fig 4a for a schematic. A
single up/down cycle of the lead shield lasted 15 minutes.
To accelerate the data acquisition, we installed an additional Figure 4. Qubit shielding experiment. a) Schematic of
sample in the dilution refrigerator with 5 qubits similar to Q1 shielding experiment. The qubit energy relaxation rate is
and Q2. measured N times with the shield up, and then again N times
Fig. 4b shows the histogram of the accumulated differences with the shield down. This cycle is repeated 65 times for
in the energy relaxation rates, δ Γ1 , for all of the qubits over qubits Q1 and Q2 and 85 times for qubits Q3-Q7. b)
the entire measurement, normalized to the frequency of Q1 Histogram of the differences in energy relaxation rates when
using Eq. (5). From the median of the histogram, we estimate the shield is up versus down. The inset shows the histogram
the shift in the energy relaxation rate δ Γ1 = 1/22.7 ms−1 , peak. The orange vertical line indicates the median of the
95% CI [1/75.8, 1/12.4] ms−1 . The Wilcoxon signed-rank test distribution. Although the median difference in the relaxation
can be used to assess if the measured energy-relaxation rates rates between shield-up and shield-down configurations is
are lower in the shield up than in the shield down positions, only 1.8% of the width of the distribution, it differs from zero
and it yields a p-value of 0.006. As the p-value is much less in a statistically significant manner. c) Difference in the
than 0.05, we can reject the null hypothesis that the shield did energy relaxation rates in the shielding experiment (orange
not have any effect on the qubit energy-relaxation time with dot) versus Pint /Pext . Vertical error bars are the 95%
high confidence, see Methods and Extended Data Fig. 7 for confidence intervals for the median of δ Γ1 . Horizontal error
additional details on the statistical analysis. bars are the corresponding confidence intervals for Pint . The
In Fig. 4c, we have compared the result of the shielding blue line indicates the energy relaxation rate estimated using
experiment to the estimate of the effect of the background the model from the 64Cu radiation exposure measurement
radiation obtained from the radiation exposure measurement. and Eq. (6). The filled blue region shows the confidence
The orange dot shows δ Γ1 extracted from the shielding ex- interval for the estimate assuming ± 20% relative error for
periment. The solid blue line shows how this value would Pext . Below the gray dashed line, the experiment is not
trend based on the predicted effect of the shield at the given sensitive enough to detect δ Γ1 .
Pext measured in the laboratory for different values of inter-
nal radiation power density Pint . Although we do not know
the exact value of Pint , we can approximate it by substitut-
5/24ing the measured δ Γ1 and a into Eq. (6) and by solving for developing techniques – such as lead shielding, quasiparticle
Pint ≈ 0.081 keV mm−3 s−1 , 95% CI [0, 1.73] keV mm−3 s−1 . trapping, and designing devices with reduced quasiparticle
This value for Pint , along with Pext , corresponds to a total sensitivity – to mitigate its impact on superconducting circuits,
quasiparticle density xqp ≈ 1.0 × 10⁻⁸ , again, consistent with including those used for quantum computation.
earlier observations10 .
Despite the uncertainty in the specific value of Pint , the References
results acquired from the two independent experiments agree
remarkably well. We conclude that, in the absence of all other 1. DiVincenzo, D. The physical implementation of quantum
energy-relaxation mechanisms, the ionizing radiation limits computation. Fortschritte der Physik 48, 771–783 (2000).
the qubit energy-relaxation rate to Γ1 ≈ 1/4 ms−1 . In turn, 2. Arute, F. et al. Quantum supremacy using a pro-
shielding the qubits from environmental ionizing radiation grammable superconducting processor. Nature 574, 505–
improved their energy-relaxation time. The observed energy 510 (2019).
relaxation rate was reduced by δ Γ1 ≈ 1/22.7 ms−1 , which 3. Kandala, A. et al. Error mitigation extends the computa-
is an 18 % improvement of the radiation induced Γ1 of the tional reach of a noisy quantum processor. Nature 567,
qubits. The shield was not able to remove all of the effects 491–495, DOI: 10.1038/s41586-019-1040-7 (2019).
of the radiation, due to both the presence of internal radiation
4. Lutchyn, R., Glazman, L. & Larkin, A. Kinetics of the
Pint and the imperfect efficiency of the shield.
superconducting charge qubit in the presence of a quasi-
particle. Phys. Rev. B 74, 064515 (2006).
Discussion 5. Martinis, J. M., Ansmann, M. & Aumentado, J. Energy
The first reported results of the systematic operation of su- decay in superconducting josephson-junction qubits from
perconducting transmon qubits under intentionally elevated nonequilibrium quasiparticle excitations. Phys. Rev. Lett.
levels of ionizing radiation clearly show a deleterious effect on 103, 097002 (2009).
the performance of the qubits. We quantitatively determined 6. Jin, X. et al. Thermal and residual excited-state popula-
the impact of radiation power density on the qubit energy- tion in a 3d transmon qubit. Phys. Rev. Lett. 114, 240501
relaxation time and showed that naturally occurring ionizing (2015).
radiation in the laboratory creates excess quasiparticles in
superconductors, reducing the qubit energy-relaxation time. 7. Serniak, K. et al. Hot nonequilibrium quasiparticles in
By employing shielding techniques commonly applied in transmon qubits. Phys. Rev. Lett. 121, 157701 (2018).
neutrino physics and the search for dark matter,32, 34–39 we 8. Aumentado, J., Keller, M. W., Martinis, J. M. & Devoret,
improved the energy-relaxation rate of our qubits by approx- M. H. Nonequilibrium quasiparticles and 2 e periodic-
imately 0.2%. Although a rather small improvement for to- ity in single-cooper-pair transistors. Phys. Rev. Lett. 92,
day’s qubits, which are currently limited by other relaxation 066802 (2004).
mechanisms, a simple model of the ionization generation of 9. Taupin, M., Khaymovich, I., Meschke, M., Mel’nikov, A.
quasiparticles indicates that transmon qubits of this design & Pekola, J. Tunable quasiparticle trapping in meissner
will need to be shielded against ionizing radiation – or other- and vortex states of mesoscopic superconductors. Nat.
wise redesigned to mitigate the impact of its resulting quasi- Commun. 7, 10977 (2016).
particles – in order to reach energy relaxation times in the
10. Serniak, K. et al. Direct dispersive monitoring
millisecond regime. Additionally, as was recently done with
of charge parity in offset-charge-sensitive transmons.
resonators19 , locating qubit systems deep underground where
arXiv:1903.00113 (2019).
cosmic rays and cosmogenic activation are drastically reduced
should provide benefits for advancing quantum computing 11. Córcoles, A. D. et al. Protecting superconducting qubits
research. from radiation. Appl. Phys. Lett. 99, 181906 (2011).
Our results also shed light on a decades-old puzzle, namely, 12. Barends, R. et al. Minimizing quasiparticle generation
the origin of non-equilibrium quasiparticles observed broadly from stray infrared light in superconducting quantum
in experiments with superconductors at milliKelvin temper- circuits. Appl. Phys. Lett. 99, 113507 (2011).
atures. Our measurements indicate that ionizing radiation 13. Bespalov, A., Houzet, M., Meyer, J. S. & Nazarov, Y. V.
accounts for a significant fraction of the residual excess quasi- Theoretical model to explain excess of quasiparticles in
particle levels observed in otherwise carefully filtered exper- superconductors. Phys. Rev. Lett. 117, 117002, DOI:
iments, with impact on many fields that employ supercon- 10.1103/PhysRevLett.117.117002 (2016).
ducting circuitry. For example, excess quasiparticles reduce
the sensitivity of kinetic inductance detectors and transition 14. Nakamura, Y., Pashkin, Y. A. & Tsai, J. S. Coherent
edge sensors used in astronomy. Additionally, quasiparticle control of macroscopic quantum states in a single-cooper-
poisoning is a major impediment facing topologically pro- pair box. Nature 398, 786–788 (1999).
tected Majorana fermions. Identifying ionizing radiation as a 15. Oliver, W. D. & Welander, P. B. Materials in supercon-
dominant source of excess quasiparticles is a first step towards ducting quantum bits. MRS Bull. 38, 816–825 (2013).
6/2416. Kjaergaard, M. et al. Superconducting qubits: Current 32. Aguilar-Arevalo, A. et al. Search for low-mass WIMPs
state of play. Annu. Rev. Condens. Matter Phys. 11, 369– in a 0.6 kg day exposure of the DAMIC experiment at
395, DOI: 10.1146/annurev-conmatphys-031119-050605 SNOLAB. Phys. Rev. D 94, 082006, DOI: 10.1103/
(2020). PhysRevD.94.082006 (2016).
17. Gottesman, D. Theory of fault-tolerant quantum computa- 33. Dicke, R. The measurement of thermal radiation at mi-
tion. Phys. Rev. A 57, 127–137, DOI: 10.1103/PhysRevA. crowave frequencies. Rev. Sci. Instruments 17, 268–275
57.127 (1998). (1946).
18. Grünhaupt, L. et al. Loss mechanisms and quasiparticle 34. Agnese, R. et al. Projected sensitivity of the SuperCDMS
dynamics in superconducting microwave resonators made SNOLAB experiment. Phys. Rev. D 95, 082002, DOI:
of thin-film granular aluminum. Phys. Rev. Lett. 121, 10.1103/PhysRevD.95.082002 (2017).
117001 (2018). 35. Alduino, C. et al. First Results from CUORE: A Search
19. Cardani, L. et al. Reducing the impact of radioactivity on for Lepton Number Violation via 0νβ β Decay of 130 Te.
quantum circuits in a deep-underground facility. arXiv Phys. Rev. Lett. 120, 132501, DOI: 10.1103/PhysRevLett.
preprint arXiv:2005.02286 (2020). 120.132501 (2018).
20. Day, P. K., LeDuc, H. G., Mazin, B. A., Vayonakis, A. & 36. Agostini, M. et al. Improved Limit on Neutrinoless
Zmuidzinas, J. A broadband superconducting detector Double-β Decay of 76 Ge from GERDA Phase II. Phys.
suitable for use in large arrays. Nature 425, 817–821, Rev. Lett. 120, 132503, DOI: 10.1103/PhysRevLett.120.
DOI: 10.1038/nature02037 (2003). 132503 (2018).
21. Irwin, K. D., Hilton, G. C., Wollman, D. A. & Martinis, 37. Gando, A. et al. Search for Majorana Neutrinos Near the
J. M. X-ray detection using a superconducting transition- Inverted Mass Hierarchy Region with KamLAND-Zen.
edge sensor microcalorimeter with electrothermal feed- Phys. Rev. Lett. 117, 082503, DOI: 10.1103/PhysRevLett.
back. Appl. Phys. Lett. 69, 1945–1947 (1996). 117.082503 (2016).
22. Albrecht, S. et al. Transport signatures of quasiparticle 38. Aalseth, C. E. et al. Search for Neutrinoless Double-β
poisoning in a majorana island. Phys. Rev. Lett. 118, Decay in 76 Ge with the Majorana Demonstrator. Phys.
137701 (2017). Rev. Lett. 120, 132502, DOI: 10.1103/PhysRevLett.120.
23. Koch, J. et al. Charge insensitive qubit design derived 132502 (2018).
from the cooper pair box. Phys. Rev. A 76, 042319, DOI: 39. Albert, J. B. et al. Search for Neutrinoless Double-Beta
10.1103/PhysRevA.76.042319 (2007). Decay with the Upgraded EXO-200 Detector. Phys.
24. Krantz, P. et al. A quantum engineer’s guide to supercon- Rev. Lett. 120, 072701, DOI: 10.1103/PhysRevLett.120.
ducting qubits. Appl. Phys. Rev. 6, 021318 (2019). 072701 (2018).
25. Klimov, P. et al. Fluctuations of energy-relaxation times
Acknowledgements
in superconducting qubits. Phys. Rev. Lett. 121, 090502
(2018). The authors thank Kyle Serniak and Roni Winik for many
useful discussions and comments on the manuscript; Greg
26. Wang, C. et al. Measurement and control of quasiparticle
Calusine, Kyle Serniak, and Uwe von Luepke for designing
dynamics in a superconducting qubit. Nat. Commun. 5,
and pre-characterizing the qubit samples; Grecia Castelazo for
5836 (2014).
assistance with operating the lead shield; Mitchell S. Galanek,
27. Kozorezov, A. et al. Quasiparticle-phonon downconver- Ryan Samz, and Ami Greene for assistance in oversight of
sion in nonequilibrium superconductors. Phys. Rev. B 61, radiation source use; Michael R. Ames and Thomas I. Bork at
11807 (2000). the MIT Reactor (MITR) for production of the 64 Cu source;
28. Kozorezov, A., Wigmore, J., Martin, D., Verhoeve, P. & Mital A. Zalavadia for providing the NaI detector.
Peacock, A. Electron energy down-conversion in thin This work was supported in part by the U.S. Department
superconducting films. Phys. Rev. B 75, 094513 (2007). of Energy Office of Nuclear Physics under an initiative in
29. Gustavsson, S. et al. Suppressing relaxation in supercon- Quantum Information Science research (Contract award # DE-
ducting qubits by quasiparticle pumping. Science 354, SC0019295, DUNS: 001425594); by the U.S. Army Research
1573–1577, DOI: 10.1126/science.aah5844 (2016). Office (ARO) Grant W911NF-14-1-0682; by the ARO Multi-
University Research Initiative W911NF-18-1-0218; by the
30. Allison, J. et al. Geant4 developments and applications. National Science Foundation Grant PHY-1720311; and by the
IEEE Transactions on Nucl. Sci. 53, 270–278, DOI: 10. Assistant Secretary of Defense for Research and Engineering
1109/TNS.2006.869826 (2006). via MIT Lincoln Laboratory under Air Force Contract No.
31. Agostinelli, S. et al. Geant4 — a simulation toolkit. Nucl. FA8721-05-C-0002. A.K. acknowledges support from the
Instruments Methods A 506, 250–303, DOI: 10.1016/ NSF Graduate Research Fellowship program. Pacific North-
S0168-9002(03)01368-8 (2003). west National Laboratory is operated by Battelle Memorial
7/24Institute under Contract No. DE-AC05-76RL01830 for the
U.S. Department of Energy.
Author contributions statement
This research project was a collaboration between experts in
quantum systems (A.P.V., A.H.K., F.V., S.G., and W.D.O.)
and nuclear physics (J.A.F., J.L.O., B.A.V., B.L., and A.S.D).
Simulations of background radiation and the impact of the
radiation shielding were performed by A.S.D., B.L., and J.L.O.
D.K., A.M., B.N., and J.Y. fabricated the qubit chips. The
qubit experiments and data analysis were performed by A.P.V.,
A.H.K., and F.V. All authors contributed to writing and editing
of the Letter.
Competing interests
The authors declare no competing interests.
Data Availability
The data that support the findings of this study are available
from the corresponding author upon reasonable request and
with the permission of the US Government sponsors who
funded the work.
Code Availability
The code used for the analyses is available from the corre-
sponding author upon reasonable request and with the permis-
sion of the US Government sponsors who funded the work.
Additional information
Supplementary Information is available for this paper.
Correspondence and requests for materials should be ad-
dressed to A.P.V and J.L.O.
8/24Methods ters. The reported energy relaxation times are median values
during the lead-shield experiment. The values for Q1 and Q2
Measurement setup
differ from those reported for 64Cu measurements due to their
Extended Data Fig. 1a shows the measurement setup used fluctuation over time.
to measure the energy-relaxation times of the qubits. The
qubit control pulses are created using a Keysight PXI arbitrary
Production of 64Cu source
waveform generator. The in-phase and quadrature pulses are
up-converted to the qubit transition frequency using single The 64 Cu radiation source was created by neutron activation of
sideband IQ modulation. The readout pulses are created simi- natural copper via the capture process 63Cu (n,γ) 64Cu. Given
larly. The control and readout pulses are combined and sent its 12.7 hour half-life, 64Cu is well suited for deployment in
to the sample through a single microwave line. There is a a dilution refrigerator, since it takes 72–100 hours to cool to
total of 60 dB attenuation in the line to reduce the thermal base operating temperature. The irradiation took into account
noise from the room temperature and the upper stages of the the anticipated 64 Cu decay during the cool-down period, by
dilution refrigerator. In the control line there are eccosorb specifically irradiating at higher levels of 64 Cu than used in
filters before and after the sample, which further reduce the the qubit study and then allowing the foils time to decay to
infrared radiation (thermal photons) reaching the qubit. The lower levels of activity.
control line is inductively coupled to readout resonators R1 Two copper disks created from the same McMaster-Carr
and R2. foil were irradiated with neutrons at the MIT Reactor (MITR).
The control pulses are applied to the qubit via the read- The two foils are referred to as sample “A” and “A-Ref”. The
out resonator, which filters the signal at the qubit frequency. irradiated sample “A” was installed in the dilution refrigerator
Nonetheless, by using sufficiently large amplitude pulses, the with the two qubits described in this study, while “A-Ref” was
qubits can be excited in 25 ns. kept to determine the level of radioactive activation products.
The qubit state is determined using dispersive readout via a Each of the foils were 7.5 mm in diameter and 0.5 ± 0.1 mm
circuit QED architecture40 . The dispersive readout is based thick and had a mass of 178.5 mg and 177.6 mg, respectively.
on the resonator frequency slightly changing depending on the The total neutron irradiation exposure was 7 minutes and
state of the qubit. The change can be detected by using a sin- 14 seconds in duration. Using a high purity gamma-ray spec-
gle measurement tone near the resonator resonance frequency trometer, the “A-Ref” sample was used to determine the 64 Cu
and measuring the transmitted signal in the microwave line. activation level. We determine the activity of sample “A” to
The measurement signal is boosted using a chain of amplifiers. be (162 ± 2) µCi at 9:00 AM ET May 13, 2019. This activity
The first amplifier employed is a near-quantum-limited travel- is based on measurements of 64 Cu’s 1346 keV gamma-ray.
ing wave parametric amplifier (TWPA), which has a very low Despite the high copper purity (99.99%), trace elements
noise temperature and gain up to 30 dB. As with all parametric with high neutron cross-sections can also be activated from
amplifiers, the TWPA requires a pump tone, which is driven the neutron irradiation process. The same HPGe counter was
by a signal generator at room temperature. The measurement used to determine the presence of other trace elements, the
signal is further amplified by a LNF HEMT amplifier, which results of which are reported in Extended Data Table 6a.
is thermally anchored to the 3 K stage of the refrigerator.
At room temperature, there is a final pre-amplifier followed Operation of NaI detector
by a heterodyne detector. The down-converted in-phase and A standard commercial NaI detector measures energy de-
quadrature intermediate-frequency (IF) signals are digitized posited in the NaI crystal through the scintillation light cre-
using a Keysight PXI digitizer (500 MHz sampling rate) and ated when γ- or x-rays scatter atomic electrons in the crystal.
then further digitally demodulated using the digitizer FPGA to The magnitude of the scintillation light signal, measured by
extract the measured qubit state. Measurement results are en- a photomultiplier tube (PMT), is proportional to the energy
semble averaged over many such trials to infer the occupation deposited in the NaI crystal by the incident radiation. As
probability of the qubit being in a given state. the specific energy of γ- or x-rays are indicative of the ra-
In the experiments, we used one sample with 2 transmon dioactively decaying nucleus, an energy spectrum measured
qubits, and a second sample with 5 transmon qubits. The by the NaI detector can be used to determine the relative
qubits were fabricated using optical and electron beam lithog- contributions of ionizing radiation in the laboratory due to
raphy. By construction, the structure of our qubits is kept different naturally occurring radioactive isotopes. In a normal
simple and pristine – MBE-grown aluminum on top of high- laboratory environment, the dominant naturally occurring ra-
resistivity silicon – to reduce defects that cause decoherence. dioactive nuclei consist of isotopes in the uranium (238 U) and
The Josephson junctions have an additional layer of aluminum thorium (232 Th) decay chains as well as 40 K. These features
oxide in between the aluminum leads and are fabricated using are identified in Fig. 3a).
double-angle shadow evaporation in another UHV evaporator It is possible to reduce the high voltage applied to the
(different from the MBE). The fabrication is similar to that PMT, effectively reducing the gain on the scintillation light
described in reference 41. signal from the NaI detector. This enables the measurement of
Extended Data Table 1e shows the relevant qubit parame- ionizing cosmic rays – and the secondary radiation produced
9/24by them – as determined mainly by spectral features above 2.7 resolution function as a function of energy:
MeV42 (see Extended Data Fig. 6e for the measured spectrum).
We can fit the known spectrum of cosmic rays to the measured σ 2 = σ02 + σ12 E + σ22 E 2 (7)
spectrum to find the cosmic ray flux in the laboratory. The fit
is shown in Extended Data Fig. 6e. Note that below 2.7 MeV Each of the energy scale and resolution coefficients is left
the large difference between the measurement and the fit is free in the fit, as well as the flux of each isotope, for a total
due to the radiation from nuclear decays, as shown in Fig. 3a. of 9 free parameters. The result for a fit over the range 0.2
- 2.9 MeV is show in Fig. 3a. The fit is much better when
performed over a narrower region of the data. This could be
Radiation transport simulations and normalization improved with a more sophisticated response function, but
To estimate the power density imparted into the qubits by we address the issue by performing the fit separately over
radiation, we developed a radiation transport simulation. The three energy ranges: 0.2-1.3 MeV, 1.3-2.9 MeV, and 0.2-2.9
simulation was performed using the Geant4 toolkit31 which is MeV, and taking the difference as a systematic uncertainty.
designed for modeling the interaction of radiation and parti- This result is reported in the first line of Extended Data Table
cles with matter. The simulation geometry included a detailed 6b. In total the uncertainty in the fits contributes 8% to the
model of the layers of the Leiden cryogenics CF-CS81 dilu- systematic uncertainty. The simulated energy deposition effi-
tion refrigerator, the mounting fixtures and containment for ciency for each external isotope is approximately equal to 0.04
the qubit, and the activated copper foil as it was located for keV/s/mm3 per cm−2 s−1 , which yields a total power density
the experiment. The qubit chip is modelled as a 380 µm thick from environmental gammas of 0.060 ± 0.005 keV/s/mm3 .
piece of silicon with a 200 nm aluminum cladding. Input The same NaI detector, operated at lower gain, is used to es-
power density is estimated by measuring simulated energy timate the cosmic ray flux, see Extended Data Fig. 6e. Cosmic
deposited into the aluminum layer. Three separate radiation ray muons are simulated in a 1 m square plane above the detec-
source terms are considered: 64Cu and the other isotopes in tor, using the CRY package to generate the energy spectrum
the activated copper foil, naturally occurring background radi- and angular distribution43 . The muon flux taken directly from
ation primarily from the concrete walls of the laboratory, and CRY is 1.24 × 10⁻² cm−2 s−1 . A fit to the low-gain NaI data,
cosmic ray muons. using the same convolutional technique as for gammas, yields
To estimate the effect of isotopes in the copper, we make (9.7±0.1)×10−3 cm−2 s−1 , or about 20% lower than the CRY
use of Geant4’s radioactive decay simulation capabilities. In- value. The same simulation gives an energy deposition effi-
stances of each isotope are distributed uniformly throughout ciency in the qubits of (4.3 ± 0.2) keV/s/mm3 per cm−2 s−1
the simulated foil volume. Geant4 samples the available decay of cosmic ray muon flux. This, in turn, yields a cosmic-ray
modes for that isotope with appropriate branching fractions, induced power density of (0.042 ± 0.002) keV/s/mm3 .
and generates the corresponding secondary particles (gammas, Throughout this work, we have based our analysis on the
betas, positrons, etc), which are then tracked until they have absorbed power density in the aluminum. However, radiation
deposited all their energy. By tallying up these events, we will also interact and deposit energy in the silicon substrate.
can estimate the average input energy density into the qubit How much of this energy, if any, reaches the aluminum layer
substrate per decay, or equivalently the average power density and is converted to quasiparticles is unknown, in part be-
per unit of isotope activity. The total simulated spectrum at cause we do not know the relevant coupling rates between
various times during the qubit measurement campaign are silicon and aluminum or the various recombination rates of
shown in Fig. 3b. the quasiparticles. This motivated our use of a calibrated 64Cu
To understand the background ionizing radiation levels source, which we use to parameterize the net effect. In fact,
present in the MIT laboratory where all qubit devices are as we show below, whether we consider aluminum only, or
operated, a 300 × 300 NaI scintillator detector was deployed near aluminum plus silicon, the difference in the net result changes
the dilution refrigerator where the qubit measurements were by at most order unity. This somewhat counterintuitive result
made. The detector was represented in the radiation transport arises, because the power densities in aluminum and silicon
simulation as a bare NaI cylinder (not including any housing, are approximately the same, and because the 64Cu captures
photomultiplier tube, etc). Gammas with an energy spectrum the net effect in either case.
following the equilibrium emissions of the most common Although 64Cu captures the net effect well, small differ-
radioactive isotopes ( 238U, 232Th, and 40K) are simulated ences arise due to how the radiation is emitted and absorbed.
starting in a sphere surrounding the NaI detector with an For example, in comparison to highly penetrating radiation,
isotropic initial direction. A small number of simulations were 64Cu deposits a larger fraction of its emitted energy into the
run with different-sized initial locations to evaluate the impact aluminum, because a larger fraction is emitted as betas. If the
of this parameter, yielding a 10% systematic uncertainty. quasiparticle density is dominated by energy from the silicon
In order to fit to the measured data, the simulated energy rather than the aluminum, the relative strength of 64Cu to the
deposits must be “smeared” to account for the detector’s finite other trace activated isotopes would be approximately 60%
energy resolution. We used a quadratic energy scaling func- lower. The external power density induced from environmen-
tion to map energy to measured ADC counts, and a quadratic tal gammas is approximately 20% lower, while the cosmic
10/24ray power density is 13% higher, for a net 7% total increase Estimating the internal radiation rate Pint
in external power. The lead shielding effectiveness (η) is An accurate estimate of the internal radiation rate Pint is im-
also approximately 15% higher for the silicon than aluminum. portant for comparing the feasibility of the shielding effect
By choosing aluminum, we are taking the most conservative of the lead shield to the estimated effect of the external radi-
estimate for the impact of environmental radiation on qubit ation power density on the qubit energy-relaxation rate δ Γ
energy relaxation. extracted from the 64Cu experiment. A simple way for making
We now show that these differences are at most an effect of the estimate is to extract it from the fit to the data in Fig. 3c.
order unity. If, for example, the quasiparticle generation rate is However, the accuracy of the estimate is relatively low, since
dominated by the total absorbed power in the silicon substrate, it is difficult to separate Pint from the energy-relaxation rate
we can estimate the maximal relative error in the estimate of the qubit due to sources other than quasiparticles, Γother .
of Γ1 by comparing the ratios of the power densities of the In principle, it is possible to distinguish the two sources, be-
external radiation Pext absorbed in the aluminum film and the cause
√ according to Eq. (4), the scaling of Γ1 is proportional to
silicon substrate to the ratios of power densities induced by Pext + Pint + Psrc whereas the internal energy-relaxation rate
the 64Cu source as Γother contributes linearly to Γ1 , see Eq. (2). In practice, this
s is quite inaccurate, especially if quasiparticle loss is not the
Al (t)
Psrc Si
Pext dominating loss-mechanism.
fc = Si (t)
× Al
≈ 1.6. (8) Instead, we employ the shielding experiment to calculate
Psrc Pext
an upper bound for Pint . In the limit of Pint
Pext , we can
This would would increase our estimate of the effect of the calculate an asymmetry parameter for the energy-relaxation
external radiation on the qubit q
energy-relaxation rate from times in the shield up or down positions,
(Q1) (Q1) (Q1)
Γ1 = 1/(4 ms) to Γ1 = a ωq Pext fc ≈ 1/(2.5 ms). Γd,i u,i
1 − Γ1 ηu − ηd Pext
See Supplementary material for the derivation of the above Ai = 2 ≈ , (10)
Γ1d,i + Γu,i
1
2 Pint + Γ√other
a ωq
formula. Note that the calculation is an upper-limit estimation,
which would be reached only if the total phonon coupling be- where the index i refers to different rounds of the shield
tween the silicon substrate and the aluminum is much stronger up/down experiment. The internal radiation rate Pint can be
than the coupling between the sample and the sample holder. estimated using the experimentally measured median asym-
metry parameter as
Measurement of the qubit energy relaxation rate
At the beginning of the measurement, all the qubits are initial- (η u − η d )
P̃int ≈ Pext = 7.9 keV mm−3 s−1 , (11)
ized in their ground states. Due to the finite temperature of 2hAi
their environment and hot quasiparticles6, 7 , there is a small
excited state population, approximately 1.7% for these qubits where P̃int = Pint + aΓ√other
ωq , and hAi ≈ 0.0028 (see Extended
and their qubit transition frequencies. This corresponds to an Data Fig. 8). This gives the upper bound for Pint . Due
effective temperature Teff ≈ 40 mK6 . At this temperature, the to the other relaxation mechanisms, the actual value of Pint
thermal quasiparticle population can be estimated to be is lower. For example, Γother = 1/200 µs−1 would yield
r Pint ≈ 1.6 keV mm−3 s−1 for the parameters of Q1. Here we
kB T − k ∆T emphasize that the estimate of the asymmetry parameter is
thermal
xqp = 2π e B ≈ 7 × 10⁻²⁴ . (9) based on the data gathered on all the seven qubits employed in
∆
the lead shield experiment, with all the qubits having different
It is interesting to note that the quasiparticle density xqp ≈ (fluctuating) values of Γother .
7 × 10⁻⁹ due to ionizing radiation (inferred from our 64Cu
measurements) would correspond to an equilibrium quasipar- Efficiency of the lead shield
ticle temperature T ≈ 120 mK – consistent with the tempera- The reduction factor of external γ-radiation by the lead shield
ture below which qubit parameters such as T1 stop following was evaluated using the radiation transport simulation de-
an equilibrium quasiparticle model in previous experiments scribed previously. In the simulation, γ-rays with energies
(around 150 mK, see for example References 7 and 29). drawn from the equilibrium emission spectra for 238U, 232Th,
The qubit energy relaxation rate Γ1 is measured by first and 40K were generated isotropically from the surface of a
driving the qubits to their first excited state using a microwave sphere with 2.4 m diameter, centered on the qubits. The
π-pulse, see Extended Data Fig. 3b. The state of all the sphere comletely enclosed the model for the lowered lead
qubits is measured simultaneously after time t, which gives shield and the dilution refrigerator. The fraction of flux Φ
an estimate for their residual excited-state population p(t). reaching a smaller 17 cm diameter sphere (fully inside the
By changing t, the time evolution of the populations can be DR) was recorded. Extended Data Table 6b shows the results
determined. The model described in Eq. (2) in the main text for the no shield, shield down, and shield up, as well as the
can be fitted to the measured data to find the energy-relaxation individual shield efficiency values η u = 1 − (Φu /Φno shield )
rate Γ1 of the qubits. and η d = 1 − (Φd /Φno shield ).
11/24A similar simulation was performed to calculate the effi- frequency of 1/(15 ± 1min) is 3.4 × 10⁴ µs2 Hz−1 . The noise
ciency of the lead shield against cosmic rays. As expected, the power in the measurement can be estimated by integrating the
lead shield is ineffective at blocking cosmic rays, but works spectral density over the noise bandwidth, which for the lock-
well against γ-rays originating from the nuclear decay events in measurement yields 49 µs2 (shaded red area in Extended
in the laboratory, see Extended Data Table 6c. Data Fig. 3d). If all the data was gathered sequentially, the
To validate the simulations, the NaI detector was operated noise power can be estimated to be 718 µs2 (gray shaded are
separately inside the lead shield at the approximate location of in Extended Data Fig. 3d), over an order of magnitude higher
the qubits in the shield-up configuration. This configuration than in the Dicke experiment.
was also simulated, and the output fit to the measured spec- We used the median to estimate the net change of δ Γ1 (be-
trum using the same fit procedure as for the bare NaI. If the tween shield-up and shield-down configurations) to reduce
simulation and fit procedure are accurate, both fits should give sensitivity to individual measurement outliers. The quasipar-
the same values for the input flux. The results are reported in ticle contribution to the energy relaxation rates of the qubits
the first rows of Extended Data Table 6b. The results for U depends on their frequencies according to Eq. (5), and there-
and Th are consistent, while the values for K differ by about fore we have normalized the changes in the energy relaxation
2.5σ . It may be that the lead itself has a high level of 40K, but rates toqthe frequency of Q1 by multiplying by a conversion
we treat this as a systematic uncertainty, which is 7% of the (Q1)
factor ωq /ωq .
(Qi)
total gamma flux.
We neglected a small percentage of the total data points
Extended Data Fig. 1b-d shows a diagram of the lead shield where Γu1 or Γd1 were less than 1/30 µs−1 or their difference
and its dimensions. was more than 10 standard deviations of all the measured dif-
ferences, as these tended to indicate suspect rates derived from
Statistical analysis of the lead shield experiment poorly resolved decay functions. We then calculated the 95%
Since there are significant fluctuations in the internal energy confidence intervals for δ Γ1 using the normal approximation
relaxation rates Γother of the qubits, we performed a careful for the confidence interval of the sample median44 .
A/B test to verify that the effect of the lead shield on the qubit We applied the Wilcoxon signed-rank test to determine
energy-relaxation time was not due to statistical error. In if the median of the two distributions (corresponding to the
the measurement of the energy relaxation rates of the qubits, shield-up versus shield-down configurations) differ in a statis-
there is uncertainty both due to the measurement accuracy tically significant manner. This is a non-parametric test and
and the fluctuations and drifts in the energy relaxation rates can be used for data that are not normally distributed. For
over time. To reduce the uncertainty due to the measurement δ Γ1 , the single-sided Wilcoxon signed-rank test gives a p-
accuracy, we measured the energy relaxation rates N times in value p = 0.006 for the null hypothesis that the median of the
each step of the A/B test. After N measurements the position energy relaxation rates with the shield is the same or higher
of the lead shield was swapped (up versus down) and we than without the shield. The test statistic w ≈ 25 000 000 with
performed another N measurements. This cycle was repeated a sample size of 9846. For a p-value
0.05, we can reject
65 times with a sample containing qubits Q1 and Q2. To this null hypothesis and conclude that the shield reduces the
accelerate data acquisition, we installed a second sample with energy-relaxation rate.
5 qubits (Q3-Q7) and repeated the measurement cycle an We performed several tests to verify the correctness of our
additional 85 times. We used N = 50 for qubits Q1 and Q2, statistical analysis. First, we checked that the result is not
and N = 10 for qubits Q3-Q7, see Extended Data Fig. 3a sensitive to the post-processing we performed on the data.
and c for the measured energy-relaxation rates. The median The first panel of Extended Data Fig. 7a shows the p-value of
energy-relaxation times of the qubits are listed in the Extended the Wilcoxon signed-rank test for a range of different cutoff
Data Table 1e. parameters. The p-value remains low for all the sensible
In the spirit of a Dicke radiometer experiment, performing parameters we tested, verifying that the finding is not an
repeated short measurement cycles was crucial for reducing artifact of post-processing or parameter selection. The median
the uncertainty in the relaxation rates due to drifts that oc- value is even less sensitive to the post-processing, shown
curred on time scales longer than the cycle period. The drift in the lower-left panel. The blue diamond in the upper-left
has been attributed in part to fluctuating two-level systems in corner shows the point where no post-processing is done. The
dielectrics close to the qubit and in the junction region. How- blue circle shows the values which we use in the main text,
ever, by raising and lowering the shield often enough (every T1cutoff = 30 µs and ncutoff
σ = 10.
50th measurement for qubits Q1 and Q2, and every 10th mea- Next, we tried shuffling the data by comparing the energy
surement for qubits Q3-Q7) the slow drift is mostly cancelled. relaxation rates of the measurements to the next measurement
Extended Data Fig. 3d shows the spectral density of the T1 without moving the shield. In this case, we would expect
noise for qubits Q3, Q4, Q6, and Q7. The noise power den- the signal to completely vanish, and the null hypothesis to be
sity approximately follows a power law S = const/ f α with manifestly true. The result is shown in the middle column of
α ≈ 1.5. The fit to the model is shown with solid orange Extended Data Fig. 7a. In this case, the p-value is close to
line. The noise power density at the lead shield up/down cycle 1, which implies that we must accept the null-hypothesis that
12/24You can also read