Solid Fuel from Oil Palm Biomass Residues and Municipal Solid Waste by Hydrothermal Treatment for Electrical Power Generation in Malaysia: A ...
←
→
Page content transcription
If your browser does not render page correctly, please read the page content below
sustainability
Review
Solid Fuel from Oil Palm Biomass Residues and
Municipal Solid Waste by Hydrothermal Treatment
for Electrical Power Generation in Malaysia:
A Review
Norfadhilah Hamzah 1,2, * , Koji Tokimatsu 1 and Kunio Yoshikawa 1
1 Department of Transdisciplinary Science and Engineering, Tokyo Institute of Technology, 4259 Nagatsuta,
Midori, Yokohama 226-8503, Japan; tokimatsu.k.ac@m.titech.ac.jp (K.T.);
yoshikawa.k.aa@m.titech.ac.jp (K.Y.)
2 Faculty of Electrical and Electronic Engineering Technology, Technical University of Malaysia Malacca,
Hang Tuah Jaya, Durian Tunggal, Malacca 76100, Malaysia
* Correspondence: dyla001@gmail.com or hamzah.n.aa@m.titech.ac.jp
Received: 12 January 2019; Accepted: 11 February 2019; Published: 18 February 2019
Abstract: Malaysia generated 156,665 gigawatt-hours (GWh) of electricity in 2016 of which the biggest
share of 48.4% was sourced from coal and coke. Malaysia coal consumption was met by 90.5% of
imported coal due to high demand from the power sector. Malaysia also has a vast biomass resource
that is currently under-utilised for electricity generation. This paper reviews the potential of oil palm
residues and municipal solid waste (MSW) for alternative coal replacement employing hydrothermal
treatment (HTT). In 2017, about 51.19 million tonnes (Mt) of oil palm waste was available with 888.33
peta-joule (PJ) energy potential to generate 88.03 terawatt-hours (TWh) electricity from oil palm
fronds (OPF) and oil palm trunks (OPT), empty fruit bunch (EFB), mesocarp fibre (MF), palm kernel
shell (PKS) and palm oil mill effluent (POME). Meanwhile, the MSW energy potential and electricity
generation potential was estimated at 86.50 PJ/year and 8.57 TWh/year, respectively. HTT with
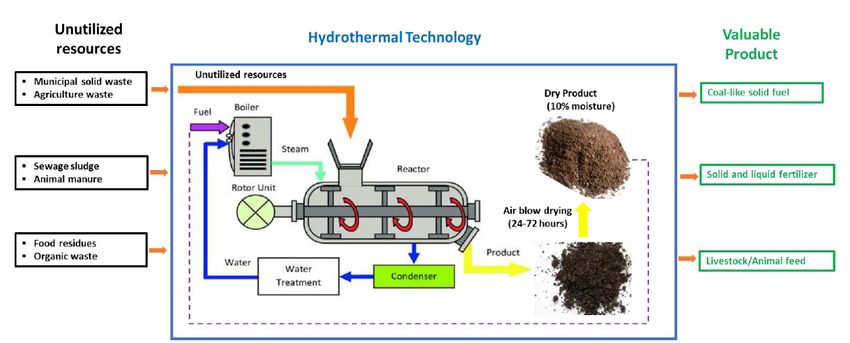
washing co-treatment eliminates the use of drying for converting range of biomass and MSW into
clean solid fuel known as hydrochar. The hydrochar increased in caloric value with lower moisture,
Potassium (K) and Chlorine (Cl) contents. These value-added fuels can be used as coal alternative
and reduce dependency on imported coal for energy security in Malaysia.
Keywords: solid fuel; energy potential; oil palm residues; municipal solid waste; hydrothermal
treatment; renewable energy
1. Introduction
Malaysia is located in the South East Asia region with a total area of 330,345 km2 . The country
is separated by the South China Sea into western coast Peninsular Malaysia which made of 11 states
and 2 federal territories with area of 131,990 km2 and the eastern coast of Sarawak and Sabah with an
area of 124,451 km2 and 73,904 km2 , respectively. Out of 32.02 million population in 2017, 79% of them
were located in Peninsular Malaysia followed by 12% and 9% in Sabah and Sarawak, respectively.
The country has an equatorial climate and is extremely hot and humid almost all year round [1,2].
Malaysia is categorized as a middle-income country with the primary energy supply dependent on
fossil fuels. Production of electricity in Peninsular Malaysia, Sarawak and Sabah are monopolized
by three (3) largest states-owned utility companies namely Tenaga Nasional Berhad (TNB), Sarawak
Energy Berhad (SEB) and Sabah Electricity Sdn. Berhad (SESB) respectively besides independent
Sustainability 2019, 11, 1060; doi:10.3390/su11041060 www.mdpi.com/journal/sustainability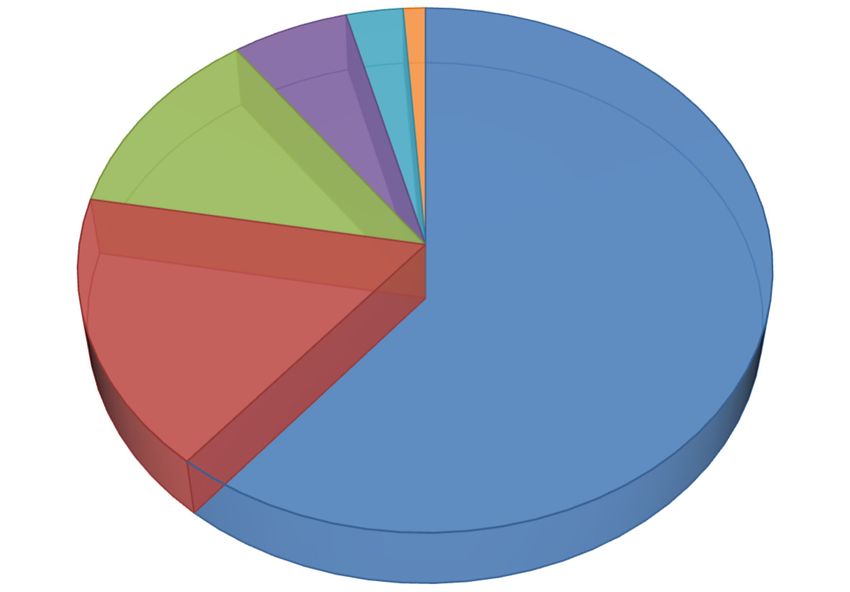
Sustainability 2019, 11, 1060                                                                       2 of 23

power producers (IPPs). Peninsular Malaysia shares electricity interconnection systems with Thailand
and Singapore and gas pipe link with Thailand, Singapore and Indonesia [3].
      The total primary energy supply increased 3.6% to 93,395 ktoe in 2016. The supply from natural
gas decreased to 40.7% from 43.6% while the shares from crude oil and petroleum products increased
slightly from 32.3% in 2015 to 33.5% in 2016. The share of coal and coke registered a growth at 20.2%
compared to 19.3% in 2015 due to strong demand from the power sector for imported coal and coke.
The share of hydro and renewables has also increased from 4.7% to 5.6% in 2016 [1]. The installed
capacity of power plants in 2016 was 8.5% increased from 30,439 megawatt (MW) in 2015 to 33,023 MW
in 2016. The installed capacity from natural gas was the highest at 42.6% (14,074.5 MW) followed by
coal at 28.9% (9546 MW) and hydro at 8.6% (6128.1 MW). The share from diesel or Medium Fuel Oil
(MFO) was at 6.3% (2090.3 MW), biomass was 2.2% (742.4 MW), solar at 0.9% (289.6 MW), others at
0.4% (117.3 MW) and biogas at 0.1% (34.6 MW) [1].
      Gross electricity generation and consumption is estimated at 156,665 GWh and 144,024 GWh,
respectively. The total energy input to power stations for electricity generation increased 6.7% in 2016
at 35,348 kilo ton of oil equivalent (ktoe) as compared to 33,134 ktoe in 2015. Coal and coke remained
as the main energy source for electricity generation with a share of 48.4% (17,101 ktoe), followed
by natural gas at 37.5% (13,260 ktoe), hydropower at 12.7% (4499 ktoe), diesel and fuel oil at 0.9%
(320 ktoe) and renewables at 0.5% (168 ktoe). For the electricity generation mix in 2016, the share of
coal and coke constituted 46.0%, followed by natural gas at 39.7%, hydropower at 13.3%, oil at 0.7%
and the remaining 0.4% by renewables [1]. Coal dominates the electricity generation mix in Peninsular
Malaysia, while for Sabah and Sarawak the biggest share come from natural gas and hydroelectric
consecutively. It is estimated the electricity demand increasing more rapidly than overall energy use at
4% per year average to reach 400 TWh until 2040.
      Malaysia coal reserves and production in 2016 was 1938.37 Mt and 2.414 million metric tonnes
consecutively where most of the coal mining activities located in Sarawak, Sabah and Selangor.
From 18,886 ktoe of coal consumption in 2016, 90.5% (17,101 ktoe) used in power stations and 9.5%
(1785 ktoe) for industry. In 2016, Malaysia coal consumption was met by 90.5% (17,186 ktoe) of
imported coal. This number increased by 8.1% (15,895 ktoe) in 2015 was due to high demand from the
power sector. Approximately 60% of the coal was imported from Indonesia and 40% from Australia,
Russia and South Africa [4–6].
      The generated electricity from coal was 41% (60,128.83 GWh) of the total electricity generation
in 2015. The average conventional coal power plant thermal efficiency in 2015 was 33.93%.
The coal consumption and CO2 emissions can be reduced with the installation of high-efficiency
low-emission (HELE) coal technologies such as supercritical (SC), ultra-supercritical (USC) and
advanced ultra-supercritical (A-USC) that utilize a low volume of coal to produce the same amount of
energy and reduce carbon dioxide (CO2 ) emissions. As part of the eleventh Malaysia plan for energy
security, the government issued new tenders in stages to replace 7,626 MW generation capacity of the
first generation of IPPs that will retire in phases by end of 2020 [7]. The Malaysian government target
for to ensure security of supply, efficient utilisation and environmental preservation for the electricity
subsector under the Eleventh Malaysia Plan as summarised in Table 1.
      Currently, the average base electricity tariff is RM 0.3853 per kWh and dependent on the price of
natural gas and imported coal. The natural gas sources are supplied by locally-produced company,
Petroliam National Berhad (Petronas) and also from imported gas. Meanwhile TNB Fuel Services Sdn
Bhd (TNBF), a wholly owned subsidiary of TNB, is responsible for procuring the steam coal or thermal
coal used to generate electricity in coal power plant to the IPPs in Malaysia that have entered a power
purchase agreement (PPA) with TNB. By utilising the imported coal, the cheaper electricity tariff can
be achieved from RM 0.24 to 0.25 per kWh in comparison with utilisation of natural gas from RM
0.34 to 0.38 per kWh [8]. Notwithstanding this, the new government’s efforts are focused on energy
security to meet the country’s rising electricity demand through utilisation of renewable sources and to
a reduce the reliance on imported coal. Fuel switching from natural gas to coal has gained attention in
Sustainability 2019, 11, 1060 3 of 23
the power sector in Peninsular Malaysia to overcome power shortages caused by the decline in natural
gas supply. Considering coal abundant reserves globally and competitive prices, coal will remain as
main energy demand despite the concern on CO2 emission and air pollution.
Table 1. Eleventh Malaysia Plan (2016–2020) target for electricity [9].
Item Target
Fuel diversity index, the Hirchmann–Herfindahl Index (HHI) Achieve below 0.5
Installed Capacity and Reserve Margin for:
24,943 MW with reserve margin of 20%
Peninsular Malaysia
1782 MW with reserve margin of 34%
Sabah
5103 MW with reserve margin of 19%
Sarawak
2080 MW or 7.8% of total installed capacity
RE capacity in Peninsular Malaysia and Sabah
7626 MW from new generation capacity & 2253 MW
Increase generation capacity in Peninsular Malaysia
by extending retiring units
System Average Interruption Duration Index (SAIDI) for
generation, transmission and distribution
Peninsular Malaysia 50 min/customer/year
Sabah 100 min/customer/year
Sarawak 157 min/customer/year
Transmission and distribution networks
Strengthen Sabah electricity grid for reliability
reinforcement
Subsidy rationalisation for electricity tariff Tariff review to achieve market price
Establishment of an atomic energy regulatory
commission
Initial milestones for nuclear power development Atomic Energy Regulatory Bill passed by Parliament
Public engagement for acceptance of nuclear power
plant development
Augmenting rural electrification Achieve 99% national coverage
A high-level focal point in the Government for decision making on
Instituted before 2020
energy policy
Exploring new RE sources
Increasing share of renewables in energy mix Enhancing capacity of RE personnel
Implementing net energy metering
A comprehensive communications plan on issues related to tariff
Initiated by 2017
increase as well as construction of coal and nuclear power plants
Approximately, 24 million metric tonnes of coal are burnt annually in the Malaysian coal-fired
IPPs which the figure is expected to rise to 40 million metric tonnes in year 2020. As the government
will gradually phase out subsidies for natural gas due to a decline in production, the gas price will
eventually increase. It is estimated that coal will supersede natural gas and represent almost 60% of
the energy mix with about 85 GW increase of installed power plant capacity in 2040 from 30.4 GW
in 2015 [10].
This paper aims to provide a comprehensive review focusing on the availability and energy
potential from oil palm residues and MSW for renewable energy (RE) mix in Malaysia. The existing
management practices and salient issues in the oil palm industry and MSW management will address
the potential of HTT from oil palm waste and MSW as value added fuel for a clean coal alternative.
2. Renewable Energy (RE)
Notwithstanding, Malaysia is blessed with indigenous renewable resources such as solar, biomass,
mini hydro, wind, ocean, geothermal and wind energy. Malaysia has submitted Intended Nationally
Determined Contributions (INDC) to tackle climate change under the Paris Agreement following
the 21st Conference of the Parties (COP) to the United Nations Framework Convention (UNFCCC)
to reduce greenhouse gas (GHGs) emissions namely CO2 , methane (CH4 ) and nitrous oxide (N2 O).
Hence, investment of renewable energy (RE) projects provides energy security to the country andSustainability 2019, 11, 1060 4 of 23
simultaneously
Sustainability eradicates
2019, 11, 40%
x FOR PEER of CO2 by 2020 relative to the emission intensity in 2005 level.4Thus, of 27
the government is committed towards diversify its RE deployment by maintaining the Hirschman
price
indexand alleviate
(HHI) of lessoccasional
than 0.5 by electricity
gradually interruptions
reducing fossil[6]. However, based ondue
fuel dependence thetocurrent
unstable scenario
price
there are challenges
and alleviate occasional to electricity
reduce the CO2 emission
interruptions [6]. with
However,the increment
based on the in current
growthscenario
of coal‐fired
there
generation
are challengesin Malaysia
to reducescenario
the CO2 as a resultwith
emission of the
theincreasing
incrementprice of natural
in growth gas in the
of coal-fired electricity
generation in
sector.
Malaysia scenario as a result of the increasing price of natural gas in the electricity sector.
Malaysia
Malaysia has has faced
facedchallenges
challengesininsustaining
sustainingfossil
fossilfuels
fuelsproduction
production from
from natural
natural gasgasand
andcoal in
coal
electricity generation. Therefore, the government introduced various financial
in electricity generation. Therefore, the government introduced various financial incentives such incentives such as
feed‐in
feed-in tariffs, tax incentives for green project in terms of investment tax allowances and income tax
exemption and andpolicies
policiestoto promote
promote thethe
use use of renewables
of renewables such assuchthe as the Five‐Fuel
Five-Fuel Policy inPolicy in 2001,
2001, National
National Green Technology Policy in 2009, National Renewable Energy Policies
Green Technology Policy in 2009, National Renewable Energy Policies and the Action Plan (NREPAP) and the Action Plan
(NREPAP)
in 2010 as ain 2010 as a mechanism
mechanism to attract
to attract investors ininvestors in theThe
the RE sector. RE Five-Fuel
sector. The Five‐Fuel diversification
diversification policy aims
policy aims
to utilise REto utilise
from fourRE from foursources:
renewable renewable sources:
biomass andbiomass and MSW,
MSW, biogas biogas
inclusive inclusive
of landfill of sewage,
and landfill
and sewage, solar photovoltaic (PV) and mini‐hydro as additional sources
solar photovoltaic (PV) and mini-hydro as additional sources of fuel for electricity generation besides of fuel for electricity
generation besides
the conventional the conventional
sources sources
of oil, gas, hydro of coal.
and oil, gas, hydro and coal.
Malaysia has a target to install RE capacity of 2080 MW, 11% of RE mix and 42.2 Mt cumulative
CO22 avoidance
avoidance in 2020. By 2030, 2030, the
therenewable
renewablecapacity
capacitytarget
targetisis expected
expected to to reach
reach 40004000
MW, MW,17%17% of
of RE
RE
mixmix
and and
145.1145.1 Mt cumulative
Mt cumulative CO2 avoidance
CO2 avoidance excludingexcluding
the largethescale
large scale hydroelectric
hydroelectric [10]. The [10]. The
Malaysia
Malaysia Nationaltarget
National Biomass Biomassis to target
achieveis 800
to achieve
MW (38%) 800andMW54(38%) and 54installed
MW (17%) MW (17%) installed
capacity from capacity
biomass
from biomass
and MSW and MSW
by 2020, by 2020,(Figure
respectively respectively
1). By(Figure
2030, the 1). By 2030, the
biomass biomass
installed installed
capacity capacity to
is expected is
expected to increased 67.5% with 1340 MW
increased 67.5% with 1340 MW installed capacity [11]. installed capacity [11].
Figure 1.
Figure 2080 MW
1. 2080 MW renewable
renewable energy
energy (RE) installed capacity target by 2020 [12].
The Sustainable
The Sustainable Energy
Energy Development
Development Authority
Authority (SEDA)
(SEDA) ofof Malaysia
Malaysia waswas established
established under
under the
the
Sustainable Energy
Sustainable Energy Development
Development Authority
Authority Act
Act 2011
2011 (Act
(Act 726)
726) for
for implementation
implementation of of feed
feed in
in tariff
tariff
(FiT) mechanisms. The FiT was gazetted on 2011 under the Renewable Energy
(FiT) mechanisms. The FiT was gazetted on 2011 under the Renewable Energy Act 2011 (Act 725) for Act 2011 (Act 725) for
the Distribution Licensees to buy electricity from RE resources by signing the
the Distribution Licensees to buy electricity from RE resources by signing the RE Power Purchasing RE Power Purchasing
Agreement (REPPA)
Agreement (REPPA) between
between RE RE producers
producers or or known
known as as Feed-in
Feed‐in Approval
Approval Holders (FiAHs) and
Holders (FiAHs) and
distribution licensees for a specific duration and at a fixed premium price from
distribution licensees for a specific duration and at a fixed premium price from RE fund which was RE fund which was
established under
established under ActAct 725
725 [13].
[13].
The FiT will be financed
The FiT will be financed from from the
the consumers
consumers electricity
electricitybill
billunder
underthe theRE REfund
fundfrom
fromNREPAP.
NREPAP.
Initially, the collection was 1% from the total electricity tariff invoices issued
Initially, the collection was 1% from the total electricity tariff invoices issued by the Distribution by the Distribution
Licensees without
Licensees without involvement
involvement of of Sabah.
Sabah. Since
Since 2014,
2014, The
The FiT
FiT has
has increased
increased to to 1.6%
1.6% with
with addition
addition ofof
Sabah. This is a polluter’s pay concept, applicable to only domestic consumers
Sabah. This is a polluter’s pay concept, applicable to only domestic consumers who consume more who consume more
than 300
than 300 kWh
kWh perper months
monthsto tothe
theREREfund.
fund.However,
However,the thecommercial
commercial andandindustrial consumers
industrial consumers willwill
be
charge
be 1.6%
charge even
1.6% though
even the usage
though below
the usage 300kWh.
below The government
300kWh. The government targettarget
to collect 2% FiT2%
to collect forFiT
the for
RE
Fund under NREPAP [13–15].
the RE Fund under NREPAP[13–15].
As of 2016, the PV FiT had reached maturity stage which resulted to installation of Large‐Scale
Solar (LSS) and Net Energy Metering (NEM) as compared to biomass, biogas and small hydro
installations. After 5 years of the FiT system, the RE capacity installed successfully reached 500MW.
In comparison, the Small Renewable Energy Program (SREP) to introduce RE as the fifth fuel underSustainability 2019, 11, 1060 5 of 23
As of 2016, the PV FiT had reached maturity stage which resulted to installation of Large-Scale
Solar (LSS) and Net Energy Metering (NEM) as compared to biomass, biogas and small hydro
installations.
Sustainability After
2019, 5 years
11, x FOR PEERof the FiT system, the RE capacity installed successfully reached 5005 MW. of 27
In comparison, the Small Renewable Energy Program (SREP) to introduce RE as the fifth fuel under
the
the 8th
8th Malaysian
Malaysian Plan Plan (2001‐2009)
(2001-2009) took
took 99 years
years toto add
add 53
53 MW
MW ofof RE
RE to
to the
the power
power grid
grid [13].
[13]. In
In 2014,
2014,
243.4
243.4 MW (out of 415.5 MW) of RE installed capacity was connected to the grid. This is due to
MW (out of 415.5 MW) of RE installed capacity was connected to the grid. This is due to
challenges
challenges in insecuring
securingadequate
adequate feedstock
feedstock for long-term
for the the long‐term
supplysupply for biomass,
for biomass, difficulties
difficulties in securing in
securing
financingfinancing for RE technologies
for RE technologies and lack and lack ofinexperts
of experts in the technology
the technology project developers,
project developers, financial
financial personnel and service providers [9]. The RE policy
personnel and service providers [9]. The RE policy deployment and development deployment and development
in Malaysia in is
Malaysia
summarized is summarized
in Figure 2. in Figure 2.
8th Malaysia Plan (2001‐2005)
The 5th Fuel Diversification Policy 2001
Small Renewable Energy Program (SREP)
Renewable Share of of 500 MW or 5% in Energy Mix 2005
9th Malaysia Plan (2006‐2010)
Renewable Share of 350 MW or 1.8% in Energy Mix
2010
10th Malaysia Plan (2010‐2015)
National Renewable Energy Policies and Action Plan 2010
Renewable Energy Act 2011
Sustainable Energy Development Authority 2011
Feed in Tariff (FiT)
Renewable Share of 985MW or 5.5% in Energy Mix 2015
11th Malaysia Plan (2016‐2020)
Renewable Share of 2,080 MW or 7.8% from Peninsular
Malaysia and Sabah Energy Mix 2020
Figure 2.
Figure RE policy
2. RE policy development
development in
in Malaysia,
Malaysia, modified
modified from
from [16].
[16].
As shown in Table 2, the digressions rate will not affect for RE technologies within the effective
As shown in
period under REPPA and will apply after the maturity of the technology. The average base electricity
tariff by sector is capped at RM 0.3853 per kWh as the government had agreed to subsidise
RM929.4 million or RM1.8 cent/kWh for first half of 2018 [17]. The FiT mechanism allows electricity to
be produced from indigenous RE resources to be sold to power utilities at a fixed premium price for a
specific duration with a maximum capacity of 30 MW for all renewable resources.Sustainability 2019, 11, 1060 6 of 23
Table 2. Feed in tariff (FiT) for biomass and municipal solid waste (MSW) with effective period 16 years
from the commencement date.
FiT Rate Fit Rate Digressions
Capacity of RE installation Installed
(RM per kWh) (USD per kWh) Rate Effective 1st Jan 2014 [18]
Installed capacity up to and including 10 MW 0.3085 0.079 0%
Installed capacity above 10 MW, and up to and
0.2886 0.074 0%
including 20 MW
Installed capacity above 20 MW, and up to and
0.2687 0.069 0%
including 30 MW
Additional for use of gasification technology +0.0199 +0.005 0%
Additional for use of steam-based electricity generating
+0.0100 +0.003 0%
systems with overall efficiency of above 20%
Additional for use of locally manufactured or assembled
+0.0500 +0.013 0%
boiler or gasifier
Additional use of MSW as fuel source +0.0982 +0.025 0%
Developing biogas facility at palm oil mills is the fifth Entry Point Projects (EPPs) out nine EPPs
under the Economic Transformation Programme’s (ETP) for the oil, gas and energy sector. Since 2014,
the government mandated new palm oil mills as well as palm oil mills that are expanding their capacity
to install methane avoidance facilities to reduce greenhouse gas emissions from POME. This project
focuses on limiting the GHGs, connection to the grid, supplying electricity to rural area, flaring and
internal usage. The application depends on location of mills and vicinity to grid or commercial and
residential area [19].
The first commercial bio-compressed natural gas (BioCNG) plant to produce CH4 in Sungai Tengi,
Selangor, was commissioned in 2015 in collaboration between Malaysia Palm Oil Board (MPOB), Felda
Palm Industries Sdn Bhd and Sime Darby Offshore Engineering Sdn Bhd. In 2016, 92 biogas plants had
been built, 9 under various stages of construction and another 145 under various stages of planning.
This rapid growth of national biogas development is the result of the politically driven NKEA of fifth
EPPs, the Renewable Energy Act (2011), increase in biomass FiT, tax incentives under the Promotion of
Investment Act 1986, and the Green Technology Financing Scheme (GTFS) [20].
A biomass stored solar energy source that can be converted into useful RE for electricity, heat
and transportation fuels. Thermal treatment of biomass as solid fuel has been traditionally used for
cooking and heating in the form of fuelwood, dried dung, wood chips, straw, saw dust, logging
residues, and briquettes. In addition, thermal treatment of biomass will have a significant impact for
coal replacement in the electricity sector. It has great potential for energy security, environmentally
and improved social living by creation of job. The main advantage of biomass as compared to coal is
the availability for carbon sequester where the CO2 produce from combustion to generate power can
be reused for photosynthesis. Moreover, it will significantly reduce air pollution from sulphur oxide
(SOX ) and nitrogen oxide (NOX ) released from combustion with coal.
However, there is challenge in feedstock availability and pre-treatment for large scale power
generation as the treatment cost would result in high feedstock cost than coal. In comparison with
biomass, fossil fuels require thousands or millions of years for reproduction whilst biomass is renewable
and available annually. The annual yield of biomass depends on the location, weather and climate
condition, crops management, fertilisation and type of soil. The agricultural residues have gained
attraction for biomass feedstock due to low cost by-products make a good economic value for solid
fuel production. However, the thermochemical conversion for agriculture residues is more challenging
than wood as the ash content in wood is usually less than many agricultural residues.
3. Oil Palm Residue
The RE Policy and Action Plan sets a target of 2080 MW and 4000 MW of installed RE capacity
for 2020 and 2030 respectively which focus on biomass (including MSW), biogas (from landfill and
agriculture residues, small hydro and PV. The main agricultural commodities grown in Malaysia
are oil palm, rubber, rice, cocoa and coconut. In Peninsular Malaysia, agriculture residue has beenSustainability 2019, 11, 1060 7 of 23
estimated at 17 Mt which 77% of the total residues are from oil palm, 9.1% rice residues, 8.2% forestry
residues and 5.7% other residues like rubber, cocoa and coconut [21]. About 75% of the oil palm waste
is made up of OPF and OPT which are readily available in the plantation sites, while EFB, MF, PKS and
POME that account for the remaining 25% which are usually available at the mill sites during palm oil
extraction from the fresh fruit bunch. The general oil palm yield for commodity trading includes crude
palm oil (CPO), crude palm kernel oil (CPKO) and palm kernel cake (PKC).
3.1. Properties of Oil Palm Solid Residues
The OPT are obtained during the replanting to replace the old oil palm trees and OPF are available
throughout the year when the palms are pruned during the harvesting of the fresh fruit bunches.
EFB is the woody fibrous residue that remains after the fruits are removed from the bunch and the oil
is extracted in the palm oil mill. MF is the fibrous material in the press cake where it is passed through
a screen to remove the fibre. The PKS are separated from the kernel and serve as fuel for internal use
in the palm oil mill boilers. Smaller mills might dry and sell the unprocessed nuts to other companies
who process them into palm kernel oil [22].
The main constituents of the oil palm residues are cellulose, hemicellulose and lignin.
The remaining contents are ash and extractives such as resins, fats, tanning agents, starch, sugar,
proteins, and minerals. This high cellulose and hemicellulose content can be converted into simple
sugars and processed into biofuels or biochemicals. From Table 3, PKS is seen to have highest lignin
content which has proven to be the most preferred fuel for thermal combustion.
Table 3. Chemical composition (dry basis) of oil palm solid residues from mills [23].
Chemical Components (% Dry wt.)
Type of Biomass
Cellulose Hemi-Cellulose Lignin Extractives Ash
Empty fruit bunches 38.3 35.3 22.1 2.7 1.6
Mesocarp fibre 33.9 26.1 27.7 6.9 3.5
Palm kernel shell 20.8 22.7 50.7 4.8 1.0
Oil palm frond 30.4 40.4 21.7 1.7 5.8
Oil palm trunk 34.5 31.8 25.7 3.7 4.3
The lowest moisture content of oil palm residues is PKS at 12% followed by MF, EFB, OPF and
OPT at 37%, 67%, 70% and 76%, respectively (Table 4). For thermochemical process efficiency, it is
significant to have the lowest possible moisture content of biomass since high moisture content of
biomass will incurred in drying cost. The fuel composition is important with respect to calorific value
or heat released during combustion. The calorific value of oil palm residues varies between 18 to
21 MJ/kg on a dry basis. Due to the properties of PKS and MF with high calorific value and low
moisture content, it is widely used as fuel without pre-treatment in the boilers to generate electricity
in the oil palm mills. The calorific value of mill residues such as PKS, MF and EFB are higher than
plantation residues like OPF and OPT. The calorific value of mill waste is comparable to low rank coal
due to presence of hexane-extractable content which is unique to oil-derived biomass residues [24].
High-quality coals, such as anthracites and bituminous coals, can be expected to have calorific values
in the range from 25 to 33 MJ/kg whereas low-quality coals, such as lignite, and peat-based fuels have
calorific values of below 20 MJ/kg.Sustainability 2019, 11, 1060 8 of 23
Table 4. High heating value and proximate analysis of oil palm biomass residues in comparison with
coal (mass fraction in % dry basis except for moisture content) [24].
Gross Calorific Value Moisture Ash Content Volatile Matter
Sample
(MJ kg−1 ) Content (wt.%) (wt.%) Content (wt.%)
Empty fruit bunch 18.88 67.00 4.60 87.04
Mesocarp fibre 19.06 37.09 6.10 84.91
Palm kernel shell 20.09 12.00 3.00 83.45
Oil palm fronds 15.72 70.60 3.37 85.10
Oil palm trunks 17.47 75.60 3.35 86.70
Bituminous Coal 28.3 11.00 8.7 46
Lignite Coal 2.8 39.00 10.7 29
Generally, it can be seen that OPF has the highest nitrogen (N) content which probably explains
why most of palm plantation mulched the OPF to improve soil fertility. The PKS has the highest carbon
content followed by OPT. With regard to chemical properties of biomass fuel, it generally has low
sulphur, low fixed carbon, and low fuel bound to N, but more oxygen than coal (Table 5).
Table 5. Ultimate analysis of oil palm biomass residues in comparison with coal [24].
Nitrogen Carbon Hydrogen Oxygen Sulphur
Sample
(wt.%) (wt.%) (wt.%) (wt.%) (wt.%)
Empty fruit bunch 0.249 48.715 7.858 48.179 ND
Mesocarp fibre 0.391 46.396 9.283 50.212 ND
Palm kernel shell 0.043 57.909 12.600 49.994 ND
Oil palm fronds 12.402 48.431 10.476 46.75 ND
Oil palm trunks 0.169 51.408 11.816 51.16 ND
Bituminous Coal 1.4 73.1 5.5 ~10 2.4
Lignite Coal 1.6 56.4 4.2 26.0 0.4
In addition, the presence of alkali and alkaline earth metal content of oil palm biomass such as
sodium (Na), magnesium (Mg), calcium (Ca) and potassium (K) is very important in thermochemical
combustion as it may react with silica (Si) causing operational problems in the boiler with slagging
in the grates and fouling of the tubes [24]. Sulphur (S), Cl, and alkali metals vaporize during
combustion and deposit in a molten form, particularly as alkali chloride, resulting in severe corrosion
and machinery failure. Cl is a major factor in ash formation where it facilitates the transport of alkali
from the fuel to surfaces, where the alkali often forms sulphate [25]. In addition, based on the alkali
index, only PKS complies the guideline for bioenergy application limit of below 0.34 mol GJ−1 whilst
the EFB has the highest alkali index correspond to high K with potential of slagging during combustion.
Therefore, it is important to reduce these elements by leaching or washing with water to avoid fouling
or slagging during combustion [24]. The effect of biomass physical and chemical properties as fuel for
combustion is summarized in Table 6.
Technical challenges of biomass are low bulk, energy density and calorific value which requires
upgrading and densification that make the feedstock costly. Moreover, biomass is more susceptible
to moisture or hydrophilic that cause problem for fuel storage and handling. Most power station
operators were concerned about logistics and boiler issues such as fouling and corrosion of heat
exchanger surfaces, slagging, ash deposition, SOx and NOx emissions [26,27]. Therefore, there is a
need for biomass pre-treatment to improve chemical and physical properties by increasing the energy
content, grind ability and hydrophobicity.Sustainability 2019, 11, 1060 9 of 23
Table 6. Physical and chemical characteristics of solid biomass fuels and their effects [28].
Characteristics Effects
Physical Properties
Moisture content Storage durability and dry-matter losses, NCV, self-ignition, plant design
Net Calorific Value (NCV), Gross
Fuel utilization, plant design
Calorific Value (GCV)
Volatiles Thermal decomposition behaviour
Dust emissions, ash manipulation, ash utilization/disposal, combustion
Ash content
technology
Operational safety, combustion technology, process control system, hard
Ash-melting behaviour
deposit formation
Fungi Health risks
Bulk density Fuel logistics (storage, transport, handling)
Particle density Thermal conductance, thermal decomposition
Physical dimension, form, size Hoisting and conveying, combustion technology, bridging, operational
distribution safety, drying, dust formation
Fine parts (wood pressings) Storage volume, transport losses, dust formation
Abrasion resistance (wood pressings) Quality changes, segregation, fine parts
Chemical Properties
Elements:
· Carbon, C GCV
· Hydrogen, H GCV, NCV
· Oxygen, O GCV
HCl, PCDD/PCDF Emissions, corrosions, lowering ash-melting
· Chlorine, Cl
temperature
· Nitrogen, N NOx , N2 O emissions
· Sulphur, S SOx emissions, corrosion
· Fluorine, F HF emissions, corrosion
Corrosion (heat exchangers, superheaters), lowering ash-melting
· Potassium, K
temperature, aerosol formation, ash utilization (plant nutrient)
Corrosion (heat exchangers, superheaters), lowering ash-melting
· Sodium, Na
temperature, aerosol formation
· Magnesium, Mg Increase of ash-melting temperature, ash utilization (plant nutrient)
· Calcium, Ca Increase of ash-melting temperature, ash utilization (plant nutrient)
· Phosphorus, P Ash utilization (plant nutrient)
· Heavy metals Emissions, ash utilization, aerosol formation
3.2. Availability and Energy Potential from Oil Palm Residues
From MPOB statistics in 2017 (Table 7), the total oil palm planted area reached 5.81 million hectares
(ha), an increase of 1.3% as against 5.74 million ha in the previous year. The total oil palm planted
area in Peninsular Malaysia in 2017 was 2.70 million ha (46.6% of the total) followed by Sarawak with
1.56 million ha (26.8% of the total) and Sabah with 1.55 million ha (26.6% of the total).
Table 7. Total oil palm planted area by location in Malaysia from 2014 to 2017 [29].
Year 2014 2015 2016 2017
Sabah and Peninsular Sabah and Peninsular Sabah and Peninsular Sabah and Peninsular
Location
Sarawak Malaysia Sarawak Malaysia Sarawak Malaysia Sarawak Malaysia
Planted Area (ha) 2,774,901 2,617,334 2,983,582 2,659,361 3,058,483 2,679,502 3,102,732 2,708,413
Total 5,392,235 5,642,943 5,737,985 5,811,145Sustainability 2019, 11, 1060 10 of 23
As shown in Figure 3, from 5.81 million ha of oil palm plantations, 61% belongs to private estates,
17% from independent smallholders and the remaining belongs to state schemes or government
agencies, the Federal Land Development Authority (FELDA), Federal Land Consolidation and
Rehabilitation Authority (FELCRA) and Rubber Industry Smallholders Development Authority
(RISDA).
SustainabilityWith thex increasing
2019, 11, FOR PEER trend of oil palm planted area since 2010, it is estimated the oil 13palm
of 27
biomass will generate approximately 85 to 110 million dry tonnes of solid biomass by 2020. Besides,
MW biogas
there is also capture
target tofacilities
reduce 12%by 2030 in the oil
of methane palm mills
emission and subsequently
by installing gain profit
410 MW biogas from
capture selling
facilities
power
by 2030tointhe
thenational
oil palmgrid
mills[30].
and subsequently gain profit from selling power to the national grid [30].
FELCRA, 169,158, RISDA,
3% 66,357,
1%
State
schemes/Government
agencies, 347,632, 6%
FELDA, 704,811,
12%
Independent
Smallholders, Private Estates,
979,758, 17% 3,543,429, 61%
Figure 3.
Figure Breakdown of
3. Breakdown of oil
oil palm
palm planted
planted area
area by
by category
category [31].
[31].
As of 2017, there were a total of 454 operating mills in Malaysia with the capacity to process
As of 2017, there were a total of 454 operating mills in Malaysia with the capacity to process
112,187,800 tonnes of fresh fruit bunches per year. In addition, 244 mills were located in Peninsular
112,187,800 tonnes of fresh fruit bunches per year. In addition, 244 mills were located in Peninsular
Malaysia, 130 mills were in Sabah and 80 mills were in Sarawak [29]. The oil palm mills ownership is
Malaysia, 130 mills were in Sabah and 80 mills were in Sarawak [29]. The oil palm mills ownership is
categorised into private mills which receive fresh fruit bunch from other private palm oil plantation
categorised into private mills which receive fresh fruit bunch from other private palm oil plantation
and plantation-based mills that possess their own plantations.
and plantation‐based mills that possess their own plantations.
The OPF are available throughout the year as they are regularly cut due to ripe fruit bunches
The OPF are available throughout the year as they are regularly cut due to ripe fruit bunches
during the harvesting; meanwhile, the OPT are generated during replanting in the plantation every
during the harvesting; meanwhile, the OPT are generated during replanting in the plantation every
25 to 30 years due to decease fruit and oil yields. The shredded OPF are sometimes used for ruminant
25 to 30 years due to decease fruit and oil yields. The shredded OPF are sometimes used for
feed while 40% of OPT are sold to the wood industry for making medium density fibre board, plywood
ruminant feed while 40% of OPT are sold to the wood industry for making medium density fibre
and furniture [21]. The remaining OPF are decomposed for soil fertilization and erosion control.
board, plywood and furniture [32]. The remaining OPF are decomposed for soil fertilization and
The OPT are also used for furniture industry in manufacturing plywood, medium density fibreboard
erosion control. The OPT are also used for furniture industry in manufacturing plywood, medium
(MDF) and bioethanol production [32].
density fibreboard (MDF) and bioethanol production [33]
Meanwhile, around 98% and 62% of MF and PKS, respectively are used as fuel for the boilers in
Meanwhile, around 98% and 62% of MF and PKS, respectively are used as fuel for the boilers in
mills to generate electricity for palm oil extraction with the balance sold to open market [23]. However,
mills to generate electricity for palm oil extraction with the balance sold to open market [23].
based on observation, these palm oil mills faced the problem of supplying the electricity due to
However, based on observation, these palm oil mills faced the problem of supplying the electricity
insufficient feedstock supply as fuel from the MF and PKS. In addition, they are also processed to be
due to insufficient feedstock supply as fuel from the MF and PKS. In addition, they are also
sold as pellets and briquettes. Besides, the MF is also used to produce plastic pellets which can also be
processed to be sold as pellets and briquettes. Besides, the MF is also used to produce plastic pellets
used as a filler for fibre-reinforced thermoplastic [32].
which can also be used as a filler for fibre‐reinforced thermoplastic[33].
Based on a previous study by [33], most of the private palm oil mills owner returned back the EFB
Based on a previous study by [34], most of the private palm oil mills owner returned back the
with some cost paid for the transportation to the plantation for mulching and replenishing the soil due
EFB with some cost paid for the transportation to the plantation for mulching and replenishing the
to high K and ability to conserve water due to limited space for disposal in the mills. However, this
soil due to high K and ability to conserve water due to limited space for disposal in the mills.
However, this practice results in an odour problem at the plantation. As EFB contain around 67%
moisture, it requires high intensity of drying to use as fuel in the boilers. Furthermore, the high alkali
content of EFB such as K and Na play an important role for organic fertilizers or bioethanol
production but not suitable for combustion as it will cause slagging and fouling in the boiler thatSustainability 2019, 11, 1060 11 of 23
practice results in an odour problem at the plantation. As EFB contain around 67% moisture, it requires
high intensity of drying to use as fuel in the boilers. Furthermore, the high alkali content of EFB such
as K and Na play an important role for organic fertilizers or bioethanol production but not suitable
for combustion as it will cause slagging and fouling in the boiler that resulted in plant shutdown and
economic losses.
In Sabah, the biomass plant utilises surplus EFB for grid-connected such as Kina Biopower Sdn.
Bhd. and Seguntor Bioenergy Sdn. Bhd. Alternatively, there are various applications and value-added
products from EFB like the pulp and paper industry, cushion and rubberized mattress, briquette and
pellets as fuel [23]. Moreover, there was also a joint project between the Malaysian and Japanese
governments in 2014 to produce alternative fuel to coal from EFB and tyre waste used in the cement
plant [34].
The availability and energy potential of oil palm biomass residues along its supply chain are
calculated from the fresh fruit bunch processed in palm oil mills and the standard biomass to Fresh
Fruit Bunch (FFB) extraction as in Tables 8 and 9.
Table 8. Fresh Fruit Bunch (FFB) yield and processed by mills in Malaysia from 2014 to 2017 [29].
Year 2014 2015 2016 2017
FFB Yield (Tonnes/hectare) 18.63 18.48 15.91 17.89
FFB Processed by Mill (Tonnes) 95,380,438 97,566,393 85,836,769 101,022,441
Table 9. Oil palm biomass availability based on standard biomass to FFB extraction rate [24].
Type of Oil Palm Biomass Availability
EFB (wet basis) = 22% of FFB
Empty fruit bunches (EFB)
EFB (dry weight) = 35% of EFB (wet basis)
PKS (wet basis) = 5.5% of FFB
Palm Kernel shell (PKS)
PKS (dry weight) = 85% of PS (wet basis)
MF (wet basis) = 13.5% of FFB
Mesocarp fibres (MF)
MF (dry weight) = 60% of MF (wet basis)
Palm oil mill effluent (POME) POME (wet basis) = 67% of FFB or 0.65 m3 t−1 FFB
OPT (replanting, dry weight) = 74.48 t ha−1 , an average of 142 OPT is available
Oil palm trunks (OPT)
from a ha of oil palm, and only 50% can be removed from the plantation.
OPF (pruned, dry weight) = 10.40 t ha−1 , 75% of oil palm trees aged 7 years are
due for pruning, and only 50% can be removed from the plantation.
Oil palm fronds (OPF)
OPF (replanting, dry weight) = 14.47 t ha−1 , and only 50% can be removed
from the plantation.
The FFB processed by mills was 101.02 Mt with 5,811,145 ha planted area in 2017. The oil palm
replanted area was estimated at 100,550.31 ha [29]. From this data, the total availability of oil palm solid
residue generated along its supply chain on a dry weight basis from pruning, milling and replanting
activities was calculated. The pruned OPF was estimated 22.66 Mt, 7.78 Mt of EFB, 8.18 Mt of MF,
4.72 Mt of PKS and 3.38 Mt POME. The estimated dry weight of OPF and OPT from replanting was
0.73 Mt and 3.74 Mt, respectively. The total dry oil palm residues available for replanting, pruning and
milling activities in 2017 was estimated 51.19 Mt out of 101.02 Mt of FFB processed.
As summarised in Table 10, the energy potential of each biomass type has been estimated from the
calorific value and availability. The electricity generation potential from the oil palm biomass residues
obtained is calculated based on the energy potential value for each biomass type, assuming that the
average thermal efficiency of conventional coal-firing power plants in 2017 was 35.67% [4].Sustainability 2019, 11, 1060 12 of 23
Table 10. Availability, energy and electricity generation potential of oil palm residues in Malaysia
in 2017.
Biomass Type OPF EFB PKS MF POME OPT Total
Availability (Mt) 23.39 7.78 4.72 8.18 3.38 3.74 51.19
Gross calorific value (MJ kg−1 ) [24] 15.72 18.88 20.09 19.06 16.99 17.47 -
Energy Potential (PJ) 367.71 146.86 94.88 155.96 57.50 65.42 888.33
Electricity Generation (TWh) 36.44 14.55 9.40 15.45 5.70 6.48 88.03
Power Plant Size (MW) 5060.67 5666.35 3660.79 6017.46 2218.54 2524.12 12,225.80
1 MJ = 1/3600 MW h.
Overall, the potential RE from solid fuel of OPF was the highest among all biomass types, with
367.71 PJ, followed by MF, EFB, PKS, OPT and POME showed the least energy potential, with 57.50 PJ
due to liquid in nature. The total electricity generation potential of all residues was 88.03 TWh with
12,226 MW electricity generation installed capacity. The installed capacity of POME for solid fuel was
2218.54 MW, whilst installed capacity for biogas or methane energy exceeded the national target of
410 MW biogas by 2030 at 511.82 MW (Table 11).
Table 11. Biogas potential from POME in 2017 (Modified from [24]).
Material Production Rate Quantity
FFB Processed (tonnes) 101,022,441
POME Availability (million m3 ) 67% to FFB 67.69
Biogas (million m3 ) 28 m3 per m3 of POME 1895.18
Total heat value (million MJ) 1895.18 million m3 × 20 MJ m3 37,903.62
Total heat value (million MWh) 10.53
Power Output (MWh) 35.65% of heat value 3.69
Power plant size (MW) Plant operates 300 days a year = 7200 h 511.82
Calorific value = 20 MJ m3 at STP, 1 MJ = 1/3600 MW h.
In summary, the oil palm solid waste has significant potential for the biomass energy target
as compared to biogas with electricity installed capacity of 12,226 MW which surpassed the nation
biomass target to reach 800 MW and 1340 MW by 2020 and 2030, respectively.
3.3. Salient Issues Faced by Oil Palm Biomass Developers
Developing a biogas facility at palm oil mills is one of EPPs identified under Malaysia NKEA
for palm oil. Since 2014, the government has mandated new palm oil mills as well as palm oil mills
that are expanding their capacity to install methane avoidance facilities in a bid to move to reduce
greenhouse gas emissions. This project focus to limit the GHGs emissions from POME, connection to
the grid, supplying electricity to rural areas, flaring and internal usage. The application depends on
the location of mills and proximity to the grid or commercial and residential areas [19].
In a study by [35], the three (3) main barriers identified for developing biomass energy in Malaysia
are security of supply, unattractive electricity tariffs and high capital expenditure. Malaysia’s oil palm
plantations are largely based on private estate, independent smallholder, state schemes or government
agencies, FELDA, FELCRA and RISDA. The long-term supply is the main factor for the biomass energy
producer as they depend on third parties which has resulted in fluctuation of fuel price and competing
demand. Unlike the plantation owner who has control on the feedstock supply, the high risk for a
biomass market player especially the non-estate small producers which have to depend and invest on
the third party to generate electricity from biomass make it unattractive for business. Conversely, 68%
of the respondents from the plantation owner who have full access to their feedstocks preferred to sell
their feedstocks at an attractive buying price on the open market instead of utilising their waste for RE
generation. The large oil palm companies play significant role in controlling the oil palm market asSustainability 2019, 11, 1060 13 of 23
the common practice for the mill operators to return the waste generated to the plantation for various
purposes such as mulching instead of electricity generation.
Furthermore, it is found that 77% of palm oil mills in Malaysia are using combustion or combined
heat and power (CHP) systems or a combination of both, while only 5% of plants are fitted with a
gasification for self-consumption power generation [36]. Some of the palm oil mills faced a problem
in terms of frequent power supply interruption due to insufficient feedstock of fuel from MF and
PKS and inefficiency of old and conventional boilers in the palm oil mills that have been in operation
more than 10 years. Most of these mills owner found that replacement to high pressure boiler for grid
connecting requires high investment cost and insignificant as the current capacity is capable to supply
the palm mills daily operations [35]. In addition, palm mills located in remote areas are reluctant to
replace their current inefficient boiler for connection to the grid to due to the distance of the mills from
the grid lines which can be quite far for RE business. However, the scenario will be different if the
infrastructure cost such as the transmission line is borne by the government [36]. Instead of supplying
the surplus electricity to the grid, palm oil mills in remote area should have the option to supply to
the rural communities nearby with comparable tariffs charged especially in Sabah and Sarawak by
turning the plants into small-scale IPPs [37].
Notwithstanding this, over-reliance on the use of MF and PKS for boiler feedstock is due to lack
of development of biomass conversion technology in Malaysia. Diversification of fuels is a sensible
solution to avoid overreliance on the existing boiler fuels such as utilisation of other residues like EFB,
OPF, OPT and POME. Therefore, pre-treatment technology that is able to process these residues into
fuel is crucial. Moreover, a smart-partnership collaboration of technology provider with government is
significant to use the technology at economies of scale.
Economic viability and feasibility study are required to identify a suitable location and to ensure
sufficient supply of fuels, avoiding high transportation cost as well as determining a reasonable size or
capacity for the plant. The upfront costs which correspond to a high payback period of pre-treatment
technology can be compensated by better operability of the fuel in handling, storage, transportation
and operability of the boiler and combustion process.
4. Solid Waste Management
Solid waste management falls under the purview of both the federal and state government.
Malaysia is made of 13 states and 3 federal territories. In 2017, only 8 states and federal territories,
including Kuala Lumpur, Putrajaya, Melaka, Perlis, Negeri Sembilan, Pahang, Kedah and Johor
have adopted the Solid Waste and Public Cleansing Management Act 2007 (Act 672), where the
National Solid Waste Management Department (NSWMD) under Ministry of Housing and Local
Government has national oversight on MSW management while the remaining under the purview
of state government authorities. In order to facilitate handling of MSW through an integrated
management system, the collection of MSW was privatized, and concessions were given to handle the
waste collection in three different regions; southern, northern and eastern.
The NSWMD assisted by the Solid Waste Management and Public Cleansing Corporation (SWCorp)
develops solid waste and public cleansing policies and strategies, action plans, and formulates
the necessary legislative measures to support management at the Federal level. The Act 672 was
enacted as a measure to standardise the level of Solid Waste Management and Public Cleansing
across all local authorities in order to create an economically and environmentally sound solid waste
management industry.
Solid wastes are generally categorized into five groups, namely MSW, industrial wastes, hazardous
wastes, agricultural wastes and e-wastes. The MSW is the main source of waste that contributes to the
large amount generated compared to the other types of waste. For that reason, MSW does not qualify
as biomass as it has a mix of discarded organic and non-organic materials or trash including plastic,
glass and metals. Scheduled and hazardous wastes, generated from industrial activities requires
proper handling, treatment and disposal are regulated under the Environmental Quality Act 1974Sustainability 2019, 11, 1060 14 of 23
(Act 127) and the Environmental Quality (Scheduled Waste) Regulations 2005 under the purview of
Ministry of Energy, Science, Technology, Environment and Climate Change.
4.1. Municipal Solid Waste (MSW) Composition and Characterisation
Landfilling remains the most common MSW disposal method in Malaysia with 150 landfills in
2017 which comprised 18 sanitary landfills and 132 non sanitary landfills [38]. Malaysia aimed to
Sustainability
divert 40% of 2019,
the11,waste
x FORfrom
PEER the landfilling. In 2020, the government target to achieve 22% recycling 17 of 27
rate and 1 waste to energy (WtE) thermal plant and by year 2030, a 28% recycling rate with 3 WtE
thermalTheplants
MSW [7].composition differs from one location to another as it depends on seasons,
geographical region
The MSW composition and socio‐economic.
differs from oneInlocation
a studytoconducted
another asbyit [40], the MSW
depends studied
on seasons, in Malaysia
geographical
is divided into household waste, industrial, commercial and institutional
region and socio-economic. In a study conducted by [39], the MSW studied in Malaysia is divided (ICI) waste.
Approximately
into household waste, 45% ofindustrial,
Malaysiancommercial
household waste was food waste
and institutional (ICI) and 46%Approximately
waste. of ICI waste was
45%from
of
plastic and paper Figure 4).
Malaysian household waste was food waste and 46% of ICI waste was from plastic and paper (Figure 4).
Others
Leather
Household hazardous waste
Wood
Tetra Pak Industries, Commercial and
Rubber Institutional Waste
Metal Household waste
Textiles
Glass
Garden waste
Diapers
Paper
Plastics
Food Waste
0 5 10 15 20 25 30 35 40 45 50
Percentage, %
Figure 4. Average Malaysian household and industrial, commercial and institutional (ICI) waste
Figure 4. Average Malaysian household and industrial, commercial and institutional (ICI) waste
composition [39].
composition [40].
The large organic waste disposed to landfills caused large volume of methane gas 21 to 25 times
The large
the global organic
warming waste (GWP)
potential disposed to landfills
from anaerobic caused large volume
condition. Malaysia ofproduced
methane gas
23%21oftomethane
25 times
the global warming potential (GWP) from anaerobic condition. Malaysia
from the total GHGs emission where 90.9%, 8.6% and 1% was generated from landfills, POME produced 23%andof
methane from the total GHGs emission where 90.9%, 8.6% and 1% was generated
bio effluent [7]. The MSW proximate and ultimate analysis together with average heavy metals are from landfills,
POME and
tabulated bio effluent
in Tables 12–14.[7]. The MSW proximate and ultimate analysis together with average heavy
metals are tabulated in Table 12–Table 14.
4.2. Availability and Energy Potential from MSW
4.2. Availability and Energy Potential from MSW
With a population of 32,022,600 in 2017, the daily MSW generation in Malaysia is estimated
Withtonnes
at 37,466 a population
per dayof or32,022,600 in 2017,
13.68 Mt per year the
at adaily
1.17 kgMSW generation
average in capita
rate per Malaysia
perisday
estimated
of wasteat
37,466 tonnes
generated fromper day or 13.68
household, Mt per industrial
commercial, year at a and
1.17 institution
kg average[39].
rateThe
peraverage
capita per day of MSW
Malaysian waste
generated from household, commercial, industrial and institution [40]. The average
calorific value was determined at 5060 kcal/kg [39]. The MSW availability and energy potential from Malaysian MSW
calorific value was determined at 5060 kcal/kg [40]. The MSW availability and energy
2014 to 2017 are tabulated in Table 15. The reported average thermal efficiency of coal power stationspotential from
2014
as to 2017 are
a measure tabulatedpower
of potential in Table 15. The reported
generation were then average
usedthermal efficiency
to determine of coal
thermal power
power stations
potential
as a measure of potential power generation were then used to determine thermal
of MSW for that particular year [4]. Considering that the average thermal efficiency of coal-firedpower potential of
MSW for that particular year [4] . Considering that the average thermal efficiency of coal‐fired power
stations in Peninsular Malaysia is 35.67%, 8.57 TWh energy is generated with installed capacity
1,190.42 MW from MSW.
Table 12. Calorific value, bulk density and proximate analysis of MSW [40].
Lower Heating Average Volatile FixedSustainability 2019, 11, 1060 15 of 23
power stations in Peninsular Malaysia is 35.67%, 8.57 TWh energy is generated with installed capacity
1190.42 MW from MSW.
Table 12. Calorific value, bulk density and proximate analysis of MSW [39].
Higher Lower Heating Average Volatile Fixed
Moisture Ash
Heating Value, Value, Bulk Matter Carbon
Content Content
HHVdry, LHVwet, kJ/kg Density Content Content
(wt. %) (wt.%)
kJ/kg (kcal/kg) (Kcal/kg) (kg/m3 ) (wt.%) (wt.%)
Household Waste 21,185 (5060) 6325 (1511) 202.54 59.45 8.65 20.79 11.10
ICI Waste 20,765 (4960) 7727 (1846) 134.38 51.75 8.40 26.57 13.28
Table 13. Ultimate analysis of MSW [39].
Organic Ash Total
Nitrogen Carbon Hydrogen Oxygen Sulphur
Chlorine content Chlorine
(wt.%) (wt.%) (wt.%) (wt.%) (wt.%) (wt.%) (wt.%) (wt.%)
Household Waste 1.05 17.36 5.89 5.89 3.35 0.04 6.96 -
ICI Waste 1.37 24.11 5.00 9.09 0.08 0.07 8.36 0.17
Table 14. Average heavy metals of MSW (wet basis, %) [39].
Part per Million (ppm) Household Waste ICI Waste
Mercury 0.092 0.127
Vanadium 3.59 1.371
Chromium 46.58 21.94
Manganese 21.97 7.71
Iron 318.27 163.17
Cobalt 0.53 0.51
Copper 5.92 4.59
Zinc 19.35 10.06
Arsenic 0.66 0.50
Silver 0.66 0.31
Cadmium 2.38 0.64
Lead 1.98 1.59
Aluminium 148.23 118.27
Magnesium 88.30 31.22
Nickel 1.94 2.29
Note: Non-combustible fraction of the waste removed before analysing the sample.
Table 15. Availability, energy and electrical potential value of solid MSW from 2014 to 2017.
2014 2015 2016 2017
Population 30,708,500 31,186,100 31,633,500 32,022,600
Average rate per capita per day (kg/cap/day) 1.17 1.17 1.17 1.17
MSW Generated per day (tonnes) 35,929 36,488 37,011 37,466
Estimated Annual MSW Generated (tonnes/year) 13,114,065 13,318,024 13,509,086 13,675,251
Average Net Calorific Value of Mixed MSW (MJ/tonnes) [39] 6.325 6.325 6.325 6.325
Energy Potential (PJ/year) 82.95 84.24 85.44 86.50
Power output (TWh/year) 8.36 8.34 8.60 8.57
Power Plant Size (MW) 1161.73 1158.67 1193.75 1190.42
1 MJ = 1/3600 MWh, Plant operates 300 day/year = 7200 h/ year.
In comparison, methane emission energy potential from waste disposal sites is determined by
referring to the method proposed by the Intergovernmental Panel on Climate Change (IPCC) [40].You can also read