Concentrating Solar Power - IRENA RENEWABLE ENERGY TECHNOLOGIES: COST ANALYSIS SERIES
←
→
Page content transcription
If your browser does not render page correctly, please read the page content below
g ppAApER
IRENA woRkINg                                                                  IRENA
                                                                 International Renewable Energy Agency

                        RENEWABLE ENERGY TECHNOLOGIES: COST ANALYSIS SERIES

                                        Volume 1: Power Sector
                                              Issue 2/5

                                Concentrating
                                 Solar Power

                                              June 2012
Copyright (c) IRENA 2012
Unless otherwise indicated, material in this publication may be used freely, shared or reprinted,
but acknowledgement is requested.

About IRENA

The International Renewable Energy Agency (IRENA) is an intergovernmental organisation dedicated
to renewable energy.

In accordance with its Statute, IRENA's objective is to "promote the widespread and increased
adoption and the sustainable use of all forms of renewable energy". This concerns all forms of
energy produced from renewable sources in a sustainable manner and includes bioenergy,
geothermal energy, hydropower, ocean, solar and wind energy.

As of May 2012, the membership of IRENA comprised 158 States and the European Union (EU), out
of which 94 States and the EU have ratified the Statute.

Acknowledgement

This paper was prepared by the IRENA Secretariat. The paper benefitted from an internal IRENA
review, as well as valuable comments and guidance from Luis Crespo (ESTELA), Zuzana Dobrotkova
(IEA), Cedric Philibert (IEA), Christoph Richter (DLR), Giorgio Simbolotti (ENEA), Craig Turchi (NREL)
and Professor XI Wenhua (UNIDO-ISEC).

For further information or to provide feedback, please contact Michael Taylor, IRENA Innovation
and Technology Centre, Robert-Schuman-Platz 3, 53175 Bonn, Germany; MTaylor@irena.org.

This working paper is available for download from www.irena.org/Publications

Disclaimer
The designations employed and the presentation of materials herein do not imply the expression
of any opinion whatsoever on the part of the Secretariat of the International Renewable Energy
Agency concerning the legal status of any country, territory, city or area or of its authorities, or con-
cerning the delimitation of its frontiers or boundaries. The term “country” as used in this material
also refers, as appropriate, to territories or areas.
Preface
Renewable power generation can help countries meet their sustainable development
goals through provision of access to clean, secure, reliable and affordable energy.

Renewable energy has gone mainstream, accounting for the majority of capacity
additions in power generation today. Tens of gigawatts of wind, hydropower and
solar photovoltaic capacity are installed worldwide every year in a renewable energy
market that is worth more than a hundred billion USD annually. Other renewable power
technology markets are also emerging. Recent years have seen dramatic reductions in
renewable energy technologies’ costs as a result of R&D and accelerated deployment.
Yet policy-makers are often not aware of the latest cost data.

International Renewable Energy Agency (IRENA) Member Countries have asked for
better, objective cost data for renewable energy technologies. This working paper aims
to serve that need and is part of a set of five reports on wind, biomass, hydropower,
concentrating solar power and solar pholtovoltaics that address the current costs of
these key renewable power technology options. The reports provide valuable insights
into the current state of deployment, types of technologies available and their costs and
performance. The analysis is based on a range of data sources with the objective of
developing a uniform dataset that supports comparison across technologies of different
cost indicators - equipment, project and levelised cost of electricity – and allows for
technology and cost trends, as well as their variability to be assessed.

The papers are not a detailed financial analysis of project economics. However, they do
provide simple, clear metrics based on up-to-date and reliable information which can be
used to evaluate the costs and performance of different renewable power generation
technologies. These reports help to inform the current debate about renewable power
generation and assist governments and key decision makers to make informed
decisions on policy and investment.

The dataset used in these papers will be augmented over time with new project cost
data collected from IRENA Member Countries. The combined data will be the basis for
forthcoming IRENA publications and toolkits to assist countries with renewable energy
policy development and planning. Therefore, we welcome your feedback on the data
and analysis presented in these papers, and we hope that they help you in your policy,
planning and investment decisions.

Dolf Gielen
Director, Innovation and Technology
Contents
KEY FINDINGS                                                                 i

LIST OF TABLES AND FIGURES                                                  ii

1. INTRODUCTION                                                             1
       1.1 Different measures of cost
       1.2 Levelised cost of electricity generation
2. CONCENTRATING SOLAR POWER TECHNOLOGIES                                   4
       2.1 Parabolic trough collector technology
       2.2 Linear Fresnel collector technology
       2.3 Solar tower technology
       2.4 Stirling dish technology
       2.5 The solar resource, CSP plant design and performance
       2.6 Comparison of CSP technologies
3. GLOBAL CSP MARKET TRENDS                                                11
4. THE CURRENT COST OF CSP                                                 13
       4.1 CAPEX: Capital investment cost
       4.2 Operation and maintenance costs
       4.3 The impact of the solar resource on electricity generation
5. CSP COST REDUCTION POTENTIALS                                           21
       5.1 Research and development priorities for cost reduction
       5.2 Cost reduction of CSP components and performance improvements
       5.3 Overall capital cost reduction potential
       5.4 O&M cost reduction potential
6. THE LEVELISED COST OF ELECTRICITY FROM CSP                              30
       6.1 The current levelised cost of electricity from CSP
       6.2 The LCOE of CSP plants: 2011 to 2015

REFERENCES                                                                 39
ACRONYMS                                                                   41
Key findings
1. Concentrating solar power (CSP) plants are capital intensive, but have virtually zero fuel costs.
Parabolic trough plant without thermal energy storage have capital costs as low as USD 4 600/kW,
but low capacity factors of between 0.2 and 0.25. Adding six hours of thermal energy storage
increases capital costs to between USD 7 100/kW to USD 9 800/kW, but allows capacity factors to be
doubled. Solar tower plants can cost between USD 6 300 and USD 10 500/kW when energy storage
is between 6 and 15 hours. These plant can achieve capacity factors of 0.40 to as high as 0.80.
TABLE 1: CSP COSTS AND PERFORMANCE IN 2011
Installed cost Capacity factor O&M LCOE
(2010 USD/kW) (%) (2010 USD/kWh) (2010 USD/kWh)
Parabolic trough
No storage 4 600 20 to 25 0.14 to 0.36
6 hours storage 7 100 to 9 800 40 to 53
0.02 to 0.035
Solar tower
6 to 7.5 hours storage 6 300 to 7 500 40 to 45 0.17 to 0.29
12 to 15 hours storage 9 000 to 10 500 65 to 80
Note: the levelised cost of electricity (LCOE) assumes a 10% cost of capital
2. Operations and maintenance (O&M) costs are relatively high for CSP plants, in the range USD 0.02 to
USD 0.035/kWh. However, cost reduction opportunities are good and as plant designs are perfected
and experience gained with operating larger numbers of CSP plants savings opportunities will arise.
3. The levelised cost of electricity (LCOE) from CSP plants is currently high. Assuming the cost of capital
is 10%, the LCOE of parabolic trough plants today is in the range USD 0.20 to USD 0.36/kWh and that
of solar towers between USD 0.17 and USD 0.29/kWh. However, in areas with excellent solar resources
it could be as low as USD 0.14 to USD 0.18/kWh. The LCOE depends primarily on capital costs and the
local solar resource. For instance, the LCOE of a given CSP plant will be around one-quarter lower for
a direct normal irradiance of 2 700 kWh/m2/year than for a site with 2 100 kWh/m2/year.
4. With just 1.9 GW of installed CSP capacity, not enough data exists to identify a robust learning curve.
However, the opportunities for cost reductions for CSP plant are good given that the commercial
deployment of CSP is in its infancy. Capital cost reductions of 10% to 15% and modest reductions in
O&M costs by 2015 could see the LCOE of parabolic trough plants decline to between USD 0.18 and
USD 0.32/kWh by 2015 and that of solar tower plants to between USD 0.15 to USD 0.24/kWh.
5. Cost reductions will come from economies of scale in the plant size and manufacturing industry, learning
effects, advances in R&D, a more competitive supply chain and improvements in the performance of
the solar field, solar-to-electric efficiency and thermal energy storage systems. By 2020, capital cost
reductions of 28% to 40% could be achieved and even higher reductions may be possible.
6. Solar towers might become the technology of choice in the future, because they can achieve very high
temperatures with manageable losses by using molten salt as a heat transfer fluid. This will allow higher
operating temperatures and steam cycle efficiency, and reduce the cost of thermal energy storage by
allowing a higher temperature differential. Their chief advantage compared to solar photovoltaics is
therefore that they could economically meet peak air conditioning demand and intermediate loads (in
the evening when the sun isn’t shining) in hot arid areas in the near future.
Cost Analysis of Concentrating Solar Power iList of tables
Table 2.1: Comparison of different CSP technologies 10
Table 3.1: utility-scale CSP capacity by country at the end of 2011/beginning of 2012 11
Table 4.1: Capital costs and key characteristics of parabolic trough and solar tower plant 14
Table 4.2: breakdown of the investment cost of a 50 MW a parabolic trough power plant 17
Table 5.1: Current r&D activities for parabolic trough CSP plants 22
Table 6.1: Estimated LCoE for parabolic trough and solar tower projects in 2011 and 2020 33
Table 6.2: total installed cost for parabolic trough and solar towers, 2011 and 2015 36
Table 6.3: LCoE of CSP parabolic trough and solar tower projects under different discount rate assumptions 37
List of figures
Figure 1.1: renewable power generation cost indicators and boundaries 2
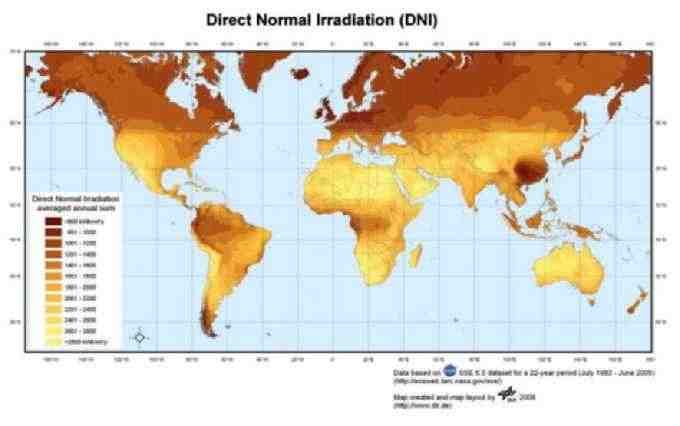
Figure 2.1: Global CSP resource map 7
Figure 2.2: annual capacity factor for a 100 MW parabolic trough plant as a function of solar field size and size of thermal energy storage 8
Figure 4.1: total installed cost for parabolic trough plant commissioned or under construction in 2010 and 2011 14
Figure 4.2: total installed cost breakdown for 100 MW parabolic trough and solar tower CSP plants in South africa 15
Figure 4.3: Parabolic trough cost breakdown 16
Figure 4.4: Solar tower cost breakdown 18
Figure 4.5: operations and maintenance costs for parabolic trough and solar tower plants 19
Figure 4.6: Simplified model of full-load hours as a function of DNI and solar multiple (SM) 20
Figure 5.1: the decrease in component cost with increased plant size for a parabolic trough plant 23
Figure 5.2: Forecast cost reductions for parabolic trough and power tower CSP Plant 27
Figure 5.3: CSP historical cost data, cumulative capacity growth and experience curve 28
Figure 6.1: the LCoE of CSP plants as a function of DNI 31
Figure 6.2: Levelised cost of electricity for 100 MW parabolic trough plant as a function of the size of the solar field and thermal storage 32
Figure 6.3: Estimated LCoE for existing and proposed parabolic trough and solar tower CSP plants 34
Figure 6.4: LCoE breakdown for a parabolic trough and solar tower plant in South africa 34
Figure 6.5: breakdown of LCoE reductions for CSP plant by 2025 35
Figure 6.6: LCoE of parabolic trough CSP plant, 2011 and 2015 36
Figure 6.7: LCoE of solar tower CSP plant, 2011 and 2015 37
ii Cost Analysis of Concentrating Solar Power1. Introduction
R enewable energy technologies can help countries meet their policy goals for secure, reliable and affordable
energy to expand electricity access and promote development. This paper is part of a series on the cost
and performance of renewable energy technologies produced by IRENA. The goal of these papers is to assist
government decision-making and ensure that governments have access to up-to-date and reliable information on
the costs and performance of renewable energy technologies.
Without access to reliable information on the relative 1.1 DIFFErENt MEaSurES oF CoSt
costs and benefits of renewable energy technologies
it is difficult, if not impossible, for governments to Cost can be measured in a number of different ways, and
arrive at an accurate assessment of which renewable each way of accounting for the cost of power generation
energy technologies are the most appropriate for their brings its own insights. The costs that can be examined
particular circumstances. These papers fill a significant include equipment costs (e.g. wind turbines, PV modules,
gap in information availability, because there is a lack solar reflectors), financing costs, total installed cost, fixed
of accurate, comparable, reliable and up-to-date data and variable operating and maintenance costs (O&M),
on the costs and performance of renewable energy fuel costs and the levelised cost of energy (LCOE).
technologies. The rapid growth in installed capacity of
renewable energy technologies and the associated cost The analysis of costs can be very detailed, but for
reductions mean that even data one or two years old comparison purposes and transparency, the approach
can significantly overestimate the cost of electricity from used here is a simplified one. This allows greater scrutiny
renewable energy technologies. There is also a significant of the underlying data and assumptions, improving
amount of perceived knowledge about the cost and transparency and confidence in the analysis, as well as
performance of renewable power generation that is not facilitating the comparison of costs by country or region
accurate, or indeed even misleading. Conventions on how for the same technologies in order to identify what are
to calculate cost can influence the outcome significantly the key drivers in any differences.
and it is imperative that these are well-documented.
The three indicators that have been selected are:
The absence of accurate and reliable data on the cost
and performance of renewable power generation »»Equipment cost (factory gate FOB and
technologies is therefore a significant barrier to the delivered at site CIF);
uptake of these technologies. Providing this information
will help governments, policy-makers, investors and »»Total installed project cost, including fixed
utilities make informed decisions about the role financing costs2; and
renewable can play in their power generation mix. This
paper examines the fixed and variable cost components »»The levelised cost of electricity LCOE.
of concentrating solar power (CSP) plant, by country and
region and provides the levelised cost of electricity for The analysis in this paper focuses on estimating the
CSP power plants, given a number of key assumptions. cost of CSP power generation from the perspective
This up-to-date analysis of the costs of generating of a private investor, whether they are a state-owned
electricity from CSP will allow a fair comparison of CSP electricity generation utility, an independent power
with alternative generating technologies.1 generation promoter, or an individual or community
1
IRENA, through its other work programmes, is also looking at the costs and benefits, as well as the macroeconmic impacts, of renewable power
generation technologies. See WWW.IRENA.ORG for further details.
2
Banks or other financial institutions will often charge a fee, such as a percentage of the total funds sought, to arrange the debt financing of a project.
These costs are often reported separately under project development costs.
Cost Analysis of Concentrating Solar Power 1looking to invest in small-scale renewables (Figure The data used for the comparisons in this paper come
1.1). The analysis excludes the impact of government from a variety of sources, such as business journals,
incentives or subsidies. However, the analysis does not industry associations, consultancies, governments,
take into account any CO2 pricing, nor the benefits auctions and tenders. Every effort has been made to
of renewables in reducing other externalities (e.g. ensure that these data are directly comparable and
reduced local air pollution, contamination of natural are for the same system boundaries. Where this is not
environments). Similarly, the benefits of renewables the case, the data have been corrected to a common
being insulated from volatile fossil fuel prices have not basis using the best available data or assumptions.
been quantified. These issues are important, but are It is planned that these data will be complemented
covered by other programmes of work at IRENA. by detailed surveys of real world project data in
forthcoming work by the agency.
It is important to include clear definitions of the
technology categories, where this is relevant, to ensure An important point is that, although this paper tries to
that cost comparisons can be correctly compared (e.g. examine costs, strictly speaking, the data available are
parabolic troughs vs. solar towers with storage aren’t actually prices, and not even true market average prices,
like-for-like comparisons). Similarly, it is important to but price indicators. The difference between costs and
differentiate between the functionality and/or qualities prices is determined by the amount above, or below,
of the renewable power generation technologies being the normal profit that would be seen in a competitive
investigated (e.g. concentrating solar power with and market. The rapid growth of renewables markets from
without thermal energy storage). It is important to a small base means that the market for renewable
ensure that system boundaries for costs are clearly set power generation technologies is rarely well-balanced.
and that the available data are directly comparable. As a result, prices can rise significantly above costs
Other issues can also be important, such as cost in the short-term if supply is not expanding as fast as
allocation rules for combined heat and power plants, and demand, while in times of excess supply, losses can
grid connection costs. occur and prices may be below production costs. This
Project development Operation &
Site preparation Maintenance
Grid connection Cost of finance
Working capital Resource quality
Transport cost Auxiliary equipment Capacity factor
Import levies Non-commercial cost Life span
Factory gate On site Project cost LCOE
Equipment Equipment
Levelized cost of electricity
(Discounted lifetime cost
divided by discounted
lifetime generation)
FIGURE 1.1: RENEWABLE POWER GENERATION COST INDICATORS AND BOUNDARIES
2 Cost Analysis of Concentrating Solar Powermakes analysing the cost of renewable power generation overhead in terms of the granularity of assumptions
technologies challenging and every effort is made to required. This often gives the impression of greater
indicate whether current equipment costs are above or accuracy, but when it is not possible to robustly
below their long-term trend. populate the model with assumptions, or to differentiate
assumptions based on real world data, then the
The cost of equipment at the factory gate is often “accuracy” of the approach can be misleading.
available from market surveys or from other sources.
A key difficulty is often reconciling different sources of The formula used for calculating the LCOE of renewable
data to identify why data for the same period differ. The energy technologies is:
balance of capital costs in total project costs tends to
vary even more widely than power generation equipment n It + Mt + Ft
costs, as it is often based on significant local content,
Σ t=1 (1+r)t
LCOE =
which depends on the cost structure of where the project
n Et
is being developed. Total installed costs can therefore Σ t=1 (1+r)t
vary significantly by project, country and region,
depending on a wide range of factors.
Where:
LCOE = the average lifetime levelised cost of electricity
1.2 LEVELISED CoSt oF ELECtrICItY generation;
GENEratIoN It = investment expenditures in the year t;
Mt = operations and maintenance expenditures in the year t;
The LCOE of renewable energy technologies varies by Ft = fuel expenditures in the year t;
technology, country and project based on the renewable Et = electricity generation in the year t;
energy resource, capital and operating costs, and r = discount rate; and
the efficiency / performance of the technology. The n = life of the system.
approach used in the analysis presented here is based on
a discounted cash flow (DCF) analysis. This method of All costs presented in this paper are real 2010 USD; that
calculating the cost of renewable energy technologies is is to say, after inflation has been taken into account
based on discounting financial flows (annual, quarterly except where otherwise indicated.3 The LCOE is the price
or monthly) to a common basis, taking into consideration of electricity required for a project where revenues would
the time value of money. Given the capital intensive equal costs, including making a return on the capital
nature of most renewable power generation technologies invested equal to the discount rate. An electricity price
and the fact fuel costs are low, or often zero, the above this would yield a greater return on capital, while a
weighted average cost of capital (WACC), often also price below it would yielder a lower return on capital, or
referred to as the discount rate, used to evaluate the even a loss.
project has a critical impact on the LCOE.
As already mentioned, although different cost measures
There are many potential trade-offs to be considered are useful in different situations, the LCOE of renewable
when developing an LCOE modeling approach. The energy technologies is a widely used measure by which
approach taken here is relatively simplistic, given the fact renewable energy technologies can be evaluated for
that the model needs to be applied to a wide range of modelling or policy development. Similarly, more detailed
technologies in different countries and regions. However, DCF approaches taking into account taxation, subsidies
this has the additional advantage that the analysis is and other incentives are used by renewable energy
transparent and easy to understand. In addition, more project developers to assess the profitability of real world
detailed LCOE analysis results in a significantly higher projects.
3
An analysis based on nominal values with specific inflation assumptions for each of the cost components is beyond the scope of this analysis.
Cost Analysis of Concentrating Solar Power 32. Concentrating solar
power technologies
C oncentrating solar power (CSP) is a power generation technology that uses mirrors or lenses4 to
concentrate the sun’s rays and, in most of today’s CSP systems, to heat a fluid and produce steam. The
steam drives a turbine and generates power in the same way as conventional power plants. Other concepts are
being explored and not all future CSP plants will necessarily use a steam cycle.
The innovative aspect of CSP is that it captures and along a focal line or on a single focal point (with much
concentrates the sun’s energy to provide the heat higher concentration factors). Line-focusing systems
required to generate electricity, rather than using fossil include parabolic trough and linear Fresnel plants and
fuels or nuclear reactions. Another attribute of CSP have single-axis tracking systems. Point-focusing systems
plants is that they can be equipped with a heat storage include solar dish systems and solar tower plants and
system in order to generate electricity even when the sky include two-axis tracking systems to concentrate the
is cloudy or after sunset. This significantly increases the power of the sun.
CSP capacity factor5 compared with solar photovoltaics
and, more importantly, enables the production of
dispatchable electricity, which can facilitate both grid 2.1 ParaboLIC trouGH
integration and economic competitiveness. CoLLECtor tECHNoLoGY
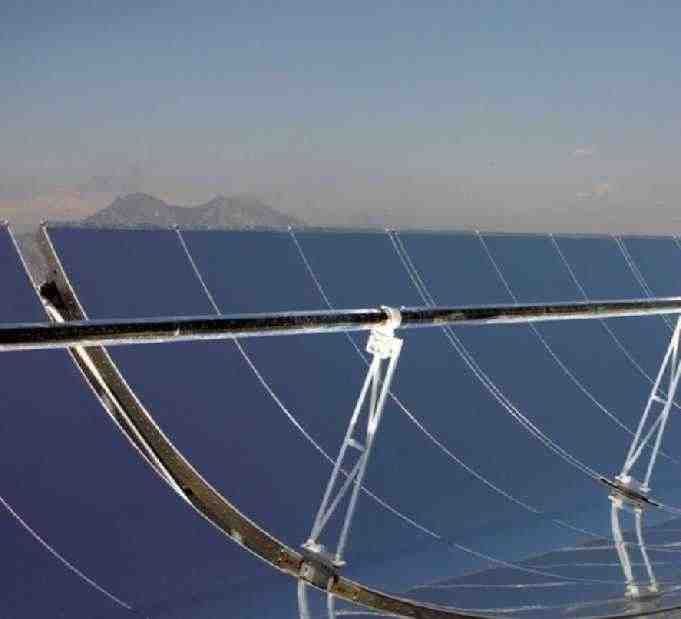
CSP technologies therefore benefit from advances in The parabolic trough collectors (PTC) consist of
solar concentrator and thermal storage technologies, solar collectors (mirrors), heat receivers and support
while other components of the CSP plants are based on structures. The parabolic-shaped mirrors are constructed
rather mature technologies and cannot expect to see by forming a sheet of reflective material into a parabolic
rapid cost reductions. shape that concentrates incoming sunlight onto a central
receiver tube at the focal line of the collector. The arrays
CSP technologies are not currently widely deployed. of mirrors can be 100 metres (m) long or more, with the
A total of 354 MW6 of capacity was installed between curved aperture of 5 m to 6 m. A single-axis tracking
1985 and 1991 in California and has been operating mechanism is used to orient both solar collectors and
commercially since then. After a hiatus in interest heat receivers toward the sun (A.T. Kearney and ESTELA,
between 1990 and 2000, interest in CSP has been 2010). PTC are usually aligned North-South and track
growing over the past ten years. A number of new the sun as it moves from East to West to maximise the
plants have been brought on line since 2006 (Muller- collection of energy.
Steinhagen, 2011) as a result of declining investment
costs and LCOE, as well as new support policies. Spain The receiver comprises the absorber tube (usually metal)
is now the largest producer of CSP electricity and there inside an evacuated glass envelope. The absorber tube is
are several very large CSP plants planned or under generally a coated stainless steel tube, with a spectrally
construction in the United States and North Africa. selective coating that absorbs the solar (short wave)
irradiation well, but emits very little infrared (long wave)
CSP plants can be broken down into two groups, based radiation. This helps to reduce heat loss. Evacuated glass
on whether the solar collectors concentrate the sun rays tubes are used because they help to reduce heat losses.
4
The use of lenses remains a theoretical option, because no CSP plant today, or any planned in the near future, uses lenses.
5
The capacity factor is the number of kWh produced in a year divided by the product of nominal capacity of the plant multiplied by 8 760 (the number
of hours in a year).
6
All capacity values in this paper are electrical, unless otherwise specified.
4 Cost Analysis of Concentrating Solar PowerA heat transfer fluid (HTF) is circulated through the »»The wind loads on LFCs are smaller,
absorber tubes to collect the solar energy and transfer resulting in better structural stability,
it to the steam generator or to the heat storage system, reduced optical losses and less mirror-glass
if any. Most existing parabolic troughs use synthetic oils breakage; and.
as the heat transfer fluid, which are stable up to 400°C.
New plants under demonstration use molten salt at »»The mirror surface per receiver is higher in
540°C either for heat transfer and/or as the thermal LFCs than in PTCs, which is important, given
storage medium. High temperature molten salt may that the receiver is the most expensive
considerably improve the thermal storage performance. component in both PTC and in LFCs.
At the end of 2010, around 1 220 MW of installed These advantages need to be balanced against the fact
CSP capacity used the parabolic trough technology that the optical efficiency of LFC solar fields (referring to
and accounted for virtually all of today’s installed direct solar irradiation on the cumulated mirror aperture)
CSP capacity. As a result, parabolic troughs are the is lower than that of PTC solar fields due to the geometric
CSP technology with the most commercial operating properties of LFCs. The problem is that the receiver is
experience (Turchi, et al., 2010). fixed and in the morning and afternoon cosine losses
are high compared to PTC. Despite these drawbacks, the
relative simplicity of the LFC system means that it may be
2.2 LINEar FrESNEL cheaper to manufacture and install than PTC CSP plants.
CoLLECtor tECHNoLoGY However, it remains to be seen if costs per kWh are lower.
Additionally, given that LFCs are generally proposed
Linear Fresnel collectors (LFCs) are similar to parabolic to use direct steam generation, adding thermal energy
trough collectors, but use a series of long flat, or slightly storage is likely to be more expensive.
curved, mirrors placed at different angles to concentrate
the sunlight on either side of a fixed receiver (located
several metres above the primary mirror field). Each line 2.3 SoLar toWEr tECHNoLoGY
of mirrors is equipped with a single-axis tracking system
and is optimised individually to ensure that sunlight is Solar tower technologies use a ground-based field of
always concentrated on the fixed receiver. The receiver mirrors to focus direct solar irradiation onto a receiver
consists of a long, selectively-coated absorber tube. mounted high on a central tower where the light is
captured and converted into heat. The heat drives a
Unlike parabolic trough collectors, the focal line of thermo-dynamic cycle, in most cases a water-steam
Fresnel collectors is distorted by astigmatism. This cycle, to generate electric power. The solar field consists
requires a mirror above the tube (a secondary reflector) of a large number of computer-controlled mirrors,
to refocus the rays missing the tube, or several parallel called heliostats, that track the sun individually in two
tubes forming a multi-tube receiver that is wide enough axes. These mirrors reflect the sunlight onto the central
to capture most of the focussed sunlight without a receiver where a fluid is heated up. Solar towers can
secondary reflector. achieve higher temperatures than parabolic trough and
linear Fresnel systems, because more sunlight can be
The main advantages of linear Fresnel CSP systems concentrated on a single receiver and the heat losses at
compared to parabolic trough systems are that: that point can be minimised.7
»»LFCs can use cheaper flat glass mirrors, Current solar towers use water/steam, air or molten
which are a standard mass-produced salt to transport the heat to the heat-exchanger/steam-
commodity; turbine system. Depending on the receiver design and
the working fluid, the upper working temperatures
»»LFCs require less steel and concrete, as the can range from 250°C to perhaps as high 1 000°C for
metal support structure is lighter. This also future plants, although temperatures of around 600°C
makes the assembly process easier; will be the norm with current molten salt designs. The
7
In addition to power generation, solar towers could therefore also be used in many applications where high temperature heat or steam is required.
Cost Analysis of Concentrating Solar Power 5typical size of today’s solar tower plants ranges from 10 towers could potentially achieve significant market share
MW to 50 MW (Emerging Energy Research, 2010). The in the future, despite PTC systems having dominated the
solar field size required increases with annual electricity market to date.
generation desired, which leads to a greater distance
between the receiver and the outer mirrors of the solar Solar tower technology is still under demonstration, with
field. This results in increasing optical losses due to 50 MW scale plant in operation, but could in the long-run
atmospheric absorption, unavoidable angular mirror provide cheaper electricity than trough and dish systems
deviation due to imperfections in the mirrors and slight (CSP Today, 2008). However, the lack of commercial
errors in mirror tracking. experience means that this is by no means certain
and deploying solar towers today includes significant
Solar towers can use synthetic oils or molten salt as technical and financial risks.
the heat transfer fluid and the storage medium for
the thermal energy storage. Synthetic oils limit the
operating temperature to around 390°C, limiting the 2.4 StIrLING DISH tECHNoLoGY
efficiency of the steam cycle. Molten salt raises the
potential operating temperature to between 550 and The Stirling dish system consists of a parabolic dish-
650°C, enough to allow higher efficiency supercritical shaped concentrator (like a satellite dish) that reflects
steam cycles although the higher investment costs direct solar irradiation onto a receiver at the focal point
for these steam turbines may be a constraint. An of the dish. The receiver may be a Stirling engine (dish/
alternative is direct steam generation (DSG), which engine systems) or a micro-turbine. Stirling dish systems
eliminates the need and cost of heat transfer fluids, require the sun to be tracked in two axes, but the high
but this is at an early stage of development and energy concentration onto a single point can yield very
storage concepts for use with DSG still need to be high temperatures. Stirling dish systems are yet to be
demonstrated and perfected. deployed at any scale.
Solar towers have a number of potential advantages, Most research is currently focussed on using a Stirling
which mean that they could soon become the preferred engine in combination with a generator unit, located
CSP technology. The main advantages are that: at the focal point of the dish, to transform the thermal
power to electricity. There are currently two types of
»»The higher temperatures can potentially Stirling engines: Kinematic and free piston. Kinematic
allow greater efficiency of the steam cycle engines work with hydrogen as a working fluid and have
and reduce water consumption for cooling higher efficiencies than free piston engines. Free piston
the condenser; engines work with helium and do not produce friction
during operation, which enables a reduction in required
»»The higher temperature also makes the use maintenance.
of thermal energy storage more attractive
in order to achieve schedulable power The main advantages of Stirling dish CSP technologies
generation; and are that:
»»Higher temperatures will also allow greater »»The location of the generator - typically,
temperature differentials in the storage in the receiver of each dish - helps reduce
system, reducing costs or allowing greater heat losses and means that the individual
storage for the same cost. dish-generating capacity is small, extremely
modular (typical sizes range from 5 to
The key advantage is the opportunity to use thermal 50 kW) and are suitable for distributed
energy storage to raise capacity factors and allow a generation;
flexible generation strategy to maximise the value of
the electricity generated, as well as to achieve higher »»Stirling dish technologies are capable of
efficiency levels. Given this advantage and others, if costs achieving the highest efficiency of all types
can be reduced and operating experience gained, solar of CSP systems;
6 Cost Analysis of Concentrating Solar Power»»Stirling dishes use dry cooling and do not 2.5 tHE SoLar rESourCE, CSP PLaNt
need large cooling systems or cooling DESIGN aND PErForMaNCE
towers, allowing CSP to provide electricity
in water-constrained regions; and CSP plants require abundant direct solar radiation in
order to generate electricity, given that only strong
»»Stirling dishes, given their small foot print direct sunlight can be concentrated to the temperatures
and the fact they are self-contained, can be required for electricity generation. This limits CSP to hot,
placed on slopes or uneven terrain, unlike dry regions. To be economic at present requires a CSP
PTC, LFC and solar towers. plant with direct normal irradiance levels (DNI) of 2 000
kWh/m2/year or more, although there is no technical
These advantages mean that Stirling dish technologies reason why CSP plants cannot run at lower levels.
could meet an economically valuable niche in many
regions, even though the levelised cost of electricity is CSP plants in areas with high DNI will have a lower LCOE,
likely to be higher than other CSP technologies. Apart all else being equal, than one located in an area with a
from costs, another challenge is that dish systems cannot lower DNI. Higher levels of DNI have a strong impact,
easily use storage. Stirling dish systems are still at the although not one-to-one, on the LCOE.
demonstration stage and the cost of mass-produced
systems remains unclear. With their high degree of Globally; there a number of regions with an excellent
scalability and small size, stirling dish systems will be an solar resource that is suitable for CSP plants. They
alternative to solar photovoltaics in arid regions. include North Africa, Middle East, Southern Africa,
Australia, the Western United States and parts of South
America (Figure 2.1). Good resources are much more
widely distributed, but will not be as attractive for CSP
plants until costs start to decline.
figure 2.1: global CSP reSourCe maP
Source: DLR.
Cost Analysis of Concentrating Solar Power 7Solar field sizing, thermal storage, capacity The solar multiple is an important parameter to optimise
factors and the solar multiple the plant design and the thermal energy needed to
The parameters that determine the optimal plant ensure that the power block is effectively utilised
design are many. An important consideration is the throughout the year. The solar multiple is the actual size
role of thermal energy storage. Thermal energy storage of the solar field relative to what would be required to
increases costs, but allows higher capacity factors, reach the rated electrical capacity at the design point. To
dispatchable generation when the sun is not shining and/ guarantee that the power block is effectively used during
or the maximisation of generation at peak demand times. the year, the solar multiple is usually larger than unity
Costs increase, because of the investment in thermal and is typically between 1.3 and 1.4. It can be even larger
energy storage, but also if the solar field size is increased (up to 2.0) if the plant has a six-hour storage system.
to allow operation of the plant and storage of solar heat
to increase the capacity factor. NREL has developed a model for conducting performance
and economic analysis of CSP plants. The model can
Although much depends on the design of the specific compare various technology options and configurations
project and whether the storage is being used just to in order to optimise the plant design. Figure 2.2 shows
shift generation, or increase the capacity factor, the data the relationship between capacity factor (20% to 60%)
currently available suggest that the incremental cost is and thermal energy storage in hours (h) for different
economically justifiable, as CSP plants with storage have solar multiples in regions with a good solar resource. The
a similar or lower LCOE than those without. They also trade-off between the incremental costs of the increased
have lower O&M costs per kWh, because the fixed O&M solar field and the storage system must be balanced
costs, of which service staff is the largest contributor, are against the anticipated increase in revenue that will accrue
lower per megawatt as the plant size increases. from higher production and the ability to dispatch power
generation at times when the sun is not shining.
0.7
0.6
0.5 Solar Multiple
Annual capacity factor
1.0
0.4
1.2
1.5
0.3
1.8
2.1
0.2
2.5
3.0
0.1
3.5
0.0
3 6 9 12 15 18
Thermal energy storage (Hours)
figure 2.2: annual CaPaCiTy faCTor for a 100 mw ParaboliC Trough PlanT aS a funCTion of Solar field Size and Size of Thermal energy STorage
Source: Turchi, 2010a.
8 Cost Analysis of Concentrating Solar Power2.6 CoMParISoN oF CSP tECHNoLoGIES utility-size plants, represent a less flexible, but low-risk
option today.
In Table 2.1 a comparison of the major features of the
four main types of CSP technologies — Parabolic and There is increased interest in solar towers operating at
Fresnel trough, Solar tower and Parabolic dish — are high temperatures using molten salt or other alternatives
summarised. These CSP technologies differ significantly to synthetic oil as the heat transfer fluid and storage
from one another, not only with regard to technical and medium due to the potential for cost reduction, higher
economic aspects, but also in relation to their reliability, efficiency and expanded energy storage opportunities.
maturity and operational experience in utility scale
conditions. Solar towers using molten-salt as a high temperature
heat transfer fluid and storage medium (or other high
Parabolic trough plant are the most widely commercially temperature medium) appear to be the most promising
deployed CSP plant, but are not a mature technology and CSP technology for the future. This is based on their
improvements in performance and cost reductions are low energy storage costs, the high capacity factor
expected. Virtually all PTC systems currently deployed achievable, greater efficiency of the steam cycle and
do not have thermal energy storage and only generate their firm output capability.
electricity during daylight hours.
While the levelised cost of electricity (LCOE) of parabolic
Most CSP projects currently under construction or trough systems does not tend to decline with higher
development are based on parabolic trough technology, capacity factors, the LCOE of solar towers tends to
as it is the most mature technology and shows the lowest decrease as the capacity factor increases. This is mainly
development risk. Parabolic troughs and solar towers, due to the significantly lower specific cost (up to three
when combined with thermal energy storage, can meet times lower) of the molten-salt energy storage in solar
the requirements of utility-scale, schedulable power plant. tower plants.
Solar tower and linear Fresnel systems are only beginning CSP technologies offer a great opportunity for local
to be deployed and there is significant potential to manufacturing, which can stimulate local economic
reduce their capital costs and improve performance, development, including job creation. It is estimated that
particularly for solar towers. However, parabolic trough solar towers can offer more local opportunities than
systems, with their longer operational experience of trough systems (Ernst & Young and Fraunhofer, 2010).
Cost Analysis of Concentrating Solar Power 9Table 2.1: ComPariSon of differenT CSP TeChnologieS
Parabolic Trough Solar Tower Linear Fresnel Dish-Stirling
Typical capacity 10-300 10-200 10-200 0.01-0.025
(MW)
Maturity of Commercially proven Pilot commercial Pilot projects Demonstration projects
technology projects
Key technology Abengoa Solar, Abengoa Solar, Novatec Solar, Areva
providers SolarMillennium, Sener BrightSource, Energy,
Group, Acciona, Siemens, eSolar, SolarReserve,
NextEra, ACS, SAMCA, etc. Torresol
Technology Low Medium Medium Medium
development risk
Operating 350-550 250-565 390 550-750
temperature (oC)
Plant peak 14-20 23-35* 18 30
efficiency (%)
Annual solar-to- 11-16 7-20 13 12-25
electricity efficiency
(net) (%)
Annual capacity 25-28 (no TES) 55 (10h TES) 22-24 25-28
factor (%) 29-43 (7h TES)
Collector 70-80 suns >1 000 suns >60 suns (depends on >1 300 suns
concentration secondary reflector)
Receiver/absorber Absorber attached to External surface or Fixed absorber, no Absorber attached to
collector, moves with cavity receiver, fixed evacuation secondary collector, moves with
collector, complex design reflector collector
Storage system Indirect two-tank molten Direct two-tank molten Short-term pressurised No storage for Stirling
salt at 380oC (dT=100K) or salt at 550oC steam storage dish, chemical storage
Direct two-tank molten salt (dT=300K) (3. Global CSP
market trends
T he Luz Company of the United States built the “Solar Energy Generating Systems” (SEGS-I to SEGS-IX) in
the Mohave Desert of southern California between 1985 and 1991. These parabolic trough plants are still in
commercial operation today and have demonstrated the long-term viability of CSP. However, no other CSP plants
were built between 1991 and 2006.
After more than 15 years, activity re-started with the Egypt and Morocco; others are under construction in
construction of a 1 MW plant in Arizona, the solar tower Italy and the USA. One small solar field (LFR) currently
plant “PS10” (11 MW) in Spain and a 64 MW plant in assists a large coal plant in Australia. (Ernst & Young and
Nevada in 2006. Since then, many more plants have Fraunhofer, 2011; and CSP Today, 2008).
been completed. There are currently dozens of CSP
plants under construction, and more than 20 GW under At the end of 2010, around 1 229 MW capacity of
development worldwide. The two leading CSP markets commercial CSP plants was in operation worldwide,
are Spain and the United States, driven by government of which 749 MW was installed in Spain, 509 MW in
support schemes, such as tax incentives and renewable the United States and 4 MW in Australia (NREL, 2012).
portfolio standards in the United States, and feed-in By the end of March 2012 the global installed capacity
tariffs in Spain. Together, these two countries contain of CSP plant had increased to around 1.9 GW. Spain
90% of the current installed CSP capacity (Emerging dominates the total installed capacity, with around 1
Energy Research, 2010). Algeria, Egypt and Morocco 330 MW of installed capacity (AEIST, 2012). The United
have built or are building CSP plants that are integrated States has the second largest installed capacity, with 518
with natural gas combined-cycle plants. Australia, MW operational at the end of 2011 (Table 3.1).
China, India, Iran, Israel, Italy, Jordan, Mexico and South
Africa are developing large-scale CSP plant projects in Table 3.1: uTiliTy-SCale CSP CaPaCiTy by CounTry aT The end of
coming years and the United Arab Emirates has already 2011/beginning of 2012
started construction on a project. Country Operating
USA 518
Today, CSP technologies are commercially deployed in
Spain 1 331
the United States and Europe (Spain). The successful
Algeria, Australia, France, Italy and Morocco 75
deployment in these countries is an example for others
with abundant direct solar radiation and cheap land. Source: AEIST, 2012; NREL, 2012; and Photon International, 2009.
Some of the parabolic trough and solar tower plants
already in operation have 6 to 7.5 hours of thermal Today, virtually all (94%) of installed CSP plants are based
storage capacity. Their capacity factors rise from 20% on parabolic trough systems, with an overall capacity
to 28% (with no storage) to 30% to 40%, with 6 to 7.5 of around 1.8 GW. Solar tower plants have an installed
hours of storage (Emerging Energy Research, 2010). In capacity of around 70 MW. There is around 31 MW of
Spain, a 19-20 MW solar tower demonstration plant with Fresnel reflector capacity in Spain and 4 MW in Australia
15 h molten-salt storage built by Gemasolar has recently (Photon International, 2009, NREL, 2012 and AEIST, 2012).
started operation. It should allow almost 6 500 operation
hours per year (74% capacity factor) (Emerging Energy While still limited in terms of global installed capacity,
Research, 2010). Several Integrated Solar Combined CSP is clearly attracting considerable interest. At the
Cycle (ISCC) projects using solar and natural gas have beginning of 2012 Spain had around 873 MW of CSP
been completed or are under development in Algeria, power plants under construction and a further 271 MW
Cost Analysis of Concentrating Solar Power 11in the development pipeline. The United States has 518 The European Solar Industry Initiative projects total
MW operating, around 460 MW under construction installed CSP capacity in Europe could grow to 30 GW by
and gigawatts of capacity being investigated for 2020 and 60 GW by 2030 (Emerging Energy Research,
development (Ernst & Young and Fraunhofer, 2011). 2010). This represents 2.4% and 4.3% of projected EU-27
electricity capacity in 2020 and 2030 respectively. The
The total capacity of projects that have filed for grid IEA’s CSP technology roadmap estimates that global CSP
access in Spain exceeds 10 GW, although not all of capacity could grow to 147 GW in 2020, with 50 GW in
these projects will break ground. Currently, several North America and 23 GW each in Africa and the Middle
large CSP projects are under development in the MENA East if all the conditions of the roadmap are met. By
region, including an ISCC plant in Egypt (20 MW of 2030 total installed capacity of CSP plant in their analysis
solar thermal capacity) and a 100 MW parabolic trough rises to 337 GW and then triples to 1 089 GW by 2050.
plant in the United Arab Emirates (UAE) that should
be completed by the end of 2012 (Ernst & Young and
Fraunhofer, 2011).
Copyright SkyFuel, Inc. 2009.
12 Cost Analysis of Concentrating Solar Power4. The current cost of CSP
A ccording to the IEA (IEA, 2010) and NREL (Sargent and Lundy, 2003), costs of CSP plants can be grouped
into three distinct categories: investment costs (also called capital cost or CAPEX), operation and
maintenance costs (O&M) and financing costs. In this analysis, financing costs are included in the CAPEX, as these
data are often not available separately.
This section examines the cost of CSP technologies. The The cost of parabolic trough and solar tower plants with
cost of electricity from CSP is currently higher than that thermal energy storage is generally between USD 5 000
of conventional fossil fuel technologies. However, cost and USD 10 500/kW (Table 4.1).
reduction opportunities due to large-scale deployment
and technology improvements are significant, and the These cost ranges from the literature are not
LCOE is expected to come down. inconsistent with estimates of recent plant that have
been commissioned in 2010 and 2011, or that are under
construction. Figure 4.1 presents the estimated total
4.1 CaPEX: CaPItaL INVEStMENt CoSt installed capital costs, drawing on data in the media and
various industry sources.9 The data for parabolic trough
Unlike power plants fired by fossil fuels, the LCOE of CSP systems without storage are at the higher end of the
plants is dominated by the initial investment cost, which range identified in the literature, while that for plants
accounts for approximately four-fifths of the total cost. with storage match quite closely data from the literature.
The rest is the cost for operation and maintenance of the
plant and for plant insurance. Although CSP plants with thermal energy storage have
higher specific investment costs (USD/kW) due to the
The current CSP market is dominated by the parabolic storage system and the larger solar field, the greater
trough technology. More than 80% of the CSP power electricity generation will generally result in a lower
plants in operation or under construction are based on electricity generation cost. Energy storage should
this technology. As a consequence, most of the available therefore be looked at carefully, as it can reduce the cost
cost information refers to parabolic trough systems. The of electricity generated by the CSP plant and increase
cost data for parabolic trough systems are also the most electricity production (capacity factors).
reliable, although uncertainties still remain, because it is
the most mature CSP technology. The breakdown of the capital costs of two proposed
CSP plants in South Africa (one a parabolic trough
The current investment cost for parabolic trough and and the other a solar tower) is presented in Figure 4.2.
solar tower plants without storage are between These plants have very similar total capital investments
USD 4 500/kW and USD 7 150/kW (Hinkley, 2011; of USD 914 million for the parabolic trough system and
Turchi, 2010a and IRENA analysis).8 CSP plants with USD 978 million for the solar tower system. The capital
thermal energy storage tend to be significantly more costs for the solar field and receiver system are a larger
expensive, but allow higher capacity factors, the shifting percentage of the total costs in solar tower systems,
of generation to when the sun does not shine and/or the while the thermal energy storage and power block costs
ability to maximise generation at peak demand times. are a smaller percentage.
8
These costs compare to the estimated installed capital costs of the Californian SEGS Rankine-cycle trough systems operating since 1984 of USD 4
000/kW for a plant with a capacity of 30 MW and USD 3 000/kW for plant with a capacity 80 MW (Cohen, 1999).
9
These data should be treated with caution and as order of magnitude estimates, as they are based predominantly on data that are of estimated
project costs. It is not clear what is included in these cost estimates or whether or not there were cost overruns or savings by the time the project was
completed.
Cost Analysis of Concentrating Solar Power 13Table 4.1: CaPiTal CoSTS and key CharaCTeriSTiCS of ParaboliC Trough and Solar Tower PlanT
Source Heat transfer fluid Solar Storage Capacity Cost
multiple (hours) factor (%) (2010 USD/kWe)
Parabolic Turchi, 2010a Synthetic oil 1.3 0 26 4 600
trough
Hinkley, 2011 Synthetic oil 1.3 0 23 7 144
Turchi, 2010a Synthetic oil 2 6 41 8 000
Turchi, 2010b Synthetic oil 2 6.3 47-48 8 950-9 810
Hinkley, 2011 Synthetic oil 2 6 43 7 732
Fichtner, 2010 Molten salt 2.8 4.5 50 7 380
2.5 9 56 7 550
3 13.4 67 9 140
Solar tower Ernst and Young/ Molten salt 7.5 7 280
Fraunhofer, 2011
Turchi, 2010a Molten salt 1.8 6 43 6 300
Kolb, 2011 Molten salt 2.1 9 48 7 427
Hinkley, 2010 Molten salt 1.8 6 41 7 463
Fichtner, 2010 Molten salt 2 9 54 7 720
3 12 68 9 060
3 15 79 10 520
10000
9000
8000
7000
2010 USD/kW
6000
5000
4000
3000
2000
1000
0
Parabolic trough Parabolic trough with storage
figure 4.1: ToTal inSTalled CoST for ParaboliC Trough PlanT CommiSSioned or under ConSTruCTion in 2010 and 2011
Source: IRENA analysis.
14 Cost Analysis of Concentrating Solar PowerOwners costs
Tower
Owners costs
Balance of plant Solar field
Balance of plant
Engineering and
site preparation
Heliostat Contingencies
Heat transfer field
fluid and system Engineering and
site preparation
Contingencies
Thermal
Thermal energy storage
Power Receiver
energy storage
block system Power block
Parbolic trough Solar tower
figure 4.2: ToTal inSTalled CoST breakdown for 100 mw ParaboliC Trough and Solar Tower CSP PlanTS in SouTh afriCa
Note: The parabolic trough system has 13.4 hours of thermal energy storage and the solar tower system 15 hours.
Source: Fichtner, 2010.
Cost breakdown for parabolic troughs estimated to cost USD 364 million (€ 280 million) or
USD 7 280/kW (Ernst & Young and Fraunhofer, 2011).
Looking at a wider range of parabolic trough projects,
based on data from four sources, highlights that the The solar field equipment (510 000 m²) is the most
solar field is by far the largest cost component and capital-intensive part (38.5 %) of this parabolic
accounts for between 35% and 49% of the total installed trough system. The price of a solar collector is mainly
costs of the projects evaluated (Fichtner, 2010; Turchi, determined by the cost of the metal support structure
2010a; Turchi, 2010b; and Hinkley, 2011). However, care (10.7 % of the total plant cost), the receiver (7.1 %), the
must be taken in interpreting these results, as the cost mirrors (6.4 %), the heat transfer system (5.4 %) and the
breakdown depends on whether the project has thermal heat transfer fluid (2.1 %). The thermal energy storage
energy storage or not. The share of the thermal energy system accounts for 10% of total costs, with the salt and
storage system varies from as low as 9% for a plant with the storage tanks being the largest contributors to this
4.5 hours storage, to 20% for a plant with 13.4 hours cost.
storage.11 The heat transfer fluid is an important cost
component and accounts for between 8% and 11% of the Labour represents 17% of the project cost and is an area
total costs in the projects examined. where local content can help reduce costs in developing
countries.12 Based on experience with Andasol 1, the
A detailed breakdown of parabolic trough project costs site improvements, installation of the plant components
is given in Table 4.2. This project, a turn-key 50 MW and completion of the plant will require a workforce of
parabolic trough power plant similar to the Andasol around 500 people.
plant in Spain, has storage capacity of 7.5 hours and is
11
This is for data from the same source, so is directly comparable. It should be noted that the other sources have a significantly higher specific cost for
thermal energy storage, so care should be taken in comparing the data from the three sources.
12
Labour in this table is only the direct labour during power plant construction, it excludes the labour for manufacturing of components.
Cost Analysis of Concentrating Solar Power 15100%
90%
Indirect costs
80%
Power block
and boP
70%
Storage
60%
HtF system
50%
Solar field
40%
Site
30%
improvements
20%
10%
0%
6 hours storage 6.3 hours storage 4.5 hours storage 9 hours storage 13.4 hours storage
(Hinkley, 2011) (Hinkley, 2011) (Fichtner, 2010) (Fichtner, 2010) (Fichtner, 2010)
figure 4.3: ParaboliC Trough CoST breakdown
Note: The data are for 100 MW net plants, except for Turchi, 2010.
Sources: Fichtner, 2010 and Hinkley, 2011.
There are opportunities for local manufacturing and 4.2 oPEratIoN aND MaINtENaNCE CoStS
services all along the value chain. The most promising
components that could be locally manufactured or The operating costs of CSP plants are low compared
provided by developing countries are support structures, to fossil fuel-fired power plants, but are still significant.
mirrors and receivers. While the key services that could The O&M costs of recent CSP plants are not publically
be provided range from assembling and EPC to O&M. available. However, a very detailed assessment of the
O&M costs of the Californian SEGS plants estimated
Cost breakdown for solar towers the O&M costs for these plants to be USD 0.04/kWh13.
The cost breakdown for typical solar tower projects is The replacement of receivers and mirrors, due to glass
different from that of parabolic trough systems. The breakage, are a significant component of the O&M costs.
most notable difference is in the cost of thermal energy The cost of mirror washing, including water costs, is also
storage (Figure 4.4). The higher operating temperature significant. Plant insurance is also an important expense
and temperature differential possible in the storage and the annual cost for this can be between 0.5% to 1%
system significantly reduces the cost of thermal energy of the initial capital cost.
storage. In the analysis of a system with nine hours of
storage, the thermal storage system of the solar tower The O&M maintenance costs of modern CSP plants are
project accounts for 8% of the total costs, while for the lower than the Californian SEGS plants, as technology
parabolic trough it is 16%. Given that the total costs are improvements have reduced the requirement to replace
similar for the two projects, the absolute cost of nine mirrors and receivers. Automation has reduced the
hours of storage for the solar tower project is half that cost of other O&M procedures by as much as 30%. As
of the parabolic trough. a result of improved O&M procedures (both cost and
plant performance), total O&M costs of CSP plants in
the longer run are likely to be below USD 0.025/kWh
(Cohen, 1999).14
13
The main findings of this analysis are summarised in Cohen, 1999.
14
Without publically available data, however, this cannot be verified.
16 Cost Analysis of Concentrating Solar PowerYou can also read