Evidences for a Nutritional Role of Iodine in Plants - Frontiers
←
→
Page content transcription
If your browser does not render page correctly, please read the page content below
ORIGINAL RESEARCH
                                                                                                                                                 published: 17 February 2021
                                                                                                                                               doi: 10.3389/fpls.2021.616868

                                             Evidences for a Nutritional Role of
                                             Iodine in Plants
                                             Claudia Kiferle 1* † , Marco Martinelli 1† , Anna Maria Salzano 2† , Silvia Gonzali 1 ,
                                             Sara Beltrami 1 , Piero Antonio Salvadori 3 , Katja Hora 4 , Harmen Tjalling Holwerda 4 ,
                                             Andrea Scaloni 2 and Pierdomenico Perata 1*
                                             1
                                              Plant Lab, Institute of Life Sciences, Scuola Superiore Sant’Anna, Pisa, Italy, 2 Proteomics and Mass Spectrometry
                                             Laboratory, Institute for the Animal Production System in the Mediterranean Environment (ISPAAM), National Research
                                             Council, Napoli, Italy, 3 Institute of Clinical Physiology, National Research Council, Pisa, Italy, 4 SQM International N.V.,
                                             Antwerpen, Belgium

                                             Little is known about the role of iodine in plant physiology. We evaluated the impact
                                             of low concentrations of iodine on the phenotype, transcriptome and proteome of
                                             Arabidopsis thaliana. Our experiments showed that removal of iodine from the nutrition
                                             solution compromises plant growth, and restoring it in micromolar concentrations is
                           Edited by:
                                             beneficial for biomass accumulation and leads to early flowering. In addition, iodine
             Antonios Chrysargyris,
     Cyprus University of Technology,        treatments specifically regulate the expression of several genes, mostly involved in
                              Cyprus         the plant defence response, suggesting that iodine may protect against both biotic
                        Reviewed by:         and abiotic stress. Finally, we demonstrated iodine organification in proteins. Our
                      Artem Kasianov,
Russian Academy of Sciences, Russia
                                             bioinformatic analysis of proteomic data revealed that iodinated proteins identified in
           Iwona Ledwożyw-Smoleń,          the shoots are mainly associated with the chloroplast and are functionally involved in
   University of Agriculture in Krakow,
                                             photosynthetic processes, whereas those in the roots mostly belong and/or are related
                                 Poland
                                             to the action of various peroxidases. These results suggest the functional involvement
                     *Correspondence:
                           Claudia Kiferle   of iodine in plant nutrition.
               c.kiferle@santannapisa.it;
                        c.kiferle@sssup.it   Keywords: iodine, Arabidopsis, plant growth, plant nutrition, plant phenotype, transcriptomics, proteomics
                    Pierdomenico Perata
               p.perata@santannapisa.it
     † These   authors have contributed
                                             INTRODUCTION
                    equally to this work
                                             Plants need macro- and micro-nutrients for their growth and development. Nutrients are chemical
                   Specialty section:
                                             elements that are components of biological molecules and/or influence essential metabolic
         This article was submitted to       functions. The elements that to date are considered as plant nutrients are C, H, O, N, P, K
                        Plant Nutrition,     (primary nutrients), Ca, Mg, S (secondary nutrients), and Fe, Zn, Cu, Mn, B, Cl, Mo, Co, and Ni
               a section of the journal      (micro-nutrients) (Mengel and Kirkby, 2001).
            Frontiers in Plant Science          Halogens are the least represented chemical group of plant micro-nutrients, chloride being the
         Received: 13 October 2020           only micro-nutrient currently recognised in plant physiology, due to its regulatory action in proton-
         Accepted: 04 January 2021           transfer reactions in the photosystem II (Brahmachari et al., 2018). Studying the effect of different
        Published: 17 February 2021          concentrations and forms of iodine on the growth of several crops of agricultural importance, Borst
                               Citation:     Pauwels (1961) referred to iodine as a micro-nutrient for plant, and a similar conclusion was derived
                 Kiferle C, Martinelli M,    by Lehr et al. (1958) working on tomato.
   Salzano AM, Gonzali S, Beltrami S,           A growing number of recent studies reporting the effect of iodine on plant growth have
  Salvadori PA, Hora K, Holwerda HT,
                                             focused on the benefit of increasing iodine content in plants as a biofortificant in human and
        Scaloni A and Perata P (2021)
       Evidences for a Nutritional Role
                                             animal health (Medrano-Macías et al., 2016; Gonzali et al., 2017). Plant tissues generally increase
                     of Iodine in Plants.    their iodine content following its exogenous administration. However, the presence of iodine as
          Front. Plant Sci. 12:616868.       a trace element/contaminant in the soil/nutrient solution/atmosphere cannot be avoided, thus
       doi: 10.3389/fpls.2021.616868         preventing the effects related to the presence/absence of this element from being easily observed

Frontiers in Plant Science | www.frontiersin.org                                      1                                           February 2021 | Volume 12 | Article 616868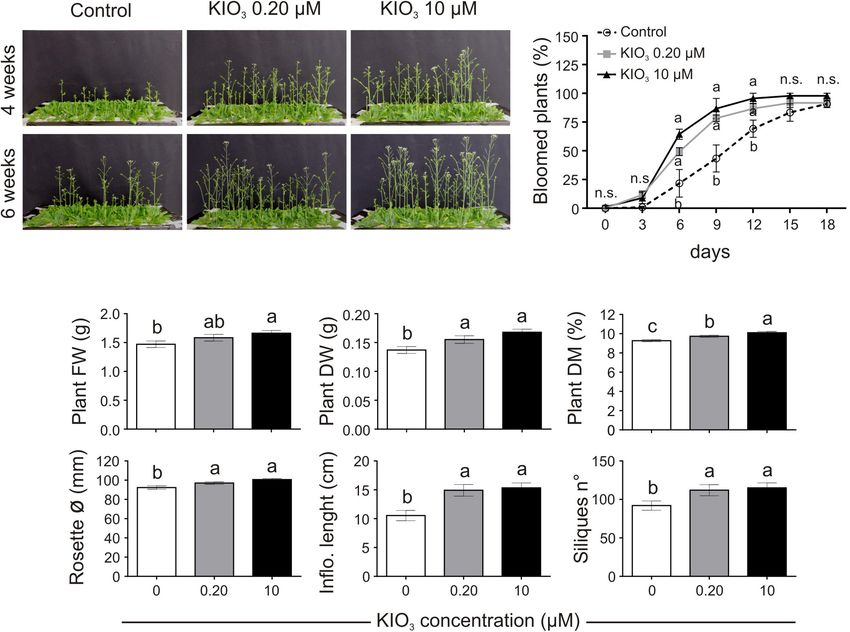
Kiferle et al.                                                                                                               Iodine in Plant Nutrition

(Fuge and Johnson, 1986; Ashworth, 2009). The functional role              Triticum turgidum L., var. durum, and Zea mays L., var.
of iodine as a plant nutrient might therefore have been masked.            saccharata, were used in the experiments, as summarised in
    Plants can absorb iodine from roots or above ground                    Supplementary Figure S1.
structures (stomata and cuticular waxes) (Medrano-Macías et al.,              The cultivation protocol commonly applied in all the
2016; Gonzali et al., 2017), translocate it mainly through                 experiments is described as follows: seeds of the different species
the xylematic route and volatilise it as methyl iodide (CH3 I)             were sown on rockwool plugs and vernalised for 3 days. After
through the action of halide ion-methyltransferase (HMT)                   this period, plants were hydroponically cultivated in a growth
and halide/thiol methyltransferase (HTMT) enzymes (Medrano-                chamber (22◦ C day/18◦ C night with a 12 h photoperiod, a
Macías et al., 2016; Gonzali et al., 2017).                                quantum irradiance of 100 µmol photons m−2 s−1 and a
    Little is known about the chemical forms of iodine inside              relative humidity close to 35%), in a floating system. A base
plant tissues. Inorganic iodine, in particular iodide (I− ),               nutrient solution, renewed once a week, was prepared minimising
however, seems to be predominant (Weng et al., 2008).                      iodine contamination by dissolving in MilliQ water the following
Plants can also incorporate iodine into organic molecules,                 amounts of ultrapure salts: 1.25 mM KNO3 , 1.50 mM Ca(NO3 )2 ,
such as iodosalicylates, iodobenzoates (Smoleń et al.,                    0.75 mM MgSO4 , 0.50 mM KH2 PO4 , 50 µM KCl, 50 µM H3 BO3 ,
2020), monoiodotyrosine (MIT), di-iodotyrosine (DIT) and                   10 µM MnSO4 , 2.0 µM ZnSO4 , 1.5 µM CuSO4 , 0.075 µM
triiodothyronine (T3) (Eales, 1997; Smoleń et al., 2020).                 (NH4 )6 Mo7 O24 , and 72 µM Fe-EDTA. At preparation, the pH
Interestingly, MIT and DIT have a key role in the physiology of            and the electrical conductivity (EC) values were 6.0 and 0.6
vertebrates, as they are precursors of the two thyroid hormones            dS m−1 , respectively, whereas the iodine concentration in the
(THs) triiodothyronine (T3) and L-thyroxine (T4 ) as part of the           nutrient solution was below the detection limit of 8 nM, as
thyroglobulin protein (Zimmermann et al., 2008).                           determined by ICP-MS analysis. The technical peculiarities of
    In plants, the presence of a thyroglobulin-like protein has            each experiment are described in the devoted sections.
never been reported, and the metabolic role of MIT, DIT and
T3 molecules, if any, and their biosynthetic mechanism are still           Phenotypical Determinations
unknown. Nevertheless, protein iodination has been verified in             Two separate experiments were performed. In both experiments,
several seaweed species (Hou et al., 2000; Romarís-Hortas et al.,          Arabidopsis plants were initially fed with the base nutrient
2014), even if it has not yet been demonstrated in plants.                 solution. After 15 days of growth, plants homogeneous in size
    Iodine is likely involved in several physiological and                 and leaf number were selected, grouped, and fed with different
biochemical processes (Medrano-Macías et al., 2016; Gonzali                concentration and/or type of halogen-containing salts added to
et al., 2017). The presence of low concentrations of iodine is often       the nutrient solution. Plants were distributed in nine separate
associated with beneficial effects on plant growth, production             hydroponic trays (three different trays/treatment), and a total
and stress resistance, whereas toxic effects are observed when             number of 90 plants were cultivated for each experimental
applying iodine at high concentrations, especially in the I− form,         condition (30 plants/tray).
which is more phytotoxic than iodate (IO3 − ) (Voogt et al., 2010;            In the first experiment (exp. 1—phenotype), 0.20 or 10 µM
Medrano-Macías et al., 2016; Gonzali et al., 2017; Incrocci et al.,        KIO3 was added to the nutrient solution. One month later,
2019). Thresholds for beneficial or toxic concentrations have              during the formation/elongation of the main inflorescence, half
been reported for all micro-nutrients (Welch and Shuman, 1995).            of the plants (15 plants/tray) was harvested and characterised
Interestingly, the concentrations of iodine added to nutrient              according to the main morphological traits, such as rosette
solutions that have been associated with positive effects for plants       and inflorescence fresh weight (FW), dry weight (DW), dry
(ranging from approximately 102 –104 nM) (Medrano-Macías                   matter content, rosette diameter, and inflorescence length. The
et al., 2016; Gonzali et al., 2017) are comparable with those              remaining half was allowed to complete the growing cycle and
generally effective for other elements described as plant micro-           was characterised in terms of flowering and seed production.
nutrients (Sonneveld, 2002), suggesting that iodine may play a             Flowering, defined as the presence of the first open flower on
similar role in plant nutrition.                                           the stem, was recorded at intervals of 3 days and expressed
    We explored the role of iodine as a nutrient for plants                on a percentage basis. The percentage of bloomed plants/tray
using various experimental approaches. Our results showed that             was calculated at each assessment date. Toward the final
iodine, when supplied at a well-defined concentration range,               part of the plants’ life cycle, a periodical harvesting of the
positively affected the phenotype of Arabidopsis thaliana plants,          produced/matured seeds was carried out until the complete plant
and altered the organism’s transcriptome. Most importantly,                desiccation. Seed production was determined in terms of total
protein iodination was observed for the first time. These results          seed weight/tray (15 plants/tray), number of seeds/silique and
are strongly suggestive of the role of iodine as a plant nutrient.         number of siliques/plant.
                                                                              In the second experiment (exp. 2—phenotype), plants were
                                                                           treated by adding either KI, NaI or KBr (0, 10, or 30 µM)
MATERIALS AND METHODS                                                      to the nutrient solution. Fifteen days after the salt treatment,
                                                                           half of the plants was characterised in terms of plant FW, DW
Plant Material and Cultivation System                                      and dry matter content, while the other half was subsequently
Plants of Arabidopsis thaliana, ecotype Columbia 0, Solanum                characterised in terms of flowering (recorded with intervals of
lycopersicum L., cv. Micro-Tom, Lactuca sativa L., var. crispa,            2 days), as described for experiment 1-phenothype.

Frontiers in Plant Science | www.frontiersin.org                       2                                  February 2021 | Volume 12 | Article 616868
Kiferle et al.                                                                                                                       Iodine in Plant Nutrition

Total RNA Extraction and Processing                                     performed on 1-month-old plants. The solution of 125 I was
Gene expression analysis was performed on 3-week-old                    prepared by dissolving 60 µl of the commercial radioactive
                                                                        125 I product (2.4 mCi/100 µl—9.41 µM) in 250 ml of base
Arabidopsis plants hydroponically grown on the base nutrient
solution (control plants) or in the same medium to which 10 µM          nutrient solution. Plants were individually transferred into plastic
of KBr, NaI, or KI was added. Plant material was collected 48 h         tubes and treated with the hydroponic solution (with or without
after the beginning of the treatment. Each sample consisted of          Na125 I). Sampling was performed after 48 h of incubation by
a pool of rosettes or roots sampled from three different plants,        collecting leaf and root material, which was immediately frozen in
which were immediately frozen in liquid nitrogen and stored at          liquid nitrogen, and stored at −80◦ C until the analysis. Control,
−80◦ C until further analysis.                                          non-treated plants (no 125 I added during their growth) were used
   Total RNA from rosettes was extracted as described by                in both experiments.
Perata et al. (1997), avoiding the use of aurintricarboxylic
acid. RNA from roots was extracted using the SpectrumTM                 Protein Extraction, Electrophoresis, and
Plant Total RNA Kit (Sigma-Aldrich). RNA was subsequently               Gel Autoradiography
processed for microarray and qPCR analysis. The TURBO DNA-              Leaf and root samples from 125 I-fed and control plants were
free kit (Thermo Fisher Scientific) was used to remove DNA              ground to fine powder in liquid nitrogen. The protein extraction
contaminations and the iScript TM cDNA synthesis kit (Bio-Rad           buffer (50 mM TrisHCl, pH 7.0, 1% w/v SDS, P9599 protease
Laboratories) was used for RNA reverse-transcription.                   inhibitor cocktail, Sigma-Aldrich) was added to the powder. The
                                                                        resulting solution was vortexed vigorously, and then centrifuged
Microarray Analysis                                                     (18,407 g, 30 min, 4◦ C). Radioactive iodine solution (10 µl;
RNA from rosettes and roots was processed and hybridised                prepared as described above) was added to the control samples
to Affymetrix GeneChip Arabidopsis ATH1 Genome Arrays as                during the extraction process to check for the occurrence of false
described by Loreti et al. (2005). Normalisation was performed          positive signals (technical artifacts), possibly due to unspecific
using Microarray Suite 5.0 (MAS5.0). Differentially expressed           binding of iodine with the protein extract.
genes (DEGs) were selected based on the two following criteria:            Protein extracts were dissolved in a 5 × Laemmli buffer,
log2 FC treated/control ≥ 2 and mas5-Detection p ≤ 0.05.                treated at 95◦ C for 10 min, and a volume of 20 µl (corresponding,
In addition, the absolute expression level ≥ 100 mas5-Signal            approximately, to 65 or 20 µg of proteins, in shoot and root
was chosen to select only well-expressed genes. Rosette and             samples, respectively) was loaded to Invitrogen NuPAGE gels
root DEGs resulting from KI, NaI, and KBr treatments were               (10% Bis-Tris Midi Gels, Thermo Fisher Scientific), together
processed and visualised in a Venn diagram. Only DEGs                   with a protein marker (Precision Plus ProteinTM Dual Color
commonly regulated by KI- and NaI-treated plants and not                Standards, Bio-Rad). After electrophoresis, the gel was rinsed in
responding to KBr treatments were considered specifically linked        MilliQ water, and the proteins were fixed (40:7:53 ethanol/glacial
with the iodine treatment. This group of DEGs was then                  acetic acid/H2 O – 30 min) and then stained (EZ Blue Gel
subjected to gene set enrichment using Gorilla1 and analysed with       Staining reagent, Sigma-Aldrich – 30 min) on an orbital shaker.
Mapman2 , whereas the co-expression analysis was performed              After rinsing, gels were exposed to a multipurpose phosphor
using Genevestigator3 .                                                 storage screen (Cyclone Storage Phosphor System, PerkinElmer)
                                                                        in order to obtain a digital image of the radioactivity distribution.
Gene Expression Analysis (RT-qPCR)                                      Radioactive signals were quantified after 72 h of gel exposure
Quantitative PCR (ABI Prism 7300 Sequence Detection System,             using a Cyclone Phosphor Imaging System (PerkinElmer). In
Applied Biosystems) was performed using 30 ng cDNA                      order to prevent the occurrence of any radioactive emissions
and the iQ SYBR Green Supermix (Bio-Rad Laboratories).                  from the control samples, after each image acquisition, gels were
UBIQUITIN10 (At4g05320) and TIP4 (At2g25810.1) were used                re-exposed for 15 days, and the absence of 125 I labelled bands was
as reference genes. Relative expression levels were calculated          verified in the newly acquired images.
using GeNorm4 . The list of the primers and their sequences are
reported in Supplementary Table S1. Four biological replicates          Database Search for Iodinated Peptides
were analysed, each consisting of a pool of rosettes or roots
                                                                        in Protein Datasets From Proteomic Data
sampled from three different plants.
                                                                        Repositories
Feeding With Radioactive Iodine                                         Mass spectrometry data were downloaded from the PRIDE
Two separate experiments were performed by feeding radioactive          (PRoteomics IDEntification database) archive5 (Perez-Riverol
iodine (125 I—NaI, PerkinElmer) to hydroponically grown                 et al., 2019). The PRIDE archive was searched to select
Arabidopsis thaliana (exp. 1—radioactive) or tomato, lettuce,           A. thaliana datasets based on the analysis of specific plant
wheat and maize (exp. 2—radioactive) plants. Treatments were            organs, such as cauline, rosette and roots, and/or subcellular
                                                                        districts, such as chloroplasts and mitochondria. Datasets
1
  http://cbl-gorilla.cs.technion.ac.il                                  were excluded if enrichment/immunopurification strategies were
2
  http://mapman.gabipd.org/mapman                                       used during protein purification. Finally, 21 experimental
3
  https://genevestigator.com
4                                                                       5
  http://medgen.ugent.be/~jvdesomp/genorm                                   https://www.ebi.ac.uk/pride/archive

Frontiers in Plant Science | www.frontiersin.org                    3                                             February 2021 | Volume 12 | Article 616868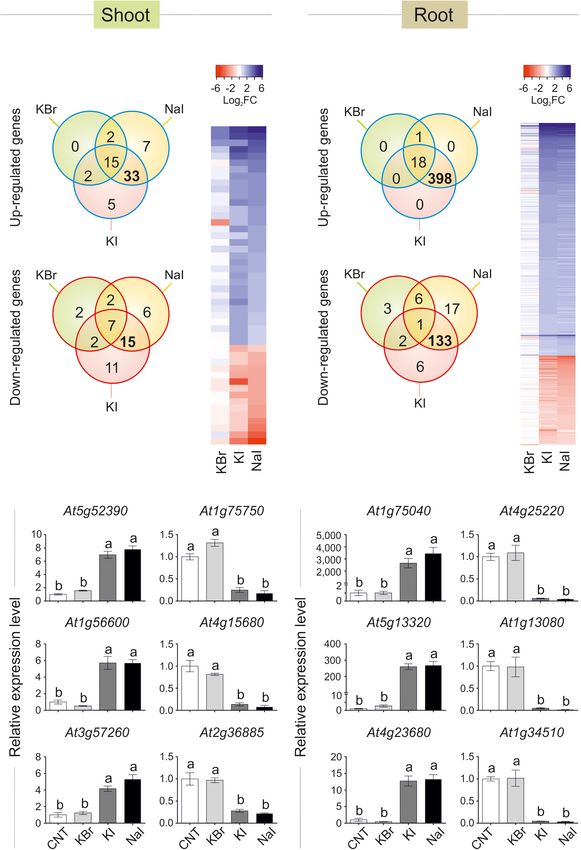
Kiferle et al.                                                                                                                 Iodine in Plant Nutrition

sets of nano-LC-ESI-MS/MS raw data included in 14 PRIDE                      evaluate quantitative levels of modified A. thaliana proteins at
repositories (March 2020) were obtained and re-analyzed                      https://pax-db.org.
by database searching. Only raw files corresponding to the
analysis of control/non-treated plants were downloaded and                   Statistical Analysis
the experimental protocols and the search parameters for each                Data concerning phenotypical determinations and qPCR-based
different dataset were annotated. Supplementary Table S2 lists               gene expression analysis were analysed by one-way ANOVA
the experimental sets, with details on the MS instrument, plant              coupled with the LSD post hoc test, when they followed a
organ and/or subcellular compartment, sample preparation, and                normal distribution and there was homogeneity of variances.
proteomic strategies adopted.                                                When one of these two prerequisites was violated, a Kruskal-
    Raw files were searched separately using Proteome Discoverer             Wallis test for non-parametric statistic was performed and the
2.4 (Thermo Fisher Scientific, United States) with the Mascot v.             significance letters were graphically assigned using a box-and-
2.6 search engine (Matrix Science Ltd., United Kingdom) against              whisker plot with a median notch. Significant differences between
the TAIR10 database6 (71,567 sequences, accessed May 2017) and               the means (P < 0.05) are indicated by different letters in the
a database containing common laboratory contaminants on the                  figures and tables.
MaxQuant website7 . Workflows were built for each experimental
dataset, considering the specific mass tolerance values used for
the original search and reported on the PRIDE repository, or in              RESULTS
the publication associated with the dataset.
    For all the workflows, Cys carbamidomethylation was set                  Effects of Iodine on the Plant Phenotype
as a fixed modification, while iodination at Tyr and His                     The effects of low amounts of KIO3 (0.20 or 10 µM) on
(1m = +125.8966 Da), oxidation at Met, protein N-terminal                    hydroponically grown Arabidopsis plants, compared to plants
acetylation, deamidation at Asp, and pyroglutamate formation at              cultivated on a control nutrient solution, were evaluated in
N-terminal Gln were selected as variable modifications. Isotopic             terms of plant morphology, biomass, and seed production
labelling was also considered in the modification parameters                 (exp. 1-phenotype). No phytotoxicity symptoms were observed
when performed for protein quantification.                                   on plants and the most significant phenotypical effect was a delay
    Trypsin was selected as the proteolytic enzyme and peptides              of flowering in the control plants, compared to KIO3 (either 0.20
were allowed to have a maximum of two missed cleavages. The                  or 10 µM) (Figures 1A,B). Twelve days after the opening of the
minimum peptide length was set at six amino acids. The site                  first flower, plants treated with 0.20 or 10 µM KIO3 were close
probability threshold for peptide modification was set at 75. Only           to complete flowering, as 87 and 96% of the plants had bloomed,
high confidence peptide identifications were retained by setting             respectively, vs. 69% of the control plants (Figure 1B). Control
the target false discovery rate (FDR) for PSM at 0.01 and further            plants took about 18 days to complete blooming.
filtered to keep only peptides (P < 0.05) with a Mascot Ion                      Plant biomass, evaluated 1 month after the addition of KIO3
score > 30. In addition, the results of the identification analysis          to the nutrient solution, was significantly lower in control
were processed by putting together the output of iodinated                   plants, both in FW and DW (Figure 1C). When compared to
peptides from all the datasets and further applying a filter to keep         the control, the plant FW increased by approximately 7.7 and
only those identified with a Mascot Ion score > 50, in at least one          13% with addition of 0.20 and 10 µM KIO3 in the nutrient
dataset, to limit the identification to peptides with the best scoring       solution, respectively, whereas the DW increased by 13 and 22%,
matches and corresponding to high certainty. The presence of the             respectively. The effect on plant FW was mostly ascribable to
MS/MS spectrum of the unmodified counterpart was verified for                the inflorescence, as no significant differences were evident in
each iodinated peptide to further validate the identification.               terms of the rosette FW values (Supplementary Table S3). The
                                                                             concentration of iodine in the nutrient solution had a marked
Protein Bioinformatics                                                       effect on the inflorescence length, which was approximately 41
Proteins containing iodinated peptides were functionally                     and 45% longer compared to the control in 0.20 and 10 µM KIO3
annotated according to MapMan categories by using the                        treated plants, respectively (Figure 1C), and a comparable effect
Mercator pipeline8 . Final outputs were integrated with                      was seen on the inflorescence FW and DW (Supplementary
data from the available literature. Protein interaction                      Table S3). Additionally, the rosette diameter in the control was
networks were obtained with STRING v. 119 , which was                        smaller, and the application of 0.20 or 10 µM KIO3 increased it
also used to provide information on known gene ontology                      by approximately 5 and 9%, respectively (Figure 1C). The plant
categories. Venn diagrams were depicted using a web tool                     dry matter content positively correlated with the increased iodate
at    http://bioinformatics.psb.ugent.be/webtools/Venn. The                  concentrations (Figure 1C).
Protein Abundance Database (PAXdb) was also queried to                           Seed production was determined in terms of total seed weight,
                                                                             seeds/silique and number of siliques/plant. The number of seeds
                                                                             contained in each silique was not affected by iodate treatments
6
  www.arabidopsis.org                                                        (Supplementary Table S3), whereas the number of siliques
7
  https://www.maxquant.org/maxquant/                                         produced by each plant was lower in the control, compared to
8
  http://mapman.gabipd.org/web/guest/app/Mercator                            the addition of both 0.20 and 10 µM KIO3 (Figure 1C). This
9
  http://string-db.org                                                       influenced the total seed production, which, 1 month after the

Frontiers in Plant Science | www.frontiersin.org                         4                                  February 2021 | Volume 12 | Article 616868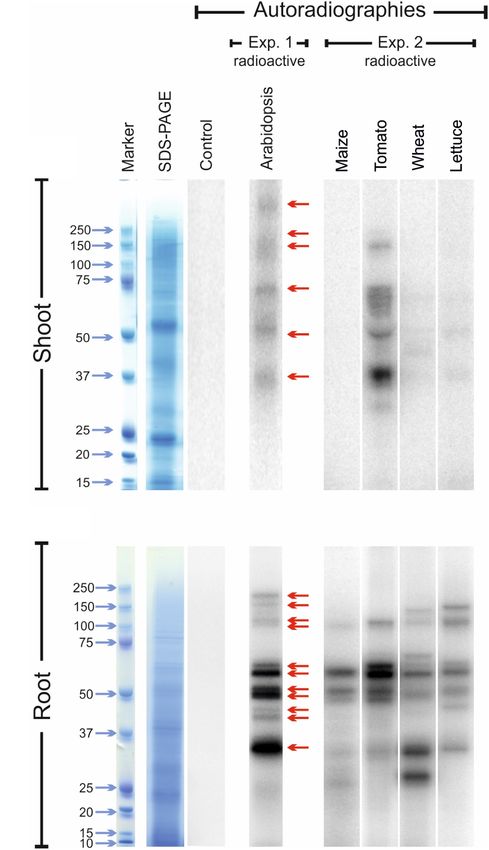
Kiferle et al. Iodine in Plant Nutrition
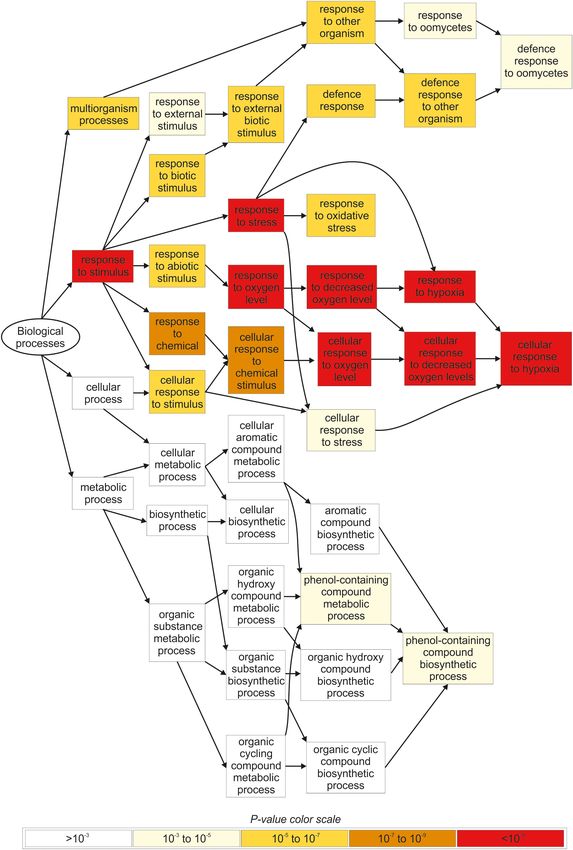
FIGURE 1 | Impact of iodine on plant growth and development (exp. 1-phenotype). (A) Lateral view of plants after 4 or 6 weeks from the onset of KIO3 treatment.
(B) Flowering time curve; the percentage of bloomed plants/tray was calculated every 3 days after the opening of the first flower (day 0). (C) Morphological data on
plant FW, DW, dry matter content, rosette diameter, inflorescence length and number of produced siliques/plant, determined 1 month after the onset of KIO3
treatments. Values indicated by different letters significantly differ from each other (according with one-way ANOVA, LSD post hoc test, P ≤ 0.05). In particular, the
statistical analysis of flowering (B) was performed by comparing the percentage of bloomed plants of each tray (considered as biological replicates) within each
sampling point. When data followed a Normal distribution and there was homogeneity of variances, they were subjected to one-way ANOVA and values indicated by
different letters significantly differ from each other (LSD post hoc test, P ≤ 0.05). When one of this two prerequisite was violated, a Kruskal-Wallis test was
performed. Error bars (±SE) are shown in graphs.
addition of KIO3 to the nutrient solution, was much higher in plants had bloomed vs. 14% of the control plants and 10%
plants treated with iodate (more than 50 and 35%, respectively, and 14% of the 10 and 30 µM KBr-treated plants, respectively.
in 0.20 and 10 µM KIO3 treated plants in comparison with the Moreover, the floral transition was almost complete in 10 µM
control) (Supplementary Table S3). KI- and NaI-fed plants in the subsequent 6 days (10 days after
Adding exogenous iodine in the form of KIO3 countered the day 0). Two and four more days were required for 30 µM KI- and
delay in flowering of control plants (Figures 1A,B). This was NaI-fed plants, respectively (12 and 14 days after day 0), whereas
confirmed in experiment 2 (exp. 2-phenotype), when iodine was the control and KBr-treated plants completed blooming in the
added in the form of KI or NaI (Figures 2A,B). The possible subsequent 18 days (22 days after day 0) (Figure 2A).
effects of potassium or bromide, as an alternative halogen, were
evaluated and then ruled out, as a similar behaviour was observed Effects of Iodine on Gene Expression
in plants treated with KI or NaI, but not with KBr (Figures 2A,B). The response of plants to iodine was analyzed at the
The application of 10 µM KI and NaI promoted flowering, transcriptomic level. To identify genes whose expression was
without negatively impacting the plant biomass production specifically altered by iodine, Arabidopsis plants were treated
(Figure 2C), whereas 30 µM KI or NaI reduced plant growth by adding 10 µM of NaI, KI, or KBr to the nutrient solution,
(Figure 2C), although the promoting effect of iodine on flowering compared to the untreated control plants. The resulting RNAs
was still present (Figures 2A,B). Four days after the opening of were analyzed by hybridisation on ATH1 microarrays. To rule
the first flower (day 0), more than 50% of KI- and NaI-treated out the possible generic effects of halogens, we searched the
Frontiers in Plant Science | www.frontiersin.org 5 February 2021 | Volume 12 | Article 616868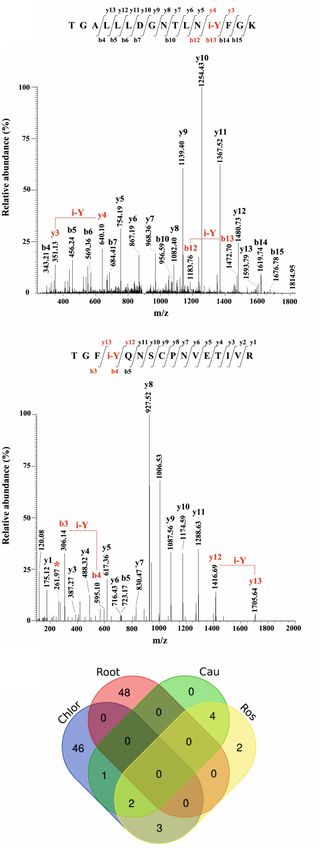
Kiferle et al.                                                                                                                                      Iodine in Plant Nutrition

  FIGURE 2 | Impact of iodine on plant growth and development (exp. 2-phenotype). (A) Flowering curve; the percentage of bloomed plants/tray was calculated every
  2 days after the opening of the first flower (day 0). (B) Representative control, and KI-, NaI- or KBr-treated plants (10 and 30 µM) after 15 days from the onset of the
  treatments. Pictures were taken after 4 days from the opening of the first flower on the main stem. (C) Morphological data on plant FW, DW, dry matter content
  determined 15 days after the onset of the treatments. Values indicated by different letters significantly differ from each other (according with one-way ANOVA, LSD
  post hoc test, P ≤ 0.05). In particular, the statistical analysis of flowering (A) was performed by comparing the percentage of bloomed plants of each tray
  (considered as biological replicates) within each sampling point. When data followed a Normal distribution and there was homogeneity of variances, they were
  subjected to one-way ANOVA and values indicated by different letters significantly differ from each other (LSD post hoc test, P ≤ 0.05). When one of this two
  prerequisite was violated, a Kruskal-Wallis test was performed. Error bars (±SE) are shown in graphs.

microarray dataset for genes that responded to KI and NaI, but                           the analysis of the shoot (Figure 3C) and root (Figure 3D)
not to KBr. In addition, a comparison between KBr- and KI-                               expression data.
treated plants enabled us to rule out the possible transcriptional                          To validate the microarray analysis, a subset of three I− -
regulation of genes exerted by potassium, as K+ ion was                                  induced and three I− -repressed genes were analysed by qPCR,
common to both salts.                                                                    corroborating the specific regulation of iodine on their expression
   Data visualisation with a Venn diagram showed that several                            in both shoot (Figure 3E) and root (Figure 3F) samples.
genes were specifically regulated by iodine, as up- or down-                                The complete list of the KI and NaI commonly and not
regulated genes in both NaI- and KI- but not in KBr-treated                              responding to KBr up- and down-regulated genes is reported in
plants were 33 (51% of DEGs) and 15 (33% of DEGs) in the                                 Supplementary Tables S4, S5 (shoot tissue), and Supplementary
shoot (Figure 3A), and 398 (95% of DEGs) and 133 (79%                                    Tables S6, S7 (root tissue), respectively.
of DEGs) in the root (Figure 3B), respectively. The similarity                              The polypeptides codified by the iodine-regulated genes
and specificity in the expression pattern of KI- and NaI-                                did not show a preferential site of action in the cell, as
treated plants were confirmed by the heatmaps generated from                             their predicted localisations include cytoplasm, chloroplast,

Frontiers in Plant Science | www.frontiersin.org                                     6                                         February 2021 | Volume 12 | Article 616868
Kiferle et al.                                                                                                                                   Iodine in Plant Nutrition

  FIGURE 3 | Transcriptional regulation of gene expression induced by iodine. Venn diagram showing the number of genes differentially regulated in shoot (A) or root
  (B) tissues of KBr-, NaI-, and KI-treated plants (10 µM—48 h), when compared with the control. Heatmap showing the pattern of expression of the genes analysed
  in the shoot (C) or root (D) tissues in response to NaI, KI or KBr treatments, when compared with the control. qPCR validation of selected genes up- or
  down-regulated by iodine treatments (commonly regulated by NaI and KI, but not KBr) in shoot (E) or root (F) tissues. qPCR data are mean ± SE of four biological
  replicates, each composed of a pool of three different rosettes. Values indicated by different letters significantly differ from each other (according with one-way
  ANOVA, LSD post hoc test, P ≤ 0.05).

Frontiers in Plant Science | www.frontiersin.org                                   7                                        February 2021 | Volume 12 | Article 616868
Kiferle et al.                                                                                                              Iodine in Plant Nutrition

cell wall, nucleus, mitochondrion, vacuole and apoplast                      The experiment carried out with Arabidopsis plants revealed
(Supplementary Tables S4–S7).                                            the presence of at least six radio-labelled bands at different
   The gene ontology (GO) analysis identified several                    molecular mass values in the protein extracts from shoot tissues
functional categories regulated by iodine in the roots (Figure 4,        (Figure 5A; exp. 1-radioactive) and eleven radio-labelled bands
Supplementary Figure S2 and Supplementary Tables S8, S9),                from root tissues (Figure 5B; exp. 1-radioactive), indicating
whereas no statistically significant GO terms were identified by         the presence of proteins likely containing iodo-amino acids.
analysing the DEG data on the shoots.                                    Iodinated proteins were preferentially present in root tissues, as
   The most representative biological processes affected by              the abundance and intensity of 125 I-labelled bands were higher in
iodine in the roots were related to the response to stimulus             the root than in the shoot extracts. No radioactive signals were
(GO:0050896), and the downstream categories associated                   observed in the shoot and root control samples (samples added
with response to abiotic (GO:0009628) and biotic stimulus                with 125 I solution during protein extraction).
(GO:0009607) (Figure 4 and Supplementary Table S8). The                      Several 125 I -labelled bands were also observed in the leaf
main molecular functions regulated by iodine in the roots were           extracts of tomato, wheat and lettuce samples, whereas no 125 I-
related to antioxidant (GO:0016209) and oxidoreductase activity          containing bands were visible in the leaf protein extracts of maize
(GO:0016491) and related child terms, in particular peroxidase           (Figure 5A; exp. 2-radioactive). A clear radioactive signal was
activity (GO:0004601) and oxidoreductase activity, acting on             detected in several root proteins extracted from all the species
peroxide as acceptor (GO:0016684) (Supplementary Figure S2               analysed, including maize (Figure 5B; exp. 2-radioactive). Also
and Supplementary Table S9).                                             in this case, the intensity of the radiolabelled bands was higher in
   DEGs analysis performed with MapMan highlighted an over-              root than in shoot extracts. A good degree of conservation of the
representation of several genes in root samples that were related        molecular mass values of the putatively iodinated proteins was
to calcium regulation and protein modification/degradation               observed among the five plant species analysed (Figure 5).
(Supplementary Figure S3A), together with genes encoding
for the large enzyme families including peroxidases,
oxidases, glutathione S-transferases, and cytochrome P450                Identification of Iodinated Proteins in
(Supplementary Figure S3B).                                              Arabidopsis thaliana
   The relatively low number of genes regulated by iodine                The identification of the radiolabelled proteins described above
in the shoots prevented a gene ontology analysis from being              was hampered by the presence of a radioactive isotope,
performed. However, in terms of the most well characterised              which meant that our samples did not meet the safety
genes specifically regulated by iodine treatments in the shoot,          rules for proteomic facilities. To maximise the probability of
the main pathways affected were directly or indirectly involved          success in identifying targets of protein iodination, we then
in biotic (approximately 48 or 40% of up- or down-regulates              focused on the nano-LC-ESI-MS/MS raw data already acquired
genes, respectively) or abiotic (approximately 45 or 33% of up-          within the framework of experimental studies on different
or down-regulates genes, respectively) stress response pathways          organs/subcellular districts of Arabidopsis thaliana, and released
(Supplementary Tables S4, S5). Several genes playing a role              in the public repository PRoteomics IDEntification Database
in the transition to flowering (At4g19191 and At1g75750) and             (PRIDE) Archive (Perez-Riverol et al., 2019).
embryo and pollen development (i.e., At1g21310, At3g54150) are               The datasets considered for our analysis refer to many
also worth mentioning.                                                   different experimental conditions in terms of plant growth,
   The involvement of iodine in the defence response,                    treatment, and cultivation regimen, as well as sample processing
highlighted by the previous analyses performed on root                   and fractionation performed before proteomic analysis. No
samples, was also suggested by querying all publicly available           experiments were explicitly related to iodination studies; the
microarray datasets (see footnote) using the list of iodine-             presence of iodine occurred accidentally, as a consequence
responsive genes of both shoot (Supplementary Figure S4) and             of its natural presence in the cultivation environment (i.e.,
root (Supplementary Figure S5) tissues. The majority of the              soil, air, irrigation water), or because it was conventionally
up- or down-regulated genes were commonly modulated by                   present in the MS growing medium (Murashige and Skoog,
the presence of fungal infection, salicylic acid (SA) or synthetic       1962), which is widely used in studies based on in vitro plant
analogues of SA, such as benzothiadiazole (Kouzai et al., 2018).         tissue culture.
                                                                             In proteins, iodination affects various amino acids, depending
Protein Iodination in Plants                                             on the reaction conditions (Ramachandran, 1956), but generally
Iodine can be found in plant tissues not only in a mineral form          following the reactivity order Tyr >> His ≥ Trp > Cys.
but also in organic compounds (Wang et al., 2014; Smoleń et al.,            Mono-iodination at Tyr and His residues were thus
2020). To verify the possible in vivo incorporation of iodine into       considered in the searching parameters as variable modifications.
proteins, we carried out two different experiments by feeding            The output of the database search, in terms of proteins
hydroponically grown plants with 125 I and carrying out the              iodinated at Tyr or His residues has been reported in
autoradiography of the SDS-PAGE of the relative protein extracts         Supplementary Table S10.
to detect possible radio-labelled proteins. The experiments were             The iodinated peptides were identified in 16 out of the
performed first with Arabidopsis plants, and then with other             21 datasets analysed. A total of 106 iodinated peptides,
species, namely maize, tomato, wheat and lettuce.                        corresponding, respectively, to 42 and 40 protein accessions in

Frontiers in Plant Science | www.frontiersin.org                     8                                   February 2021 | Volume 12 | Article 616868
Kiferle et al. Iodine in Plant Nutrition FIGURE 4 | Overview of the main biological processes affected by iodine based on the GO terms enrichment analysis carried out in root tissues. Only genes regulated in NaI- and KI-treated plants, and not in KBr-treated plants, when compared with the control, were analysed. The figure was extracted from GOrilla (http://cbl-gorilla.cs.technion.ac.il) and reproduced. In this analysis, DEGs with log2 FC ≥ 2.5 or log2 FC ≤ –2.5 were used. Frontiers in Plant Science | www.frontiersin.org 9 February 2021 | Volume 12 | Article 616868
Kiferle et al.                                                                                                                                 Iodine in Plant Nutrition

                                                                                            were processed and visualised in a Venn diagram (Figure 6B).
                                                                                            This showed the presence of the common iodinated peptides for
                                                                                            the chloroplast cauline and rosette subsets. The root subset was
                                                                                            clearly distinct from the other three subsets that were all from the
                                                                                            green parts of the plant.

                                                                                            Iodinated Proteins in A. thaliana Leaves
                                                                                            Iodinated peptides identified in 11 datasets of cauline, rosette,
                                                                                            and leaf-isolated chloroplasts were assigned to 42 proteins
                                                                                            (Supplementary Table S10). Most of the modified species
                                                                                            were in the dataset of chloroplastic proteins (Figure 6B).
                                                                                            STRING interaction analysis of the modified proteins revealed
                                                                                            a single network of 40 iodinated proteins (PPI enrichment
                                                                                            p< 1.0e−16 ) (Supplementary Figure S6A and Supplementary
                                                                                            Table S11). A total of 31 of the 40 proteins in this network
                                                                                            were involved in photosynthesis (GO:0015979) (Supplementary
                                                                                            Table S12), as also attested by their functional analysis, according
                                                                                            to MapMan categories (Supplementary Figure S6B and
                                                                                            Supplementary Table S13). Moreover, the main molecular
                                                                                            functions in which iodinated proteins are involved were related
                                                                                            to chlorophyll binding (GO:0016168), protein domain specific
                                                                                            binding (GO:0019904), tetrapyrrole binding (GO:0046906),
                                                                                            and electron transfer activity (GO:0009055) (Supplementary
                                                                                            Table S12). In particular, ten proteins were identified in two or
                                                                                            more datasets, thus resulting in the most representative targets of
                                                                                            the iodination reaction. Some of these proteins were constituents
                                                                                            of the photosystem II (PSII), i.e., proteins of the reaction centre
                                                                                            (PsbA, PsbB), oxygen evolving centre (PsbO, PsbP) and light
                                                                                            harvesting complex II (LHCB1B1), or part of the photosystem
                                                                                            I (PSI) (PsaF, PETE2). Three proteins showed ribulose-1,5-
                                                                                            bisphosphate carboxylase/oxygenase (RuBisCo) activity and
                                                                                            were involved in the Calvin Cycle (RBCL, ORF110A, RBCS1A).
                                                                                            These proteins were largely abundant in leaf tissues, especially
                                                                                            the PSII component PsbB and RuBisCo large and small chains
  FIGURE 5 | Autoradiographies of the SDS-PAGE gels. Comparison between
  the position and relative intensities of 125 I radiolabelled bands of
                                                                                            (RBCL, RBCS1A), according to the data reported in PAXdb.
  representative shoot (A) and root (B) protein extracts from 125 I treated
  Arabidopsis (exp. 1-radioactive), and maize, tomato, wheat and lettuce plants             Iodinated Proteins in A. thaliana Roots
  (exp. 2-radioactive). Sampling was performed after 48 h of 125 I incubation. In           Iodinated peptides identified in 5 datasets of roots were assigned
  both the experiments, autoradiographies were acquired after 72 h of gel
                                                                                            to 40 proteins (Supplementary Table S10). The STRING
  exposition to the multipurpose phosphor storage screen. Representative
  pictures of total stained protein extracts (SDS-PAGE) and of the
                                                                                            interaction analysis recognised three networks containing 24
  autoradiographies of control samples after 15 days of exposition are also                 of the 40 iodinated proteins (Supplementary Figure S7A
  shown. Controls consisted in protein extracts obtained from plants untreated              and Supplementary Table S11). The GO analysis for these
  with 125 I during their growth, to which the radioactive solution containing 125 I        proteins showed a significant over-representation of biological
  was added during the extraction process.
                                                                                            processes related to the response to stress (GO:0006950), response
                                                                                            to oxidative stress (GO:0006979), response to toxic substances
                                                                                            (GO:0009636), and response to stimulus (GO:0050896). For the
the TAIR10 database of A. thaliana leaves (chloroplast, cauline,                            molecular functions, the most enriched categories were copper
and rosette) (Table 1) and roots (Table 2), were identified.                                ion binding (GO:0005507) and peroxidase activity (GO:0004601)
Iodinated sequences differently modified for deamidation, and/or                            (Supplementary Table S14).
protein N-terminal acetylation, and/or Met oxidation are                                        The functional analysis of the iodinated proteins in roots,
reported as a unique iodinated peptide inventory.                                           according to MapMan categories, highlighted a broad range of
   Most of the modified peptides were found to be iodinated                                 biological roles (Supplementary Figure S7B and Supplementary
at Tyr residues, while His iodination was identified in only                                Table S13). In particular, among the iodinated proteins identified,
five peptides. Representative MS/MS spectra of Tyr-iodinated                                12 were found in two or more datasets. Five proteins belonged
peptides are reported in Figure 6A.                                                         to the classical plant (class III) peroxidase subfamily (At4g30170,
   To evaluate the entire output of iodinated peptides identified,                          At1g05240, At2g37130, At3g01190, At5g17820). The alignment
iodinated sequences for chloroplasts, caulines, rosettes, and roots                         of the protein sequences of the peroxidases mentioned above

Frontiers in Plant Science | www.frontiersin.org                                       10                                   February 2021 | Volume 12 | Article 616868
Kiferle et al. Iodine in Plant Nutrition
TABLE 1 | Iodinated peptides identified in A. thaliana leaves (chloroplast, cauline, and rosette) by database searching of mass spectrometric data retrieved from
PRIDE repository.
Protein accession Description Iodinated sequence Iodinated site DATASET
ATCG00120.1 ATP synthase subunit alpha EAYPGDVFYLHSR [Y3] ChlorBN
SVYEPLQTGLIAIDSMIPIGR [Y3] ChlorBN
ATCG00480.1 ATP synthase subunit beta GIYPAVDPLDSTSTMLQPR [Y3] ChlorBN
GSITSIQAVYVPADDLTDPAPATTFAHLDATTVLSR [Y10] ChlorBN
IVGEEHYETAQQVK [Y7] ChlorBN, Chlo3516
VALVYGQMNEPPGAR [Y5] ChlorBN
VGLTALTMAEYFR [Y11] ChlorBN
AT4G04640.1 ATPase, F1 complex, gamma GLGLEYTVISVGK [Y6] ChlorBN
subunit protein
AT1G29910.1 Chlorophyll A/B binding protein 3 YLGPFSGESPSYLTGEFPGDYGWDTAGLSADPETFAR [Y1]* ChlorBN
AT1G20340.1 Cupredoxin superfamily protein NNAGYPHNVVFDEDEIPSGVDVAK [H7]* CAU, Ros
AT5G66190.1 Ferredoxin-NADP(+)- LVYTNDGGEIVK [Y3] ChlorBN
oxidoreductase
1
AT4G38970.1 Fructose-bisphosphate aldolase 2 ATPEQVAAYTLK [Y9] ChlorBN
AT5G42270.1 FtsH extracellular protease family DYSMATADVVDAEVR [Y2] ChlorBN
AT3G09260.1 Glycosyl hydrolase superfamily CSSYVNAK [Y4] ChlorBN
protein
GPALWDIYCR [Y8] ChlorBN
FGLYYVDFK [Y4]* ChlorBN
AT4G10340.1 Light harvesting complex of SEIPEYLNGEVAGDYGYDPFGLGK [Y15]* ChlorBN
photosystem II 5
TGALLLDGNTLNYFGK [Y13] ChlorBN
AT5G54270.1 Light-harvesting chlorophyll YLGPFSVQTPSYLTGEFPGDYGWDTAGLSADPEAFAK [Y21]* ChlorBN
B-binding protein 3
AT2G34430.1 Light-harvesting chlorophyll-protein YLGPFSGEPPSYLTGEFPGDYGWDTAGLSADPETFAR [Y12]* ChlorBN, PXD010730, LFD
complex II subunit B1
AT2G24940.1 Membrane-associated SFYGSGGDYSMFAGK [Y3] Ros
progesterone binding protein 2
AT4G22890.5 PGR5-LIKE A FLEASMAYVSGNPILNDEEYDKLK [Y20] ChlorBN
ATCG00540.1 Photosynthetic electron transfer A GGYEITIVDASNGR [Y3] ChlorBN
AT4G03280.1 Photosynthetic electron transfer C GDPTYLVVENDK [Y5] ChlorBN
AT4G28750.1 Photosystem I reaction centre VNYANISTNNYALDEVEEVAA [Y3] ChlorBN
subunit IV/PsaE protein
AT2G20260.1 Photosystem I subunit E-2 VNYANISTNNYALDEVEEVK [Y3] ChlorBN
AT1G31330.1 Photosystem I subunit F LYAPESAPALALNAQIEK [Y2] ChlorBN, Ros
AT1G52230.1 Photosystem I subunit H2 SVYFDLEDLGNTTGQWDVYGSDAPSPYNPLQSK [Y19] ChlorBN
ATCG00340.1 Photosystem I, PsaA/PsaB protein TSYGFDVLLSSTSGPAFNAGR [Y3] ChlorBN
AT1G03600.1 Photosystem II family protein DIYSALNAVSGHYVSFGPTAPIPAK [Y3] ChlorBN
AT1G06680.1 Photosystem II subunit P-1 SITDYGSPEEFLSQVNYLLGK [Y5]* ChlorBN, PXD010730
AT1G79040.1 Photosystem II subunit R YGANVDGYSPIYNENEWSASGDVYK [Y12]* ChlorBN
AT2G05100.1 Photosystem II light harvesting STPQSIWYGPDRPK [Y8] ChlorBN
complex gene 2.1
YLGPFSENTPSYLTGEYPGDYGWDTAGLSADPETFAK [Y12]* ChlorBN
AT2G20890.1 Photosystem II reaction centre AYIEALNEDPK [Y2] ChlorBN
PSB29 protein
AT2G30790.1 Photosystem II subunit P-2 SITDYGSPEQFLSQVNYLLGK [Y5]* ChlorBN
AT3G50820.1 Photosystem II subunit O-2 GGSTGYDNAVALPAGGR [Y6] ChlorBN, Chlo3516
AT4G05180.1 Photosystem II subunit Q-2 YYSETVSSLNNVLAK [Y2] ChlorBN
AT4G21280.1 Photosystem II subunit QA LFDTIDNLDYAAK [Y10] ChlorBN
YYAETVSALNEVLAK [Y2]* ChlorBN
ATCG00020.1 Photosystem II reaction centre ETTENESANEGYR [Y12] ChlorBN, TMAR
protein A
FGQEEETYNIVAAHGYFGR [Y8] ChlorBN
(Continued)
Frontiers in Plant Science | www.frontiersin.org 11 February 2021 | Volume 12 | Article 616868Kiferle et al. Iodine in Plant Nutrition
TABLE 1 | Continued
Protein accession Description Iodinated sequence Iodinated site DATASET
ATCG00270.1 Photosystem II reaction centre AAEDPEFETFYTK [Y11] ChlorBN
protein D
ATCG00280.1 Photosystem II reaction centre DIQPWQERRSAEYMTHAPLGSLNSVGGVATEINAVNYVSPR [H16] LFD
protein C
RSAEYMTHAPLGSLNSVGGVATEINAVNYVSPR [H8] CAU, Ros
SAEYMTHAPLGSLNSVGGVATEINAVNYVSPR [H7]* ChlorBN, LFP
ATCG00680.1 Photosystem II reaction centre LAFYDYIGNNPAK [Y4]* ChlorBN, TMAR, CAU,Ros
protein B
YQWDQGYFQQEIYR [Y7]* ChlorBN
AT5G07020.1 Proline-rich family protein AVDYSGPSLSYYINK [Y12] ChlorBN
AT1G74470.1 Pyridine nucleotide-disulphide SIDAGDYDYAIAFQER [Y7] ChlorBN
oxidoreductase
ATMG00280.1 Ribulose bisphosphate carboxylase GGLYFTKDDENVNSQPFMR [Y4] CLLF, LFD, LFP, LFPT
large chain, catalytic domain
AT1G67090.1 Ribulose bisphosphate carboxylase EYPNAFIR [Y2] ChlorBN, CAU, Ros
small chain 1A
ATCG00490.1 Ribulose-bisphosphate GHYLNATAGTCEEMIKR [Y3]* ChlorBN, Chlo10545,CAU
carboxylases
LTYYTPEYETKDTDILAAFR [Y8]* CAU, Ros
AT1G71500.1 Rieske (2Fe-2S) domain-containing SPAEGAYSEGLLNAR [Y7] ChlorBN
protein
AT2G39730.1 Rubisco activase GLAYDTSDDQQDITR [Y4] ChlorBN
AT1G54780.1 Thylakoid lumen 18.3 kDa protein ADAFEYADQVLEK [Y6] ChlorBN
ETYVVDDAGVLSR [Y3] ChlorBN
Protein Accession and Description, sequence of iodinated peptide and iodination site have been reported. In the case of peptide sequences in which more than one
iodinated residues were identified, the asterisk indicates the iodination site identified with the highest score. The datasets in which the iodinated peptides were identified
have been indicated.
showed that iodinated residues in all peptides preferentially the air or absorb it through the leaves if dissolved in salt solutions
corresponded to conserved Tyr residues, while only two or in rain. All these processes occur naturally (Fuge and Johnson,
iodinated tyrosines were unrelated (Supplementary Figure S8). 1986; Ashworth, 2009), thus a plant cannot be grown in the
The other iodinated proteins included: (i) copper amine complete absence of iodine.
oxidase (CUAOy2), a cell-wall oxidase showing primary To identify whether iodine can act as a micro-nutrient
amine oxidase activity; (ii) beta-galactosidase 5 (BGAL5), a we supplied it to plants at very low concentrations (in the
glycoside hydrolase involved in the modification of cell wall micromolar range). These concentrations are typical of many
polysaccharides; (iii) glycosyl hydrolases family 32 protein mineral elements that are beneficial or essential when taken
(ATBFRUCT1), acting as a cell wall invertase; (iv) Pole Ole1 up in low doses, and phytotoxic when in excess (Welch and
allergen/extension domain (IPR006041)-containing proline-rich Shuman, 1995). We observed a difference in plant growth
protein-like 1 (PRPL1-MOP10) and root hair specific 13 protein between the control and iodine-treated plants. Where these
(RHS13), which are cell-wall components; (v) D-mannose could be perceived as positive effects of addition of a beneficial
binding lectin protein (MBL1); and (vi) glyceraldehyde-3- compound, these can also be interpreted as a negative effect
phosphate dehydrogenase C sub 1 (GAPC1), a key enzyme in of removal of iodine from the plant’s nutrition. An increase
glycolysis. According to PAXdb, some of the above-reported in biomass and seed production, together with a very evident
proteins are abundant in the roots. hastening of flowering, was observed by feeding plants with KIO3
(Figure 1 and Supplementary Table S1) or KI (Figure 2) at 0.2
and/or 10 µM. On addition of iodine, flowering was always early
DISCUSSION and appeared to be specific for iodine, since it was present in
the KIO3 , KI and NaI treatments but completely absent in KBr
Iodine Influences Plant Growth and (Figures 1, 2). However, the positive effects of iodine on growth
Development and Can Modulate the were lost at 30 µM. This suggests that a concentration of 30 µM
Plant Transcriptome applied as I− may be above the toxicity threshold.
Establishing whether iodine is important for a plant’s life is In the range of 1–10 µM iodine increases biomass in
complex, as it is always present in variable amounts in the soil, vegetables, e.g., spinach (Zhu et al., 2003), lettuce (Blasco
water, and atmosphere. Plants can take up iodine from the soil et al., 2013), tomato (Lehr et al., 1958; Borst Pauwels,
solution through the root system, but they also assimilate it from 1961), and strawberry (Li et al., 2016), or staple crops, e.g.,
Frontiers in Plant Science | www.frontiersin.org 12 February 2021 | Volume 12 | Article 616868Kiferle et al. Iodine in Plant Nutrition
TABLE 2 | Iodinated peptides identified in A. thaliana roots by database searching of mass spectrometric data retrieved from PRIDE repository.
Protein accession Description Iodinated sequence Iodinated site DATASET
AT5G09810.1 Actin 7 NYELPDGQVITIGAER [Y2] Root
AT1G28290.1 Arabinogalactan protein 31 NGYFLLLAPK [Y3] RT
AT5G08680.1 ATP synthase alpha/beta family protein VGLTGLTVAEYFR [Y11] Root
AT1G45130.1 Beta-galactosidase 5 YDEDIATYGNR [Y1] RT, RTTP, RTUZ
AT2G43610.1 Chitinase family protein YCSPSTTYPCQPGK [Y1] Root
AT3G43670.1 Copper amine oxidase family protein GTAYENVEDLGEK [Y4] RT, RTUZ
AT1G78850.1 D-mannose binding lectin protein TGDSSLVAYVK [Y9] Root, RT, RTTP
AT5G20080.1 FAD/NAD(P)-binding oxidoreductase IFYTVDNPTK [Y3] Root
AT4G20830.1 FAD-binding Berberine family protein DVDIGVNDHGANSYK [Y14] RTTP
AT5G44380.1 FAD-binding Berberine family protein YGLAGDNVLDVK [Y1] RTUZ
AT5G50950.1 FUMARASE 2 IGYDNAAAVAK [Y3] Root
AT3G04120.1 Glyceraldehyde-3-phosphate dehydrogenase C sub1 LKGILGYTEDDVVSTDFVGDNR [Y7] RT, RTTP, RTUZ
AT4G16260.1 Glycosyl hydrolase superfamily protein AFYTNLASR [Y3] Root
LYDPNQAALNALR [Y2] Root
AT3G13790.1 Glycosyl hydrolases family 32 protein HDYYTIGTYDR [Y4]* RT, RTUZ
AT3G19390.1 Granulin repeat cysteine protease family protein VVTIDGYEDVPQNDEK [Y7] Root
AT3G12580.1 Heat shock protein 70 NALENYAYNMR [Y6] Root
TTPSYVAFTDSER [Y5] Root
AT5G42020.1 Heat shock protein 70 (Hsp 70) family protein NALETYVYNMK [Y8]* Root
AT3G16430.1 Jacalin-related lectin 31 VYVGQAQDGISAVK [Y2] Root
AT2G22170.1 Lipase/lipooxygenase, PLAT/LH2 family protein VYDKYGDYIGIR [Y8]* Root
AT3G16460.1 Mannose-binding lectin superfamily protein IYASYGGEGIQYVK [Y5]* Root
AT3G48890.1 Membrane-associated progesterone binding protein 3 MFYGPGGPYALFAGK [Y3] Root
AT4G19410.1 Pectinacetylesterase family protein DITGGSYIQSYYSK [Y7] RT
AT4G30170.1 Peroxidase family protein EVVVLTGGPSYPVELGR [Y11] Root, RT, RTUZ
IYNFSPTTR [Y2] Root
TGFYQNSCPNVETIVR [Y4] Root, RT
AT1G05240.1 Peroxidase superfamily protein GDSDPSMNPSYVR [Y11] RT, RTTP, RTUZ
AT2G37130.1 Peroxidase superfamily protein PTPDPNAVLYSR [Y10] RT, RTUZ
QQVETLYYK [Y8] RT, RTTP, RTUZ
AT3G01190.1 Peroxidase superfamily protein TFDLSYFTLVAK [Y6] RT, RTUZ
AT5G17820.1 Peroxidase superfamily protein DSVALAGGPSYSIPTGR [Y11] Root, RT
VGFYSQSCPQAETIVR [Y4] RT
AT1G79550.1 Phosphoglycerate kinase YSLKPLVPRLSELLGVEVVMANDSIGEEVQK [Y1] RT
AT4G20260.4 Plasma-membrane associated cation-binding protein 1 VVETYEATSAEVK [Y5] Root
AT2G47540.1 Pollen Ole e 1 allergen and extensin family protein GISGAILQNYR [Y10] Root
AT5G05500.1 Pollen Ole e 1 allergen and extensin family protein TDSYGHFYGELK [Y4] RT, RTTP, RTUZ
AT4G14060.1 Polyketide cyclase/dehydrase and lipid transport VYDTILQFIQK [Y2] Root
superfamily protein
ATSGTYVTEVPLKGSAEK [Y6] Root
AT4G23680.1 Polyketide cyclase/dehydrase and lipid transport VYDVVYQFIPK [Y2] Root
superfamily protein
AT2G19760.1 Profilin 1 TNQALVFGFYDEPMTGGQCNLVVER [Y10] RTTOF
AT4G02270.1 Root hair specific 13 VDAYGNELVPISILSSK [Y4] Root, RTTP, RTUZ
AT4G26220.1 S-adenosyl-L-methionine-dependent GLLKSEELYKYILETSVYPR [Y9] RTTP
methyltransferases
AT1G58270.1 TRAF-like family protein FLDSYTSDSFSSGGR [Y5] Root
AT1G45201.1 Triacylglycerol lipase-like 1 FVYNNDVVPR [Y3] Root
AT3G55440.1 Triosephosphate isomerase IIYGGSVNGGNCK [Y3] Root
AT4G30270.1 Xyloglucan endotransglucosylase/hydrolase 24 NYESLGVLFPK [Y2] RT
LVPGNSAGTVTTFYLK [Y14] RTTP
Protein Accession and Description, sequence of iodinated peptide and iodination site have been reported. In the case of peptide sequences in which more than one
iodinated residues were identified, the asterisk indicates the iodination site identified with the highest score. The datasets in which the iodinated peptides were identified
have been indicated.
Frontiers in Plant Science | www.frontiersin.org 13 February 2021 | Volume 12 | Article 616868Kiferle et al. Iodine in Plant Nutrition
barley (Borst Pauwels, 1961) and wheat (Cakmak et al., 2017).
In tomato, Lehr et al. (1958) demonstrated that treatments
with iodine accelerated plant growth, causing early flowering
associated with an increase in yield. Similarly, Umaly and Poel
(1970) found that the addition of 4 µM KI to the nutrient solution
stimulated tomato plants to produce flowers 2–3 days earlier than
the control, whereas the use of iodine at a higher concentration
(80 µM KI) delayed flower formation and reduced the number
of inflorescences. It must be noted that in most biofortification
studies with iodine, its native occurrence in nutrient solution or
soil of the control plants is not always reported; where iodine
concentrations in leaf or root tissue in control plants are reported,
these always indicate that iodine was available for uptake and
accumulation, regardless of the exogenous administrations (e.g.,
Borst Pauwels, 1961; Cakmak et al., 2017).
Flowering is a complex physiological process affected by a
multitude of internal and external factors, and its hastening
may represent an evolutionary adaptive mechanism to guarantee
species survival, by optimising the seed set in the case of biotic
or abiotic stresses (Ionescu et al., 2017). In Arabidopsis, heat
and drought stress are correlated with early flowering, which
in turn is generally associated with a reduction in plant growth
(Balasubramanian et al., 2006; Schmalenbach et al., 2014). In
our study, 10 µM iodate or iodide promoted flowering without
negatively impacting on biomass production (Figures 1, 2),
which was increased by KIO3 , thus suggesting the specific
flowering-promoting role of iodine in the process.
Our transcriptomic analysis of plants treated with 10 µM KI,
NaI, or KBr for 48 h showed that several genes were specifically
regulated by iodine, as the large part of DEGs similarly responded
to KI and NaI, but not to KBr (Figure 3). This was more evident in
root than in shoot tissues, probably because iodine was added to
the nutrient solution and was used first by roots before the green
parts. Interestingly, transcripts specifically regulated by iodine in
the roots were mostly involved in the plant response to biotic
and/or abiotic stresses (Figure 4 and Supplementary Tables S6–
S8) and the selective regulation of iodine on these groups of genes
was also observed in the shoots (Supplementary Tables S4, S5
and Supplementary Figure S4).
Although no previous data are available on the response of
Arabidopsis to iodine at the transcriptomic level, the induction
of HALIDE ION METHYLTRANSFERASE, SALICYLIC ACID
CARBOXYL METHYLTRANSFERASE, and SALICYLIC ACID
3-HYDROXYLASE genes by aromatic iodine compounds,
indicating a possible involvement of iodine in the SA metabolism,
has already been described in tomato plants (Halka et al., 2019).
SA is a signalling molecule involved in local defence reactions
at infection sites and the induction of systemic resistance
FIGURE 6 | Iodination in A. thaliana proteins identified by database searching (Vlot et al., 2009).
of nano-LC-ESI-MS/MS raw data from a public repository (PRIDE). Iodine likely has an indirect effect on plant resistance
(A) Unambiguous assignment of iodination sites by MS/MS analysis in two
given that iodine treatments induce the biosynthesis of several
peptides from chloroplast (light harvesting complex of photosystem II 5,
AT4G10340.1), upper panel, and roots (peroxidase superfamily protein, enzymatic or non-enzymatic compounds involved in the plant
AT4G30170.1), lower panel. The peptides are identified by both y, and b ions. response to environmental stresses (Leyva et al., 2011; Blasco
Red labels in the spectra evidence the mass shift corresponding to the et al., 2013; Gupta et al., 2015). The antioxidant response
iodinated tyrosine (i-Y). (B) Venn Diagram showing the iodinated peptide induced by increasing KI and KIO3 levels was found to be
sequences identified in the datasets of chloroplasts (Chlor), cauline (Cau),
rosette (Ros), and roots (Root).
strongly associated with the synthesis of phenolic compounds
(Incrocci et al., 2019; Kiferle et al., 2019), in agreement with
Frontiers in Plant Science | www.frontiersin.org 14 February 2021 | Volume 12 | Article 616868You can also read