De Novo Mutation and Rapid Protein (Co-)evolution during Meiotic Adaptation in Arabidopsis arenosa
←
→
Page content transcription
If your browser does not render page correctly, please read the page content below
De Novo Mutation and Rapid Protein (Co-)evolution during
Meiotic Adaptation in Arabidopsis arenosa
Magdalena Bohutınska,1,2 Vinzenz Handrick,3 Levi Yant,3 Roswitha Schmickl,1,2 Filip Kolar,1,2,4
Kirsten Bomblies,*,3,5and Pirita Paajanen *,3
1
 Department of Botany, Faculty of Science, Charles University, Prague, Czech Republic
2
 Institute of Botany of the Czech Academy of Sciences, Průhonice, Czech Republic
3
 Department of Cell and Developmental Biology, John Innes Centre, Norwich, United Kingdom

                                                                                                                                                          Downloaded from https://academic.oup.com/mbe/advance-article/doi/10.1093/molbev/msab001/6120800 by guest on 26 March 2021
4
 Department of Botany, University of Innsbruck, Innsbruck, Austria
5
 Plant Evolutionary Genetics, Department of Biology, Institute of Molecular Plant Biology, ETH Zürich, Zurich, Switzerland
*Corresponding authors: E-mails: kirsten.bomblies@biol.ethz.ch; pirita.paajanen@jic.ac.uk.
Associate editor: Jian Lu

Abstract
A sudden shift in environment or cellular context necessitates rapid adaptation. A dramatic example is genome dupli-
cation, which leads to polyploidy. In such situations, the waiting time for new mutations might be prohibitive; theoretical
and empirical studies suggest that rapid adaptation will largely rely on standing variation already present in source
populations. Here, we investigate the evolution of meiosis proteins in Arabidopsis arenosa, some of which were previously
implicated in adaptation to polyploidy, and in a diploid, habitat. A striking and unexplained feature of prior results was
the large number of amino acid changes in multiple interacting proteins, especially in the relatively young tetraploid.
Here, we investigate whether selection on meiosis genes is found in other lineages, how the polyploid may have accu-
mulated so many differences, and whether derived variants were selected from standing variation. We use a range-wide
sample of 145 resequenced genomes of diploid and tetraploid A. arenosa, with new genome assemblies. We confirmed
signals of positive selection in the polyploid and diploid lineages they were previously reported in and find additional
meiosis genes with evidence of selection. We show that the polyploid lineage stands out both qualitatively and quan-
titatively. Compared with diploids, meiosis proteins in the polyploid have more amino acid changes and a higher
proportion affecting more strongly conserved sites. We find evidence that in tetraploids, positive selection may have
commonly acted on de novo mutations. Several tests provide hints that coevolution, and in some cases, multinucleotide
mutations, might contribute to rapid accumulation of changes in meiotic proteins.
Key words: de novo mutations, standing variation, coevolution, meiosis, polyploidy.

                                                                                                                                                        Article
Introduction                                                                           phenotypic effects than standing variants (Matuszewski et al.
                                                                                       2015). Thus, the relative importance of de novo mutations may
Sometimes an abrupt change in circumstances forces a rapid
                                                                                       be greater when extensive functional restructuring is needed.
evolutionary response. As populations face new challenges,
                                                                                          Whole-genome duplication, which leads to polyploidy, is
positive selection can act on alleles recruited from standing
                                                                                       an example of a situation where the cellular context suddenly
variation or on de novo mutations (Barrett and Schluter
                                                                                       and substantially shifts, necessitating a rapid adaptive re-
2008). Though in long-term macroevolution, de novo muta-
tions clearly play a role, evolution from standing variation                           sponse (Comai 2005; Bomblies and Madlung 2014).
may be especially important in facilitating rapid adaptation,                          Previous studies on the genetic basis of adaptation to genome
because it eliminates the waiting time needed for novel muta-                          duplication in the diploid–autotetraploid species, Arabidopsis
tions (Hermisson and Pennings 2005; Prezeworski et al. 2005;                           arenosa (fig. 1A), identified a set of genes showing strong
Barrett and Schluter 2008). There are numerous reports of                              evidence of positive selection in its tetraploid lineage
rapid adaptation to novel environments that utilize standing                           (Hollister et al. 2012; Yant et al. 2013; Wright et al. 2015).
genetic variation (Jones et al. 2012; Van Belleghem et al. 2018;                       Many of these genes encode interacting proteins important
Haenel et al. 2019; Lai et al. 2019), whereas reports of de novo                       for meiosis, which is consistent with the fact that meiosis is
mutations in such instances are rare and often include loss of                         particularly challenged by genome duplication (Comai 2005;
function mutations (Messer and Petrov 2013; Exposito-                                  Cifuentes et al. 2010; Stenberg and Saura 2013; Bomblies and
Alonso et al. 2018; Wu et al. 2018; Xie et al. 2019). However,                         Madlung 2014; Bomblies et al. 2016). That at least some of
it is also predicted that de novo variants may have stronger                           these changes are adaptive is supported by the observation

ß The Author(s) 2021. Published by Oxford University Press on behalf of the Society for Molecular Biology and Evolution.
This is an Open Access article distributed under the terms of the Creative Commons Attribution License (http://creativecommons.org/
licenses/by/4.0/), which permits unrestricted reuse, distribution, and reproduction in any medium, provided the original work is
properly cited.                                                                                                                       Open Access
Mol. Biol. Evol. doi:10.1093/molbev/msab001 Advance Access publication January 27, 2021                                                            1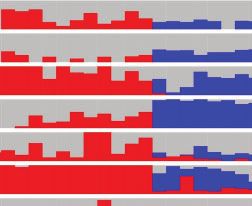
Bohutınska et al. . doi:10.1093/molbev/msab001                                                                                       MBE
                  A                                                                       C

                                                                                                                                                       Downloaded from https://academic.oup.com/mbe/advance-article/doi/10.1093/molbev/msab001/6120800 by guest on 26 March 2021
                  B

                                                                                        D

FIG. 1. Meiosis proteins showing signatures of positive selection in Arabidopsis arenosa lineages. (A) Our sampling of A. arenosa populations in
Europe. Dots show 14 diploid (red) and 11 tetraploid populations without signs of introgression from diploids (blue) studied here. Distribution
ranges of all known A. arenosa lineages are shown as colored areas, indicating that our sampling covers a complete diversity of diploid lineages
(based on Kolar et al. 2016; Monnahan et al. 2019). The tetraploid distribution range covers areas occupied by populations without signs of
introgression from diploids (Monnahan et al. 2019). (B) Phylogeny of A. arenosa (based on Kolar et al. 2016; Monnahan et al. 2019) with candidate
meiosis proteins placed on the branch where they exhibit signatures of selective sweeps (identified as FST and FineMAV overlap, see the main text).
Width of the branches corresponds to the number of meiosis proteins that are identified as positive selection candidates. Only Pannonian and
tetraploid lineages had more meiosis proteins showing signatures of positive selection than expected by chance. Lineages with no evidence for
positive selection on meiosis proteins are indicated as “None.” Proteins are ordered from those having the highest number of candidate AASs to the
lowest (supplementary tables S5 and S6, Supplementary Material online). Three proteins found independently as candidates in parallel in two
lineages are written in bold. Time axis below the tree indicates median estimates of lineage divergence times (based on Arnold et al. 2015; Kolar
et al. 2016). (C) Principal component analysis based on allele frequencies of candidate AASs in the three parallel candidate meiosis proteins. Each
dot represents one individual, colored based on lineage in panel A. (D) positive selection targeted more conserved amino acids in tetraploids (blue)
than in diploids (red; summarizing candidate AASs identified in all but the Pannonian diploid lineage—orange). Each violin plot summarizes
alignment identity (calculated across 17 plant reference genomes, higher value indicate more conserved site) over all candidate AASs identified in
the corresponding lineage. **P ¼ 0.002, Wilcoxon rank sum test.

that the derived alleles of two of the genes, which encode                   (Heyting 1996; Kumar et al. 2010; Grishaeva and Bogdanov
interacting meiotic axis proteins, have been experimentally                  2014; Bomblies et al. 2015; Baker et al. 2017; Brand et al. 2019).
shown to affect meiotic traits relevant to tetraploid meiotic                But what was striking in the A. arenosa tetraploids, and
stability (Morgan et al. 2020).                                              remains unexplained, is that although two independent esti-
   Meiosis is a structurally conserved process that is period-               mates suggest the tetraploids are likely only about 20,000–
ically challenged and driven to evolve in diploids as well                   30,000 generations old (fig. 1B; Arnold et al. 2015; Monnahan
2
Rapid Protein (Co-)evolution from De Novo Mutations . doi:10.1093/molbev/msab001 MBE
et al. 2019), a surprisingly large number of amino acid changes the 10 genomics Chromium platform and supernova assem-
differentiates ancestral diploid and derived tetraploid alleles bler (Weisenfeld et al. 2017; see supplementary table S2,
in the subset of meiosis genes that have signatures of positive Supplementary Material online). These new assemblies allowed
selection. Meanwhile, the rest of the genome, including other us to extract diploid- and tetraploid-specific haplotypes for
meiosis genes, remains largely undifferentiated (Hollister et al. candidate genes (see Materials and Methods for details). We
2012, Yant et al. 2013). Another study showed that positive focused on protein sequence evolution, as this allows us to
selection on meiosis is not unique to the tetraploid A. arenosa capitalize on the availability of tests that can help assess which
lineage: Signatures of selection were also found in two of the changes are likely to be functional.
same meiosis genes (different alleles) in a distinct diploid We first asked whether evidence of selection on meiosis
Downloaded from https://academic.oup.com/mbe/advance-article/doi/10.1093/molbev/msab001/6120800 by guest on 26 March 2021
A. arenosa lineage (Wright et al. 2015). This raised the possi- genes is unique to the two lineages, it was previously reported
bility that rapid evolution of meiosis genes might be a com- in (the tetraploid and Pannonian diploids; Wright et al. 2015),
mon feature of A. arenosa lineages regardless of ploidy, and or is consistently seen across A. arenosa lineages (i.e., to ask if
this is one of the ideas we test here. this is a ubiquitous feature of meiotic protein evolution). We
The above observations leave many questions about the focused on a list of 78 meiosis-specific proteins (supplemen-
evolution of meiosis in A. arenosa lineages unanswered, which tary table S3, Supplementary Material online) selected by re-
also have wider implications for understanding rapid evolu- fining available lists (Sanchez-Moran et al. 2005; Yant et al.
tionary adaptation of essential cellular processes. Remaining 2013) using the Pathway Interaction Database (PID; Schaefer
questions include: Is the evolution of meiosis in the tetraploid et al. 2009), AraNet (Lee et al. 2015), and TAIR databases
lineage more likely to have targeted functionally important (Berardini et al. 2015). We also confirmed that diploid and
sites than in diploids? Were the variants that selection acted tetraploid populations included in our analyses had similar
on in the tetraploid lineage already present as standing var- genetic diversity and allele frequency spectra (Monnahan
iation in diploids? If not, what might drive the rapid accumu- et al. 2019, supplementary table S4, Supplementary Material
lation of multiple amino acid changes in these proteins? To online), indicating a lack of severe demographic change such
address such questions, we analyzed a range-wide data set of as recent population expansions or bottlenecks that could
145 diploid and tetraploid A. arenosa genome sequences otherwise have had a confounding effect on our analyses.
(fig. 1A; Monnahan et al. 2019), sampling four additional dip- To identify potential targets of positive selection among
loid lineages not previously included, complemented with the set of 78 meiosis proteins, we first scanned sequences for
newly generated assemblies for the diploid and tetraploid amino acid substitutions (AASs) between 1) all five previously
that allowed us to define haplotypes more reliably. We found defined diploid lineages (Kolar et al. 2016; Monnahan et al.
that although evidence of positive selection on meiosis pro- 2019: Pannonian, Dinaric, Baltic, Southeastern Carpathian, and
teins is not unique to the tetraploid lineage, the extent of Western Carpathian; fig. 1A and B) and 2) comparing all dip-
meiotic protein remodeling is. Moreover, we found evidence loid individuals as a group with the tetraploid lineage, using a
subsampled data set of 120 individuals to ensure comparable
that selection likely acted at least in part on de novo muta-
sample sizes across ploidies and lineages (see Materials and
tions not present in the diploid gene pool. We also find sup-
Methods for details, supplementary table S1, Supplementary
port for the idea that coevolution of proteins and the
Material online). We identified outlier differentiated AASs as
accumulation of multinucleotide mutations could contribute
those exceeding the 99% FST genomewide quantile. We then
to the de novo accumulation of many amino acid variants in
narrowed this set to those changes predicted to also have
the tetraploid lineage.
functional effects, by selecting the overlap with 1% genome-
Results and Discussion wide outliers identified using the FineMAV method (Szpak
et al. 2018; modified to use Grantham and SIFT scores that
Meiosis Protein Evolution in A. arenosa Lineages predict potential functional impact of each AAS, Grantham
We investigated the patterns of evolution of meiosis proteins 1974; Kumar et al. 2009, see Materials and Methods for
across all currently known A. arenosa lineages (fig. 1A), in- details). The overlap of FST and FineMAV outliers identified
cluding samples of four additional diploid lineages in which 56 AAS outliers, in seven meiosis proteins, among the pairwise
meiosis protein evolution was not investigated in our previ- diploid contrasts, and 171 AAS outliers, in 11 meiosis proteins,
ous study (Wright et al. 2015). This additional sampling allowed in the diploid/tetraploid contrast (below, these are termed
us to ask whether positive selection commonly targets meiosis “candidate selected AASs” and the proteins they occur in as
in different diploid and tetraploid lineages (i.e., whether selec- “candidate selected proteins”; supplementary tables S5–S7,
tion on meiosis is the rule rather than the exception). This Supplementary Material online). We inferred which are the
sampling also allowed us to investigate whether the patterns in derived variants of each AAS by comparing with three
the tetraploid lineage are qualitatively or quantitatively un- Arabidopsis outgroup species.
usual. We did this using a published data set of single nucleo- To further test for evidence of positive selection on meiosis
tide polymorphism (SNP) variation that includes range-wide genes in the tetraploids, we used McDonald–Kreitman test
sampling of diploid and tetraploid whole-genome resequenced (McDonald and Kreitman 1991, Smith and Eyre-Walker 2002;
individuals (Monnahan et al. 2019; see supplementary table S1, see Materials and Methods for details). In this method, we
Supplementary Material online), complemented with two new calculated alpha, the proportion of divergences driven by
genome assemblies of diploid and tetraploid individuals using positive selection (supplementary table S8, Supplementary
3Bohutınska et al. . doi:10.1093/molbev/msab001 MBE
Material online). Overall, we found evidence of a significantly the evidence that 3D structures of meiosis proteins are
increased genomewide proportion of divergence values that strongly conserved across even wide evolutionary distances,
show evidence of having been driven by positive selection, though the underlying primary sequences can vary substan-
between diploids and tetraploids of A. arenosa (a ¼ 0.44, P tially even among closely related species (Grishaeva and
value 0.05 due raploids than in the diploids.
to the low number of divergences), suggesting that these
proteins evolved under positive selection. In summary, de- Positive Selection in the Tetraploids Acted at Least in
spite the biases that could arise due to the low divergence Part on De Novo Mutations
between the lineages studied here (Monnahan et al. 2019), The high number of potentially functional amino acid
the results of McDonald–Kreitman test nevertheless support changes in multiple interacting proteins in the tetraploids is
our FineMAV and FST-scan results, supporting the idea that striking given their relatively recent origin. We thus hypoth-
positive selection targeted meiosis proteins during the diver- esized that at least some of the candidate-selected alleles were
gence of diploids and tetraploids. likely selected from standing variation that existed in diploids.
When analyzing genomewide patterns, Pannonian diploids To explore this, we first examined standing variation present
and tetraploids both had significant excess proportions of in diploids for amino acid changes that characterize tetraploid
meiosis proteins among all candidate positively selected pro- alleles. We analyzed 10 of the 11 meiosis proteins that show
teins genomewide (P ¼ 0.02 and 0.05, n ¼ 56, Wilcoxon rank sum test, haplotypes of linked candidate-selected AASs exist as stand-
fig. 1C). We also found that the differentiated AASs in tetra- ing variation in diploids. We reconstructed the most likely
ploids are predicted to cause secondary protein structure haplotypes across tetraploid-differentiated AASs (supplemen-
variation (supplementary fig. S2 and supplementary text 3, tary table S6, Supplementary Material online) using allele fre-
Supplementary Material online). This is interesting in light of quency information complemented with haplotype phasing
4Rapid Protein (Co-)evolution from De Novo Mutations . doi:10.1093/molbev/msab001 MBE
A B
Downloaded from https://academic.oup.com/mbe/advance-article/doi/10.1093/molbev/msab001/6120800 by guest on 26 March 2021
FIG. 2. Limited standing variation across Arabidopsis arenosa diploids in protein candidates for tetraploid meiotic adaptation. (A) Lack of
tetraploid-specific haplotypes in diploid populations sampled across the total range of A. arenosa. Haplotypes were combined across linked
candidate AASs within each protein. A set of bar plots for each of ten candidate proteins (horizontal lines) shows frequencies of diploid, Pannonian
(if different from widespread diploid) and tetraploid-specific haplotypes (y axis) in each of 14 diploid and 11 tetraploid populations (x axis, grouped
to lineages and ploidies). Frequencies of minor frequency haplotypes found in either or both ploidies are summed in a gray column. (B) A
hypothetical maximal variation among haplotypes of meiosis proteins in diploids and tetraploids, quantified by Hamming distances. The diameter
of the red and blue circles denotes the full range of potential variability of haplotypes reconstructed by all combinations of AASs among all diploid
and tetraploid individuals, respectively. The relative distance of the red and blue circles denotes the genetic distance between the diploid and
tetraploid haplotypes. Overlap of both circles suggests that it is plausible that the tetraploid haplotype could have existed within the observed
variation in diploids, even if the exact tetraploid haplotype was not found in our diploid sampling. Filled area of the tetraploid circle, non-
overlapping with diploid, represents the tetraploid haplotype space that cannot be explained by, and would not be expected to exist, within extant
diploid AAS variation. The upper six proteins show evidence that their tetraploid haplotypes most likely accumulated additional mutations after
diploid/tetraploid divergence.
data in the respective diploid or tetraploid genome assembly existed within the diploid pool of genetic variation, even if
(see Materials and Methods). Apart from the SMG7 haplo- not sampled. This was the case for four proteins (fig. 2B and
type, which was found in one population in the Pannonian supplementary table S9, Supplementary Material online). For
lineage and in three populations in the Western Carpathian six meiotic proteins, however, the tetraploid haplotype was
lineage, none of the complete haplotypes predominant in differentiated beyond the diploid variation and thus likely not
tetraploids were found in any diploid population (fig. 2A). available within the original pool of standing diploid variation
Taken together, these findings suggest that although some (fig. 2B and supplementary table S9, Supplementary Material
AASs in each case likely originated as standing variation in online). This includes two meiotic axis proteins (ASY1 and
diploid populations, additional de novo changes likely accu- ASY3) whose diploid and tetraploid variants have recently
mulated in each of the meiosis genes to generate the extant been shown to have distinct functional effects in meiosis
tetraploid alleles. (Morgan et al 2020).
The findings above cannot rule out that the full haplotypes The proportion of meiosis proteins with likely de novo
were originally present in diploids, but lost after divergence of changes as identified by Hamming distances was only slightly
the tetraploids, or that they were present, but too rare to have higher than that of the other candidate-selected proteins
been sampled. Thus, we quantified whether an unsampled genomewide (proportion of de novo candidates ¼ 0.60
haplotype allele as different from other diploid variants as the and 0.52 for meiosis proteins and other proteins genomewide,
current tetraploid allele is, could plausibly have existed within respectively), suggesting that selection on de novo mutations
the range of variation in our sampled portion of the diploid might be a general feature of positive selection in polyploids.
gene pool. If not, this would suggest that additional amino However, meiosis proteins do show an excess relative to other
acids likely accumulated postdivergence. To do this, we com- proteins of “de novo” candidate-selected AASs per protein
pared the Hamming distance (which quantifies the number (11.1 for meiosis proteins and 5.4 for other proteins genome-
of sites in which diploid and tetraploid alleles differ in nucle- wide; P ¼ 0.001, Wilcoxon rank sum test), suggesting that
otide sequence) to the Hamming diameter of each gene pool meiosis as a process underwent more extensive de novo
(which is the maximum pairwise distance among alleles restructuring than most other processes that show evidence
within a set, see Materials and Methods, Robinson 2003). If of having been under positive selection in the tetraploid
the Hamming distance between diploids and tetraploids is genome.
lower than the Hamming diameter within diploids, it is con- The above analysis cannot completely rule out allele ex-
sidered plausible that the tetraploid haplotype could have tinction. However, we note that selection from standing
5Bohutınska et al. . doi:10.1093/molbev/msab001 MBE
variation followed by allele extinction at multiple indepen- polymorphisms normalized to the length of the haplotype
dent loci in diploids is not the most parsimonious explana- between first and last candidate positively selected AAS as a
tion. We would have to imagine that, six times independently, proxy for sweep age. The oldest sweeps were inferred to have
a standing variant that is more different than any other allele occurred in PRD3 and REC8/SYN1, followed by ASY1 and
sampled from the present gene pool came under positive PDS5b, with ASY3 and DYAD being the youngest (fig. 3A
selection in the tetraploids and was subsequently lost in dip- and B and supplementary table S10, Supplementary
loids. Thus, we believe that although some amino acids char- Material online). Age estimates of this sort are error prone
acteristic of tetraploid alleles do come from standing variation (Messer and Neher 2012; Ormond et al. 2016; Smith et al.
a considerable fraction of the observed differences accumu- 2018), but the potentially staggered origin of selected alleles
Downloaded from https://academic.oup.com/mbe/advance-article/doi/10.1093/molbev/msab001/6120800 by guest on 26 March 2021
lated de novo in the tetraploid lineage after divergence. hints that changes in one may have provided a context that
favored changes in another (e.g., positive epistasis; Pedruzzi
The Accumulation of Amino Acid Changes in the et al. 2018).
Tetraploids We also searched for hints of mechanistic evidence of co-
Given that positive selection predominantly from standing evolution, for example, predicted structural differences in
variation is an unlikely explanation for the pattern of amino binding sites of the candidate proteins. We did this using
acid divergence in tetraploids, we explored whether rapid our diploid and tetraploid genome assemblies, for the subset
protein evolution might be driven by compensatory evolu- of proteins with known structures: the cohesin subunit REC8/
tion and coevolution, as previously proposed for autotetra- SYN1, the cohesin regulator PDS5b, and the meiotic axis
ploid A. arenosa (Hollister et al. 2012). Compensatory components ASY1 and ASY3, together with the cohesin com-
coevolution of interacting proteins can speed the accumula- ponent SCC3 (which does not show strong evidence of se-
tion of novel changes because if a change in one protein lection, but where we identified a medium-frequency
causes even a subtle shift in structure or stability, this will premature stop codon in tetraploids, supplementary text 2,
lead to selection for compensatory mutations that return the Supplementary Material online). Using PSIPRED secondary
structure or stability of the protein, or an entire complex, to structure predictions, which calculate which of the three local
its optimal state (DePristo et al. 2005; Szamecz et al. 2014; amino acid interactions, helix, sheet or coil elements, are most
Rojas Echenique et al. 2019). Because compensatory muta- likely for each position in the amino acid chain, we found
tions have a large mutational target, as any number of amino clusters of predicted structural changes in the interaction
acid changes can readjust the stability or shape of a protein, surfaces of REC8/SYN1 and SCC3 and to lesser degree of
they can accumulate rapidly relative to changes that must PDS5b and REC8/SYN1. This finding suggests that these pro-
target particular functional sites (DePristo et al. 2005; Szamecz teins may be coevolving (fig. 3C). Whether the structural
et al. 2014). Empirical data support this idea, for example, changes generate novel interaction dynamics, or preserve an-
work in bacteria has shown that this kind of compensatory cestral ones in the face of other functional changes to the
evolution can lead to the rapid accumulation of AASs in cohesin complex, remains to be tested. Though they are not
groups of interacting proteins (Moura de Sousa et al. 2017). definitive, the above tests for the expected coevolution of the
Since meiotic proteins are well known to interact (e.g., Zickler candidate meiosis proteins are consistent with the idea that
and Kleckner 1999), compensatory evolution and coevolution coevolution of interacting proteins might indeed have been
might be one cause of rapid evolution of amino acid changes involved in promoting the accumulation of at least some of
(Maisnier-Patin et al. 2002; Davis et al. 2009). Thus, we asked if the amino acid changes observed.
a process of protein coevolution might have promoted the A potential nonselective explanation for the large number
extensive accumulation of de novo amino acid changes in of differentiated AASs in some proteins could be that they
tetraploids. arose in single multi-nucleotide mutation (MNM) events,
We found hints in our data that support the idea that which can give rise to multiple closely linked substitutions
compensatory evolution may contribute to the observed dif- in a single instance. A hallmark of MNMs is that substitutions
ferentiation. First, all six proteins that likely accumulated mul- are closely spaced, and commonly also have a significant ex-
tiple de novo amino acid changes after divergence of the cess of transversions relative to transitions (Schrider et al.
tetraploids and diploids, are interacting cohesin and axis com- 2011; Harris and Nielsen 2014; Besenbacher et al. 2016). We
ponents, suggesting that changes in one could plausibly affect therefore scanned for these features in genes encoding the
essential interactions with the others (fig. 3A). Second, we candidate-selected meiosis proteins. We found patterns sug-
examined the relative ages of the selective sweeps (i.e., the gestive of MNM events in derived alleles of ASY3 and SMG7,
likely order in which the tetraploid alleles of the six proteins which both had a higher than random proximity of AASs (the
rose in frequency). Under a coevolution scenario, we might median distance ¼ 26 and 46 bp for ASY3 and SMG7, respec-
expect positive selection to have acted sequentially on the tively, whereas for other proteins genomewide the distance is
different cointeracting proteins, rather than all alleles having 61 bp; P < 0.01 in both cases, Wilcoxon rank sum test).
been targeted at the same time, or that selection acted epi- Derived alleles in both genes also have a significant excess
sodically on each protein as changes occurred in its partners. of transversions relative to transitions compared with
We estimated the relative sweep age as a ratio of number of genomewide rates (P < 0.01, two-sample z test). We observed
SNPs accumulated in the selected haplotype, and its length. a similar transversion/transition bias in derived alleles of four
For each meiosis protein we counted the number of other proteins in the tetraploid (REC8/SYN1, ASY1, PRD3,
6Rapid Protein (Co-)evolution from De Novo Mutations . doi:10.1093/molbev/msab001 MBE
Downloaded from https://academic.oup.com/mbe/advance-article/doi/10.1093/molbev/msab001/6120800 by guest on 26 March 2021
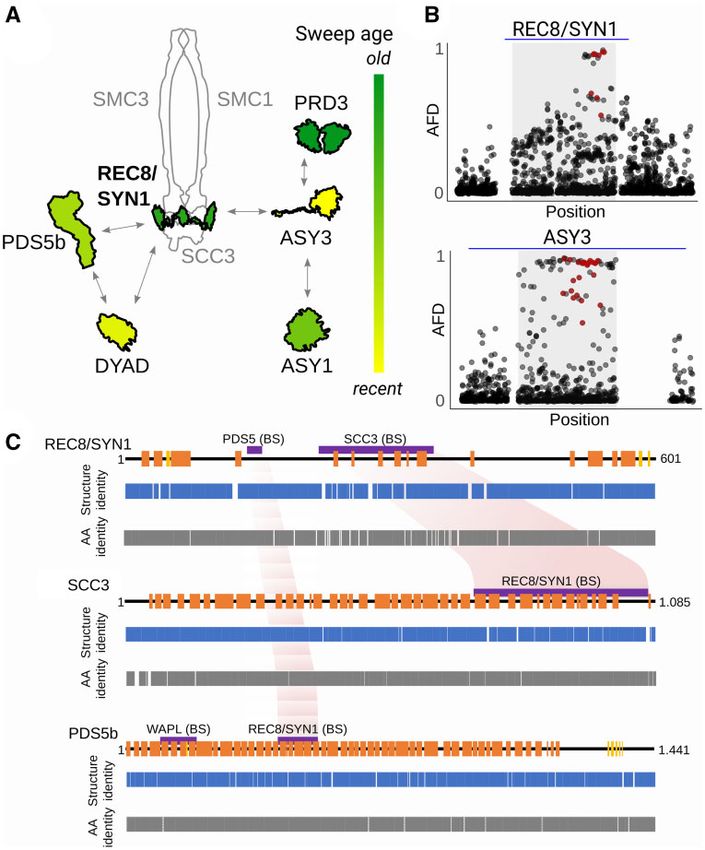
FIG. 3. Evidence for meiosis protein coevolution in tetraploids. (A) Cartoon of the cohesin complex with associated proteins and variability in
relative order of their selection sweeps inferred from haplotype length and number of accumulated SNPs (see Materials and Methods for details).
Shown are schemes of candidate protein structures (outlined in black) and other core complex protein structures for illustration (gray). We
propose that REC8/SYN1 (bolt) might be the core driver of coevolution as it is the central protein with one of the oldest sweeps. (B) Illustrative
examples of pattern of allele frequency decay at locus with old (REC8/SYN1) and young (ASY3) selection sweep (as inferred in A). Plotted is AFD
between diploid and tetraploid individuals for all genic variants in and around the gene. Red dots are candidate AASs identified here; blue line
corresponds to 10 kb. (C) Coordinated structural changes in protein-binding sites. Cartoons of secondary protein structures from diploid
A. arenosa meiosis proteins (upper lane; in orange ¼ helix elements, in yellow ¼ sheet elements, and black line ¼ disordered protein regions).
The pairwise comparison of predicted secondary protein structures from sequences of diploid and tetraploid A. arenosa lineages (middle lane,
Structure identity plots) and the identity of their amino acid sequences (lower lane, AA identity plots). Gaps are sites with zero identity. Protein-
binding sites and functional domains identified in other eukaryotes are shown as violet bars above the secondary structure plot. Reciprocal
structure identity changes in corresponding binding sites of REC8/SYN1 and SCC3 and to lesser degree REC8/SYN1- and PDS5b-binding sites
might indicate coevolution of these proteins—highlighted in light red.
and ZYP1a) and REC8/SYN1 in the Pannonian diploid selection might be common, and therefore not unique to
(P < 0.01, two-sample z test), but these latter examples lacked the two A. arenosa lineages where they were found previously
the close spacing of mutations characteristic of MNMs. (Hollister et al. 2012; Yant et al. 2013; Wright et al. 2015).
However, we found from sampling four additional lineages
that strongly differentiated AASs were found almost exclu-
Conclusions sively in these two lineages (the tetraploid and the Pannonian
Here we investigated the evolution of meiosis proteins in diploid), suggesting that positive selection on these genes is
A. arenosa using a rangewide sampling of diploid and tetra- situational and not ubiquitous. The pattern in the tetraploid
ploid lineages (Monnahan et al. 2019). Since many meiosis lineage is especially striking; despite its tender evolutionary
proteins are thought to evolve rapidly (Heyting 1996; Kumar age (20,000–30,000 generations; Arnold et al. 2015;
et al. 2010; Grishaeva and Bogdanov 2014; Baker et al. 2017; Monnahan et al. 2019), it has the largest number of proteins
Brand et al. 2019), we reasoned that signals of positive with excessive differentiation, the largest number of
7Bohutınska et al. . doi:10.1093/molbev/msab001 MBE
differentiated AASs, a higher proportion of AASs in conserved read sequences to the Arabidopsis lyrata version 2 (LyV2)
sites, amino acid changes occurring in the interaction surfaces reference genome (Hu et al. 2011), called variants and filtered
of the meiotic cohesin alpha-kleisin (REC8/SYN1) and its as previously (Monnahan et al. 2019) using the Genome
interacting partners, and predicted structural shifts. Thus, Analysis Toolkit (GATK 3.5 and 3.6, McKenna et al. 2010)
the shift in the tetraploid meiotic machinery appears to be and finally called SNPs with GATK HaplotypeCaller. For
far more substantial than what occurred in any diploid line- most analyses described below (except where noted), we
age of A. arenosa including the Pannonian lineage. This fits used a subset of the full data set consisting of 80 diploid
with the idea that genome duplication is an especially strong individuals (16 samples with the highest depth of coverage
challenge for meiosis, likely necessitating a rapid evolutionary of sequences from each of the five major lineages) and 40
Downloaded from https://academic.oup.com/mbe/advance-article/doi/10.1093/molbev/msab001/6120800 by guest on 26 March 2021
response (Bomblies et al. 2015, 2016). tetraploid individuals from populations unaffected by sec-
We also find evidence that a considerable proportion of ondary introgression from diploid lineages (i.e., sampling
amino acids that are differentiated between the diploid and from C European, Alpine, and Swabian lineages as defined
tetraploid lineages likely arose de novo on alleles that already in Monnahan et al. (2019). Such subsampling gave us a bal-
contained some polymorphisms that preexisted as standing anced number of 160 high-quality haploid genomes of each
variation. This likely high contribution from de novo variation ploidy suitable for unbiased scans for positive selection, which
might come as a surprise, given the theoretical prediction and was also unaffected by later unidirectional interploidy intro-
empirical evidence that rapid evolution is greatly facilitated by gression (supplementary table S1, Supplementary Material
the availability of preexisting genetic variation (Jones et al. online). Finally, we filtered each subsampled data set for ge-
2012; Olson-Manning et al. 2012; Ralph and Coop 2015; notype read depth >8 and maximum fraction of missing
Van Belleghem et al. 2018; Alves et al. 2019; Haenel et al. genotypesRapid Protein (Co-)evolution from De Novo Mutations . doi:10.1093/molbev/msab001 MBE
to remap the areas in the A. lyrata genome, where the cooccurring haplotypes is dominating our tetraploid
A. arenosa reads did not map well (7 out of the 78 loci, see sampling.
the next section for details). We assembled genome of one
diploid (from Western Carpathian population SNO) and one Detecting Signatures of Positive Selection Acting on
tetraploid individual (population TBG). The diploid assembly Meiosis Proteins
is also described in (Liu et al. 2020), but we include it here for Meiosis Protein Identification, Processing, and Annotation
completeness. We annotated each SNP in the genomewide data set and
First, fresh leaf material was sent to Earlham Institute, assigned it to a gene using SnpEff 4.3 (Cingolani et al. 2012)
where DNA was extracted using the BioNano plant protocol and following A. lyrata version 2 genome annotation (Rawat
Downloaded from https://academic.oup.com/mbe/advance-article/doi/10.1093/molbev/msab001/6120800 by guest on 26 March 2021
from the tetraploid A. arenosa and using CTAB DNA extrac- et al. 2015). Annotated variants genomewide were extracted
tion protocol from A. arenosa diploid (as in Paajanen et al. from vcf format to table using SnpSift, part of SnpEff 4.3, with
2019). Second, to construct the 10 library, DNA material flags “CHROM POS REF ALT AC AN ‘ANN[*].HGVS_P’” and
was diluted to 0.5 ng/ll with EB (Qiagen) and checked with a these tables were used as the basis for the subsequent analysis
QuBit Flourometer 2.0 (Invitrogen) using the QuBit dsDNA of positive selection. Next, we identified a list of 78 proteins
HS Assay kit. The Chromium User Guide was followed as per related to meiosis was based on Yant et al. (2013) and
the manufacturer’s instructions (10 Genomics, CG00043, updated by searching PID, AraNet (Probabilistic Functional
Rev A). The final library was quantified using quantitative Gene Network of A. thaliana) and A. thaliana orthologs in
polymerase chain reaction (qPCR, KAPA Library Quant kit TAIR database (Berardini et al. 2015) and using the list of
[Illumina], ABI Prism qPCR Mix, Kapa Biosystems). Sizing of meiosis proteins from (Sanchez-Moran et al. 2005). ZYP1A,
the library fragments were checked using a Bioanalyzer (High which is not present in the A. lyrata version 2 annotation, was
Sensitivity DNA Reagents, Agilent). Samples were pooled added manually based on gene model available from the
based on the molarities calculated using the two QC meas- previous study (Yant et al. 2013). We assigned it with ID
urements. The library was clustered at 8 pM with a 1% spike AL1G35725 to place it in the correct order into the reference
in of PhiX library (Illumina). The pool was run on a HiSeq2500 .gff3 file. We further validated that the meiosis genes were
150 bp Rapid Run V2 mode (Illumina). The following run expressed in A. arenosa using an available RNASeq data set
metrics were applied: Read 1: 250 cycles, Index 1: 8 cycles, (supplementary text 4, Supplementary Material online).
Index 2: 0 cycles, and Read 2: 250 cycles. We found seven meiosis genes (SHOC1, SCC1, SCC2, SCC3,
Sample TBG was sequenced on HiSeq2500 Rapid Run V2 SCC4, MSH4, and SMC6A), where duplicated regions mapped
mode (Illumina, on 150-bp sequences). About 58.49 M to the same reference loci or where the reads were mis-
(121.71 M) reads were created. These were assembled on mapped when aligning to the A. lyrata reference (Hu et al.
Supernova 2.0.0 giving raw coverage 27.66 and effective 2011). To overcome this problem, we realigned these loci
coverage 22.07. The molecule length was 57.19 kb. The as-
separately to our own A. arenosa diploid reference. To do
sembly size, counting only scaffolds longer than 10 kb was
so, we took the A. arenosa reference sequence and found the
58.84 Mb, and the Scaffold N50 was 33.92 kb.
A. lyrata genes in the assembly using bwa 0.7.12 (Li 2013). We
Sample SNO was sequenced on HiSeq2500 Rapid Run V2
extracted 20 kb upstream and downstream from the gene
mode (Illumina, on 150-bp sequences). About 82.10 M reads
and created a new reference with just these seven genes.
were created. These were assembled on Supernova 2.0.0 giv-
Then we mapped the raw reads from each of the 291 samples
ing raw coverage 57.91 and effective coverage 45.30. The
back to this reference, following the same procedure which
molecule length was 26.58 Kb. The assembly size, counting
we used for mapping to A. lyrata. The heterozygosity and
only scaffolds longer than 10 kb was 127.02 Mb and the
coverage of newly remapped genes stayed within the
Scaffold N50 was 2.19 Mb (supplementary table S2,
Supplementary Material online). genomewide average. The commands that were used are
We analyzed the gene content using BUSCO, and the available at (github.com/paajanen/meiosis_protein_evolu-
results showed that the gene space of the diploid tion/). We built a separate A. arenosa database for these
A. arenosa assembly was nearly complete with 97.5% of the mismapped genes using our A. arenosa reference sequence
plant specific BUSCOs present and 1.4% missing completely. and gff3 files made manually based on A. lyrata V2 gff3 using
Of these, 4.7% were duplicate copies. Geneious 11.0.3. The SnpEff analyses then followed the above
With the tetraploid A. arenosa assembly, we captured outlined procedure and the total list of all 78 meiosis genes
98.5% of the core plant genes and had 1.3% missing. Since was analyzed jointly hereafter.
the plant is a tetraploid, the rate of duplicate genes was high
in the assembly, and total of 82.8% of the core plant genes Scans for Positive Selection with Likely Functional
were found as duplicates. This is not surprising, especially Consequences Acting on Meiosis Proteins
since the plant was from the TBG population that is in the To infer candidate AASs within our data set of 78 meiosis
railway lineage and hence shows secondary admixture from a genes, highly differentiated between lineages and with likely
diploid A. arenosa lineage (Monnahan et al. 2019). Thus when impact on protein function, we combined a differentiation-
working with the TBG fragmented assembly, we always based positive selection scan (FST, Hudson et al. 1992) with
checked the variation among all diploid and nonadmixed genome scanning method accounting for theoretical
tetraploid populations for confirmation which of the two functional consequence of each AAS (modified FineMAV,
9Bohutınska et al. . doi:10.1093/molbev/msab001 MBE
Szpak et al. 2018). Both methods are well suited to infer using allele frequency information at each site (considering
signatures of recent (within species) positive selection minor frequency allele as derived) and DAP parameter of 3.5.
(Oleksyk et al. 2010; Vitti et al. 2013). We used both Finally, for each AAS, we assigned Grantham scores and SIFT
approaches based on population allele frequencies, allowing scores, together with population genetic component of
joint analysis of diploid and autopolyploid populations. We FineMAV, using a custom scripts in Python 2.7.10 and the
screened for positive selection 1) among the five diploid lin- Biopython 1.69 package. By rescaling the SIFT scores, we en-
eages (fig. 1A) and 2) between all diploids and tetraploids. We sured that for both functional score, higher value indicate
considered only AASs that were outliers in both selection more likely impact of the AASs to the protein function.
scans as putative positive selection candidates. For these anal- Finally, we identified the overlap of top 1% outlier AASs iden-
Downloaded from https://academic.oup.com/mbe/advance-article/doi/10.1093/molbev/msab001/6120800 by guest on 26 March 2021
yses, we worked with six lineages in total, covering a full tified in the FineMAV analysis with SIFT scores and with
known distribution range of A. arenosa (fig. 1A and B; Kolar Grantham scores and considered these double outlier AASs
et al. 2016; Monnahan et al. 2019): Pannonian, Dinaric, Baltic, as a final candidate identified in FineMAV analysis. All the
Southeastern Carpathian, and Western Carpathian (diploid calculations were performed using code available at (github.-
lineages, subsampled to 32 chromosomes each) and tetra- com/paajanen/meiosis_protein_evolution).
ploid (subsampled to 160 chromosomes and contrasted to We note that the SIFT database was developed for
the sum of all 160 diploid chromosomes). A reanalysis of A. lyrata annotation version 1, and do not contain all meiosis
diploid–tetraploid selection scans using 16 diploid and 16 proteins from our list. Thus, we did not obtain any SIFT score
tetraploid individuals (comparable with the sample size of for SCC3, MSH4, SMC6A, and ZYP1a and we only considered
diploid) did not yield qualitatively different results. First, for Grantham scores for them (supplementary tables S5 and S6,
each lineage pair, we calculated FST for all nonsynonymous Supplementary Material online).
SNPs (i.e., AASs) across the 78 meiosis proteins. We used Finally, we controlled for the presence of differentiated
Hudson’s FST estimator, which is suitable for a single variant indel variants in all candidate meiosis proteins by inspecting
calculations (Bhatia et al. 2013). Next, we calculated distribu- their alignment files of the RNA-Seq mapping and screening
tion of FST over all synonymous (i.e., putatively functionally their gene sequences in the newly generated diploid and
neutral) SNPs genomewide. We used the 99th quantile of this tetraploid draft assemblies. We identified only three indel
“neutral” distribution as a threshold for identification of out- variants differentiated between diploids and tetraploids and
lier AASs. The neutral synonymous FST quantiles did not differ neither of them was a frameshift mutation affecting any of
significantly from those derived from nonsynonymous SNPs our candidate AASs. Thus, the indel variants should not affect
(supplementary table S11, Supplementary Material online, the interpretations of our SNP-based selection scans.
Wilcoxon rank sum test, W ¼ 69.5, P value ¼ 0.58, n ¼ 11). Finally, to further assess selection acting on meiotic pro-
However, the quantile values were consistently slightly lower teins, we conducted a McDonald–Kreitman test, which is a
for nonsynonymous SNPs (supplementary table S11, powerful approach for detecting selection in proteins
Supplementary Material online), making the use of synony- (McDonald and Kreitman 1991, Smith and Eyre-Walker
mous FST quantiles more conservative. All calculations were
2002). We calculated alpha, which quantifies the proportion
performed using ScanTools_ProtEvol, and custom R scripts
of divergence driven by positive selection and is defined as
(github.com/mbohutinska/ProtEvol/).
a ¼ 1 (DSPN)/(DNPS), where DS and DN are the numbers
Second, we adopted the Fine-Mapping of Adaptive
synonymous and nonsynonymous substitutions per gene, re-
Variation (FineMAV, Szpak et al. 2018) and modified it to
spectively, and PS and PN are the numbers of synonymous
fit the resources available for A. lyrata reference genome.
and nonsynonymous polymorphisms per gene. The diver-
Specifically, we replaced CADD, the functional score available
gence between diploids and tetraploids of A. arenosa is too
for human reference (Szpak et al. 2018; Rentzsch et al. 2019),
recent to satisfy the assumption of fixation of nucleotide
by 1) the Grantham score (Grantham 1974), which is a purely
theoretical AAS value, encoded in the Grantham matrix, substitutions within species. We thus estimated nucleotide
where each element shows the differences of physicochemical divergence values (DS, DN) using the upper 1% outliers of
properties between two amino acids and 2) the SIFT anno- allele frequency differences (AFD) between diploids and tet-
tation score (Kumar et al. 2009), which estimated the effect of raploids (upper 1% AFD outlier treshold ¼ 0.53). It has also
amino acid change based on sequence homology across avail- been suggested that it is important to exclude rare polymor-
able reference sequences and physical properties of amino phisms to minimize the impact of slightly deleterious muta-
acids. To estimate the SIFT scores specifically for our data set, tions on the estimate of adaptive evolution (Charlesworth
we created a SIFT annotation of our vcf-file using A. lyrata and Eyre-Walker 2008). Thus, we excluded variants with over-
database v.1.0.23 from SIFT website (https://sift.bii.a-star.edu. all allele frequency lower than 0.15 (following Fay et al. 2001;
sg/sift4g/, last accessed February 3, 2021). The annotation was Zhang 2005).
done using SIFT4G algorithm (command java -jar
SIFT4G_Annotator_v2.4.jar -c -i input.vcf -d ./Lyrata_db/ Ortholog Search and Analysis of Evolutionary Conservation
v.1.0.23/-r annotated). We rescaled the SIFT score to be 1 of Candidate AASs
when it is most deleterious and 0 when it is most tolerated. To examine the tendency of candidate AASs to affect con-
Next, we estimated the population genetic component of served sites, we compared levels of pairwise alignment iden-
FineMAV (see Szpak et al. 2018 for details on calculations) tity (PAI, mean pairwise identity over all pairs in the
10Rapid Protein (Co-)evolution from De Novo Mutations . doi:10.1093/molbev/msab001 MBE
alignment column) of the 78 meiosis protein sequences populations, covering all known lineages of A. arenosa
across the proteomes of 17 Malvidae reference genomes. (fig. 1A, Kolar et al. 2016; Monnahan et al. 2019). The rare-
To do so, we downloaded A. lyrata sequences of the meiosis faction analysis implies that our sample of 105 individuals is
proteins from Phytozome12.1 database (www.phytozome.jgi. sufficient to converge on the true diversity of A. arenosa
doe.gov, last accessed August 7, 2018) and used as query diploids. In fact, the rarefaction curve (supplementary fig.
sequences to identify orthologs of 17 Malvidae species pro- S3, Supplementary Material online) suggests that as little as
teomes. Species included in the search were Arabidopsis hal- 40 diploid individuals sampled across the A. arenosa species
leri, A. thaliana, Boechera stricta, Capsella grandiflora, Capsella range would be enough to cover most of its diploid diversity.
rubella, Eutrema salsugineum, Brassica rapa, Brassica oleracea,
Downloaded from https://academic.oup.com/mbe/advance-article/doi/10.1093/molbev/msab001/6120800 by guest on 26 March 2021
Populus trichocarpa, Salix purpurea, Theobroma cacao, Reconstructed Haplotypes across Linked Candidate AASs
Manihot esculenta, Gossypium raimondii, Carica papaya, To search for the presence of tetraploid haplotypes in dip-
Citrus clementina, Citrus sinensis, and Linum usitatissimum. loids, we reconstructed lineage-specific haplotypes and their
We performed searches using the BlastP program in allele frequencies across the sets of linked candidate AASs
Phytozome with proteome as target type, e-threshold 1 within each candidate protein in tetraploids (supplementary
and BLOSUM62 comparison matrix. In case of identification table S6, Supplementary Material online). We used this sim-
of multiple orthologs (i.e., multiple hits for the same species), plified procedure as we were not able to use standard phasing
only the ortholog with the lowest e-value was considered. The procedures reliably, due to the fact that we were using short
number of sequences in protein alignments ranged 13–17 reads and working with tetraploids (Kyriakidou et al. 2018).
(16.5 on average, supplementary table S12, Supplementary For each protein, with n candidate AAS sites in the data set
Material online). We aligned protein sequences of all identi- of 145 individuals consisting of 105 diploids and 40 tetra-
fied orthologs using MUSCLE as implemented in Geneious ploids, we defined Mi to be the major allele frequency at
v11 (Kearse et al. 2012), with default settings (UPGMB clus- the candidate AAS site i, given that the sample consists of
tering method, terminal gaps full penalty, gap open score 1, 160 tetraploid haplotypes, and 210 diploid haplotypes, this
window size five). PAI was extracted for each reference major allele frequency is going to be dominated by the diploid
(A. lyrata) amino acid and we tested the difference in the haplotype, thus we define the ancestral (i.e., diploid) haplo-
PAI of diploid and tetraploid candidate AASs sites using type allele frequency as HAFd ¼ minfMi g, and consequently,
Wilcoxon rank sum test (R package stats, R Core Team 2018). we define the derived (i.e., tetraploid) HAF as
HAFa ¼ 1 maxfMi g. We further define the frequency of
Distinguishing between Positive Selection on De Novo all other haplotypes, which result from recombination of the
Mutations and Standing Variation two previous, as HAFr ¼ 1 HAFa HAFd .
We used a three-step procedure to distinguish whether pos- We checked for reliability of our approach by extracting
itive selection in each candidate meiosis protein likely acted haplotypes from our diploid and tetraploid assemblies.
on de novo mutations or standing variation: 1) search for the Extracted diploid and tetraploid haplotypes of candidate mei-
presence of candidate tetraploid-differentiated AASs across osis proteins were consistent with the diploid and tetraploid
full sampling of individuals from all known diploid lineages of haplotypes combined based on the allele frequencies at can-
A. arenosa, 2) search for the presence of tetraploid- didate AAS sites.
differentiated haplotypes across these diploid individuals, For all calculations, we used our in-house R script (github.
and 3) study of uniqueness of tetraploid haplotypes by com- com/mbohutinska/ProtEvol).
paring their differentiation from diploids to their overall dip-
loid diversity. Hamming Distance and Diameter
In order to conclude that positive selection in a candidate In order to study the uniqueness of the tetraploid haplotypes,
meiosis protein likely acted on de novo variation, we we defined a measure based on maximum pairwise Hamming
requested that all three of these criteria pointed toward de distance within a sample (Robinson 2003). In our setting, the
novo origin in tetraploids; that is, that at least some of its Hamming distance compares distances between genotypes,
candidate tetraploid-differentiated AASs were not found in for diploids we first define a distance between alleles such that
any diploid individual, the complete tetraploid haplotype was if the genotypes of two different plants at a given loci is AA aa
not find in any diploid individual, and the tetraploid haplo- or aa AA, the genotypic distance is 1, and for pairs AA Aa, Aa
type divergence from the diploid exceeds the overall diploid aa, Aa Aa, Aa AA, AA AA, aa Aa, the genotypic distance is 0.
diversity (diploid–tetraploid Hamming distance exceeding For tetraploids, we define the genotypic distance to be 1 if the
diploid Hamming diameter). pairs of genotypes are AAAA aaaa, AAAa aaaa, AAAA Aaaa,
aaaA AAAA, aaaa AAAa, aaaa AAAA and 0 otherwise. For
The Presence of Candidate Tetraploid-Differentiated AASs in diploid/tetraploid comparison, we define the genotypic dis-
Diploid Lineages tance to be 1 for the pairs AA aaaa, AA Aaaa, aa AAAA, aa
To identify possible standing variation for the tetraploid AAAa and 0 otherwise.
alleles, we searched for the presence of each candidate The Hamming distance is the sum over all positions that
tetraploid-differentiated AASs in diploids. We analyzed the are different. The maximum pairwise numbers are called the
full sampling of all 105 individuals from the 14 diploid Hamming diameter. If the Hamming distance between
11Bohutınska et al. . doi:10.1093/molbev/msab001 MBE
diploids and tetraploids exceeds Hamming diameter within sequences of secondary structures from diploid and tetra-
diploids, it becomes plausible that the AASs forming the tet- ploid A. arenosa were pairwise aligned using the Geneious
raploid haplotypes originated de novo. This is a conservative alignment tool with default settings. Structure identity scores
indication of possible de novo origin of the tetraploid haplo- (0; 1) were extracted and plotted together with the identities
type, as the fact that all the AASs forming the tetraploid of the amino acid sequences. Binding sites were identified by
haplotype are standing in the diploids does not imply that literature search: PDS5b-binding site in REC8/SYN1 (Muir
the complete tetraploid haplotype preexisted in any diploid et al. 2016), SCC3-binding site in REC8/SYN1- and REC8/
individual. SYN1-binding sites in SCC3 (Roig et al. 2014; Orgil et al.
The code used for the calculations is available in github 2015), and WAPL-binding site in PDS5b (Ouyang et al. 2016).
Downloaded from https://academic.oup.com/mbe/advance-article/doi/10.1093/molbev/msab001/6120800 by guest on 26 March 2021
(https://github.com/paajanen/meiosis_protein_evolution/).
Evidence for MNMs
Compensatory Evolution and Coevolution We observed that in some of our candidate proteins, the
Timing of Sweeps Using the Haplotype Information candidate AASs wereRapid Protein (Co-)evolution from De Novo Mutations . doi:10.1093/molbev/msab001 MBE
LM2018140) provided within the program Projects of Large Cifuentes M, Grandont L, Moore G, Chèvre AM, Jenczewski E. 2010.
Research, Development and Innovations Infrastructures and Genetic regulation of meiosis in polyploid species: new insights
into an old question. New Phytol. 186(1):29–36.
by the NBI Computing infrastructure for Science (CiS) group Cingolani P, Platts A, Wang LL, Coon M, Nguyen T, Wang L, Land SJ, Lu X,
through the use of HPC and storage facilities. Ruden DM. 2012. A program for annotating and predicting the
effects of single nucleotide polymorphisms, SnpEff: SNPs in the ge-
Data Availability nome of Drosophila melanogaster strain w1118; iso-2; iso-3. Fly
(Austin) 6(2):80–92.
The diploid and tetraploid assemblies and raw reads used to Comai L. 2005. The advantages and disadvantages of being polyploid.
generate them are freely available in the European Nucleotide Nat Rev Genet. 6(11):836–846.
Archive (ENA; https://www.ebi.ac.uk/ena) with the project ID Davis BH, Poon AFY, Whitlock MC. 2009. Compensatory mutations are
Downloaded from https://academic.oup.com/mbe/advance-article/doi/10.1093/molbev/msab001/6120800 by guest on 26 March 2021
PRJEB37828. The RNA-Seq data are freely available from ENA repeatable and clustered within proteins. Proc Biol Sci.
276(1663):1823–1827.
with the project ID PRJEB34382. The resequenced reads have DePristo MA, Weinreich DM, Hartl DL. 2005. Missense meanderings in
been deposited in the Sequence Read Archive (https://www. sequence space: a biophysical view of protein evolution. Nat Rev
ncbi.nlm.nih.gov/sra) with the primary accession code Genet. 6(9):678–687.
PRJNA484107 (available at http://www.ncbi.nlm.nih.gov/bio- Doyle J, Coate J. 2019. Polyploidy, the nucleotype, and novelty: the im-
project/484107). pact of genome doubling on the biology of the cell. Int J Plant Sci.
180(1):1–52.
Exposito-Alonso M, Becker C, Schuenemann VJ, Reiter E, Setzer C, Slovak
References R, Brachi B, Hagmann J, Grimm DG, Chen J, et al. 2018. The rate and
potential relevance of new mutations in a colonizing plant lineage.
Alves JM, Carneiro M, Cheng JY, de Matos AL, Rahman MM, Loog L,
PLoS Genet. 14(2):e1007155.
Campos PF, Wales N, Eriksson A, Manica A, et al. 2019. Parallel
Fay JC, Wyckoff GJ, Wu CI. 2001. Positive and negative selection on the
adaptation of rabbit populations to myxoma virus. Science
human genome. Genetics 158(3):1227–1234.
363(6433):1319–1326. Grantham R. 1974. Amino acid difference formula to help explain pro-
Arnold B, Kim S-T, Bomblies K. 2015. Single geographic origin of a wide- tein evolution. Science 185(4154):862–864.
spread autotetraploid Arabidopsis arenosa lineage followed by inter- Grishaeva TM, Bogdanov YF. 2014. Conservation and variability of syn-
ploidy admixture. Mol Biol Evol. 32(6):1382–1395. aptonemal complex proteins in phylogenesis of eukaryotes. Int J Evol
Baker Z, Schumer M, Haba Y, Bashkirova L, Holland C, Rosenthal GG, Biol. 2014:1–16.
Przeworski M. 2017. Repeated losses of PRDM9-directed recombi- Haenel Q, Roesti M, Moser D, MacColl ADC, Berner D. 2019. Predictable
nation despite the conservation of PRDM9 across vertebrates. Elife genome-wide sorting of standing genetic variation during parallel
6:e24133. adaptation to basic versus acidic environments in stickleback fish.
Barrett RDH, Schluter D. 2008. Adaptation from standing genetic vari- Evol Lett. 3(1):28–42.
ation. Trends Ecol Evol. 23(1):38–44. Harris K, Nielsen R. 2014. Error-prone polymerase activity causes multi-
Van Belleghem SM, Vangestel C, De Wolf K, De Corte Z, Möst M, Rastas nucleotide mutations in humans. Genome Res. 24(9):1445–1454.
P, De Meester L, Hendrickx F. 2018. Evolution at two time frames: Hermisson J, Pennings PS. 2005. Soft sweeps: molecular population ge-
polymorphisms from an ancient singular divergence event fuel con- netics of adaptation from standing genetic variation. Genetics
temporary parallel evolution. PLoS Genet. 14(11):e1007796. 169(4):2335–2352.
Berardini TZ, Reiser L, Li D, Mezheritsky Y, Muller R, Strait E, Huala E. Heyting C. 1996. Synaptonemal complexes: structure and function. Curr
2015. The Arabidopsis Information Resource: making and Mining Opin Cell Biol. 8(3):389–396.
the “Gold Standard” annotated reference plant genome. Genesis Hollister JD, Arnold BJ, Svedin E, Xue KS, Dilkes BP, Bomblies K. 2012.
53(8):474–485. Genetic adaptation associated with genome-doubling in autotetra-
Besenbacher S, Sulem P, Helgason A, Helgason H, Kristjansson H, ploid Arabidopsis arenosa. PLoS Genet. 8(12):e1003093.
Jonasdottir A, Jonasdottir A, Magnusson OT, Thorsteinsdottir U, Hu TT, Pattyn P, Bakker EG, Cao J, Cheng J-F, Clark RM, Fahlgren N,
Masson G, et al. 2016. Multi-nucleotide de novo mutations in Fawcett JA, Grimwood J, Gundlach H, et al. 2011. The Arabidopsis
humans. PLoS Genet. 12(11):e1006315. lyrata genome sequence and the basis of rapid genome size change.
Bhatia G, Patterson N, Sankararaman S, Price AL. 2013. Estimating and Nat Genet. 43(5):476–481.
interpreting FST: the impact of rare variants. Genome Res. Hudson RR, Slatkin M, Maddison WP. 1992. Estimation of levels of gene
23(9):1514–1521. flow from DNA sequence data. Genetics 132(2):583–589.
Bomblies K. 2020. When everything changes at once: finding a new Jones DT. 1999. Protein secondary structure prediction based on
normal after genome duplication. Proc R Soc Lond B. position-specific scoring matrices. J Mol Biol. 292(2):195–202.
287(1939):20202154. Jones FC, Grabherr MG, Chan YF, Russell P, Mauceli E, Johnson J,
Bomblies K, Higgins JD, Yant L. 2015. Meiosis evolves: adaptation to Swofford R, Pirun M, Zody MC, White S, et al. 2012. The genomic
external and internal environments. New Phytol. 208(2):306–323. basis of adaptive evolution in threespine sticklebacks. Nature
Bomblies K, Jones G, Franklin C, Zickler D, Kleckner N. 2016. The chal- 484(7392):55–61.
lenge of evolving stable polyploidy: could an increase in “crossover Kearse M, Moir R, Wilson A, Stones-Havas S, Cheung M, Sturrock S,
interference distance” play a central role? Chromosoma Buxton S, Cooper A, Markowitz S, Duran C, et al. 2012. Geneious
125(2):287–300. basic: an integrated and extendable desktop software platform for
Bomblies K, Madlung A. 2014. Polyploidy in the Arabidopsis genus. the organization and analysis of sequence data. Bioinformatics
Chromosome Res. 22(2):117–134. 28(12):1647–1649.
Brand CL, Wright L, Presgraves DC. 2019. Positive selection and func- Kolar F, Fuxova G, Zaveska E, Nagano AJ, Hyklova L, Lucanova M,
tional divergence at meiosis genes that mediate crossing over across Kudoh H, Marhold K. 2016. Northern glacial refugia and altitu-
the Drosophila phylogeny. G3 (Bethesda) 9:3201–3211. dinal niche divergence shape genome-wide differentiation in the
Charlesworth J, Eyre-Walker A. 2008. The McDonald-Kreitman Test and emerging plant model Arabidopsis arenosa. Mol Ecol.
Slightly Deleterious Mutations. Mol Biol Evol. 25(6):1007–1015. 25(16):3929–3949.
13You can also read