Explainable AI reveals changes in skin microbiome composition linked to phenotypic differences - Nature
←
→
Page content transcription
If your browser does not render page correctly, please read the page content below
www.nature.com/scientificreports
OPEN Explainable AI reveals changes
in skin microbiome composition
linked to phenotypic differences
Anna Paola Carrieri1*, Niina Haiminen2, Sean Maudsley‑Barton1,10, Laura‑Jayne Gardiner1,
Barry Murphy3, Andrew E. Mayes4, Sarah Paterson3, Sally Grimshaw3, Martyn Winn5,
Cameron Shand1,11, Panagiotis Hadjidoukas6, Will P. M. Rowe7, Stacy Hawkins8,
Ashley MacGuire‑Flanagan8, Jane Tazzioli8, John G. Kenny9, Laxmi Parida2,
Michael Hoptroff3 & Edward O. Pyzer‑Knapp1
Alterations in the human microbiome have been observed in a variety of conditions such as asthma,
gingivitis, dermatitis and cancer, and much remains to be learned about the links between the
microbiome and human health. The fusion of artificial intelligence with rich microbiome datasets
can offer an improved understanding of the microbiome’s role in human health. To gain actionable
insights it is essential to consider both the predictive power and the transparency of the models by
providing explanations for the predictions. We combine the collection of leg skin microbiome samples
from two healthy cohorts of women with the application of an explainable artificial intelligence (EAI)
approach that provides accurate predictions of phenotypes with explanations. The explanations are
expressed in terms of variations in the relative abundance of key microbes that drive the predictions.
We predict skin hydration, subject’s age, pre/post-menopausal status and smoking status from the
leg skin microbiome. The changes in microbial composition linked to skin hydration can accelerate
the development of personalized treatments for healthy skin, while those associated with age may
offer insights into the skin aging process. The leg microbiome signatures associated with smoking
and menopausal status are consistent with previous findings from oral/respiratory tract microbiomes
and vaginal/gut microbiomes respectively. This suggests that easily accessible microbiome samples
could be used to investigate health-related phenotypes, offering potential for non-invasive diagnosis
and condition monitoring. Our EAI approach sets the stage for new work focused on understanding
the complex relationships between microbial communities and phenotypes. Our approach can be
applied to predict any condition from microbiome samples and has the potential to accelerate the
development of microbiome-based personalized therapeutics and non-invasive diagnostics.
The associations between the human microbiome and individual health-related phenotypes are increasingly being
studied, giving rise to intervention strategies including prebiotics and p
robiotics1 and personalized t herapies2. An
improved understanding of how microbial taxa contribute to health and wellbeing, coupled with an increasing
ability to characterize the microbiome, can drive and accelerate the development of personalized microbiome-
based treatments. As microbiome research expands and as sequencing technologies continue to advance, the vol-
ume and complexity of the data collected inexorably increases. Therefore, the necessity to develop sophisticated
methods for analyzing microbiome data to derive actionable insights becomes increasingly important. Machine
learning (ML) has the potential for building predictive models that can provide powerful comprehension of
the complex interactions between microbial communities and their host organisms3. ML has been applied to
1
The Hartree Centre, Sci‑Tech Daresbury, IBM Research, Daresbury WA4 4AD, UK. 2T.J. Watson Research Center,
IBM Research, Yorktown Heights, NY 10598, USA. 3Unilever Research & Development, Port Sunlight CH63 3JW,
UK. 4Unilever Research and Development, Sharnbrook MK44 1LQ, UK. 5Scientific Computing Department,
STFC Daresbury Lab, Daresbury WA4 4AD, UK. 6IBM Research - Zurich, Saumerstrasse 4, 8803 Rueschlikon,
Switzerland. 7University of Birmingham, Birmingham, UK. 8Unilever Research & Development, Trumbull, CT 06611,
USA. 9Institute of Integrative Biology, The University of Liverpool, The Bioscience Building, Liverpool L697ZB,
UK. 10Department of Computing and Mathematics, Manchester Metropolitan University (MUU), Manchester M15
6BH, UK. 11Department of Computer Science, University of Manchester (UoM), Manchester M13 9LP, UK. *email:
acarrieri@uk.ibm.com
Scientific Reports | (2021) 11:4565 | https://doi.org/10.1038/s41598-021-83922-6 1
Vol.:(0123456789)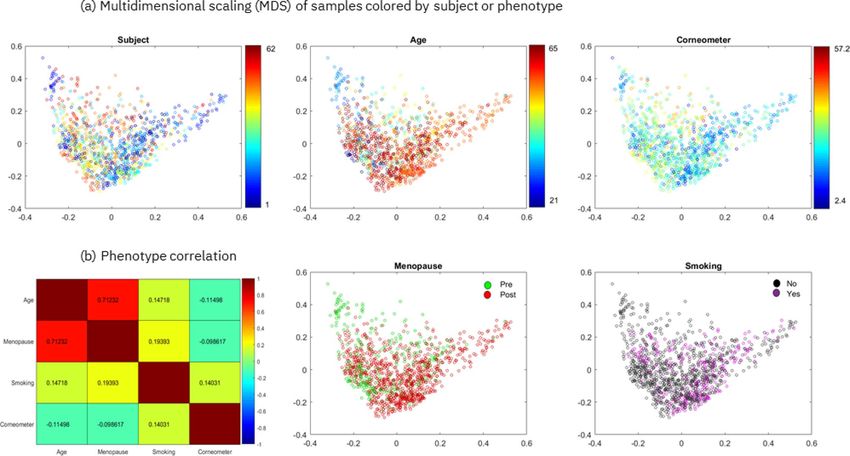
www.nature.com/scientificreports/
Time series Samples Country Sex Corneometer Age Menopausal status Smoking status
[2.4–57.2] 324 samples of 18 sub- 286 samples of 19
[21–65] Median ~ 56.0
1200 samples of 62 Median ~ 24.46 jects in pre-menopause smokers
Canada Female Mean ~ 52.7
subjects Mean ~ 24.36 876 of 44 subjects in 914 samples of 43 non-
Std ~ 11.36
Std ~ 8.87 post-menopausal smokers
[8.1–78.4] [19–55]
278 samples of 102 Median ~ 27.3 Median ~ 39.5
UK Female – –
subjects Mean ~ 31.70 Mean ~ 38.74
Std ~ 12.42 Std ~ 9.09
Table 1. Metadata for Canada and UK cohorts. See Supplementary Figure 1 for more details on the
distributions of corneometer, age and samples per subjects. Also see Methods and Supplementary Notes for
more detail on the sample collection.
microbiome data to investigate several important questions regarding the clustering of microbial species, taxo-
nomic assignment, comparative metagenomics and gene prediction.
Recently, a number of studies have been published on phenotype prediction from microbiome data4–10,
including some particularly focused on identifying discriminatory microbial taxa11 or microbial signatures12.
As ML is becoming increasingly deployed in patient-relevant settings, it is essential to consider both the predic-
tive power of the models and the transparency of the recommendations by providing an explanation for the
predictions13. This is often referred to as the explainability of the model. Interpretable AI/ML for microbiome
data is increasingly applied since explanations of the predictions are needed14–16. However, more can be done in
terms of explaining the mechanisms of the ML algorithm predictions for microbiome data.
We propose an explainable artificial intelligence (EAI) approach to identify key predictive taxa and to investi-
gate how the distributions of these microbial taxa drive the prediction of different phenotypic values. The explana-
tions are expressed in terms of key variations in microbiome composition. Our streamlined approach includes
three machine learning models—random forest R F17, XGBoost18 and LightGBM19—to predict the phenotypes.
Each model is tuned using the training dataset to predict the host phenotype, for the different classification and
regression tasks. Once tuned and trained, the optimized models are applied to predict unseen samples in the
test dataset. Performances on the test set and cross validation are compared based on the lowest Mean Absolute
Error for regression tasks or highest accuracy (given by F1-score, precision and recall metrics) for classification
tasks. The best model is then selected based on the performance scores, balancing the best score with the least
difference in score between the training and the test datasets (i.e., least overfitting). The explanations of the best
model are then provided using an explainable AI algorithm called SHapley Additive exPlanations (SHAP)20. A
detailed discussion of our EAI approach can be found in the Methods section.
To exemplify the power of explainable AI as a means to derive actionable insights from complex interactions
between microbes and their hosts, this study is focused on the human skin microbiome. The technical ease of
acquiring skin microbiome datasets—it is reliant only upon swabbing or scrubbing of skin to collect samples—
and the recent increase in the interest in analyzing the human skin microbiome21–25 makes skin an appealing
target. The human skin is a large, heterogeneous organ that protects the body from pathogens while supporting
microorganisms that influence human health and d isease26.
For this study, a total of 1200 time-series leg skin microbiome samples (bacterial 16S rRNA gene sequencing)
as well as associated skin hydration measures (visual assessment, pH, conductance, capacitance) were collected
from 62 Canadian women (21–65 years of age) displaying healthy (non-dry) or moderately dry skin. The time
series samples were collected between April and July 2017. Supplementary Figure 1 shows the number of samples
per subject for the Canada cohort. Additional phenotypic data (i.e., age, smoking habits and menopausal status)
were obtained from subject questionnaires. This study is primarily focused on the Canada cohort. However, to
investigate the generalizability of the EAI approach we used a second independent UK cohort of 278 samples
from 102 women. The UK cohort serves as a true hold-out test set to predict the skin hydration with the ML
models trained on the Canada cohort. The menopausal and smoking status metadata were not available for the
UK cohort. Table 1 reports the distribution of the four phenotypes for the Canada cohort and of skin hydration
for the UK cohort (see the Methods section and the Clinical design section in Supplementary Information for
more detail). The microbial features used as input to our EAI approach, are derived from the observed genera, i.e.,
Operational Taxonomic Units (OTUs) classified to genus level. Therefore, we use the terms genera and features
interchangeably. Relative abundances of 186 genera were obtained from taxonomic analysis of the sequenced
reads from both studies.
Our EAI approach uses the microbiome-derived features to predict skin hydration, age, menopausal and
smoking status for different subsets of the Canada cohort; the first 62 samples taken from each subject, the last 62
samples taken from each subject, and the time series samples blocked by subject (this ensures that samples from
the same subject are not present both in the training and test datasets when tuning, training and evaluating our
ML models). For each phenotype, we then compared the predictive performance of the ML models when using
62 “first samples taken”, 62 “last samples taken” and 1200 samples “blocked by subject”. Similarly, we applied our
EAI approach to predict the skin hydration of two different subsets of the UK cohort; the 102 first samples taken
from each subject and the 278 time series samples blocked by individual. For the best model and the best subset,
we then inferred, through the model’s explanation, how the most impactful microbial genera are contributing
to the prediction of each phenotype.
We decided to investigate the four phenotypes (skin hydration, age, menopausal and smoking status) for the
following reasons. Firstly, there is an increasing recognition of microbiome dysbiosis as a factor in atopic skin
Scientific Reports | (2021) 11:4565 | https://doi.org/10.1038/s41598-021-83922-6 2
Vol:.(1234567890)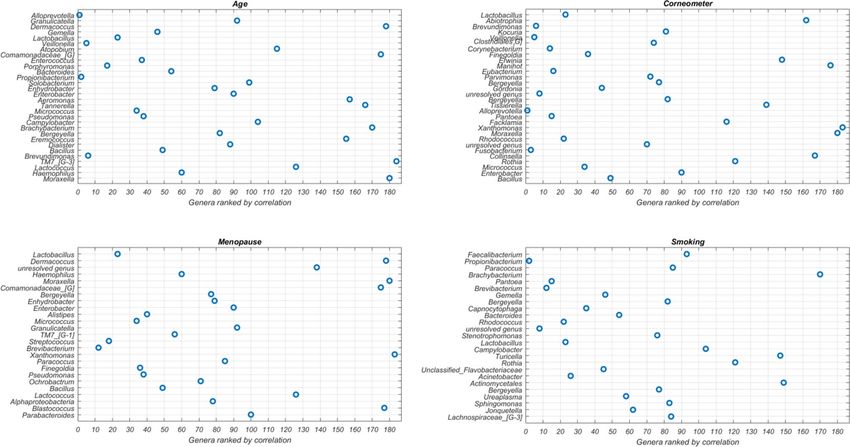
www.nature.com/scientificreports/
Figure 1. Multidimensional scaling (MDS) and phenotype correlation for the Canada cohort. (a)
Multidimensional scaling of pairwise Bray–Curtis dissimilarities of 1200 samples colored by subject (the 62
subjects are each represented by a randomly selected color) or by phenotypic value. (b) Pairwise Spearman’s
correlation is shown between each pair of phenotypes, except point-biserial correlation is shown when
comparing binary vs. continuous phenotypes (the encoding for computing the correlation for the binary
phenotypes is the following: smoking no/yes = 0/1, menopause pre/post = 0/1). The first two eigenvalues of the
MDS represent 12% and 10% of the sum of all positive eigenvalues. This image has been generated using Matlab
version R2017a at https://www.mathworks.com/products/matlab.html.
that is linked to psoriasis, eczema, acne, dermatitis and other d isorders25, 27–29. Previous studies characterized
microbiome signatures of different sites highlighting topographical and temporal variance in the microbiome
composition across dry, moist and sebaceous skin s ites26, 30–32. However, there is still a limited understanding of
changes in the microbiome associated with cosmetic dry skin. We show that our EAI approach has the potential
to provide insights on the effect of skin care and hygiene products on the molecular and microbiome composi-
tion of the s kin33. Moreover, being able to infer key compositional changes in the skin microbiome associated
with age may offer insights into the aging process that could be used to develop products that counteract skin
aging. Although a natural part of aging, the onset of menopause in women is a highly significant life event,
especially for those women for whom the onset occurs earlier than expected. Menopause is currently diagnosed
based on the symptoms, but a blood test to measure the hormone levels may be carried out for younger women.
The power of predicting the onset of menopause through a simple scrub of the leg could be transformational to
many women, as it points to the potential for a non-invasive diagnostic tool to be used as a condition monitor.
Finally, previous studies have highlighted the strong impact of smoking on gastrointestinal m icrobiota34, 35, and
the differences in microbial community composition of the upper respiratory tract between healthy smokers
and non-smokers36. Although smoking is considered a contributing factor to skin aging and systemic h ealth37,
its potential to influence the skin microbiome has not been fully investigated.
Through the application of our carefully calibrated EAI approach we were able to accurately predict the four
phenotypes for the first samples taken from each subject of the Canada cohort and we identified skin microbial
signatures associated with diverging values of each phenotype. Our findings demonstrate the potential of explain-
able artificial intelligence in contributing to the growing body of knowledge of host-microbe interactions, and
its future impact in many research fields, from cosmetic and medical research to forensic science and personal
health monitoring29, 33, 38, 39.
Results
In the following sections we present the results obtained when we predicted skin hydration, age, menopausal
status and smoking status using the Canada cohort. To account for possible confounding factors when predict-
ing the four phenotypes, we checked if the multidimensional projection of pairwise Bray–Curtis dissimilarities
of 1200 samples showed biases or separability of the samples by subject and by phenotype (Fig. 1a). The results
indicate that the samples are centered with no clear trends in either dimension of the two-dimensional scaling
and that they are not separable by subject, age or corneometer measurement. Similarly, Supplementary Figure 5a
Scientific Reports | (2021) 11:4565 | https://doi.org/10.1038/s41598-021-83922-6 3
Vol.:(0123456789)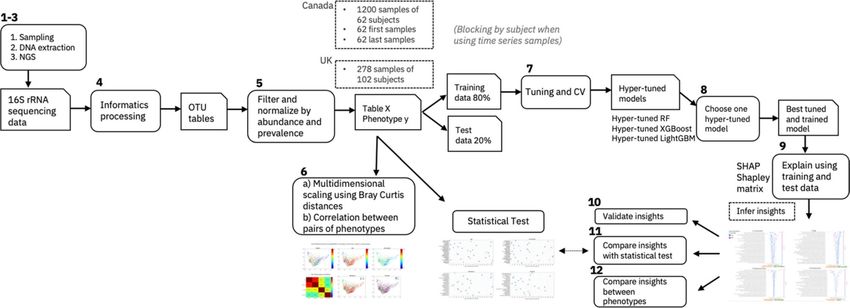
www.nature.com/scientificreports/

                                                    Phenotype        Dataset                            Model           MAE Test      MAE Train     Mean MAE CV           Std MAE CV
                                                                     Canada—62 first samples taken      RF               5.54         4.58            5.70                0.46
                                                                     Canada—1200 samples
                                                                                                        LightGBM         7.34         1.68            5.09                0.24
                                                                     blocked by individual
                                                    Corneometer
                                                                     UK—102 first samples taken         RF              11.8          4.61          11.85                 2.07
                                                                     UK—278 samples
                                                                                                        LightGBM         8.96         7.53            9.12                0.87
                                                                     blocked by individual
                                                                     Canada—62 first samples taken      RF               6.38         6.73            9.69                0.87
                                                    Age              Canada—1200 samples
                                                                                                        RF              10.78         0.38            9.19                2.11
                                                                     blocked by individual

                                                    Table 2.  Summary of predictive performance of the best ML models for regression tasks. Three ML models
                                                    (RF, LightGBM, XGboost) have been evaluated on different subsets of the Canada cohort (62 samples taken
                                                    from each subject at the first time point, and 1200 time series samples blocked by subject) and the UK cohort
                                                    (102 samples taken from each subject at the first time point, and 278 times series samples blocked by subject).
                                                    When applied to time series samples, the ML models have been tuned and trained blocking by individual,
                                                    e.g., samples of the same subjects are not present both in the training and test datasets. The table reports the
                                                    performances (mean absolute error (MAE) on training, testing and cross validation) of the best fine-tuned
                                                    model per dataset and phenotype. Supplementary Table 1 shows the full list of predictive performances of all
                                                    the ML models per dataset and phenotype.

                                                                                                                                                                            Ave        Std
                                                                       F1 score per class    F1 score        F1 score     Precision per class                               F1-score   F1-score
           Phenotype             Dataset                  Model        Test                  Test            Train        Test                    Recall per class Test     CV         CV
                                 62 first samples         LightGBM     [0.86, 0.95]          0.92            0.98         [1., 0.9]               [0.75, 1. ]               0.93       0.06
           Menopausal status     1200 samples blocked
                                                      XGBoost          [0.89, 0.75]          0.85            1            [0.89, 0.75]            [0.89, 0.75]              0.82       0.07
                                 by individual
                                 62 first samples         XGBoost      [0.89, 0.75]          0.85            0.98         [0.89, 0.75]            [0.89, 0.75]              0.72       0.12
           Smoking
           status                1200 samples blocked
                                                      LightGBM         [0.88, 0.10]          0.74            1.0          [0.82, 0.21]            [0.94, 0.07]              0.93       0.08
                                 by individual

                                                    Table 3.  Summary of predictive performance of the best ML models for classification tasks. Three ML models
                                                    (RF, LightGBM, XGboost) have been evaluated on different subsets of the Canada cohort (62 samples taken
                                                    from each subject at the first time point, and 1200 time series samples blocked by individual). When applied
                                                    to time series samples, the ML models have been tuned and trained blocking by individual, e.g., samples of the
                                                    same subjects are not present both in the training and test datasets. The table reports F1-score, precision and
                                                    recall per class as computed on the test dataset, weighted average F1-score on the test, training datasets and
                                                    on cross validation. The table reports the performances scores of the best fine-tuned model per dataset and
                                                    phenotype, while Supplementary Table 2 shows the full list.

                                                    reports the multidimensional projection of the Bray–Curtis dissimilarities of the 62 first samples taken from the
                                                    Canada cohort, showing that the 62 samples are not separable by subject or by any of the phenotypes.
                                                        Moreover, we examined the connections between the skin hydration (corneometer measurement), age, meno-
                                                    pause and smoking phenotypes by computing their pairwise correlations (Fig. 1b). Only age and menopause were
                                                    found to be strongly correlated (~ 0.71 point-biserial correlation)), as expected. To address this, we considered
                                                    possible confounding factors when predicting age and menopause and showed that we were able to predict age
                                                    within the pre- and post-menopausal groups separately (Supplementary Table 3). Also, in section “Leg skin
                                                    microbiome accurately predicts menopausal status” we discuss the differences in predictive genera between the
                                                    age and menopause models and the differences in impactful genera, that are predictive of age, between the pre-
                                                    menopausal and post-menopausal groups. With these checks in place, we proceeded with phenotype prediction.
                                                        Firstly, to avoid potential overfitting that could provide over-optimistic predictive performances when using
                                                    time-series samples, we blocked the analysis by subject (for both the Canada and UK cohorts). This ensured
                                                    that the samples from the same subjects were not present both in the test and training datasets during tuning,
                                                    training and cross validation of the ML models. Secondly, to take into account repeated-measurement effects,
                                                    we applied our EAI approach on two different subsets of 62 Canadian samples (one sample per subject). More
                                                    precisely, the first subset contained the first sample taken from each subject (i.e., at the first time point), while
                                                    the second subset contained the last sample taken from each subject. For training and testing the ML models we
                                                    randomly selected the 80% and 20% of the samples in each subset.
                                                        For each phenotype, we compared the predictive performance of three fine-tuned ML models on the differ-
                                                    ent subsets (see Supplementary Tables 1 and 2 for the full list of results). Tables 2 and 3 show summaries of the
                                                    predictive performances of the best selected models that have been tuned, trained and cross validated either on
                                                    the 62 first samples taken from the 62 Canada subjects or on the 1200 time series samples of the Canada cohort
                                                    blocked by subject. Overall, we found that the most predictive subset for the Canada cohort encompassed the

          Scientific Reports |      (2021) 11:4565 |                        https://doi.org/10.1038/s41598-021-83922-6                                                                            4

Vol:.(1234567890)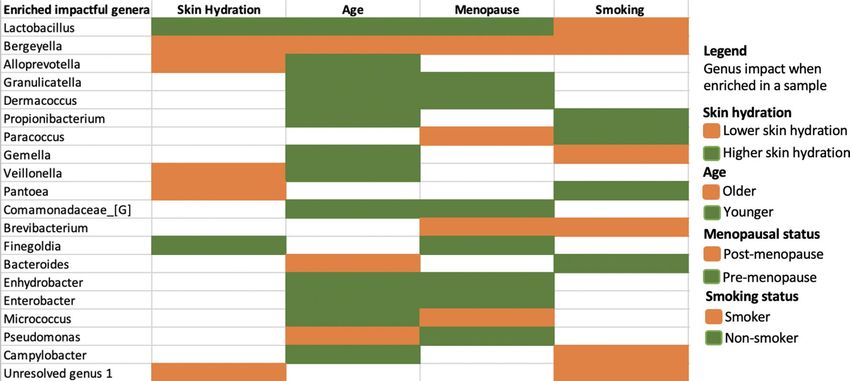
www.nature.com/scientificreports/
62 first samples taken. In fact, the decrease in predictive performance when using time series samples blocked
by subjects is likely due to the use of multiple samples per subject that leads to overfitting to intra-personal
characteristics.
Finally, for each predicted phenotype we generated the explanations of the best model (i.e., the model that
overall provided the best predictive performance and insights) for both the training and the test datasets (Fig. 2
and Supplementary Figure 6 respectively) that we discuss in the following sections.
Explainable skin hydration model identifies key microbes predictive of skin hydration. We
investigated the prediction of both individual and combined measures of skin hydration, and found that cor-
neometer measurement, a widely used and robust method for assessing skin hydration39, was the most appro-
priate measure for the Canada study (see section Phenotype analysis in Supplementary Information and Sup-
plementary Figures 2–4). Efforts to enrich the corneometer score with other measures did not provide sufficient
additional improvement in predictive performance as to merit their inclusion. Higher corneometer score values
correspond to higher skin hydration; thus, we adopt the terms corneometer score and skin hydration inter-
changeably.
When examining the relationship between corneometer and variation in skin microbiome composition,
the best selected model was the optimized RF that was tuned, trained and evaluated using the subset of 62 first
samples taken. The RF successfully predicted skin hydration levels from the measured microbiome with a MAE
of ~ 0.54 on the test set (see Table 2 and Supplementary Table 1). Results from cross-validation (average MAE
of ~ 5.70 and standard deviation of ~ 0.46) show that our best model (RF) is stable and performs well on different
sets of unseen data, when predicting the corneometer measurements.
The explanations for the corneometer predictions made by our best optimized model (RF) were provided
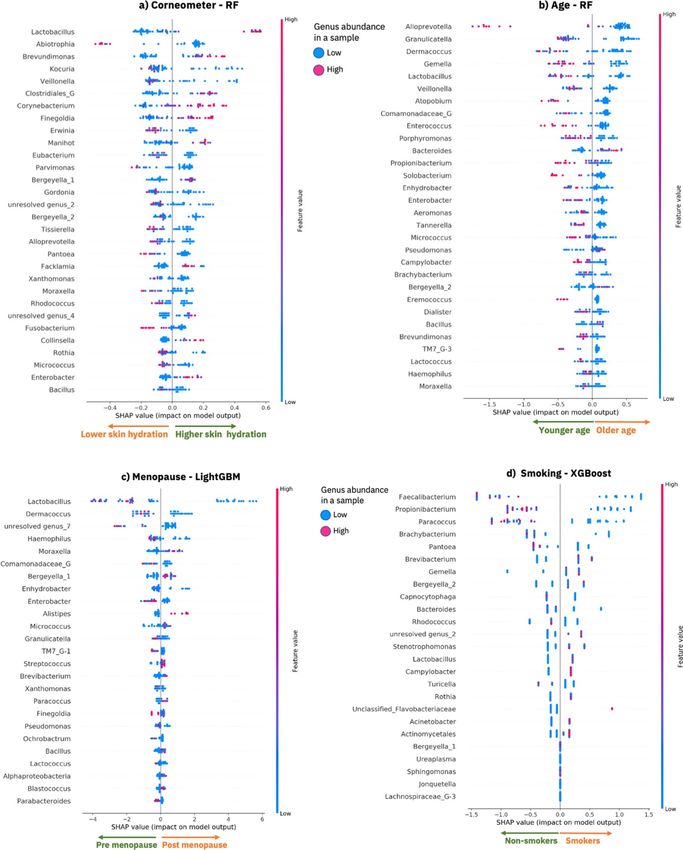
in terms of impactful genera as computed by SHAP. Figure 2a shows a summary dot plot that offers a global
overview of the local explanations based on the training data. Figure 2, in fact, explains what the trained model
has learned from the training data, e.g., how each genus is impacting the predictions of the phenotypes. The
genera are ranked based on their average absolute SHAP impact value across the samples in the training dataset,
for example in Fig. 2a Lactobacillus is the most impactful genus for the prediction of the corneometer values.
In particular Fig. 2a shows how each genus (each row in the SHAP dot plot) contributes, either positively or
negatively, to the prediction of the corneometer measurements for the samples (dots) in the training dataset. A
positive SHAP impact of a genus for a sample (a dot on the right side of the x-axis) means that the genus con-
tributes to an increase in the predicted corneometer value for that sample. On the contrary, a negative SHAP
impact of a genus for a sample (a dot on the left side of the x-axis) means that the genus contributes to a decrease
in the predicted corneometer value for that sample. A dot is colored based on the relative abundance of a genus
in the corresponding sample. The red dots are the samples for which a genus is highly abundant, and the blue
dots are the samples for which a genus is less abundant. See the Methods section for a detailed description of
the explanaibility algorithm (SHAP) that we applied, and the summary dot plots.
The top 30 ranked genera shown in Fig. 2a have a significant impact in the model’s predictions and the relative
abundance of these genera (i.e., the values of some of these features) informatively form separated clusters (red
or blue) that discriminate positive or negative impact of a genus on the model prediction i.e., high or low skin
hydration respectively. We found that an increase in the relative abundance of 11 genera is responsible for predict-
ing higher skin hydration, while an increase in the relative abundance of 19 genera is responsible for predicting
lower skin hydration (see Fig. 2a). For example, enrichment of Lactobacillus, Brevundimonas, Corynebacterium,
Finegoldia, Manihot, Collinsella and Enterobacter is contributing to the prediction of higher skin hydration. On
the other hand, for example, higher abundance of Abiotrophia, Pantoea, Fusobacterium, Parvimonas is contribut-
ing to the prediction of lower skin hydration. Among the genera most determinant of increased skin hydration
were Lactobacillus, Brevundimonas and Corynebacterium, all of which have previously been reported as being
associated with skin hydration or skin h ealth23, 24, 40, 41. In contrast, the genera Abiotrophia, Kocuria, Veillonella
and Erwinia were associated with decreased skin hydration, which also aligns with previous s tudies42–44. As the
insights shown in Fig. 2a can be extended to include the entire set of genera, our streamlined approach offers
an opportunity to investigate how each skin microbiome genus impacts skin hydration. Furthermore, when
we compared the explanations of the training data and of our unseen test dataset (Fig. 2a and Supplementary
Figure 6a) we observed a large degree of overlap (100% overlap in the top 20 ranked genera and 86.7% overlap
in the top 30 ranked genera overlap) and consistency in the direction in which the genera are driving the predic-
tions of both the training and the test datasets. Note that in Fig. 2 and Supplementary Figure 6 the top genera are
ranked based on their mean SHAP value across the samples. As the training and test datasets included different
samples, the order of the top 30 genera in the figures could differ slightly.
To investigate the generalizability of our approach we extended the skin hydration analysis to include a
UK cohort composed of 278 samples from 102 subjects and the same set of 186 OTUs as for the Canada study.
The aim was to validate the skin hydration model and to investigate how the model generalizes across cohorts,
while highlighting differences and similarities in the explainability results. We applied the three ML methods
to predict skin hydration from two datasets for the UK cohort; 278 samples blocked by subject and 102 first
samples taken from the UK cohort. We found that the subset most predictive of skin hydration was, in this case,
the 278 samples blocked by subject. We then compared the two best models respectively for the UK and Canada
cohorts (Table 2). We observed that the error increased when training and testing the models on the UK samples
blocked by subject, compared to when training and testing using the 62-first samples taken of the Canada cohort,
resulting in 8.92 (UK) vs 5.54 (Canada) MAE on the test set. In addition, when using our best model (RF) for
the Canada samples (trained on the Canada training data) to predict the 278 unseen UK samples, we obtained
a MAE of ~ 11.79. Note that corneometer assumes values in a range between [8.1,78.4] with median ~ 27.3 for
Scientific Reports | (2021) 11:4565 | https://doi.org/10.1038/s41598-021-83922-6 5
Vol.:(0123456789)www.nature.com/scientificreports/
Figure 2. Model explanations for the 62 first samples taken from the Canada cohort. SHAP summary dot plot
as computed by SHAP using the best optimized ML model that has been trained on 80% of the training data.
Each plot provides an overview of which features are most important for a model and visualizes how the value
of each feature (i.e., the genus abundance in the samples) contributes, either positively or negatively, to the
prediction of phenotypic values; (a) lower or higher corneometer measurements, (b) lower or higher values of
age, (c) pre-menopausal or post-menopausal status and (d) non-smokers or smokers. The features are sorted by
the sum of the absolute SHAP values over all the samples in the training dataset. Each dot is a sample, and its
color represents a feature value (i.e., genus abundance) for the sample. Red dots are samples for which a genus
(row) is enriched, while blue dots are samples for which a genus is lower in abundance. Clusters of red samples
on the right side of the x-axis means that the genus is abundant in those samples and it is contributing to the
prediction of a higher phenotypic value (indicated by the x-axis annotation of arrows pointing right). Clusters
of red samples (dots) on the left side of the y-axis means that the genus is enriched for those samples and it is
contributing to the prediction of a lower phenotypic value for those samples (indicated by the x-axis annotation
of arrows pointing left). This image was created using S HAP20 version 0.34.0 (https://github.com/slundberg/
shap).
Scientific Reports | (2021) 11:4565 | https://doi.org/10.1038/s41598-021-83922-6 6
Vol:.(1234567890)www.nature.com/scientificreports/
the UK cohort, while the corneometer range for the Canada cohort is [2.4, 57.2] with a median of ~ 24.36 (see
Table 1 and Supplementary Figure 1 for more detail on the distributions). As such, using these ranges, we com-
puted a 6.6 percentage points increase in MAE when using the best model for the Canada samples to predict
UK samples (MAE ~ 11.79) compared to using the best model for Canada samples to predict the unseen Canada
samples in the test set (MAE ~ 5.54).
Finally, we applied our EAI approach to explore the commonality and differences between the impactful
genera for predicting skin hydration in the best models for the Canada cohort (trained on Canada samples)
and the UK cohort (trained on UK samples) separately. Supplementary Figure 7 shows the explanations for the
UK skin hydration model. We found common impactful genera in both the UK and Canada models. For exam-
ple, Lactobacillus and Corynebacterium are among the top 20 impactful genera driving the prediction of more
hydrated skin (see Supplementary Figure 7) both of which have previously been reported as being associated
with skin hydration or skin health23, 24, 40. Kocuria is another example of common impactful genus that is driving
the prediction of less hydrated skin for both UK and Canada models. In addition, there are some genera in the
UK model, such as Dermacoccus and Ochrobactrum, that do not appear in the list of the top impactful genera
for the Canada model, and vice versa (see Fig. 2a vs Supplementary Figure 7).
Explainable age model identifies key microbes predictive of age: Canada cohort. A recent
study found that the skin microbiome of the hand and forehead was the most predictive of age when compared
to the gut and the oral microbiome, yielding predictions within 4 years of chronological age42. As such, we
applied our EAI approach to predict age from the different subsets of the Canada cohort (Table 2 and Supple-
mentary Table 1). Our best fine-tuned model (RF) was able to predict the subjects’ age from the skin microbiome
samples achieving an average error within 6 years of the chronological age (~ 6.36 MAE) on unseen data from
the test dataset. Table 2 shows the average MAEs obtained by our best fine-tuned model on the test and the train-
ing datasets. Note that the RF provided the smallest difference in MAE between training and test sets when using
the 62 first samples (see Supplementary Table 1 reports to compare the performance of each model).
Analogously to the skin hydration model, we applied the SHAP explainability analysis to understand the
link between bacterial communities on the skin and subject’s age. Our EAI approach revealed that higher abun-
dance of 26 genera drives the prediction of younger age, while higher abundance of 4 genera contributes to the
prediction of older age (see Fig. 2b and Supplementary Figure 6b). The genera most determinant of younger
age, when higher in abundance, included Alloprevotella, Granulicatella, Gemella and Lactobacillus (Fig. 2b),
while the genera Bacteroides, Pseudomonas, Bergeyella and Bacillus were predictive of older age for the samples
in the training and test sets (Supplementary Figure 6b). Note that the genera are ordered based on the average of
their absolute SHAP values across the samples. As the training and test sets include different samples, the rank
of the genera might differ slightly when visualized in the SHAP summary dot plots (Fig. 2b and Supplementary
Figure 6b). When we compared the explanations for the top 30 genera between the training dataset and our
unseen test dataset (Fig. 2b and Supplementary Figure 6b), we observed a large degree of overlap (93%) in the
top 30 ranked genera and consistency in the direction in which these genera are driving the predictions of both
the training and test datasets.
The model’s explanations indicated that Propionibacterium is a key genus for predicting younger age when
enriched in the samples of the training and test datasets (Fig. 2b and Supplementary Figure 6b). This is consistent
with previous findings that showed a significant decrease in the relative abundance of Propionibacterium in the
forehead, cheek and forearm of older s ubject45. This might be related with a decrease in sebum secretion level
in older s kin46. Similarly, Granulicatella, driving the prediction of younger age, has been found to be negatively
correlated with age47, while Lactobacillus was linked to anti-aging48. Bacillus, on the other hand, was found to
be dominant in the cheek microbiome of older p eople49; that is in line with the fact that in our model Bacillus is
driving the prediction of older age when enriched in the microbiome samples.
Finally, we found some overlap between the genera identified as being important for both the skin hydration
and age models (30%). However, the majority (70%) of the genera among the top 30 most impactful ones were
different (Fig. 2a vs 2b). This enabled the disambiguation of microbes whose effects mainly relate to either skin
aging or hydration. In fact, perhaps contrary to expected, these results showed that skin hydration and age are not
inexorably linked. This can be observed in Fig. 1b, which shows a very weak link between age and corneometer
score (Spearman’s correlation of ~ -0.11).
Leg skin microbiome accurately predicts menopausal status: Canada cohort. To examine
changes in the skin microbiome that are associated with the menopause and to investigate how these changes are
also related to aging, we applied our EAI approach to classify samples from the Canada cohort into pre-meno-
pausal and post-menopausal status. The dataset included 324 samples of 18 subjects in pre-menopausal status
and 876 samples of 44 subjects in post-menopausal status. We applied the EAI approach to both the 1200 time
series samples blocked by subject, to the first samples taken from the 62 different subjects and to the last samples
taken from the 62 subjects. We found that using the 62 first samples provided the best predictive performance
(Table 3 and Supplementary Table 2). The best fine-tuned model (LightGBM) was able to predict both classes
and showed robustness when cross validated, with an F1-score of 0.92 on the unseen samples of the test set.
Table 3 shows the F1-score, precision and recall per class computed on the test dataset, as well as the weighted
average of the F1-score both on the training and the test data. Supplementary Figure 8a displays the confusion
matrix computed on the test dataset, which further demonstrates how LightGBM was able to accurately predict
each class. Note that only one sample with the status post-menopausal was wrongly classified as pre-menopausal,
while all the samples in the minority class (pre-menopausal) were correctly classified.
Scientific Reports | (2021) 11:4565 | https://doi.org/10.1038/s41598-021-83922-6 7
Vol.:(0123456789)www.nature.com/scientificreports/
We generated insights for the menopausal model by explaining the mechanisms underlying the predictions
of our best model (LightGBM) using the best subset (62 first samples taken) from the Canada cohort. Figure 2c
shows the explanations for the training dataset and Supplementary Figure 6c shows the explanations for the test
dataset, i.e., the impact of the top 25 impactful genera as generate by SHAP.
Since, as expected, menopause and age are correlated, we investigated similarities and differences between
the two models taking into account possible confounding factors when predicting age or menopausal status. The
menopause model considered a number of genera to be important (e.g., Lactobacillus, Dermacoccus, Granulica-
tella, Pseudomonas, Bergeyella and Bacillus) that were already seen as key indicators in the age model, along with
a key indicator of skin hydration (Lactobacillus). This is perhaps not surprising as menopause usually occurs in
middle age and the skin is significantly affected by the aging process and m enopause50. Interestingly, we noted
that Granulicatella, Dermacoccus and Lactobacillus were amongst the most important genera in the age model
that predicted a younger age, and in line with this they also predicted a pre-menopausal status when higher in
abundance.
Genera such as Brachybacterium, Cutibacterium (formerly Propionibacterium), Atopobium, Bacteroides, Por-
phyromonas, Tannerella, Alloprevotella, Gemella, Eremococcus, Enterococcus, Solobacterium, Dialister, Veillonella,
Brevundimonas, Campylobacter and Aeromonas appear among the most impactful for predicting age, while they
do not appear in the menopausal model. This aligns with expectations from previous work, where Bacteroides,
Porphyromonas, and Veillonella have been directly linked to age via the skin m icrobiome49 and where the expan-
sion of some species of Cutibacterium, formerly Propiniobacterium, is known to be favored by younger skin45. On
the other hand, Brevibacterium, Blastococcus, Parabacteroides, Alistipes, Streptococcus, Finegoldia, Alphaproteo-
bacteria, Ochrobactrum, Paracoccus are considered impactful for predicting menopausal status alone and do not
appear in the ranked list of most impactful genera of the age model. Many of these genera can be supported by
previous work, e.g., with Parabacteroides and Alistipes abundance being previously linked to menopausal status
via the gut microbiome47, 51. Additionally, the enrichment of Streptococcus and Bacillus in the vaginal microbi-
ome of post-menopausal women has been reported52, 53, which supports our EAI approach linkage of increased
abundance with the classification of post-menopausal women. The same previous work found the depletion of
Lactobacillus as the most dramatic change in the post-menopausal microbiome (compared to pre-menopausal)
which matches the directionality and impact of this genus here since it is our most impactful feature. Finally,
when we compare the explanations for the menopausal model between the training data and our unseen test
dataset (Fig. 2c vs Supplementary Figure 6c) we observed a large degree of overlap (96% in the top 25 ranked
genera) and consistency in the direction in which the genera are driving the predictions of both the training
and the test dataset.
To investigate the relationship between the continuous variable age and the binary variable menopausal sta-
tus, we computed their point-biserial correlation, which is 0.71 (Fig. 1b). As such, to take into account possible
confounding factors, we trained our ML models for predicting age separately for pre-menopausal and post-men-
opausal sample groups. We found that it was possible to accurately predict age for the two sub-groups, showing
that age prediction is robust (see Supplementary Table 3). More precisely, we obtained an error of ~ 5 years on the
test set of post-menopausal samples, and an error of ~ 6 years on the test set of the smaller pre-menopausal group.
Supplementary Figure 9 shows a comparison of the top 25 impactful genera, as generated by SHAP using the best
selected model (RF), between pre-menopausal and post-menopausal groups. Above, we predicted menopausal
status from all subjects and identified key genera that were menopause-specific and not highly impactful in the
age model. In fact, the overlap between the top 20 most impactful genera between the menopause and the age
models was only 40%, demonstrating that the age and menopause models differ from each other and may offer
different and unique insights. Here, if we compare our two new age models that separate pre and post-menopausal
subjects, this overlap of insights decreases further. For pre- and post-menopausal age models, respectively, we
found; an overlap of only 10% between their most impactful genera, an overlap of 25%/30% compared to the
previous age model and an overlap of only 15%/15% with the menopausal model. This indicates that when we
separate pre- and post-menopausal groups to predict age, the insights differ not only significantly from those
generated when the groups are combined to predict age, but also more significantly from those of the menopausal
predictive model. Therefore, the stratification of subjects may offer additional insights that are more specific to
phenotypic values. The most impactful unique genera for age prediction in the pre-menopausal group (absent
from all other models) included Rothia, Fusobacterium and Prevotella, which have been previously linked to
age with the same positive correlation we observed here through explainability45. The most impactful unique
genera for age prediction in the post-menopausal group (absent from all other models) included Pasteurella,
Mobiluncus and Deinococcus.
Key microbes on the leg discriminate smokers accurately: Canada cohort. With the aim of
investigating skin microbiome variations associated with smoking habits, we applied our EAI approach to pre-
dict smoker vs non-smoker subjects from the leg skin microbiome of the Canada cohort. We applied the EAI
approach to both the 1200 time series samples blocked by subject, to the first samples taken from the 62 different
subjects and to the last samples taken from the 62 subjects. The dataset included 286 samples from 19 smokers
and 914 samples from 43 non-smokers. We found that using the 62 first samples provided the best predictive
performance (Table 3 and Supplementary Table 2). The best fine-tuned model (XGBoost) was able to predict
both classes with an F1-score of 0.85 on the unseen samples of the test set. Table 3 shows the F1-score, precision
and recall per class computed on the test dataset, as well as the weighted average of the F1-score both on the
training and the test data. Supplementary Figure 8b displays the confusion matrix computed on the test dataset,
which further demonstrates how XGBoost was able to accurately predict each class.
Scientific Reports | (2021) 11:4565 | https://doi.org/10.1038/s41598-021-83922-6 8
Vol:.(1234567890)www.nature.com/scientificreports/
Table 4. Summary of insights inferred from our EAI framework when predicting skin hydration, age,
menopausal status, and smoking status for the 62 first samples taken from the Canada cohort. The table shows
the union of the most impactful genera for each phenotype. The colors (green or orange) reflect the impact that
each genus has in predicting a particular phenotype when higher in abundance. For example, higher abundance
of Lactobacillus contributes to the prediction of a higher skin hydration (green), while higher abundance of
Bergeyella drive the prediction of lower skin hydration (orange). The legend on the right shows the color code
for each phenotype values.
We found that the prediction of smokers is driven by higher abundance of 11 genera (including Brevibacte-
rium, Gemella, Bergeyella, Stenotrophomonas, Lactobacillus, Campylobacter, Rothia, Acinetobacter and Actino-
mycelates), while 9 genera (including Faecalibacterium, Paracoccus, Brachybacterium, Pantoea, Capnocytophaga,
Bacteriodes, Rhodococcus and Turicella) were the most impactful for predicting the class non-smoker when
higher in abudance (Fig. 2d and Supplementary Figure 6d). When we compare the explanations between the
training data and our unseen test dataset (Fig. 2d vs Supplementary Figure 6d) we observed a large degree of
overlap (100% in the top 25 ranked genera) and consistency in the direction in which the genera are driving the
predictions of both the training and the test datasets.
Finally, we examined the split of smokers vs non-smokers against age. The age of smokers varies from 21 to
65 years old, while the age of non-smokers varies from 40 to 64 years old. To better quantify the relationship
between age and smoking status we trained a Logistic Regression model to predict the likelihood of smokers
and non-smokers from chronological age. Supplementary Table 4 reports precision recall and F1-score per class
computed on the unseen samples in the test dataset. The results show that the trained classifier is not accurate
as it is not able to correctly predict samples in the smaller class, e.g., smokers. Furthermore, we computed the
point-biserial correlation between chronological age and smoking status, which consistently gave a low correla-
tion of ~ 0.14 (Fig. 1b).
Discussion
To summarize the explainability results across phenotypes, we compiled Table 4 and Supplementary Table 5
illustrating both the overlapping and uniquely impactful skin microbes (in Fig. 2) for the phenotype prediction
of the 62 first samples taken from Canada cohort. Our study indicated that some members of the microbiome
play a general role in wellbeing, as they are involved in consistently predicting more than one of the phenotypes
(skin hydration, age, smoking and/or menopausal status) when they are enriched in the samples (see agreement
in the top half of Table 4). The genera in Table 4 are impactful for predicting at least two phenotypes each. The
genus at the top, Lactobacillus, is impactful for predicting higher skin hydration, younger age and pre-menopausal
status when higher in abundance. On the other hand, higher abundance of Bergeyella is impactful for predicting
lower skin hydration, older age, post-menopausal status and smoking status. Nevertheless, accurate predictions
of each phenotype require distinct combinations of impactful genera (see Supplementary Table 5, Fig. 2 and
Supplementary Figure 6). For example, higher abundance of Abiotrophia and Kocuria is uniquely driving the
prediction of lower skin hydration, while Atopobium and Enterococcus are most impactful only in the age predic-
tion model. Higher abundance of Alistipes uniquely drives the prediction of post-menopausal status, while higher
abundance of Faecalibacterium identifies non-smokers (Supplementary Table 5). Pseudomanas is an example
of a genus having opposite impacts on two phenotypes (older age and pre-menopausal status). However, in the
menopausal model the impact of Pseudomonas is close to zero (as we can see in Fig. 2c the dots are close to zero
on x-axis) meaning that Pseudomonas is not the most discriminating feature for menopausal status.
When we compared the impactful genera from our EAI approach to the results from statistical tests that
independently associate each genus with the phenotype (Fig. 3), we observed overlap between the top genera
from our EAI approach and those highly ranked according to statistical testing, however, there were notable
Scientific Reports | (2021) 11:4565 | https://doi.org/10.1038/s41598-021-83922-6 9
Vol.:(0123456789)www.nature.com/scientificreports/
Figure 3. Feature ranking from statistical test. Visualization of the most impactful genera per phenotype. On
the y-axis the ranked impactful genera as generated by SHAP (the most impactful genus at the top) are shown.
On the y-axis the rankings in independent statistical tests (the most significant (smallest p-value) genus is on the
left) are shown. Note that the total number of genera is 186. This image has been generated using Matlab R2017a
at https://www.mathworks.com/products/matlab.html.
exceptions also. The 2nd most impactful genus for predicting skin hydration, Abiotrophia, was ranked 90th,
while our EAI approach sensibly links its high abundance with low skin hydration. This latter result is in agree-
ment with previous studies that found Abiotrophia positively associated with skin infections such as P soriasis42.
Dermacoccus, Atopobium and Comamonadaceae are among the top eight impactful genera in the age model but
only ranked over 100 from statistical test. Strikingly, Dermacoccus, a genus of Moraxellaceae, Moraxella, and
Comamonadaceae are among the six most impactful genera in the menopausal status model but are all ranked
significantly lower (over 100) using standard microbiome analysis. For smoking, the top ML feature Faecali-
bacterium was only at rank 93 according to the statistical test and other five genera were ranked over 100. This
indicates the set of most predictive genera inferred by our EAI approach can differ from the ones highlighted
by a standard statistical approach that considers each genus independently. As such, our approach can be used
to complement standard statistical methodologies to investigate predictive microbial features, at any taxonomic
level, whose combined contribution to the phenotype could be missed otherwise.
Our findings on the predictive power of the leg skin microbiome point to the possibility of using more acces-
sible microbiome samples to investigate phenotypes (e.g., smoking status) that are not believed to be directly
associated with the microbiome of the sampled body site (e.g., skin microbiome of the leg). The lower abundance
of Faecalibacterium observed previously in the gut microbiome of smokers54 is in agreement with the fact that we
found low abundance of Faecalibacterium on the leg to be the most impactful for predicting the class of smoker.
Additionally, higher levels of Brachybacterium in the lower respiratory tract microbiome were previously found
in non-smokers55, and similarly higher abundance of Brachybacterium was found predictive of non-smokers
through explainability. Finally, Brevibacterium was identified in the bacterial microbiota of a large range of
commercial cigarette p roducts56, as such, this supports our linkage of higher abundance of Brevibacterium to
the prediction of smokers. The similarity between the genera that discriminate smokers from non-smokers in
our skin model and the genera identified as discriminators of smokers in previous studies of the oral and gut
microbiome is encouraging. Despite the fact that smoke is not in direct contact with skin on the leg, we found that
the leg skin microbiome likely changes in response to smoking, and in a manner that is consistent with previous
findings from different body sites. This further confirms systematic changes occurring across the human body in
cigarette smokers. It also suggests the microbiome of distant body sites may be affected by smoking, hence point-
ing to the fact that extremely complex interactions between body locations or tissues are yet to be understood.
Likewise, microbiome sequencing from vaginal swab samples found a similar membership of major vaginal
bacteria at the genus level in pre- and post-menopausal women but with altered proportions. A previous study
observed the most abundant genus in the vaginal microbiome of pre-menopausal women to be Lactobacillus
(64.4%), and its levels were found to be much lower in post-menopause (24.4%), replaced by Streptococcus (5.1%)
among others52. This reflects our observations where Lactobacillus is the most impactful feature and when it is
enriched, it predicts premenopausal status, while Streptococcus is predictive of post-menopausal status when
more abundant (see Fig. 2c). Here the skin microbiome appears to share similarities with the vaginal microbiome
Scientific Reports | (2021) 11:4565 | https://doi.org/10.1038/s41598-021-83922-6 10
Vol:.(1234567890)www.nature.com/scientificreports/
which could explain its ability to predict menopausal status. Furthermore, additional impactful genera from the
menopause model can be supported by previous work in the gut microbiome, e.g., with Parabacteroides and
Alistipes abundance being previously linked to menopausal s tatus47, 51.
We took into account possible confounding factors when predicting the four phenotypes for the Canada
study. Of the four phenotypes, only age and menopause were found to be correlated (~ 0.71 point-biserial correla-
tion, Fig. 1b). To address this, we showed that we were able to accurately predict age separately for the pre- and
post-menopausal groups, demonstrating that age prediction is robust despite possible confounding factors like
menopausal status. We then compared the age model explanations among those groups. Through our explain-
ability analysis we demonstrated how the age and menopausal models share common impactful genera, while
still considerably differing from each other. For instance, unique genera to the age model were Bacteroides, Por-
phyromonas, and Veillonella that have been directly linked to age via the skin microbiome49 and Cutibacterium,
formerly Propiniobacterium, that is known to be favored by younger s kin45. Another example of impactful genera
unique to the age prediction model specifically in the pre-menopausal group included Rothia, Fusobacterium
and Prevotella (Supplementary Figure 9), which have been previously linked to a ge45. Therefore, although the
phenotypes are correlated, the age and menopausal models can offer insights that are phenotype specific.
We also showed that some of the insights on skin hydration, inferred through explainability, are consistent
with previous findings. For example, the genera most associated with increased skin hydration were Lactobacil-
lus, Brevundimonas and Corynebacterium, all of which have previously being associated with skin hydration
or skin health23, 24, 40, 41. Moreover, two of these genera, Lactobacillus and Corynebacterium are among the most
impactful genera in both the Canada and UK skin hydration models.
We observed commonalities and differences in the impactful genera of the UK and Canada skin hydration
models. Differences in impactful genera and predictive performances between the two models might be due to:
a) the different distributions of corneometer values and age between the Canada and UK cohorts, b) the dispar-
ity in dimensionality of the two datasets, c) country specific differences in microbiome composition, and d) the
different depths of coverages and/or represented microbes between the two datasets.
Finally, while predictive performance is important, the focus of this work is the explainability of the ML
models.
Understanding why a model makes certain predictions can be as important as the predictions’ accuracy.
However, the “black box” nature of the most accurate ML models, often sophisticated, makes even experts
struggle to interpret them. This can create an undesirable compromise between complex high accuracy models
and interpretability. Explainability methods can open the “black box” and consequently help build trust in the
model’s predictions. However, the model explanations should be treated with a level of doubt commensurate
with the inaccuracy of the model’s predictions.
Providing model explanations can help us to understand the link between microbiome composition and
phenotypes, and also importantly build trust in the model predictions. As the insights shown in Fig. 2 and
Supplementary Figure 6 can be extended to include the entire set of genera, our streamlined approach offers an
opportunity to infer new insights by investigating how each skin microbe impacts the phenotype prediction. We
propose that all genera with a relatively high impact in the predictive models are likely to either play a biologically
causative role or offer value as a non-causative indicator organism and thus are worthy of additional investigation.
In this study we investigated microbial taxa at genus level, however our EAI approach can be similarly applied
to the investigation of changes at species or strain level. Moreover, while we performed a particular analysis with
one bioinformatics pipeline (to identify genera and abundances from bacterial 16S rRNA gene sequencing), this
approach extends to exploring how microbial features from shotgun metagenomic sequencing are impactful in
predicting phenotypes. This would involve taking into account the entire genetic material of a microbial commu-
nity (including fungi and viruses), providing insights related to genes and their associated biological functions. In
general, the ability to predict specific phenotypes from non-invasive microbiome sampling can perform a similar
revolutionary role as the collection and sequencing of human DNA from cheek swabs, which has powered the
gathering of massive data sets and thus the genomic revolution in personalized medicine.
Conclusion
We developed an explainable AI (EAI) approach to predict phenotypes and explain the predictions in terms of
changes in microbiome composition related to diverging phenotypic values. The results presented in this study
demonstrate the power of explainable AI in accurately predicting diverse phenotypes such as skin hydration,
age and, surprisingly, menopausal and smoking status from the leg skin microbiome, and in inferring microbial
signatures associated with each phenotype. In addition, we investigated the application of the skin hydration
model to a second, independent cohort to compare the predictive performance and explainability of the model.
Our study focused on personalized care and wellbeing. However, it is straightforward to appreciate how this
approach is broadly applicable in healthcare, representing an advancement in the deployment of microbiome-
based and non-invasive diagnostics for practitioners (e.g., dermatologists) and in the design of personalized
treatments. Impactful future work will likely involve additional independent studies and analysis at species or
strain level to investigate health-related phenotypes. Moreover, future work will involve the extension of our
EAI approach to incorporate multiple explainability methods as well as transfer learning methods with the aim
of improving the generalisability of ML models and their explanations across different cohorts.
Our EAI approach will enable the community to expand and build on this initial work as the explanations
may offer new insights into the complex interactions between microbes and their host, possibly leading to new
interventions to adjust the microbiome for improved health outcomes.
Scientific Reports | (2021) 11:4565 | https://doi.org/10.1038/s41598-021-83922-6 11
Vol.:(0123456789)You can also read