Controls on the spacing of first-order valleys
←
→
Page content transcription
If your browser does not render page correctly, please read the page content below
JOURNAL OF GEOPHYSICAL RESEARCH, VOL. 113, F04016, doi:10.1029/2007JF000977, 2008
  Click
  Here
    for
 Full
Article

Controls on the spacing of first-order valleys
J. Taylor Perron,1,2 William E. Dietrich,3 and James W. Kirchner3,4,5
Received 7 January 2008; revised 25 August 2008; accepted 6 October 2008; published 24 December 2008.

[1] Many landscapes are composed of ridges and valleys that are uniformly spaced, even
where valley locations are not controlled by bedrock structure. Models of long-term
landscape evolution have reproduced this phenomenon, yet the process by which
uniformly spaced valleys develop is not well understood, and there is no quantitative
framework for predicting valley spacing. Here we use a numerical landscape evolution
model to investigate the development of uniform valley spacing. We find that evenly
spaced valleys arise from a competition between adjacent drainage basins for drainage
area (a proxy for water flux) and that the spacing becomes more uniform as the landscape
approaches a topographic equilibrium. Valley spacing is most sensitive to the relative rates
of advective erosion processes (such as stream incision) and diffusion-like mass
transport (such as soil creep) and less sensitive to the magnitude of a threshold that limits
the spatial extent of stream incision. Analysis of a large number of numerical solutions
reveals that valley spacing scales with a ratio of characteristic diffusion and advection
timescales that is analogous to a Péclet number. We use this result to derive expressions for
equilibrium valley spacing and drainage basin relief as a function of the rates of advective
and diffusive processes and the spatial extent of the landscape. The observed scaling
relationships also provide insight into the cause of transitions from rill-like drainage
networks to branching networks, the spatial scale of first-order drainage basins, the
contributing area at which hillslopes transition into valleys, and the narrow range
of width-to-length ratios of first-order basins.
Citation: Perron, J. T., W. E. Dietrich, and J. W. Kirchner (2008), Controls on the spacing of first-order valleys, J. Geophys. Res.,
113, F04016, doi:10.1029/2007JF000977.

1. Introduction                                                             so that ridge-and-valley topography appears to have a
                                                                            characteristic ‘‘wavelength’’ (Figures 1 and 2).
  [2 ] Landscapes have many self-organized features
                                                                              [3] Perron et al. [2008] demonstrated the existence of
[Hallet, 1990], which range in size from ripples and dunes
                                                                            characteristic ridge-valley wavelengths by analyzing two-
[Bagnold, 1941; Kennedy, 1969] to evenly spaced mountain
                                                                            dimensional Fourier power spectra derived from high-
ranges [Eaton, 1982]. Some of the most basic and visually
                                                                            resolution topographic maps of soil-mantled landscapes,
striking scales are associated with the erosional dissection of
                                                                            including the landscape in Figure 2, and showing that the
landscapes into ridges and valleys. To first order, the scale
                                                                            spectra contained peaks corresponding to quasiperiodic
of the topography in such a landscape is defined by the
                                                                            structures. By comparing the topographic spectra with those
spacing and depth of the valleys, or, equivalently, the width
                                                                            of fractal surfaces, Perron et al. demonstrated that such
and height of the intervening ridges. It has long been
                                                                            uniform valley spacing is unlikely to occur by chance in
observed that ridges and valleys within a given landscape
                                                                            random topography.
appear to have a characteristic size. In particular, valley
                                                                              [4] Uniform spacing is especially apparent among first-
spacing is often quasiperiodic [Gilbert, 1877; Shaler, 1899;
                                                                            order drainage basins in soil-mantled landscapes
Hack and Goodlett, 1960; Hanley, 1977; Hovius, 1996;
                                                                            [Montgomery and Dietrich, 1992; Dietrich and Montgomery,
Talling et al., 1997; Izumi and Parker, 2000; Allen, 2005],
                                                                            1998; Perron et al., 2008], but is observed to occur at scales
   1
                                                                            ranging from meter-scale field and laboratory analogs
     Department of Earth and Planetary Sciences, Harvard University,        [Schorghofer et al., 2004] to entire mountain belts [Hovius,
Cambridge, Massachusetts, USA.
   2
     Now at Department of Earth, Atmospheric and Planetary Sciences,
                                                                            1996; Talling et al., 1997], and in diverse settings that
Massachusetts Institute of Technology, Cambridge, Massachusetts, USA.       include submarine environments [Orange et al., 1994] and
   3
     Department of Earth and Planetary Science, University of California,   beaches [Schorghofer et al., 2004]. Uniformly spaced ero-
Berkeley, California, USA.                                                  sional valleys have even been observed on Mars (Figure 3).
   4
     Swiss Federal Institute for Forest, Snow, and Landscape Research,
Birmensdorf, Switzerland.
                                                                            Importantly, uniform valley spacing often occurs in land-
   5
     Department of Environmental Sciences, Swiss Federal Institute of       scapes where bedrock structure and tectonic patterns do not
Technology, Zürich, Switzerland.                                           exert a significant control on the locations of valleys, a trend
                                                                            noted by Gilbert [1877] in relation to the ‘‘great regularity
Copyright 2008 by the American Geophysical Union.                           and beauty’’ of badlands. This observation, along with the
0148-0227/08/2007JF000977$09.00

                                                                     F04016                                                         1 of 21
F04016 PERRON ET AL.: VALLEY SPACING F04016
governing physics of the system that produces them. Yet our
ability to interpret this signal is limited by the lack of a well-
tested mathematical framework for predicting many of the
characteristic scales that occur in landscapes. Perusal of the
literature on long-term landscape evolution reveals several
studies in which physically based numerical models pro-
duce landscapes that appear to contain quasiperiodic ridges
and valleys [e.g, Howard, 1994a; Kooi and Beaumont,
1996; Densmore et al., 1998; Tucker and Bras, 1998], but
it is not clear how this pattern emerges as the topography
evolves, how the model equations control the valley spac-
ing, or whether the modeled spacing is consistent with that
observed in nature.
[6] A number of previous studies of the erosional devel-
Figure 1. Aerial photograph of a landscape near Orland, opment of landscapes have proposed conceptual and quan-
California, showing quasiperiodic valley spacing of roughly titative explanations for the characteristic size of drainage
100 m. Photo by J. Kirchner. basins. One of the earliest was a suggestion by Davis
[1892], in response to observations by Gilbert [1877], that
the morphologic transition from concave-down topographic
fact that topography is dynamic and subject to disturbance, profiles near drainage divides to concave-up profiles further
implies that the ridge-valley wavelength must emerge from downslope corresponds to a transition from erosion domi-
the processes that shape landforms by eroding, transporting nated by soil creep to erosion dominated by overland flow.
and depositing sediment. This suggestion was developed further by Gilbert [1909].
[5] Like other prominent patterns in the physical scien- Later studies quantified the idea that a transition in process
ces, such as crystal lattices or instabilities that arise at fluid dominance might control the extent of valley incision, and
interfaces, spatial periodicities in landscapes must contain ultimately showed that erosional features with a finite,
fundamental information about the material properties and uniform spacing can emerge from a competition between
Figure 2. Shaded relief map of a portion of the Gabilan Mesa, California, at approximately 35.9°N,
120.8°W. The tributary valleys that drain into the NE-SW trending canyons show a remarkably uniform
spacing. The topographic data, with a horizontal resolution of 1 m, were collected and processed by the
National Center for Airborne Laser Mapping (NCALM, http://www.ncalm.org). The Salinas River and
U.S. Highway 101 are visible to the southwest.
2 of 21F04016 PERRON ET AL.: VALLEY SPACING F04016
spacing. Izumi and Parker [1995] showed that the inclusion
of a free water surface (which was not a feature of the
kinematic flow approximation of Smith and Bretherton
[1972]) creates backwater effects and Reynolds stresses that
prevent the formation of an infinitely narrow, infinitely deep
flow, an effect that was anticipated, but not explored, by
Smith and Bretherton [1972] and Loewenherz [1991].
Several related studies have investigated rill formation by
free-surface flows both analytically [Loewenherz-Lawrence,
1994; Izumi and Parker, 2000] and numerically [Smith and
Merchant, 1995; Smith et al., 1997a, 1997b]. Dunne [1980]
and Dunne and Aubry [1986] noted, however, that slope-
dependent transport mechanisms such as rain splash do
Figure 3. Detail of Mars Orbiter Camera image R0502476 influence the development of subaerial topography, and
showing evenly spaced erosional features incised into a could be a significant factor restricting the growth of
debris slope at the edge of a depression near 70.7°S, incipient, short-wavelength erosional channels, as originally
355.7°W. Image width is approximately 6.5 km. The rim of suggested by Smith and Bretherton [1972].
the depression is toward the top of the image; the floor is [9] These studies provide fundamental insight into land-
toward the bottom. Valleys, channels, and depositional fans scape evolution by demonstrating that erosional features
appear to have been created by repeated debris flows [Malin with a characteristic size can emerge from the dynamics of
and Edgett, 2000]. The convex profiles of the intervening physical transport mechanisms, including interactions be-
ridges may be a signature of slope-dependent creep driven tween advective (flux- and slope-dependent) and diffusive
by cyclical deposition and sublimation of ground ice (slope-dependent) processes. Yet their results cannot be used
[Perron et al., 2003]. Image courtesy of NASA/JPL/MSSS. to predict the characteristic scales that emerge through the
long-term evolution of landforms at scales of 102 – 104 m, like
those shown in Figure 2, for three main reasons. First, to
make the problem analytically tractable, most of these
sediment transport processes that amplify perturbations in a studies have considered small perturbations superimposed
topographic surface and processes that damp the perturba- on a background topography (often an inclined plane) that
tions. Kirkby [1971] used a one-dimensional model to show does not change. In real landscapes, the erosion of valleys
that transport laws describing creep processes generate with finite amplitude alters the topography, which feeds
concave-down topographic profiles, whereas laws describ- back into the rate and spatial pattern of erosion. Second,
ing erosion by channelized flow create concave-up profiles. because most of these studies have examined the develop-
He noted that these characteristic forms are independent of ment of incipient erosional features rather than the emer-
initial conditions, and that the combined influence of these gence of finite amplitude landforms, the quantities of
processes should create profiles that are concave-down near interest, such as rill spacing, are time-dependent, as intuited
drainage divides and concave up near the toe of the slope. by Izumi and Parker [1995] and shown numerically by
Kirkby also emphasized the importance of two-dimensional Smith and Merchant [1995] and Smith et al. [1997b]. Third,
topographic convergence or divergence, and its effect on these studies investigated the case in which an erodible
water and sediment fluxes, in the evolution of drainage surface is entirely submerged beneath a shallow flow, and so
basins. their mathematical treatment of the problem is not directly
[7] This latter topic was explored in considerable detail applicable to landscapes in which erosion occurs by open
by Smith and Bretherton [1972] in a study of the incipient channel flow. Thus, despite a considerable body of work
development of erosional rills. Smith and Bretherton ana- that has built upon the hypothesis of Davis [1892] and
lyzed the stability of an erodible surface under a sheet of Gilbert [1909], it is unclear whether a competition between
flowing water, and found that if the sediment flux at a given advective and diffusive processes is sufficient to explain the
location depends on the flux of water and the topographic scale and spacing of natural drainage basins.
gradient, a surface with a concave-up longitudinal profile is [10] An alternative explanation for the characteristic size
unstable with respect to lateral perturbations in the flow, and of first-order drainage basins is that of Horton [1945], who
will inevitably develop erosional channels. Their analysis proposed that the extent of erosional landscape dissection is
does not predict a finite rill spacing, because the shortest- limited by a threshold for erosion by overland flow, such as
wavelength instabilities grow fastest, but they posited that a minimum shear stress that must be exceeded to overcome
introducing a diffusion-like transport term, which describes the cohesion of the soil surface, or a minimum contributing
a process in which sediment flux is proportional to the area required to outpace infiltration and generate surface
topographic gradient only, would damp the growth of short- runoff. Horton argued that this results in a ‘‘belt of no
wavelength instabilities and select for an intermediate erosion,’’ a region lying within a ‘‘critical distance’’ of
wavelength. Loewenherz [1991] confirmed this in a general drainage divides in which surface runoff is insufficient to
sense by adding an artificial smoothing function and dem- cause erosion, that defines the spatial scale at which hill-
onstrating that intermediate wavelengths do indeed grow slopes end and valleys begin. He intended for the belt of no
fastest. erosion to be taken literally, meaning that no erosion
[8] Others pointed out that neither slope-dependent trans- whatsoever occurred in the absence of overland flow
port nor artificial diffusion is necessary to explain finite rill transport. Although it is now understood that overland flow
3 of 21F04016 PERRON ET AL.: VALLEY SPACING F04016
is just one of several mechanisms that can act on slopes, specify their overall size or spacing. Drainage density
subsequent studies have found empirical support for the provides a spatially averaged measure of the concentration
existence of a runoff or erosion threshold that influences the of valleys, but it does not uniquely specify their spatial
location where a stream channel begins [Montgomery and arrangement. Thus, predictions of drainage density and
Dietrich, 1988, 1989, 1992; Reid, 1989; Dietrich et al., source area cannot directly predict valley spacing, and the
1992, 1993; Dietrich and Dunne, 1993; Prosser and relative influence of erosion thresholds and process compe-
Dietrich, 1995], and some of these studies propose that tition on valley spacing must be evaluated independently.
the observed transition from hillslope to valley morphol- Recent studies have begun to advance toward this goal
ogy is controlled by the magnitude of the threshold [Simpson and Schlunegger, 2003], but there presently is no
[Montgomery and Dietrich, 1988, 1989, 1992; Dietrich widely accepted framework for predicting the characteristic
et al., 1992]. As Dunne [1980] and Kirkby [1993] note, spacing of ridges and valleys in natural landscapes.
the process competition of Davis [1892] and Gilbert [13] This paper has three goals: (1) to determine how
[1909] and the erosion threshold of Horton [1945] are uniform valley spacing, one of the most salient character-
not mutually exclusive mechanisms, and both are likely to istics of ridge-and-valley topography, emerges as a land-
exert a partial control on valley morphology in many scape evolves from an initial condition toward a
landscapes. But the relative importance of the two mech- topographic equilibrium; (2) to evaluate the relative impor-
anisms in controlling valley spacing is unknown. tance of the two hypothesized controls on the scale and
[11] Numerical models of landscape evolution have made spacing of valleys (process competition versus erosion
it possible to investigate the transient development and threshold); and (3) to identify quantitative relationships
equilibrium form of topography that develops under the between first-order landscape properties, including valley
combined influence of hillslope and fluvial processes. First- spacing, and the rates of the erosion and transport processes
order drainage basins with a characteristic size do emerge in that shape the landscape. We begin by presenting a numer-
many of these models [e.g., Ahnert, 1976, 1987; Kirkby, ical landscape evolution model based on a widely used
1986; Willgoose et al., 1991b; Tarboton et al., 1992; equation that incorporates a competition between advective
Howard, 1994a; Tucker and Bras, 1998], and a number of erosion and diffusive transport, as well as an erosion
studies have shown that such characteristic scales vary threshold. We then use dimensional analysis to derive
systematically with the rates of the dominant erosion and hypothesized scaling relationships between valley spacing
transport processes. Some of these studies have focused on and the terms in the governing equation. Finally, we
the scale at which hillslopes transition into valleys. Kirkby conduct a set of numerical experiments that investigates
[1987] used a numerical model to investigate controls on the proposed scaling relationships, and use the results of
hillslope length for a more general set of process laws than these experiments to evaluate the relative importance of the
those discussed by Smith and Bretherton [1972], including process competition and the stream incision threshold in
landsliding. A widely recognized morphologic signature of controlling valley spacing and relief. We conclude by
the hillslope-valley transition is the upslope contributing relating our scaling law to previously proposed expressions
area at which the topographic slope reaches its steepest for the characteristic area of the hillslope-valley transition.
point, and then begins to grow gentler with increasing
contributing area [Tarboton et al., 1989, 1992; Willgoose 2. Landscape Evolution Model
et al., 1991d, 1992; Willgoose, 1994b; Howard, 1994a].
2.1. Governing Equation
Tarboton et al. [1992] related this characteristic area, which
is generally thought to correspond to the inflection between [14] The derivation of the governing equation closely
a concave-down hillslope and a concave-up valley, to the follows that of Howard [1994a, 1997, 1999] and Tucker
transition in landform stability discussed by Smith and and Slingerland [1996, 1997]. For a sediment-mantled
Bretherton [1972]. Several authors have shown that numer- topographic surface with elevation z(x, y) measured relative
ical models reproduce this slope-area transition, and have to a fixed base level, conservation of mass requires that
proposed expressions for the characteristic area based on the
model equations [Willgoose et al., 1991d; Howard, 1994a, @z
rs þ r qs ¼ rr U ; ð1Þ
1997; Moglen et al., 1998; Tucker and Bras, 1998]. A @t
quantity closely related to the slope-area transition is
drainage density, defined as the total length of channels where t is time, rs and rr are the bulk densities of sediment
per unit area of the landscape. Several studies have used and rock, qs is the volume flux of transportable sediment per
numerical landscape evolution models to systematically unit width of the land surface, and U is the rate of change of
investigate variations in drainage density in response to bedrock elevation relative to base level. Equation (1)
different process rates and laws, including erosion thresh- assumes that the conversion of bedrock to soil keeps pace
olds and the competition between advective and diffusive with erosion, such that no bedrock outcrops occur.
processes [Willgoose et al., 1991d; Howard, 1997; Moglen [15] The total sediment flux, qs, results from fluxes
et al., 1998; Tucker and Bras, 1998]. associated with overland or channelized flow of water, qc,
[12] There are, however, important differences between and mass movement of sediment, qm [Dietrich et al., 2003].
the characteristic scales explored by this body of previous If we express the total flux as a sum of these components,
work and the characteristic spacing of ridges and valleys. then
The slope-area transition is correlated with the spatial scale
at which first-order valleys begin, but it does not uniquely r qs ¼ r qm þ r qc : ð2Þ
4 of 21F04016 PERRON ET AL.: VALLEY SPACING F04016
Mass movement of sediment can result from a variety of where rw is the density of water, R is the hydraulic radius,
processes, ranging from landsliding to grain-scale transport and S is the water surface slope. The flow velocity u is given
by rain splash. In soil-mantled landscapes with moderate by the Manning equation,
topographic gradients, the dominant process is creep, which
is driven by dilational disturbance of granular sediment due 1 2 1
to processes such as bioturbation, frost heaving, and u¼ R3 S 2 ; ð7Þ
N
wetting/drying. Creep is hypothesized to occur by slope-
normal dilation and subsequent vertical settling, with a
resultant time-averaged downslope flux that is proportional where N is an empirical roughness factor. Continuity of the
(but opposite in sign) to the topographic gradient [Culling, flow requires that
1960, 1963, 1965]:
qm ¼ Drz : ð3Þ Qw ¼ k2 Rwu ; ð8Þ
The proportionality constant D has the units of a diffusivity
(L2 T1). Numerous field studies have provided evidence where Qw is the volume flux of water through the channel
based on morphology [e.g., Nash, 1980; Hanks et al., 1984; cross section, w is the channel width, and k2 is a form factor
Rosenbloom and Anderson, 1994] and cosmogenic nuclide that approaches one as the width-to-depth ratio of the
mass balance [Monaghan et al., 1992; McKean et al., 1993; channel increases. Substituting equation (7) into equation (8)
Small et al., 1999] that supports the applicability of and solving for R gives
equation (3) in a range of climatic settings [Fernandes
and Dietrich, 1997]. In steep topography, there is evidence 35
NQw
that qm increases nonlinearly as the topographic gradient R¼ 1 : ð9Þ
k2 wS 2
approaches a limiting value of order unity; however, at
gradients ]0.4, the difference between the linear model and
the nonlinear model is small [Roering et al., 1999, 2001a, To express R in terms of the topography, we assume that the
2001b, 2007]. The model presented here is intended to water surface slope is the same as the local topographic
simulate landscapes in which hillslope gradients are low to slope (S = jrzj) and include the empirical relationships
moderate and slope failure is insignificant, such that [Leopold and Maddock, 1953; Knighton, 1998]
equation (3) is an adequate description of soil mass
transport rates. Qw ¼ k3 Aa ð10Þ
[16] The effects of surface water flow include detachment
of material from the land surface and transport of this
detached material. Here we assume that the transport rate and
is limited by the rate of detachment and sediment entrain-
ment rather than by the transport capacity, a condition often w ¼ k4 Qbw ; ð11Þ
referred to as ‘‘supply limited’’ [Carson and Kirkby, 1972]
or ‘‘detachment-limited’’ [Howard, 1994b; Howard et al., where k3, k4, a and b are constants, and A is the horizontal
1994] incision. We further assume that most fluvial erosion area of the landscape that drains to the point at which Qw
occurs during storms that produce flows capable of trans- and w are measured. We assume that all flow is concentrated
porting all eroded material over a distance longer than the into channels with widths given by equation (11). The
model domain, such that no redeposition of fluvially eroded application of equation (11) to small contributing areas and
sediment occurs. Under these conditions, the divergence of discharges has some support from field observation and
fluvial sediment flux is equal to the detachment rate, e experiments [e.g., Parsons and Abrahams, 1992; Parsons et
[Howard, 1994a], al., 1994; Abrahams et al., 1994]. Combining equations (6),
r qc ¼ e : ð4Þ (9), (10) and (11) to obtain an expression for t and
substituting into equation (5) yields
It is often assumed, following the observations of Howard
and Kerby [1983], that detachment-limited incision rates are " 35 #
directly proportional to the shear stress, t, exerted by the Nk31b 3 7
e ¼ k1 rw g A 5að1bÞ jrzj t c :
10 ð12Þ
flow on the bed and banks of a channel, and that cohesion of k2 k4
the bed material may lead to a threshold shear stress, t c, that
must be exceeded for erosion to occur. That is,
[17] Taken together, equations (2), (3), (4), and (12) give
8
< k1 ðt t c Þ t > t c an expression for the total sediment flux divergence, r qs,
e¼ ; ð5Þ in equation (1). Solving equation (1) for the time derivative
: and defining E = rrr U (such that E is a rate of change of land
0 t tc s
surface elevation relative to base level) yields a single
with k1 an empirical constant that gives the time-averaged equation for the time evolution of the topography:
detachment rate. The bed shear stress for steady, uniform,
open channel flow is @z
¼ Dr2 z K ðAm jrzjn qc Þ þ E ; ð13Þ
@t
t ¼ rw gRS ; ð6Þ
5 of 21F04016 PERRON ET AL.: VALLEY SPACING F04016
with dependence: as the topography evolves, changes in A can
feed back strongly into valley incision. As indicated in
3=5 equation (5), this term can only cause erosion. The third
Nk31b term is a source term that drives the evolution of the
K ¼ k1 rw rs g ;
k2 k4 topography: without differential uplift relative to a bound-
k1 rs ary, derivatives of elevation, and therefore the other two
qc ¼ tc;
K terms on the right-hand side of equation (13), will tend
3
m ¼ að1 bÞ; toward zero as the topography diffuses away to form a
5
7 featureless, level plain.
n¼ :
10 2.2. Numerical Method
[20] As mentioned in section 1, analytic approaches to
The hypothesis that e is proportional to the rate of energy systems like equation (13) [Smith and Bretherton, 1972;
expenditure of the flow, or ‘‘stream power’’ [Seidl and Smith and Merchant, 1995; Smith et al., 1997a, 1997b;
Dietrich, 1992; Seidl et al., 1994], leads to an equation with Loewenherz, 1991; Loewenherz-Lawrence, 1994; Izumi and
the same form as equation (13), but with n = 1 and a factor Parker, 2000] have mainly focused on small perturbations
of 5/3 increase in m. These values of n, both of which are in a topographic surface, such as the development of
used in this study, should be considered approximate incipient channels, for which the governing equations can
inasmuch as the Manning equation is empirically derived, be linearized. Here, in contrast, we are interested in the
though there is some theoretical support for its form [Gioia finite amplitude ridge-and-valley topography that emerges
and Bombardelli, 2002]. as a landscape evolves beyond its initial state toward an
[18] Two points about the use of equation (13) to inves- equilibrium. The strong nonlinearities in equation (13) make
tigate hypothesized mechanisms for producing uniform an analytic solution for the equilibrium topography intrac-
valley spacing deserve brief explanations. First, an assump- table, and so, like several previous studies [e.g., Willgoose
tion implicit in equation (13) is that both diffusion-like et al., 1991b, 1991c; Howard, 1994a; Tucker and Bras,
transport and channelized fluvial erosion may occur 1998], we solve equation (13) numerically.
throughout the landscape. This common assumption [e.g., [21] Our numerical approach differs from many pre-
Howard, 1994a; Willgoose, 1994b; Tucker and Bras, 1998] vious landscape evolution models in that it solves a
is appropriate for a landscape in which channelized flow is single governing equation (equation (13)) over the entire
pervasive, but conversion of bedrock to erodible sediment spatial domain simultaneously, rather than separately
keeps pace with surface erosion, including in channels. This evaluating each individual term describing an erosion
condition limits the range of landscapes to which the model or transport process and routing sediment explicitly
applies, but permits a clearer understanding of how the across the landscape.
competing terms in the governing equation influence valley 2.2.1. Finite Difference Scheme
spacing. Second, because the model does not explicitly [ 2 2 ] We calculate finite difference solutions to
include runoff generation, we do not distinguish between equation (13) on a rectangular grid zi,j with grid spacings
the two mechanisms that can contribute to a threshold for Dx and Dy and dimensions Nx Ny, such that
fluvial incision: topographic thresholds for runoff produc-
tion [e.g., Kirkby, 1980; Dietrich et al., 1992; Dietrich and
Dunne, 1993], and mechanical strength of the land surface zi;j ¼ z xi ; yj ; ð14aÞ
[e.g., Reid, 1989; Prosser and Dietrich, 1995]. We param-
eterize these effects in terms of a single threshold that limits
the spatial extent and magnitude of fluvial incision, qc, with xi ¼ iDx; ð14bÞ
the understanding that both material strength and the spatial
pattern of runoff production can influence this threshold.
[19] Equation (13) is a nonlinear advection-diffusion
yj ¼ jDy; ð14cÞ
equation in which the quantity being advected and diffused
is elevation. The first term on the right-hand side is a linear
diffusion term, which tends to smooth perturbations in a
topographic surface. Depending on the sign of the Laplacian i ¼ 0; 1; 2; . . . Nx 1; ð14dÞ
of elevation, r2z, this term can lead to either a decrease in
elevation with time (erosion) or an increase (deposition).
The second term is a nonlinear kinematic wave term that
causes differences in elevation to propagate across the j ¼ 0; 1; 2 . . . Ny 1 : ð14eÞ
landscape in the direction of the topographic gradient
vector, rz [Luke, 1972, 1974, 1976]. Because it includes
A, the upslope contributing area, this term tends to amplify In discrete form, equation (13) can be written as
perturbations in the topography. The kinematic wave term is
nonlinear because n may differ from unity, and also because Dz ¼ Dt ½Fð zÞ þ Yð zÞ ; ð15Þ
A is a function of both position and time with nonlocal
6 of 21F04016 PERRON ET AL.: VALLEY SPACING F04016
with ods based on multiple flow directions produce persistently
migrating drainage networks like those observed in some
ziþ1;j 2zi;j þ zi1;j zi;jþ1 2zi;j þ zi;j1
Fð zÞ ¼ D 2
þ ; physical experiments [Hasbargen and Paola, 2000]. In
Dy2
"Dx pffiffiffiffiffiffiffiffiffiffiffiffiffiffiffiffiffiffi pffiffiffiffiffiffiffiffiffiffiffiffiffiffiffiffiffi
ffi!n # contrast, we find that a flow routing method in which flow
wi;j m s1 2 þ s2 2 þ s3 2 þ s4 2 directions are not restricted to discrete increments can
Yð zÞ ¼ E K Ai;j qc ;
d 2 generate deterministic numerical solutions with stable drain-
ziþ1;j zi1;j age divides (see section 5.1), a result also obtained by
s1 ¼ ;
2Dx Moglen and Bras [1995]. One possible explanation for this
zi;jþ1 zi;j1 difference is that Pelletier [2004] uses a limiting slope
s2 ¼ ;
2Dy gradient to account for hillslope processes, which episodi-
ziþ1;j1 zi1;jþ1 cally introduces localized changes in elevation that can
s3 ¼ pffiffiffiffiffiffiffiffiffiffiffiffiffiffiffiffiffiffiffiffiffiffi ;
2 Dx2 þ Dy2 significantly alter flow directions. It has previously been
ziþ1;jþ1 zi1;j1 shown that such stochastic effects can cause persistent
s4 ¼ pffiffiffiffiffiffiffiffiffiffiffiffiffiffiffiffiffiffiffiffiffiffi :
2 Dx2 þ Dy2 drainage migration in numerical models that incorporate
landsliding [Densmore et al., 1998]. We have also found
[23] The factor wi,j/d in equation (15) (where d is the grid that the inclusion of a threshold (qc > 0) can make the
spacing; in the present study, d = Dx = Dy in all cases), a criterion for reaching a deterministic equilibrium more
modification due to Howard [1994a], accounts for the fact restrictive than the criterion for stability of the numerical
that stream channels have a finite width (equation (11)) that scheme (equation (17)); that is, smaller time steps may be
is narrower than the grid spacing. Neglecting this factor required. It is possible that real geomorphic thresholds
would assume implicitly that channels have a width d, and produce persistently migrating drainage networks in nature,
the model solutions would then be resolution-dependent. In but this does not appear to be an inevitable consequence of
this study, we assume for simplicity that k4 = 1 m and b = 0 the flow routing method.
in equation (11), noting that future studies intending to [26] Equation (15) consists of a linear operator (F) and a
apply this model to a specific field site will need to calibrate nonlinear operator (Y). To solve it forward in time, we use a
the channel width function. The values of k4 and b do affect splitting method that evaluates these operators in separate
the form of the model topography, but using typical mea- fractional steps:
sured values that lead to spatially variable channel width
would not qualitatively change the results presented here. Dz* ¼ DtYðzk Þ; ð16aÞ
[24] The algorithm used to evaluate the drainage area
function Ai,j is of critical importance. Not all drainage area
algorithms are faithful descriptions of both convergent and
1 Dz* Dt k
divergent flow, and thus not all algorithms are well suited to zkþ2 ¼ zk þ þ Y z þ Dz* ; ð16bÞ
modeling interactions between topographically convergent 2 2
valleys and topographically divergent hillslopes. The steep-
est descent or D8 algorithm [O’Callaghan and Mark, 1984]
1 Dt kþ1
routes flow to only one of a point’s eight neighboring zkþ1 ¼ zkþ2 þ F z þ Fðzk Þ ; ð16cÞ
2
points, and is therefore incapable of producing divergent
flow. This method is well suited to modeling channelized where k denotes the time step. The first fractional step (16a)
flow along a valley axis, but tends to artificially enhance and (16b) is a second-order Runge-Kutta scheme. The
fluvial incision rates on divergent hillslopes by producing second fractional step (16c) is a Crank-Nicolson scheme,
linear flow accumulation paths where flow should actually which we evaluate with an alternating direction implicit
diverge [Tarboton, 1997]. Yet there are also situations in (ADI) method [Press et al., 1992]. The combination of the
which steepest-descent flow routing inhibits convergent two steps is accurate to second order in space and time. The
flow, such as the incision of incipient valleys in a nearly Crank-Nicolson step used to evaluate the diffusion term is
planar surface, because subtle changes in the topography are unconditionally stable, and so the stability of the entire
not sufficient to cause an increment of 45° in the drainage method is governed by that of the wave term. In general, the
direction [Willgoose, 2005]. Multiple flow direction algo- stability of explicit solutions to wave equations is subject to
rithms [e.g., Freeman, 1991; Quinn et al., 1991], which the Courant-Friedrichs-Lewy (CFL) stability criterion,
distribute flow to all downslope neighbors in proportion to which for the nonlinear wave term in equation (13) is
slope, perform well in divergent topography but inhibit
convergent flow [Tarboton, 1997], which artificially retards pffiffiffi m
valley incision. In response to these shortcomings, methods 2KA jrzjn1 Dt
1: ð17Þ
have been proposed that allow both convergent and divergent d
flow and do not restrict drainage directions to 45° increments
[e.g., Costa-Cabral and Burges, 1994; Tarboton, 1997]. The For each model run, we specify K, m, and d, and select a
most efficient of these is the D1 algorithm of Tarboton value of Dt that satisfies equation (17) over the entire grid
[1997], which we use to evaluate Ai,j. for the duration of the run.
[25] Pelletier [2004] has proposed that ‘‘static’’ equilib- 2.2.2. Spatial Domain, Initial Conditions,
rium solutions to drainage area-dependent landscape evolu- and Boundary Conditions
tion models, in which @z/@t = 0 for all (x, y), are an artifact [27] The rectangular grid is intended to simulate a ridge-
of steepest descent flow routing, whereas numerical meth- line bounded on two sides (y boundaries) by stream chan-
7 of 21F04016 PERRON ET AL.: VALLEY SPACING F04016
1 m d 16 m: regression of l and z against log10d 2
yields lines with slopes that are not significantly differ-
ent from zero (Figure 5b).
3. Dimensional Analysis
[31] To understand how the terms in equation (13) control
the model topography, we adopt an approach based on
dimensional analysis. Many previous studies have discussed
morphometric scaling relationships between the dimensions
of existing landforms [e.g., Leopold and Maddock, 1953;
Hack, 1957; Melton, 1958; Strahler, 1958; Shreve, 1967;
Bull, 1975; Church and Mark, 1980]. A smaller number
have considered dynamic scaling relationships among the
Figure 4. Illustration of the model domain and the three physical processes that drive long-term landscape evolution
length scales used to measure the topography: l, the [Strahler, 1958, 1964; Smith and Bretherton, 1972; Smith et
spacing between adjacent valleys; ‘, the horizontal basin al., 1997a; Church and Mark, 1980; Willgoose et al., 1991a,
length, which is equal to the distance from the central divide 1991c; Willgoose, 1994a; Syvitski and Morehead, 1999;
to the y boundaries; and z, the elevation of the central divide Whipple and Tucker, 1999; Tucker and Whipple, 2002;
above the y boundaries. Simpson and Schlunegger, 2003].
[32] The properties of a topographic surface that is a
solution to equation (13), including the spacing between
nels (Figure 4). The assumption of detachment-limited adjacent valleys, l, and the overall relief, z (Figure 4),
conditions implies that these streams are capable of trans- should depend on the relative magnitudes of the three terms
porting all sediment delivered to them. The incision rate of on the right-hand side, which can be compared by making
the bounding stream channels is equal to the rate of surface equation (13) dimensionless. Using z as a characteristic
uplift, such that @z
@t jj = 0,Ny 1 = 0. This boundary condition is vertical length scale and defining ‘ as a characteristic
specified numerically by setting
r2 zj¼0;Ny 1 ¼ 0; ð18aÞ
rzjj¼0;Ny 1 ¼ 0; ð18bÞ
Ejj¼0;Ny 1 ¼ 0 : ð18cÞ
The x boundaries of the grid are periodic, such that the
model ridgeline extends infinitely in the x direction and has
topography that repeats with a period of NxDx. The
parameters D, K, E, m, n and qc are uniform in space and
time.
[28] The initial condition consists of a low-relief (1 m),
pseudofractal surface generated by taking the inverse Four-
ier transform of a two-dimensional, red noise power spec-
trum. The y boundaries of this surface are levelled to
prevent the outlets of stream channels from becoming fixed
to certain locations. The iteration proceeds forward in time
until Dzi,j/Dt = 0 (to within machine precision) for all i, j.
Figure 5. (a) Mean valley spacing, l, and relief, z, for
2.3. Resolution Tests different time resolutions. All solutions were computed
[29] To test the sensitivity of model solutions to the from the same initial surface. The variables l and z are
spatial and temporal resolutions, we performed two sets of identical for all values of Dt. (b) Mean valley spacing and
runs: one in which only Dt was varied, and a second in relief for different spatial resolutions. Because the grid is
which only d was varied. Model runs using the same initial two-dimensional, the spatial resolution is proportional to d 2.
condition produced identical equilibrium solutions for Because of differing grid dimensions at different spatial
10 years Dt 1000 years (Figure 5a). resolutions, each simulation used a different (but statisti-
[30] When varying d, it was not possible to use the same cally identical) initial condition. 2s error bars (which are
initial condition for all runs because the dimensions of the smaller than the symbols for z) show the resulting
grid varied. There is consequently some variability in the variability among the solutions. The slopes of regression
solutions for a given d (as indicated by the error bars in lines through the two data sets are not significantly different
Figure 5b), but the results are, on average, the same for from zero (P = 0.57 for l, P = 0.29 for z).
8 of 21F04016 PERRON ET AL.: VALLEY SPACING F04016
horizontal length scale, the dimensionless form of and the extent of the landscape over which stream incision
equation (13) is can act. The reduction in the stream incision term will lead
to steeper topography, however, which will feed back into
@z0 both the hillslope and fluvial terms [Howard, 1994a]. The
¼ D0 r02 z0 ðK 0 A0m jr0 z0 jn q0 Þ þ 1 ð19Þ net effect on valley spacing is not obvious, nor is the relative
@t 0
importance of the two mechanisms by which the threshold
with should influence erosion: reducing the rate of stream inci-
sion versus limiting its spatial extent.
z tE A [36] By analogy to a linear advection-diffusion system,
z0 ¼ ; t 0 ¼ ; r0 ¼ r‘; A0 ¼ 2
z z ‘ we might additionally expect that it is possible to charac-
Dz K‘2mn z n Kqc terize the system with a single dimensionless quantity that
D0 ¼ 2 ; K 0 ¼ ; q0 ¼ : gives the relative magnitudes of the advection and diffusion
E‘ E E
terms, a quantity similar to a Péclet number, Pe:
We take the length scale ‘ to be the horizontal length of a
drainage basin. Because the topographic divide is always K 0 q0 K ‘2ðmþ1Þn qc ‘2
close to the centerline of the grid in the y direction, as Pe ¼ ¼ : ð20Þ
D0 D z 1n z
shown in Figure 4, drainage basin lengths are generally
constrained to be close to one half of the y dimension of the For qc = 0, equation (20) reduces to
grid (‘ = Nyd/2). We can then define a dimensionless valley
spacing, l0 = l/‘, which is the width-to-length ratio of a
K‘2ðmþ1Þn
drainage basin, and a dimensionless relief, z 0 = z/‘, which is Pe ¼ ; ð21Þ
the mean slope of the topography in the y direction. Dz 1n
[33] The dimensionless quantities that contain informa-
tion about geomorphic process rates are D0, K0 and q0. q0 which is the ratio of a diffusion timescale to an advection
describes the magnitude of the erosion threshold relative to timescale, and is therefore directly analogous to a Péclet
the total erosion rate. The other two quantities can be number in a linear system. Quantities that are conceptually
understood in terms of three characteristic timescales: the similar, but differ in form, have been derived for transport-
time required to erode once through the relief is z/E; the limited conditions by Willgoose et al. [1991c] and Simpson
diffusion time for a feature of size ‘ is ‘2/D; and the time and Schlunegger [2003].
required for a wave in the topography (such as a knickpoint) [37] Beyond these general expectations, the forms and
with celerity K‘2m (z/‘)n1 to travel a distance ‘ is ‘n2m relative importance of the hypothesized scaling relation-
z 1n/K. Thus, D0 is the ratio of the erosion timescale to the ships are not apparent, particularly because the scaling
diffusion timescale, and K0 is the ratio of the erosion parameters depend on relief, z, which is not known a priori.
timescale to the advection timescale. Nor is it clear how quasiperiodic ridge-and-valley topogra-
[34] Previous studies have shown that first-order charac- phy emerges as a landscape develops. We conducted a set of
teristics of the topography such as relief and drainage numerical experiments designed to validate the dimensional
density vary systematically with parameters in the govern- analysis approach, test for and quantify the hypothesized
ing equation [e.g., Kirkby, 1987; Willgoose et al., 1991c; scaling relationships, and investigate the development of
Howard, 1994a, 1997; Moglen et al., 1998; Tucker and quasiperiodic valley spacing with time.
Bras, 1998], and so it is reasonable to expect that l0 will
scale with D0, K0, and q0. Although the relationships govern- 4. Numerical Experiments
ing valley spacing may not have the same form as those
[38] The numerical experiments fall into four categories:
governing other measures of landscape scale, these previous
studies do help us to intuit the signs of some of these 4.1. Time-Dependent Behavior
relationships. l0 should be positively correlated with D0: [39] To investigate the time evolution of the landscape,
higher rates of diffusive sediment transport should lead to including the development of uniformly spaced valleys and
wider valley spacing, because the smoothing effect of the approach to a topographic steady state, we performed a
diffusive transport inhibits valley incision, and because number of model runs in which we recorded and analyzed
hillslope processes can account for a larger fraction of the the topography at each time step.
total erosion rate. l0 should be negatively correlated with K0:
a greater potential for stream incision should lead to 4.2. Validation of Dimensionless Quantities
narrower valley spacing, because less drainage area is [40] If the dimensionless numbers in equation (19) ade-
required to erode the land surface at a given rate. quately predict the behavior of the dimensional governing
[35] Although numerous studies have shown that an equation (equation (13)), then the model parameters should
erosion threshold can have a significant effect on river influence the model topography only if they affect the
longitudinal profiles [e.g., Snyder et al. 2003] and the dimensionless ratios. That is, if individual parameters (D,
overall form of a landscape [e.g., Willgoose et al., K, E, etc.) change in such a way that the dimensionless
1991c; Howard, 1994a; Rinaldo et al., 1995; Tucker and ratios do not, the basic properties of the model topography
Slingerland, 1997], the sign of the relationship between l0 should remain the same. This is, in part, a test of whether
and q0 is difficult to predict. One might expect that a higher the horizontal and vertical length scales we have chosen to
threshold for stream incision would widen valley spacing, characterize the landscape (‘ and z, Figure 4) are appropri-
because the threshold limits both the rate of stream incision ate. We calculated model solutions for three different
9 of 21F04016 PERRON ET AL.: VALLEY SPACING F04016
Table 1. Model Parameters Used to Obtain the Solutions Displayed in Figures 1 – 14
Figure Nx Ny d (m) Dt (years) tfinal (Ma) E (mm a1) D (m2 a1) K (105 m12m a1) m n qc (m2m)
5a 200 100 5 10 – 1000 3.00 0.05 0.005 0.1 1 1 0
5b 200 100 1 – 16 200 3.00 0.05 0.005 0.1 1 1 0
6, 7 250 100 5 500 6.00 0.05 0.005 0.1 1 1 0
8a 300 100 5 500 2.45 0.1 0.01 35 0.3 0.7 0
8b 300 100 5 500 1.18 0.2 0.02 70 0.3 0.7 0
8c 300 100 10 500 3.05 0.1 0.02 23 0.3 0.7 0
9a 200 100 5 500 3.00 0.01 0.005 0.1 1 1 0
9b 200 100 5 500 3.00 0.05 0.005 0.1 1 1 0
9c 200 100 5 500 3.00 0.1 0.005 0.1 1 1 0
10, 11 300 – 600 100 5 500 3 0.1 0.005 – 0.02 15 – 200 0.3 0.7 0
12 300 100 5 500 3 0.1 0.013 40, 60, 107, 151 0.3 0.7 0
13 300 – 600 100 5 500 4 0.1 0.013 70 0.3 0.7 0 – 7.4
combinations of D, K, E, and ‘ that yield the same values of corresponding to the ridge-valley wavelength was calculat-
D0 and K0. For each of the three combinations, we performed ed as the average of the peak frequencies, weighted by the
ten model runs starting from different initial conditions, spectral power of the peaks.
measured the mean valley spacing, and compared it with the [45] The periodic boundary condition in the x direction
valley spacing predicted by the other two combinations. constrains the number of valleys on either side of the divide
to be an integer, and thus the modeled valley spacing is
4.3. Influence of Competition Between Advection ‘‘quantized’’ to some extent. To reduce this effect, we used
and Diffusion grids with Nx/Ny 2 in all cases, and Nx/Ny 3 in most
[41] The relative magnitudes of the diffusion and advec- cases where our goal was to identify variations in l.
tion terms in equation (13) reflect the transition in process
dominance from hillslopes to valleys described by Davis
[1892] and Gilbert [1909] and explored by numerous
5. Results
subsequent studies. To understand how this transition 5.1. Time-Dependent Behavior
affects the valley spacing, we computed solutions for a [46] The time evolution of the model topography pro-
range of D0 and K0 values, while holding q0 = 0. vides some insight into the mechanisms by which quasi-
periodic ridges and valleys develop. Figure 6 shows
4.4. Influence of Erosion Threshold snapshots of the evolving topography over the course of a
[42] To explore the hypothesis that the spacing of valleys model run. As the rough, approximately planar initial
is controlled by a threshold for stream incision, we con- surface (t = 0) is uplifted relative to the second-order
ducted a set of runs in which q0 was varied while holding D0 streams at the y boundaries, incipient valleys propagate
and K0 constant. from the y boundaries into the interior of the grid (t =
0.25 Ma). The relief of the landscape increases, and the
4.5. Parameters and Measurements centerline of the grid in the y direction becomes a drainage
[43] The parameters used to obtain all model solutions are divide, with the valleys on either side generally draining
listed in Table 1. With the exception of the time-dependent toward the nearest point on the y boundary. The spacing
behavior discussed in section 5.1, all reported results are between these incipient valleys is narrow on average, and
steady state solutions (@z/@t = 0 for all (x, y)). relatively aperiodic. Valleys that initially capture larger
[44] We measured the relief, z, in each model solution as drainage areas (and therefore have larger water discharge)
the mean elevation along the topographic divide that paral- incise vertically and propagate headward more rapidly than
lels the y boundaries (Figure 4). We measured the valley neighboring valleys with smaller drainage areas (t = 0.5–
spacing in each solution with the spectral method described 1.4 Ma). This has two effects: first, it creates a positive
by Perron et al. [2008]. This method, which is similar to feedback that results in the rapid capture of most of the
that used by Smith et al. [1997b] to measure rill spacing in drainage area by a few valleys that initially have larger
their model, avoids the use of a potentially arbitrary drainage areas, thereby stunting the growth of valleys that
criterion, such as a drainage area threshold, to define a begin with smaller drainage areas. Second, it creates steeper
channel network. Instead, it provides a measure of the side slopes in the rapidly incising valleys, and because both
dominant periodic component of the topography, which in the magnitude of the advective erosion term (equation (12))
this study corresponds to the ridge-valley structure in the x and the creep flux (equation (3)) depend on the slope, the
direction. Two modifications to the spectral technique were intervening ridgelines migrate toward the smaller valleys.
made for the purpose of analyzing the model solutions. Many of the small valleys subject to this competition
First, the surface used to detrend the model topography disappear entirely (t = 2.5 Ma). If this elimination of small
prior to taking the Fourier transform was constructed by valleys proceeds to the point at which the spacing between
averaging the elevations in the x direction rather than by the remaining valleys is too wide, however, new incisions
fitting a plane. Second, no windowing was performed form on the broad intervening ridges and propagate into the
because the model topography is periodic at the x bound- interior. From this competition between adjacent valleys, a
aries and tapers to zero at the y boundaries. In cases where stable configuration with uniformly spaced valleys eventu-
there were multiple spectral peaks, the frequency ally emerges (t = 4.0 –6.0 Ma), and the topography con-
10 of 21F04016 PERRON ET AL.: VALLEY SPACING F04016
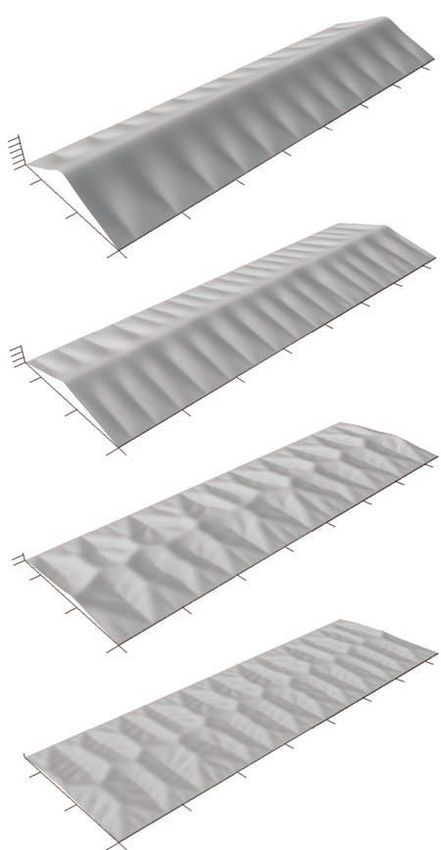
Figure 6. Evolution of the model topography at intervals spaced roughly logarithmically in time.
Horizontal tick interval is 200 m, vertical tick interval is 20 m. No vertical exaggeration.
verges toward an equilibrium state (@z/@t = 0) in which the competition between adjacent valleys for water was later
landscape no longer changes with time. proposed as a qualitative explanation for uniformly spaced
[47] We tracked the dimensionless relief, z 0, and valley rivers by Shaler [1899], who was understandably tempted to
spacing, l0, through time (Figure 7). z 0 increases monoton- draw analogies to Darwin’s [1859] theory of evolution by
ically throughout the simulation. Once the incipient valleys natural selection. Moreover, Shaler [1899] observed that the
have propagated into the interior of the grid, z 0 approaches spacing of rivers is more uniform in more ‘‘evolved’’
its equilibrium value at a rate that declines roughly expo- landscapes, i.e., landscapes in which the cumulative eroded
nentially with time. The standard deviation of relief relief is greater. Our results support this observation, as the
increases in proportion to the relief, but is very small variance in valley spacing is smaller at equilibrium than it is
throughout the simulation. l0 reaches a local minimum very
early in the simulation as many incipient valleys form at the
y boundaries. The large standard deviation of l0 at this stage
reflects the irregular spacing of the incipient valleys. l0 then
increases monotonically as smaller valleys are forced out of
existence by larger ones, and the standard deviation declines
as the spacing of valleys becomes more uniform.
[48] Several aspects of this time-dependent behavior were
anticipated conceptually by early studies of drainage net-
works. Gilbert [1877] noted the dependence of erosion rate
on slope, and appealed to divide migration and lateral
competition among streams as an explanation for the ‘‘great
regularity’’ of badland drainage basins. He also described
the expansion of basins at the expense of neighboring basins
in a process he called ‘‘abstraction.’’ His idealization of the
Figure 7. Time evolution of mean dimensionless valley
geometry of badland divides [Gilbert, 1877, Figure 58] is
spacing, l0, and mean dimensionless relief, z 0, for the model
very similar to the model domain used in this study. The
run shown in Figure 6. Dashed lines are 1s envelopes.
11 of 21F04016 PERRON ET AL.: VALLEY SPACING F04016
predicted values are within two standard errors of one
another, despite differences of a factor of 2 or more in process
rates and spatial scales (Table 1), indicate that D0 and K0 are
good predictors of the basic characteristics of the model
topography, and that our choices of the characteristic length
scales ‘ and z (Figure 4) are appropriate. In sections 5.3 and
5.4, we show that some of these topographic characteristics,
including valley spacing, are sensitive only to Pe.
[50] The dependence of Pe on z, but not on E, suggests that
the driving erosion rate may only control the valley spacing
through its influence on relief, provided equation (13) is valid
for the erosion rates considered. In addition, equation (21)
implies that Pe is independent of relief if the kinematic wave
term in equation (13) is linear in jrzj (i.e., n = 1) and qc = 0.
Figure 8. Equilibrium model solutions with different
values of D, K, ‘0, and E but the same values of the
dimensionless diffusivity, D0, and dimensionless stream
incision coefficient, K0. (a) Reference parameters. (b) D, K,
and E are twice as large as in Figure 8a. (c) The parameter ‘
is twice as large as in Figures 8a and 8b. Parameter values
are listed in Table 1. Horizontal tick interval is 200 m;
vertical tick interval is 10 m. Vertical exaggeration 3X.
in the transient state (Figure 7). Horton [1945] also recog-
nized the importance of the competition for drainage area in
developing networks. The dominance of erosional features
that initially capture more drainage is one of the main
principles in his model for the evolution of rill networks,
and the growth of these basins at the expense of smaller
neighboring ones is similar in some respects to his descrip-
tion of basin growth by cross-grading.
5.2. Validation of Dimensionless Quantities
[49] Figure 8 shows three model solutions with unique Figure 9. Equilibrium model solutions for m, n = 1 and
combinations of D, K, ‘, and E values, but the same driving erosion rates (E) spanning an order of magnitude:
dimensionless diffusivity, D0, and dimensionless stream (a) E = 0.01 mm a1, (b) E = 0.05 mm a1, and (c) E =
incision coefficient, K0. The means and standard errors from 0.1 mm a1. All three runs used the same initial condition.
10 model runs for the cases in Figures 8a – 8c are l0 = The x boundaries have been extended periodically to better
0.432 ± 0.012, z 0 = 0.120 ± 0.00002 (Figure 8a); l0 = 0.421 ± display features that span the boundaries. Horizontal tick
0.004, z 0 = 0.120 ± 0.00002 (Figure 8b); and l0 = 0.437± interval is 200 m, vertical tick interval is 20 m. No vertical
0.007, z 0 = 0.120 ± 0.00003 (Figure 8c). The fact that these exaggeration.
12 of 21You can also read