U.S. Coal: More Market Erosion is on the Way - IEEFA Outlook 2018 February 2018 David Schlissel, Tom Sanzillo, and Seth Feaster
←
→
Page content transcription
If your browser does not render page correctly, please read the page content below
U.S. Coal: More
Market Erosion
is on the Way
IEEFA Outlook 2018

February 2018

David Schlissel, Tom Sanzillo, and Seth Feaster
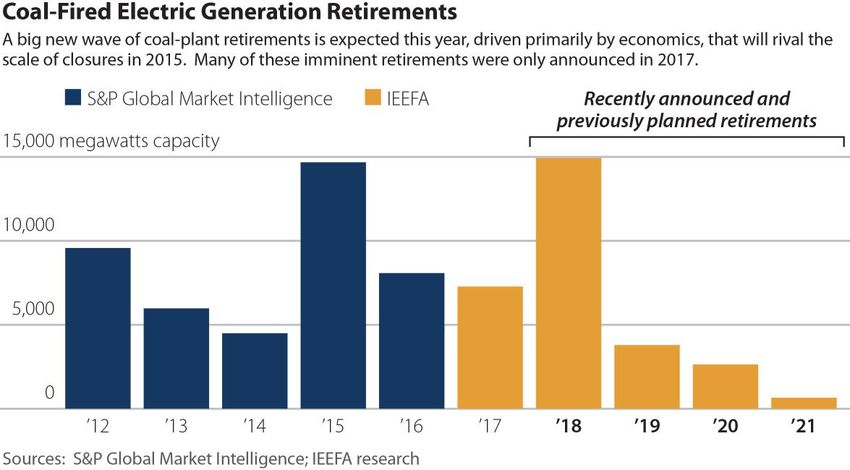
Table of Contents
Executive Summary ……………………………………………………………………………… 4
Introduction …………..…………………………………………………………………………… 8
Market Trends Continue to Undermine Financial Viability of Coal-Fired Power …….. 9
   Retirements of Coal-Fired Plant Accelerated Retirements in 2017 …………….… 14
   Prospects for Coal-Fired Generation in 2018 and Beyond Are Bleak ………...…. 16
          Increased Market Penetration of Renewables ………………………………. 16
          Low Natural Gas Prices ………………………………………………………...…. 20
          Low Energy Market Prices …………………..…………………………………..... 23
          Decline of 2017 Capacity Prices in PJM and MISO ………………………….. 25

          Slow to Flat Electricity Demand Growth ………………………………………. 28
The U.S. Coal Mining Industry Will See Less Production, Fewer Jobs, and Smaller
Market Share in 2018 ……………………………………………………………………..…..... 30
    Decline in Coal Consumption …………………………………….……………………. 30
    Decline in Coal Production ……………………………………….……………………. 32
    Decline in Coal Prices ………………………………………………………………….... 34
Coal Employment, Flat in 2017, Will Either Be Flat Again or Will Fall in 2018 .………... 38

The Investment Market for Coal Shows Sign of Severe Weakness …………..………... 39
    Widespread Negative Financial Events Are Widespread …………………………. 40
          Peabody Energy ……………………………………………...……………………. 40
          Contura Energy ……………………………………………………….……………. 41
          Murray Energy ………………………………………………………………………. 41
          Collapse of Bowie Deal ……………………………………...………………..….. 41
          Kayenta Mine ……………………………………………………………………….. 41
          Westmoreland Coal ……………………………………………………………….. 42

   Increases in Coal Stock Prices Will Be Short-Lived ………….……………………….. 43
Federal Regulatory Changes Will Not Bring Industry Relief …………………………….. 44

                      U.S. Coal: More Market Erosion is on the Way                         2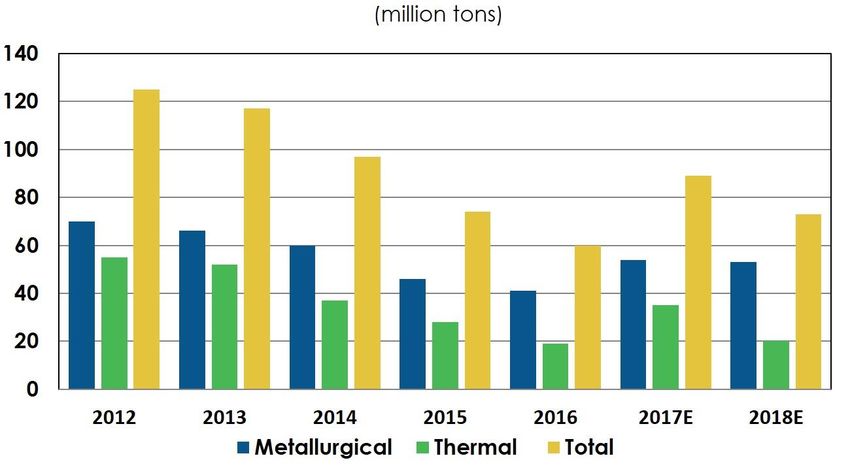
Table of Figures
Figure 1: U.S. Coal-fired Generation During the First 11 Months of 2009 through 2017……….... 9
Figure 2: U.S. Electricity Generation Mix …………………………………………………………….… 10
Figure 3: Coal-Fired Generation in SPP, ERCOT, MISO and PJM 2009-2017 ……………….…… 11
Figure 4: Coal’s Declining Share of the Energy Mix in SPP, ERCOT, MISO and PJM ………..… 12
Figure 5: Coal-Fired Generation in the Mountain West and Southeast U.S. …………………… 13
Figure 6: Coal’s Declining Share of the Energy Mix in the Mountain West and Southeast …. 14
Table 1: Large Coal-Fired Generators Slated for Retirement …………………………………..… 15
Figure 7: Annual U.S. Generation from Wind and Solar Resources ……………………………… 16
Figure 8: Increasing Installed Wind Capacity in Competitive Wholesale Markets ………...…. 17
Figure 9: Wind’s Growing Share of the Generation Mix in Competitive Wholesale Markets .. 18
Figure 10: Recent and Forward Natural Gas Prices at Key Hubs in Competitive Wholesale
Markets ………………………………………………………………………………………………………. 21
Figure 11: Market Expectations for Future Peak Period Energy Market Prices ……………….... 23
Figure 12: Market Expectations for Future Off-Peak Period Energy Market Prices ………….… 24
Figure 13: Recent PJM Capacity Auction Results ………………………………………………….... 26
Figure 14: Recent MISO Capacity Auction Results ………………………………………………..… 27
Figure 15: Annual Peak Demands 2005-2017 ……………………………………………….……….. 28
Figure 16: Annual Energy Loads, 2005-2017 …………………………………………….……………. 29
Figure 17: U.S. Coal Consumption for Electricity, 2005-2016 ………………………………………. 30
Figure 18: U.S. Coal Production 2006 – 2016 ………………………………………………………..… 32
Figure 19: Coal Company Prices by Region, 2014 – 2017 (3Q) …………………………………… 35
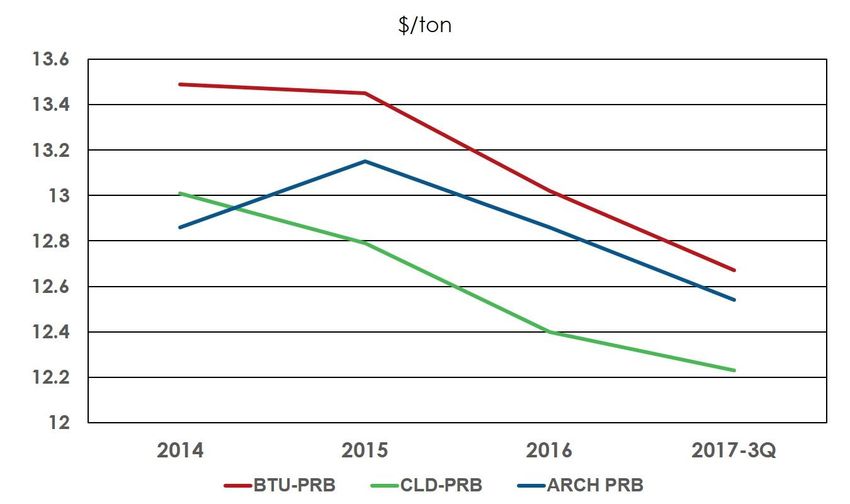
Figure 20: PRB Coal Prices by Region, 2014 – 2017 (3Q) …………………………………………… 35
Figure 21: U.S. Coal Exports, Metallurgical and Thermal, 2012-2018 ……………………..……… 37
Figure 22: Bureau of Labor Statistics: Monthly Average Number of Coal Mine Employees
(2008-2017) …………………………………………………………………………..……………………… 38
Figure 23: Mine Safety & Health Administration: Average Number of Contractor & Operator
Coal Mine Employees, Final for Year 2016 Compared with Data through 3Q 2017 ……….… 39
Figure 24: Coal Company Margins by Region ……………………………………………….……… 43
U.S. Coal: More Market Erosion is on the Way 3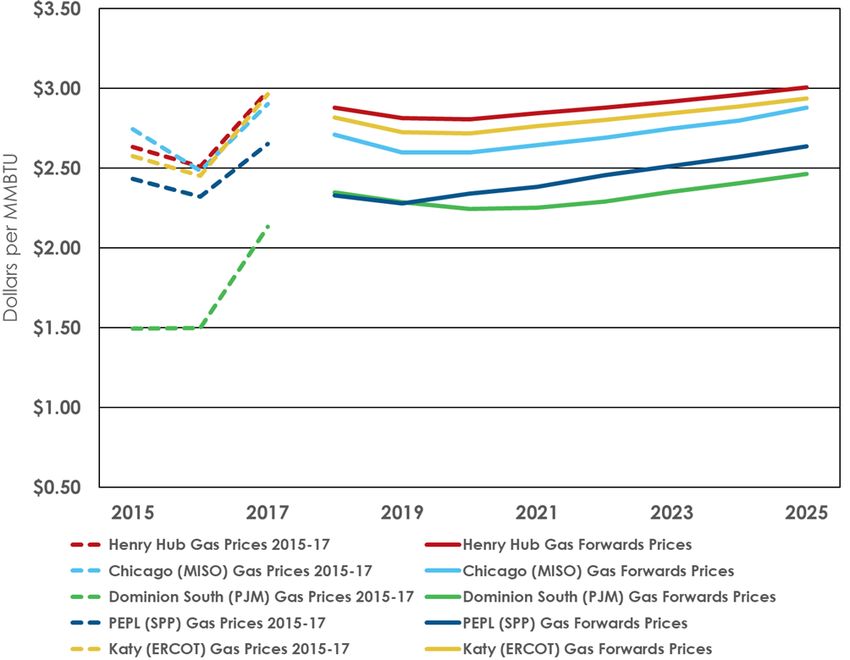
Executive Summary
The U.S. coal industry continued to shrink in 2017, and its trend toward long-term structural
decline is all but sure to persist in 2018.

That is the core conclusion of this report, informed by the following fundamentals:
   •   In electricity generation—the key market for coal—the industry is increasingly
       uncompetitive and is losing market share.
   •   Coal’s main competitors continue to be natural gas and renewables.
   •   The cost of generating electricity with wind and solar power is declining rapidly and,
       as a result, solar and wind are gaining market share. Significantly, wind power is
       showing strong growth in the competitive energy markets that are home to most of
       the country’s remaining coal-fired generating capacity.
   •   Natural gas prices remain relatively low today and are expected to remain low for the
       foreseeable future, which means that energy market prices will remain low, further
       undermining the financial viability of many coal-fired generators.
   •   Demand for electricity is growing very slowly.
   •   As more renewable and gas-fired generating capacity is added to the grid, coal
       faces increasing competition from these lower-cost alternatives.
   •   Further declines in coal’s energy generation market share can be expected through
       2018 and beyond.
   •   Coal mining continues its long-term decline.
   •   Coal consumption stayed at record lows in 2017.
   •   Prices for thermal coal—used for electricity generation—remained low.
   •   Coal producers continued to lose customers. Following a well-established trend
       toward reduction of coal-fired generating capacity, more plants were retired in 2017
       and more coal-plant closures were announced.

                       U.S. Coal: More Market Erosion is on the Way                             4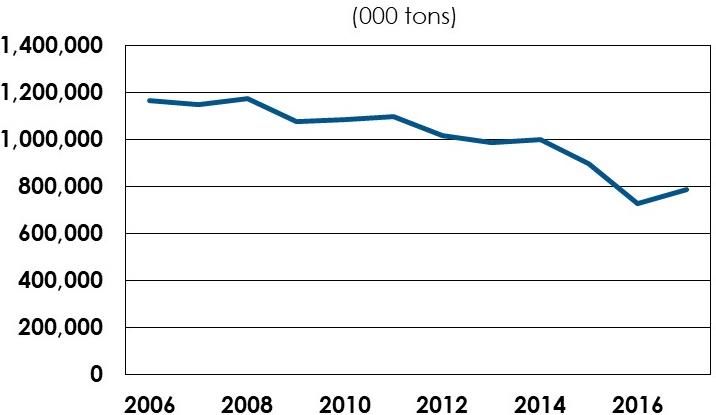
•   In 2018, the total reduction in generating capacity of coal-fired plants will be double
       that of 2017.
   •   In several western U.S. locations—including for the first time in the Powder River Basin
       coal field, which is long the country’s strongest coal producer—attempts to buy and
       sell coal reserves ran into difficulty in 2017. Some deals could not find financing, and
       some posted negative valuations—meaning that the seller either received no cash or
       had to take a loss on the transaction.
   •   Employment in coal mining was essentially flat.
   •   Rollbacks of federal environmental regulations and other federal policy changes have
       not significantly improved coal’s market competitiveness.

All these trends aside, the coal industry showed improvement in some respects in 2017.
Production was up in the largest one-year increase in more than a decade. This gain was
due to increased demand and higher prices in the export market both for metallurgical coal
(for steel production) and thermal coal (for energy production). The fourth quarter of the
year saw improvement in the stock prices of industry leaders Arch Coal and Peabody Energy
after their emergence from bankruptcy.

Nonetheless, IEEFA sees 2018 as a year of further decline for coal-fired electricity generation
and the coal industry generally. Coal’s competitors—natural gas and renewable energy—
begin the year with competitive tailwinds on price and outlook. Coal consumption and
production are likely to decline, and coal prices and coal company margins will continue to
be under pressure. Thermal coal export levels and global pricing of both metallurgical and
thermal coal will decline. Even if promised regulatory relief at the federal level is achieved,
market forces will continue to prevent a sustained coal recovery.

                       U.S. Coal: More Market Erosion is on the Way                           5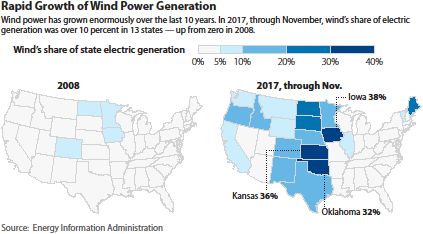
Additional findings on U.S. electricity-generation trends:

       •   There two ways to look at coal's declining share of electricity generation:
              o Coal’s relative share of the total amount of electricity generated across the U.S.
                  in 2017 was 30%, a continuation of a decline from 45% in 2009.
               o  The absolute amount of energy generated by coal decreased by more than a
                  third from 2010, and by 1.7% in the first 11 months of 2017 from the same period
                  in 2016.
       •   Coal’s regional market share continued to decline as well, specifically in the
           Southwest Power Pool (SPP), the PJM Interconnection (PJM), the Mountain West, and
           in Southeast states. Although coal posted market-share gains in 2017 in the Electric
           Reliability Council of Texas (ERCOT) and the Midcontinent Independent System
           Operator (MISO), IEEFA expects these gains are only temporary as more coal-fired
           plants are retired and additional renewable resources (particularly wind) are added
           to these regional grids.
       •   Almost 7,300 MW of coal-fired generation were retired in 2017 and more than 16,000
           MW of new, future retirements were announced. IEEFA estimates that 15,000 MW of
           coal-fired electricity generation will be retired in 2018, double the total in 2017
           amount, and—for the first time—many retirement will be of plants with more than 1,000
           MW of capacity.
       •   The market share of wind and solar has increased four-fold since 2009, and in four
           states—Iowa (37%), Kansas (36%), Oklahoma (32%), and South Dakota (30%)—wind’s
           share of total electricity generation exceeded 30% in 2017. Trends in long-term utility-
           scale investment in renewables show that more wind and solar are coming.
       •   Peak energy market prices for wholesale electricity remained low in 2017, with prices
           projected to remain below $40 megawatt-hour (MWh) in all regions of the country at
           least through 2025. Off-peak prices are expected to be even lower.
       •   Prices at capacity auctions, where owners of power plants receive payments to keep
           plants open and available for dispatch, declined substantially in MISO and PJM.
       •   While natural gas prices rose some in late 2016 and early 2017, they are expected to
           decline by 4% in 2018 and to remain below $3MMbtu1 at the Henry Hub through 2025.
           In most of the regional gas hubs in the country, gas prices will remain substantially
           below $3MMbtu for the foreseeable future.
       •   IEEFA sees coal-fired generation continuing to drop in 2018, both in absolute terms
           and in market share.

1   MMbtu stands for one million British Thermal Units (BTU). A BTU is a measure of the energy content in fuel.

                                U.S. Coal: More Market Erosion is on the Way                                      6
Additional findings on U.S. coal producers:
• Consumption of coal for electricity generation tilted downward and remained at
historic lows, falling by 1.8% in 2017 to 666 million tons, down from 678 million tons in
2016. This occurred even with a 20% increase in natural gas prices, and IEEFA projects
consumption in 2018 will drop by an additional 30 million tons, or 4.5%.
• While coal production increased in 2017 by 6%, to 773 million tons from 728 million tons
in 2016, IEEFA sees the trend reversing in 2018, with coal production declining by 20 to
40 million tons.
• Thermal spot coal price trajectories varied regionally in 2017: Illinois Basin spot prices
declined, Central Appalachian prices rose, and prices in the Powder River Basin (PRB)
and Northern Appalachia were flat for most of the year (PRB prices rose in the latter
part of the fourth quarter).
• Coal prices have declined for the most part over the past four years, according to
company-reported numbers. In 2017, this downward trend continued in the Powder
River Basin and Illinois Basin. In Northern and Central Appalachia, company-reported
prices for domestic thermal coal also continued to drop. Where company-reported
coal price increases did occur, they were driven by improvements in thermal coal
exports and the metallurgical market.
• IEEFA projects that in 2018 coal prices will decline further in the Powder River Basin,
Illinois Basin and Central Appalachia.
• Driven by solid demand and good prices in
metallurgical and thermal coal markets, coal exports
rose by 48% in 2017. In 2018, metallurgical and
thermal coal export markets will likely see price
erosion; decline in U.S. thermal exports is likely.
• Coal employment in 2017 was essentially flat as
compared to 2016, and over the past two years
coal-mine employment has been at its lowest levels
in a decade.
• The buying and selling of coal mines continued to
reflect a severely distressed market with announced
deals failing to materialize and deal closings
characterized by investor value losses. Stock price
gains among coal producers have been limited to companies that have emerged
recently from bankruptcy with reduced debt and are selling coal outside U.S. For
producer’s dependent on domestic coal sales, stock performance remains subpar.
• Rollbacks of federal environmental regulations on coal mining and electricity
production, as well as rescissions of reforms to the federal coal-leasing program, have
proven largely ineffective in improving the balance sheets of coal producers in 2017.
IEEFA expects little impact going forward.
U.S. Coal: More Market Erosion is on the Way 7Introduction
The purpose of this review and outlook is to assess the impact that market forces and policy
changes have had, and are likely to continue to have, on the financial viability of coal-fired
electricity generation across the U.S.—and on the viability of the coal industry as a whole.
Our analysis focuses on changes reflected in actual market-, and company- and plant-
reported results, rather than on models built around flawed, hypothetical assumptions about
future circumstances and developments. This report considers the performance of specific
individual mines and coal–fired generators and the finances of plant and mine owners.
This report is our second on the topic in two years. The first, published in January 2017,2 took a
bare-bones approach to quantifying trends in coal markets—focusing on consumption,
production, prices, employment and the underlying market forces driving those trends. This
year’s outlook takes a deeper look at the energy-generation side of the equation,
recognizing that demand is the key to the future of coal producers.
Projections in IEEFA’s January 2017 outlook turned out to be largely accurate, as described
below, but did miss the mark on one key factor: While IEEFA had coal production in 2017
either flat or declining, it actually increased by 45 million tons. IEEFA’s analysis a year ago
missed seeing the improvement that occurred in export market conditions for coal in 2017,
which was what drove the increase.
• IEEFA predicted in January 2017 that U.S. coal consumption would total 675 million
tons, a decrease from 2016. And coal consumption indeed dropped, to 666 million
tons. Here IEEFA expected that natural gas prices would rise, mitigating consumption
losses for the year. Natural gas prices in fact did rise early in the year and on a year-to-
year basis, but coal consumption for electricity dropped nonetheless during the first 11
months of the year. 3
• IEEFA expressed scepticism in January 2017 that any price or financial recovery would
result in new investment in the industry. Coal transactions during the year continued to
demonstrate severe distress. The industry’s strongest regional producer—the Powder
River Basin—saw the year close with the collapse of the Belle Ayre/Eagle Butte deal,
for the first time reflecting market-based impairments of coal reserve values in the PRB.
• IEEFA also expressed doubt that employment in the coal sector would significantly
improve. Although the industry saw certain months of gain, overall employment levels
were flat, with the year ending on a downward trend.
2 Institute for Energy Economics and Financial Analysis, 2017 U.S. Coal Outlook: Short-Term Gains Will Be Muted by
Prevailing Weaknesses in Fundamentals, January 2017
3 Data for the period January-November 2017 are the most recent electric generation data available at this time.
U.S. Coal: More Market Erosion is on the Way 8Market Forces Will Continue to
Undermine the Financial Viability of
Coal-Fired Power
The decline in the use of coal for generating electricity slowed in 2017, but indications are
that the trend will re-accelerate in coming years.
It appeared by the middle of 2017 that electricity generation from coal-fired plants would be
higher nationally in 2017 than it had been in 2016. However, by the fall, it was clear that coal-
fired generation in the U.S. would be down in 2017 relative to 2016, following a trend
established in 2015 and 2016 (see Figure 1). Total generation from coal in the first 11 months
of 2017 was 1.7% lower than in the same period of 2016 and 35% below the first eleven
months of 2010.4
Figure 1: U.S. Coal-fired Generation During the First 11 Months of 2009 through 20175
4 Figures 1 and 2 present generation during the first eleven months of each year. This is because full-year results are not
yet available for 2017 and to compare full year results for other years with those for only the first eleven months of 2017
would not be reasonable.
5 Source data from EIA Electric Power Monthly
U.S. Coal: More Market Erosion is on the Way 9Figure 1 shows no reversal in 2017 in the long-term decline in coal’s share of the U.S.
electricity generating mix. At best, coal’s market share declined much less in the first 11
months 2017 than it had in previous years, but given the market forces that IEEFA expects will
continue to undermine coal’s use as a fuel to produce electricity, it is very likely that coal-
fired generation will continue to decline in 2018 and beyond, although it is difficult to project
the specific rate of decline.
Figure 2: U.S. Electricity Generation Mix6
Although the data shown in Figures 1 and 2 provide a good overview of coal’s role in
electricity generation, regional data reveals how coal is faring in key regions around the
country in which the fuel continues to play a significant role in electricity production. The U.S.
coal fleet is concentrated in six main areas of the nation. These include four competitive
wholesale markets (the Southwest Power Pool7 (SPP), the Electric Reliability Council of Texas8
(ERCOT), the Midcontinent Independent System Operator 9(MISO) and the PJM
6 Source data from EIA Electric Power Monthly.
7 Southwest Power Pool, Inc. manages the electric grid and wholesale power market for the central United States covering
14 states: Arkansas, Iowa, Kansas, Louisiana, Minnesota, Missouri, Montana, Nebraska, New Mexico, North Dakota,
Oklahoma, South Dakota, Texas and Wyoming.
8 The Electric Reliability Council of Texas (ERCOT) manages the flow of electric power to 24 million Texas customers --
representing about 90 percent of the state’s electric load.
9 The Midcontinent Independent System Operator (MISO) operates the transmission system and a centrally dispatched
market in portions of fifteen states in the Midwest and the South, extending from Michigan and Indiana to Montana, and
from the Canadian border south to Louisiana and Mississippi.
U.S. Coal: More Market Erosion is on the Way 10Interconnection10 (PJM)’ and two regions that don’t have competitive wholesale markets
(the Southeast and the Mountain West states).
Figure 3, below, shows coal-fired generation in the years 2009-2017 in SPP, ERCOT, MISO and
PJM.11
Figure 3: Coal-Fired Generation in SPP, ERCOT, MISO and PJM 2009-201712
Figure 3 makes it clear that that generation from coal-fired facilities has been in decline in
the MISO, PJM and SPP markets in recent years—with especially substantial declines in MISO
and PJM. Generation from coal-fired facilities also has declined in ERCOT, except for what
IEEFA anticipates will prove to be a temporary upturn in 2017.
Figure 4 shows how coal’s market share has declined in each of these competitive wholesale
markets. As explained below, IEEFA sees coal plant retirements, persistently low natural gas
prices, and the addition of large amounts of renewable resources (particularly wind) leading
10 PJM Interconnection is a regional transmission organization (RTO) that coordinates the movement of wholesale electricity
in all or parts of Delaware, Illinois, Indiana, Kentucky, Maryland, Michigan, New Jersey, North Carolina, Ohio,
Pennsylvania, Tennessee, Virginia, West Virginia and the District of Columbia.
11 The generation data shown in Figure 3 is for all of each calendar year for SPP, ERCOT and MISO. The PJM generation
data is for the months January-September only, as the annual data for PJM is not available.
12 Source data from PJM, MISO, SPP and ERCOT websites.
U.S. Coal: More Market Erosion is on the Way 11to further market-share declines for coal in these regions.
Figure 4: Coal’s Declining Share of the Energy Mix in SPP, ERCOT, MISO and PJM13
Figures 5 and 6, below, show coal-fired generation in the Mountain West and Southeast
regions of the U.S., both in absolute terms (GWh) and as shares of the regional energy mix.
13 Source data from PJM, MISO, SPP and ERCOT websites.
U.S. Coal: More Market Erosion is on the Way 12Figure 5: Coal-Fired Generation in the Mountain West14 and Southeast U.S.15 16
350,000
318,577
300,000
290,922
250,000
Gigawatt Hours
200,000
182,103 166,800
150,000
147,916
100,000
50,000
0
2009 2010 2011 2012 2013 2014 2015 2016 2017
Mountain States Southeast States
14 The eight mountain states included in Figures 5 and 6 are Arizona, Colorado, Idaho, Montana, Nevada, New Mexico, Utah
and Wyoming. The six southeastern states included are Alabama, Florida, Georgia, North Carolina, South Carolina and
Tennessee. Significant portions of the other southern states are part of PJM, MISO or SPP. Therefore, the generation
data from these states are not included in the analysis shown in Figures 5 and 6.
15 Source data from EIA Electric Power Monthly.
16 The generation data in Figures 5 and 6 is for the first ten eleven months only as full-year results for 2017 is not available.
U.S. Coal: More Market Erosion is on the Way 13Figure 6: Coal’s Declining Share of the Energy Mix in the Mountain West and Southeast U.S.17
The use of coal to generate electricity has been in a long-term decline in the Mountain West
and the Southeast, as well, a decline IEEFA anticipates will continue.
Retirements of Coal-Fired Generators
Accelerated in 2017
Nearly 7,300 megawatts of U.S. coal-fired generating capacity were retired in 2017. More
important, the pace of retirements accelerated; 16,600 MW of new coal retirements were
announced, and more than 10,000 MW of this capacity is scheduled to be retired by the end
of 2018. When combined with previously announced retirements, IEEFA expects that about
15,000 MW of coal-fired assets will be shut down this year, more than double the total closed
in 2017.
Another 6,500 MW of coal-fired capacity is currently scheduled to be retired in 2019 and
2020, with an additional 4,977 MW in closures planned by the end of 2025. As will be
discussed in the following sections of this review, we see coal plant retirements continuing in
coming years as more and more generators find it financially infeasible to continue
17 Source data from Electric Power Monthly.
U.S. Coal: More Market Erosion is on the Way 14operating in the face of increased competition from renewables and low natural gas and
energy market prices. The Federal Energy Regulatory Commission’s January 2018 decision to
reject the Department of Energy’s proposed coal plant bailouts18 puts tens of gigawatts (GW)
of additional coal-fired generators at risk of retirement.
It is also significant that a large number of recently announced retirements are of large coal-
fired generators. The overwhelming majority of previously retired coal-fired plants have been
smaller units.
Table 1: Large Coal-Fired Generators Slated for Retirement
Planned Year of
Plant Size (MW) State
Retirement
Big Brown 1208 TX 2018
Monticello 1865 TX 2018
Sandow 4 & 5 1200 TX 2018
Pleasant Prairie 1184 WI 2018
St. John's River 1276 FL 2018
J.M. Stuart Units 1-4 2308 OH 2017 & 2018
Navajo Units 1-3 2250 AZ 2019
San Juan Units 1-4 1674 NM 2017 & 2022
Jim Bridger Units 1 & 2 1955 TX 2028 & 2032
18 https://elibrary.ferc.gov/idmws/file_list.asp?document_id=14633130
U.S. Coal: More Market Erosion is on the Way 15Prospects for Coal-Fired Generation in 2018
and Beyond Are Bleak
The same constellation of market forces that drove past coal plant retirements will continue
to undermine the financial viability of coal-fired generators and will lead to further
retirements in coming years.
These market forces include:
• Increased competition from lower cost renewables.
• Low natural gas prices and increased competition from natural gas-fired generators.
• Low or, at best, volatile capacity market prices.
• Low energy market prices.
• Flat or nearly flat demand for electricity.
Increased Penetration of Renewable Resources Poses a
Growing Threat to Coal
The U.S. electric grid’s reliance on renewable energy has grown dramatically in the past
decade, with generation from wind and solar resources having increased five-fold from 2008
to 2016. Wind and solar generation in the first 11 months of 2017 exceeded wind and solar
production in all of 2016 by nearly 8%.
Figure 7: Annual U.S. Generation from Wind and Solar Resources19
19 Source Data from Electric Power Monthly.
U.S. Coal: More Market Erosion is on the Way 16Installed wind capacity in SPP, ERCOT and MISO has grown dramatically in recent years.
These are all areas with substantial amounts of coal-fired capacity, with which new wind
farms compete. In MISO specifically, new wind-powered electricity production comes
predominantly from its North Region, which extends from western Wisconsin through portions
of the Dakotas into eastern Montana.
Figure 8: Increasing Installed Wind Capacity in Competitive Wholesale Markets20
Because wind-powered generation has no fuel costs, it is dispatched ahead of coal-fired
generation. As a result, generation from wind power has displaced coal and captured
growing market shares in the SPP, ERCOT and MISO North markets—areas that have the
strongest on-shore wind potential in the U.S.
20 Data from SPP, ERCOT, MISO and PJM quarterly and annual State of the Market Reports and from the ISO websites.
U.S. Coal: More Market Erosion is on the Way 17Figure 9: Wind’s Growing Share of the Generation Mix in Competitive Wholesale Markets21
Through November 2017, seven states generated more than 15% of their electricity with wind
power: Iowa (37%), Kansas (36%), Oklahoma (32%), South Dakota (30%), North Dakota (26%),
Minnesota (18%), and Texas (15%).
Some snapshot instances from the past year that demonstrate how wind stands to dominate
the electricity generation market in some of these areas: Wind power served 56.25% of the
load in the Southwest Power Pool on the morning of Dec. 4, 2017, beating the previous
record of 54.47%, set on April 24, 2017, and the record of 54.2% on March 19, 2017.
Although solar-power penetration in the SPP, ERCOT, MISO and PJM markets stands at less
than 1%, solar also remains a risk to coal-fired electricity in these markets because it helps
keep energy market prices low by displacing coal-fired generation during the peak hours of
the day. This risk will grow in coming years as the installed MW of both utility-scale and
distributed solar capacity rises dramatically.
Increases in installed wind and solar capacity nationally have been driven by steep declines
in installation costs. The average installed cost of wind projects has dropped 333% from the
peak in 2009/201022. The median installed price for utility-scale solar projects has fallen by
21 Source data from PJM, MISO, SPP and ERCOT websites and the EIA Electric Power Monthly.
22 2016 Wind Technologies Market Report, Lawrence Berkeley National Laboratory, August 2017.
https://emp.lbl.gov/sites/default/files/2016_wind_technologies_market_report_final_optimized.pdf
U.S. Coal: More Market Erosion is on the Way 18two-thirds over the past decade or so23. The installed prices for small-scale distributed solar
projects have also fallen.24
Moreover, the performance of new renewable energy facilities has improved. Wind turbine
capacity factors have increased significantly as a result of design improvements such as
higher hub heights and larger turbine blades. Solar capacity factors also have improved,
although not as dramatically.
As a result of lower installation costs and better performance, utility-scale solar and wind
power purchase agreement (PPA) prices have declined sharply in recent years. Average
levelized wind PPA prices went from $70 per MWh in 2009 to about $20 in 2016. Average
levelized solar PPA prices declined by 75% from 2009 to 2016 and were about $35 per MWh
for projects executed in 2016.
Solar and wind PPA prices dropped further in 2017. In December 2017, Austin Energy signed a
PPA for 150 MW of solar power for 15 years in a deal reported as “the lowest solar PPA the
U.S. has ever seen,” according to published reports.25 Also in December, Xcel Energy
reported on the results of a power-generation solicitation in Colorado in which the bids for
renewable power were “incredible.”26
The median price for wind projects in 2017 was $18.10 per MWh: for wind-plus-storage
projects the median price was $21 per MWh; the median bid for solar projects was $29.50 per
MWh: for solar-plus-storage it was $36 per MWh.
Some clean energy investors expect wind and solar installation costs to decline by so much
that PPA prices will remain low even after wind production tax credits (PTC) and solar
investment tax credits (ITC) are phased out, with unsubsidized PPA prices of $20–$30 per MWh
for wind and $30–$40 per MWh for solar by the early 2020s. These unsubsidized prices would
be less than the operating costs of many coal-fired generators.
Wind and solar capacity, in short, pose long-term threats to coal plants. Because they have
no fuel costs, wind and utility-scale solar power is dispatched first in competitive markets,
helping keep energy market prices low, as noted above, while displacing energy from coal-
and even gas-fired generators.
Moody’s Investors Service has concluded that declining wind generating costs put 56 GW of
coal capacity in the Great Plains “at risk” of retirement27 and that “wind power economics
are driving coal generation up the dispatch curve28 and into early retirement.”29 Utility-scale
solar has an even greater impact on coal capacity, as it undercuts coal-fired generation
during the traditionally highest-priced, most profitable peak hours. Generation from wind and
23 Utility-Scale Solar 2016, Lawrence Berkeley National Laboratory, September 2017. https://emp.lbl.gov/publications/utility-
scale-solar-2016-empirical.
24 Tracking the Sun 10, Lawrence Berkeley National Laboratory, September 2017. https://emp.lbl.gov/publications/tracking-
sun-10-installed-price.
25 https://www.greentechmedia.com/articles/read/amidst-201-trade-case-uncertainty-austin-energy-signs-historic-low-solar-
pp#gs.b60afWg.
26 https://www.utilitydive.com/news/xcel-solicitation-returns-incredible-renewable-energy-storage-bids/514287/.
27 Rate-Basing Wind Generation Adds Momentum to Renewables, Moody’s Investor Service, March 15, 2017.
28 The dispatch curve is the order in which generating plants are brought on line to meet demand and with higher cost
generators called on after lower cost ones.
29 UtilityDive, March 23, 2017.
U.S. Coal: More Market Erosion is on the Way 19solar have led frequently to zero and negative energy market prices during some hours in
competitive wholesale markets.
Distributed rooftop solar also undercuts the profitability of coal-fired generators. By reducing
the loads on the grid, distributed solar leads to lower energy market prices at the same time it
reduces demand for coal-fired electricity.
More wind and solar is coming—perhaps as much as 100 GW by 2022, according to S&P
Global Market Intelligence.30 In ERCOT alone, more than 30 GW of new wind and almost 25
GW of new solar projects are going through some form of review.31 Studies by regional ISOs
show that, with upgrades, the grid can handle substantially more renewables. Administrators
of the Southwest Power Pool say that, with transmission improvements, SPP has the potential
to deliver as much as 75% of its load from wind resources.32
A growing number of utilities and merchant generators are adopting “steel for fuel”
policies—replacing fossil-fired generators with renewables—which will drive growth in
renewables. That’s because utilities can profit by rate-basing investments33 in new wind
resources, so many are replacing older, inefficient coal-fired plants with wind capacity.34
Meanwhile, as utilities have realizing that investing in renewables is profitable, more demand
for renewables is coming from the corporate sector as a number of companies (including
Google, Walmart, Facebook, Mars and Nestle) aim to source 100% of their electricity from
renewables. It is estimated that this direct purchase of renewables from generators, which is
outside traditional utility resource procurement, will grow to between 10 GW and 50 GW over
the next five to seven years.
Natural Gas Prices Are Likely to Remain Low
Natural gas prices collapsed in 2008 and 2009 as a result of the shale gas revolution. Except
for a few spikes, prices have remained low, particularly in recent years, when average
annual prices ranged from $2 to $3 per MMbtu.
While Henry Hub, in Louisiana, is considered a major pricing point for natural gas, prices at
other hubs around the country also undermine the financial viability of coal-fired generators.
A number of these hubs are in regions that have wholesale energy markets in which natural
gas-fired plants are in direct competition with coal-fired capacity.
Figure 10 shows past and forward prices as of Jan. 2, 2018 at the Henry Hub and at hubs in
four competitive wholesale energy markets with large concentrations of coal-fired capacity.
As can be seen in Figure 10, natural gas prices were extremely low in 2015 and 2016,
recovered somewhat in 2017, and are expected by the market to remain low for the
foreseeable future.
30 SNL Financial, November 2, 2017.
31 http://ercot.com/gridinfo/resource
32 STP Eyes 75% Wind Penetration Levels, RTO Insider, February 20, 2017.
33 Utilities can add their capital investments to the costs used to determine the rates they can charge for power, which is an
incentive for them to make capital investments.
34 Rate-Basing Wind Generation Adds Momentum to Renewables, Moody’s Investor Service, March 15, 2017.
U.S. Coal: More Market Erosion is on the Way 20Figure 10: Recent and Forward Natural Gas Prices at Key Hubs in Competitive Wholesale Markets35
Both demand-side and supply-side factors are expected to keep natural gas prices low,
according to many forecasts:
• On the supply side, technology improvements have pushed the break-even price of
natural gas to below $3 per MMbtu—and even lower in Appalachia.36 Morgan Stanley
says that “$2-3/MMbtu natural gas, not $3-4, is the new normal” and has recently
forecast that natural gas prices at Henry Hub will average $2.90 in 2018 and fall to
$2.80 in 2019.37 Even lower prices ($2.25-$2.50) can be expected across Appalachia.
• Significant efficiency gains in the production of shale gas were achieved in 2016.
According to an analysis by Sanford Bernstein & Co., the fact that these efficiency
gains were achieved amid a supply glut was “terrifying” to producers.38 Bernstein said
35 Prices downloaded from SNL Financial on January 3, 2018.
36 Morgan Stanley Research, Don’t Bet Against Innovation: Sub-$3 is the New Normal (Mar. 28, 2017), available at
https://fa.morganstanley.com/hillgroup/mediahandler/media/41640/Natural%20Gas_Don%27t%20Bet%20Against%20Inn
ovation_Sub-%243%20Is%20the%20New%20Normal.pdf.
37 https://www.benzinga.com/analyst-ratings/analyst-color/17/12/10915534/natural-gas-morgan-stanleys-2018-outlook.
38 SNL Financial, Bernstein calls shale gas efficiency gains ‘terrifying’ amid supply glut (Aug. 7, 2017).
U.S. Coal: More Market Erosion is on the Way 21that that “[t]hese gains, coming when drillers were already overproducing, “is even
more bearish for our view of gas price . . ..”39
• On the demand side, electricity demand nationally is forecast to be essentially flat,
and, even with the planned addition of approximately 20 GW of new natural gas-fired
combined cycle capacity in PJM, renewables are competing directly with natural gas
in major markets in the West, the Great Plains states and Texas. The hoped-for big
growth opportunity for natural gas is in liquid natural gas (LNG) exports. However, while
the U.S. is on track to become the third-largest exporter of LNG (after Qatar and
Australia), a global glut is occurring in LNG markets, and there is not enough global
demand for LNG to soak up American LNG excess and drive prices up.40 As a result,
Deloitte has concluded that “there will likely be continued record levels of production
combined with historically low prices for the near to medium term.”41
• Moody’s does not expect natural gas prices to increase over the next three years,
which means the ratings agency expectats that Henry Hub natural gas prices through
2019 will remain at about $3 per MMbtu or less.42
Low natural gas prices have disadvantaged and will continue to disadvantage coal in
several ways
First, low gas prices create lower energy market prices in competitive wholesale markets
because they reduce the cost of operating natural gas-fired combined-cycle plants
(NGCC)—especially new, highly-efficient units that have come online in the last 15 to 20
years. These units set many hour-to-hour market prices.
Second, because these NGCC units are less expensive to operate, they are increasingly
dispatched ahead of power from coal-fired plants, whose operating costs have been flat or
rising. This has led to the displacement of generation at coal-fired plants.
Lower natural gas prices have made many formerly profitable coal plants operate at a loss
because they generate (and sell) fewer MWh of electricity while at the same time earning
less from each MWh they are selling. The U.S. Department of Energy has documented the
“advantaged economics of natural gas-fired generation” as the “biggest contributor to coal
plant retirements.”43
SNL Financial has identified more than 89 GW of planned new NGCC capacity, with 28.3 GW
already under construction and another 13.5 GW in advanced development.44 18.6 GW of
this capacity is scheduled to come online just in 2018, (13 GW in PJM) with 85% already under
construction.45 The 28.3 GW of new NGCC capacity under construction includes 13 GW in
MISO, ERCOT and SPP as of October 2017.46 When these additions and other planned NGCC
capacity is built, coal-fired generators will face even stronger competition from gas and
greater financial peril.
39 Id.
40 Deloitte, Seeking Growth: What will drive US natural gas demand (2017), available at
https://www2.deloitte.com/us/en/pages/energy-and-resources/articles/us-natural-gas-consumption-demand.html.
41 Id. at page 5.
42 Moody’s Investors Service, PJM Merchant Generation Facing Refinancing Risk at page 4 (Apr. 21, 2017).
43 DOE, Staff Report to the Secretary on Electric Markets and Reliability, August 2017, page 13)
44 Planned US natural gas combined-cycle capacity totals more than 89,000 MW, SNL Financial, December 22, 2017.
45 Id.
46 Gas. wind make up most of late-stage US power generation developments, SNL Financial, October 4, 2017.
U.S. Coal: More Market Erosion is on the Way 22Energy Market Prices Are Likely to Remain Low
The combined effect of increased market penetration by wind and solar, low natural gas
prices, and new gas-fired capacity will keep energy market prices low for the foreseeable
future.
Figures 11 and 12 show forward prices through 2025 for peak and off-peak periods for six
representative hubs in SPP, ERCOT, MISO and PJM as of Jan. 2, 2018.47 These prices reflect
market expectations at each of these hubs.
Figure 11: Market Expectations for Future Peak Period Energy Market Prices48
47 Although each grid operator has its own definition of which hours are peak and off-peak, approximately 48 percent of the
hours in a week are considered peak periods (weekdays 7am-11pm). The remaining 52 percent of hours are off-peak.
48 Prices downloaded from SNL Financial on January 3, 2018.
U.S. Coal: More Market Erosion is on the Way 23Figure 12: Market Expectations for Future Off-Peak Period Energy Market Prices49
These figures suggest that although energy market prices may at times be a bit higher than
they were in 2016 and 2017, they will remain low and relatively flat for the foreseeable future.
Low energy market prices will continue to put pressure on the ability of coal-fired generators
to produce positive net earnings. Coal-fired plants can be expected to generate less power
due to the increased penetration of renewables and the increased availability of lower-cost
NGCC capacity. This trend will mean higher per-MWh operating costs because fixed
operating and maintenance costs will be spread over a fewer number of MWh of output.
Moreover, the growing presence of renewables (wind during off-peak and solar and wind
during peak hours) will lead to a greater number of hours during which energy market prices
are zero or negative. In hours with negative prices, generators have to pay to continue
supplying power to the grid; coal-fired generators will have to pay such costs because they
are, in general, inflexible and cannot quickly respond to increases or decreases in demand.
Coal-fired generators are also disadvantaged by the fact that they have to spend millions of
dollars each year in capital expenditures (capex) to replace degraded equipment or
structures or to address environmental requirements. Consequently, even if a plant does
49 Prices downloaded from SNL Financial on January 3, 2018.
U.S. Coal: More Market Erosion is on the Way 24generate positive earnings from its energy sales, it might not produce any net profits for its
owner when these capex costs are considered.
Capacity Prices Declined Significantly in 2017 Auctions in
PJM and MISO
Independent System Operators (ISOs) mange seven competitive wholesale markets in the
U.S. Three of these competitive markets are for energy only. The other four have both
competitive energy markets and capacity auctions, but two of these, New York
Independent System Operator (NYISO) and ISO New England (ISO-NE), have very small
amounts of coal-fired generating resources. PJM and MISO are the only two ISOs conducting
annual capacity auctions that include substantial amounts of coal-fired resources.
A plant owner bids its generating capacity in an auction. The amount of capacity that clears
the auction is a function of an ISO’s need for capacity and the supplies that are being bid by
plant owners. All of the capacity that clears the auction receives whatever price is set
through the competitive auction. It is possible for an entire generating unit to clear an
auction and receive capacity revenues for only part of the unit’s capacity (say, for example,
500 MW of a 1,000 MW plant).
Every year PJM and MISO conduct competitive auctions to acquire capacity for an
upcoming planning or delivery-year. PJM’s auction is for a delivery year that is three years in
the future, while MISO’s auction is for a planning year that starts several months after the
auction is held. The capacity auction conducted by PJM in 2017 was for a delivery year that
will begin on June 1, 2020, and end on May 31, 2021. The auction conducted by MISO in 2017
was to acquire capacity from June 1, 2017, through May 31, 2018.
Capacity markets can provide revenues for coal plants that would otherwise be
uneconomic. However, the combination of new renewable resources and gas-fired
capacity that has been added to the grid (or is under construction) and relatively flat loads
has led to sharply lower prices in competitive capacity auctions managed by PJM and MISO.
For example, the May 2017 Base Residual Auction that PJM conducted for the 2020/2021
delivery year produced prices that were about 23% lower than had been set in the 2016
auction and some 54% below the capacity prices set in the 2015 auction for the delivery year
2018/2019.
U.S. Coal: More Market Erosion is on the Way 25Figure 13: Recent PJM Capacity Auction Results50 51
$180
$164.77
$160
$140
$136.00
Dollars per Megawatt-Day
$120 $120.00
$100 $100.00
$80 $76.53
$60 $59.37
$40
$20
$0
2015/2016 2016/2017 2017/2018 2018/2019 2019/2020 2020/2021
Delivery Year
This means that a typical 600 MW coal-fired plant that will receive $33 million in capacity
revenues during the 2018/2019 delivery year will earn only $15.4 million in the 2020/2021
delivery year. This represents a sharp drop in revenues and could render unprofitable
previously profitable units.
The situation poses even more trouble for coal-fired generation in MISO. Figure 14 shows the
results of the last four MISO capacity auctions.
50 The prices in this Figure are for the PJM RTO region, which is the largest zone in PJM. There also are several
transmission-constrained zones that do have higher capacity prices.
51 Source data from auction results reported on PJM website.
U.S. Coal: More Market Erosion is on the Way 26Figure 14: Recent MISO Capacity Auction Results52
$160 $150 per MW-Day
Dollars per Megawatt-Day
$140
$120
$100
$72 per MW-Day
$80
$60
$40
$1.50 per
$20 MW-Day
$0
2014-2015 2015-2016 2016-2017 2017-2018
Planning Year Planning Year Planning Year Planning Year
MISO Zone 4 (Southern Illinois)
MISO Zones 1-3 & 5-7 - Eastern Montana, North Dakota, northeast South Dakota, Minnesota,
Wisconsin, Iowa, Indiana & Michigan
MISO Zone 10 (Mississippi)
MISO Zones 8&9 (Arkansas & Louisana)
These auction results mean that a typical 600 MW coal-fired unit in MISO Zones 1-3 & 5-7 that
was earning $14.5 million in capacity revenues during the 2016-2017 planning year is currently
earning a mere $302,220 in the 2017/2018 planning year.
These losses in capacity revenues severely undermine the financial viability of large numbers
of coal plants and make many plant owners even more frantic in their pursuit of bailouts by
state and federal governments. Moreover, the imbalance between supply of capacity and
demand suggest that capacity prices will remain low in coming PJM and MISO auctions for
the following reasons: (1) the expectation of flat or nearly flat loads; (2) the thousands of MW
of new NGCC capacity under construction, mainly in PJM; (3) the large amount of new wind
being added in the northern Zone of MISO; and (4) the fact that over 18 GW of capacity did
not clear the auction, despite the fact that—by seeking a 23.3% reserve margin,53 well above
the required 16.6% reserve—PJM was agreeing to pay for additional capacity.
52 Source data from auction results reported by MISO.
53 Reserve margin is the extra generating capacity (in megawatts) a utility or RTO needs to have above the expected peak
system load.
U.S. Coal: More Market Erosion is on the Way 27Electricity Demand Growth Has Been Slow
Faced with increasing lower-cost competition, coal-fired generators need greater demand
to maintain market share. Here also prospects are bleak.
Growth in domestic U.S. electricity demand has slowed considerably in recent years. After
averaging 2.5% annually in the late 1990s, growth slowed to an annual average of 1% from
2000 to 2008, and has remained relatively flat since then. In some areas, demand has
actually declined. This slowing of demand has been due to a number of factors, including:
• The impact of formal energy efficiency programs and investments.
• Increased interest from consumers in saving energy.
• Rising generation from distributed rooftop solar,
• Most important, a decoupling between energy consumption and economic growth.
U.S. gross national product grew by 1.6% in 2016, while energy consumption fell by 0.2%. This
decoupling has resulted from strategies of industrial customers and large utilities that have
enabled them to better manage their power use, and from changing residential
consumption habits. All these factors are likely to dampen future demand growth.
Figures 15 and 16 show the annual peak demands and energy loads for SPP, ERCOT, MISO,
PJM and Southern Company (a proxy for the Southeast).
Figure 15: Annual Peak Demands 2005-201754
54 Source data from Southern Company annual 10-K reports and quarterly and annual State of the Market Reports for PJM,
SPP, ERCOT and MISO.
U.S. Coal: More Market Erosion is on the Way 28Figure 16: Annual Energy Loads, 2005-201755
Neither demand nor energy loads have seen increases in any of these five areas for more
than a decade (with the exception of some growth in energy loads in ERCOT). Increases in
peak demands and energy loads in SPP in 2016 and 2017 were due substantially to the
addition of new utilities with additional loads and generation. The same was true for the
apparent jump in MISO’s annual peak demands from 2014 to 2015.
However, some insights on the 2017 energy loads in some of these areas can be gleaned
from partial-year data:
• While Southern Company’s third-quarter earnings report noted that the company’s
total energy sales for 2017 were 2% higher than in the first three quarters of 2016, its
total retail sales were down 4.6%.
• Total energy loads in MISO for the first 11 months of 2017 were down about 1%
compared to the same period in 2016.
This flat-to-slow growth means that as new gas-fired and renewables capacity is added to
the grid, competition increases for an electricity demand pie that is not expanding much, if
at all. This competition will continue to disadvantage coal-fired plants by keeping both
energy market and capacity market prices low for the foreseeable future.
55 Id.
U.S. Coal: More Market Erosion is on the Way 29The U.S. Coal Mining Industry Will
See Less Consumption & Production,
Flat Employment and Distressed
Assets in 2018
The changing mix of electricity generation in the U.S. has a profound impact on the coal-
mining industry, including on its consumption, production and pricing.
Coal Consumption Will Drop by 30 Million Tons
in 2018 and Will Continue Its Long-Term
Decline
Consumption of thermal coal is down 36% in the U.S. over the past decade, declining to an
estimated 666 million tons56 in 2017 from 1.04 billion tons in 2008—an average annual drop of
37 million tons. The 666 million ton estimate of coal consumption for electricity in 2017 is the
lowest consumption figure in more than a decade.
Figure 17: U.S. Coal Consumption for Electricity, 20025 - 2016
1200000
1000000
800000
600000
400000
200000
0
2005 2006 2007 2008 2009 2010 2011 2012 2013 2014 2015 2016 2017
The relative flattening out of coal consumption in 2017 was attributable largely to the
regional impact of increases in natural gas prices during the year. Even though the price of
natural gas rose by 20% in 201757, coal consumption still declined.58 Natural gas prices are
56 This estimate is taken from the January 2018 Energy Information Administration Short Term Outlook, Electric Power Coal
Consumption (2012-2018), https://www.eia.gov/outlooks/steo/report/coal.php.
57 (See: Figure 10: Recent and Forward Natural Gas Prices at Key Hubs in Competitive Wholesale Markets)
58 https://www.eia.gov/outlooks/steo/data/browser/#?v=8. U.S. Electricity, Power Generation Fuel Costs, Coal and Natural
Gas (2012-2018)
U.S. Coal: More Market Erosion is on the Way 30You can also read