GABAB receptor auxiliary subunits modulate Cav2.3-mediated release from medial habenula terminals
←
→
Page content transcription
If your browser does not render page correctly, please read the page content below
RESEARCH ARTICLE

                                     GABAB receptor auxiliary subunits
                                     modulate Cav2.3-mediated release from
                                     medial habenula terminals
                                     Pradeep Bhandari1, David Vandael1, Diego Fernández-Fernández2,
                                     Thorsten Fritzius2, David Kleindienst1, Cihan Önal1, Jacqueline Montanaro1,
                                     Martin Gassmann2, Peter Jonas1, Akos Kulik3,4, Bernhard Bettler2,
                                     Ryuichi Shigemoto1*, Peter Koppensteiner1*
                                     1
                                      Institute of Science and Technology Austria (IST Austria), Klosterneuburg, Austria;
                                     2
                                      Department of Biomedicine, University of Basel, Basel, Switzerland; 3Institute of
                                     Physiology II, Faculty of Medicine, Freiburg, Germany; 4BIOSS Centre for Biological
                                     Signalling Studies, University of Freiburg, Freiburg, Germany

                                     Abstract The synaptic connection from medial habenula (MHb) to interpeduncular nucleus (IPN)
                                     is critical for emotion-related behaviors and uniquely expresses R-type Ca2+ channels (Cav2.3) and
                                     auxiliary GABAB receptor (GBR) subunits, the K+-channel tetramerization domain-containing
                                     proteins (KCTDs). Activation of GBRs facilitates or inhibits transmitter release from MHb terminals
                                     depending on the IPN subnucleus, but the role of KCTDs is unknown. We therefore examined the
                                     localization and function of Cav2.3, GBRs, and KCTDs in this pathway in mice. We show in
                                     heterologous cells that KCTD8 and KCTD12b directly bind to Cav2.3 and that KCTD8 potentiates
                                     Cav2.3 currents in the absence of GBRs. In the rostral IPN, KCTD8, KCTD12b, and Cav2.3 co-
                                     localize at the presynaptic active zone. Genetic deletion indicated a bidirectional modulation of
                                     Cav2.3-mediated release by these KCTDs with a compensatory increase of KCTD8 in the active
                                     zone in KCTD12b-deficient mice. The interaction of Cav2.3 with KCTDs therefore scales synaptic
                                     strength independent of GBR activation.
*For correspondence:
ryuichi.shigemoto@ist.ac.at (RS);
peter.koppensteiner@ist.ac.at (PK)

Competing interests: The
authors declare that no
                                     Introduction
                                     The medial habenula (MHb) is an epithalamic structure that exclusively projects to the interpeduncu-
competing interests exist.
                                     lar nucleus (IPN), with the dorsal MHb projecting to the lateral IPN and the ventral MHb projecting
Funding: See page 25                 to the rostral and central subnuclei of the IPN (Figure 1A). This pathway is involved in various behav-
Received: 10 March 2021              iors, including nicotine addiction and aversion (Agetsuma et al., 2010; Koppensteiner et al., 2016;
Accepted: 28 April 2021              Koppensteiner et al., 2017; Melani et al., 2019; Zhang et al., 2016; Zhao-Shea et al., 2013). A
Published: 29 April 2021             striking property of the MHb-IPN pathway is the prominent presynaptic localization of the R-type
Reviewing editor: Yukiko Goda,
                                     voltage-gated Ca2+ channel 2.3 (Cav2.3), a channel mainly located in postsynaptic elements in other
RIKEN, Japan                         brain areas (Parajuli et al., 2012). Furthermore, activation of presynaptic GABAB receptors (GBRs)
                                     on MHb terminals exerts an unusual facilitatory effect by increasing neurotransmitter release up to
   Copyright Bhandari et al. This
                                     10-fold (Zhang et al., 2016), and this effect appears to be involved in synaptic plasticity
article is distributed under the
                                     (Koppensteiner et al., 2017). Interestingly, this potentiation via presynaptic GBR activation only
terms of the Creative Commons
Attribution License, which           occurs in the glutamatergic/cholinergic pathway from the ventral MHb to the rostral/central IPN,
permits unrestricted use and         whereas in the glutamatergic/substance-P-ergic pathway from the dorsal MHb to the lateral IPN, the
redistribution provided that the     release is attenuated by GBR activation (Melani et al., 2019). Although GBRs are ubiquitously
original author and source are       expressed in these MHb-IPN pathways (Margeta-Mitrovic et al., 1999), the presynaptic localization
credited.                            and function of their auxiliary KCTD subunits is unknown.

Bhandari et al. eLife 2021;10:e68274. DOI: https://doi.org/10.7554/eLife.68274                                                       1 of 28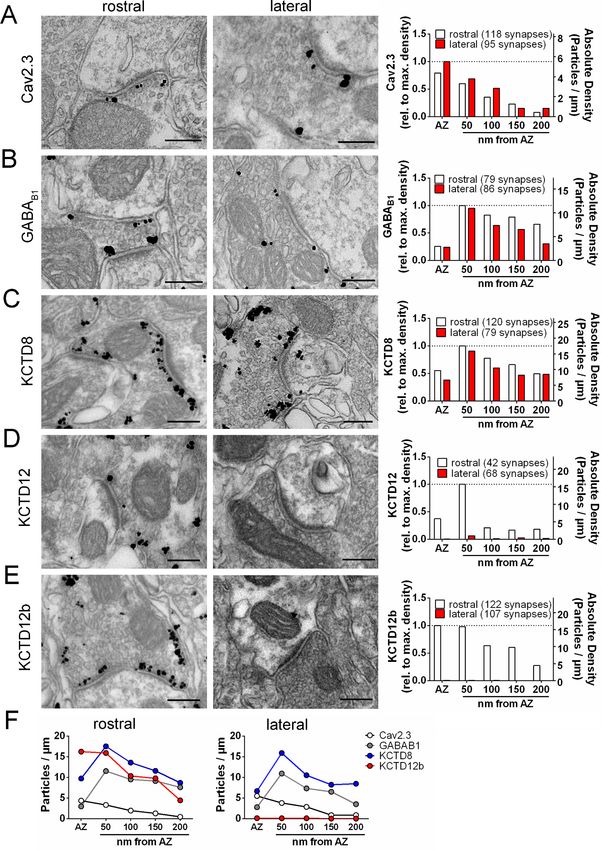
Research article                                                                                                                 Neuroscience

Figure 1. Expression and function of GABAB receptors and Cav2.3 at two parallel MHb-IPN pathways. (A) Schematic drawing of the two MHb-IPN
pathways. In red: the dorsal part of the MHb projects to the lateral subnuclei of the IPN. In blue: the ventral part of the MHb projects to the rostral/
central subnuclei of the IPN. (B) Confocal image of GABAB1 immunofluorescence signal indicates the presence of GABAB receptors (GBRs) in all IPN
subnuclei. (C) In whole-cell recordings of rostral IPN neurons, activation of GBRs by baclofen (1 mM) produced a potentiation of electrically evoked
EPSC amplitudes. Left: example EPSC traces before (black) and during the application of baclofen (red) and after washout of baclofen (blue); middle:
example time course of EPSC amplitudes in one cell; right: averaged time course of relative EPSC amplitude change after baclofen (n = 13 cells/9
mice). (D) Baclofen reduced the amplitude of light-evoked glutamatergic EPSCs in lateral IPN neurons (n = 10 cells/5 mice). (E) Confocal image of
Cav2.3 immunofluorescence signal indicates Cav2.3 presence in MHb axonal projections of both MHb-IPN pathways. (F) Pharmacological inhibition of
Cav2.3 with SNX-482 in whole-cell recordings of rostral IPN neurons. Left: example traces before and after the application of SNX-482; middle: example
time course of EPSC amplitude reduction by SNX-482; right: averaged time course of relative EPSC amplitude reduction by SNX-482. EPSC amplitudes
were reduced by 83% on average (n = 9 cells/9 mice). (G) In Tac1-ChR2-EYFP mice, SNX-482 reduced light-evoked glutamatergic EPSC amplitudes on
average by 52% (n = 8 cells/4 mice). (H, I) Left: Positions of recording and stimulating electrodes in acute thick-slice preparations from Cav2.3 KO mice.
The stimulating electrode was placed on the fasciculus retroflexus just below the MHb, 2–3 mm from the recording sites. The position of the stimulating
electrode and the stimulation intensity remained unchanged between rostral and lateral IPN recordings. Right: 10 Hz EPSC traces of all recorded
neurons (9 cells/3 mice). (J) Cumulative EPSC amplitude plot shows significantly higher EPSC amplitudes in lateral compared to rostral IPN neurons.
***p
Research article                                                                                                 Neuroscience

                                       Four KCTD subunits, KCTD8, 12, 12b, and 16, serve as GBR auxiliary subunits in the brain
                                   (Schwenk et al., 2010). KCTD subunits bind as hetero- and homo-pentamers to GBRs and modulate
                                   their signaling kinetics (Fritzius et al., 2017; Zheng et al., 2019). Structurally, KCTD subunits are
                                   composed of an N-terminal T1 domain and an H1 domain. The T1 domain binds to the GABAB2 sub-
                                   unit, while the H1 domain binds to the Gb subunit of the guanine nucleotide-binding protein (G-pro-
                                   tein) (Schwenk et al., 2010; Turecek et al., 2014; Zheng et al., 2019). X-ray crystallography of the
                                   T1 and H1 domains of KCTD12 and KCTD16 (Lepore et al., 2019; Zheng et al., 2019; Zuo et al.,
                                   2019) revealed that the secondary and tertiary protein structures of those domains are highly con-
                                   served in the KCTD proteins. However, the T1 domain possesses a highly divergent loop between
                                   helix a2 and strand b3 (following the nomenclature from Zuo et al., 2019), while the H1 domain fea-
                                   tures a divergent loop between the strands b4 and b5 (following the nomenclature from
                                   Zheng et al., 2019). These loops are hydrophilic, exposed at the protein surface, and potentially
                                   allow the different KCTD subunits to bind proteins other than GABAB2 or Gb. KCTD8 and 16, but
                                   not KCTD12 and 12b, additionally encode a C-terminal H2 domain. The absence of the H2 domain
                                   enables KCTD12 and 12b to rapidly desensitize GBR responses by uncoupling the Gbg subunits of
                                   the G-protein from effector channels (Turecek et al., 2014). KCTD12 and 12b can form hetero-pen-
                                   tamers with each other but also with KCTD8 and 16 (Fritzius et al., 2017). Compared to the rest of
                                   the brain, the expression patterns of KCTD subunits in the MHb are unique: With the exception of a
                                   weak expression in the cerebellum and superior colliculus, KCTD8 is exclusively and strongly
                                   expressed in MHb and, to a lesser extent, IPN neurons. Furthermore, KCTD12b is exclusively
                                   expressed in the ventral part of the MHb (Metz et al., 2011). In contrast, KCTD12 is weakly
                                   expressed in the ventral part of the MHb, while KCTD16 is expressed in most brain areas but not the
                                   MHb. Based on proteomics studies, voltage-gated Ca2+ channels co-precipitate GBRs and their aux-
                                   iliary KCTD subunits together with release machinery proteins of the presynaptic active zone, includ-
                                   ing SNAP-25, synaptotagmins, synaptobrevin-2, Munc13-1, syntaxins, RIM1, and synapsins, among
                                   others (Müller et al., 2010). Furthermore, KCTD8 and KCTD16 were consistently found to co-purify
                                   with presynaptic Cav2.2 Ca2+ channels (Müller et al., 2010; Schwenk et al., 2016). However, the
                                   functional consequences of these interactions and whether other voltage-gated Ca2+ channels inter-
                                   act with KCTDs remain unknown.
                                       Here, we studied the nano-anatomy of Cav2.3, GBRs, and KCTDs and their roles in the modula-
                                   tion of neurotransmission from the MHb to the IPN. Our results demonstrate that Cav2.3 is located
                                   in the presynaptic active zone of habenular terminals and required for fast neurotransmitter release.
                                   In heterologous cells, we found that KCTD8 and KCTD12b, but not KCTD12, bind to Cav2.3 at the
                                   plasma membrane. Furthermore, Cav2.3 currents were enhanced by co-expression of KCTD8, but
                                   not KCTD12b in the absence of GBRs. Strikingly, genetic deletion of KCTD8 or KCTD12b reduced or
                                   increased, respectively, the probability of neurotransmitter release in the ventral MHb to the rostral
                                   IPN pathway without affecting GBR-mediated potentiation. The increase of release in KCTD12b
                                   knock-out (KO) mice was accompanied by a compensatory recruitment of KCTD8 into the active
                                   zone, where it closely associates with Cav2.3. Furthermore, viral expression of KCTD12b in MHb
                                   neurons reduced the increased release probability in KCTD12b KO mice, whereas overexpression of
                                   KCTD8 in MHb neurons of wild-type mice increased release probability. These results support that
                                   synaptic strength at the MHb-IPN pathway is scaled via GBR-independent Cav2.3–KCTD interactions
                                   in the presynaptic active zone.

                                   Results
                                   Cav2.3 mediates neurotransmission in two distinct MHb–IPN pathways
                                   The MHb to IPN pathway comprises two major projections (Figure 1A). The dorsal MHb projects to
                                   the lateral subnuclei of the IPN and releases glutamate and substance P, whereas the ventral MHb
                                   projects to the rostral and central IPN subnuclei and co-releases glutamate and acetylcholine
                                   (Aizawa et al., 2012; Melani et al., 2019; Molas et al., 2017; Ren et al., 2011). In confocal light
                                   microscopy, immunofluorescence signal for GBRs was detected in all IPN subnuclei (Figure 1B). GBR
                                   activation has been reported to facilitate both electrically and optogenetically evoked neurotransmit-
                                   ter release in the ventral MHb-rostral/central IPN pathway (Koppensteiner et al., 2017;
                                   Zhang et al., 2016), whereas it inhibits release in the dorsal MHb-lateral IPN (Melani et al., 2019).

Bhandari et al. eLife 2021;10:e68274. DOI: https://doi.org/10.7554/eLife.68274                                                    3 of 28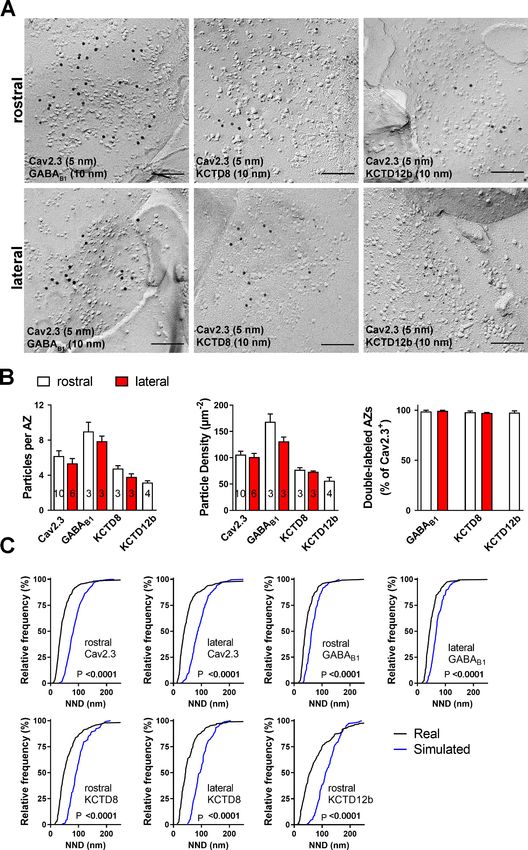
Research article                                                                                                    Neuroscience

                                   We confirmed that rostral IPN neurons exhibit a strong increase in excitatory postsynaptic current
                                   (EPSC) amplitudes following GBR activation with 1 mM baclofen (Figure 1C), whereas EPSC ampli-
                                   tudes were reduced by baclofen in lateral IPN neurons (Figure 1D). Both the rostral/central and lat-
                                   eral subnuclei showed prominent Cav2.3 immunofluorescence signals (Figure 1E), in accordance
                                   with a previous study showing strong and exclusive presynaptic Cav2.3 localization in the IPN
                                   (Parajuli et al., 2012). A previous report tested the functional involvement of Cav2.3 in neurotrans-
                                   mission from the ventral MHb to the IPN by applying Ni2+ (Zhang et al., 2016), an ion known to also
                                   inhibit other Ca2+ channels (Lee et al., 1999). To test Cav2.3 dependency of neurotransmission in
                                   both pathways, we performed whole-cell recordings from IPN neurons in acute brain slices and
                                   applied the Cav2.3 blocker SNX-482 (Newcomb et al., 1998). In rostral and lateral IPN neurons, 1
                                   mM SNX-482 strongly reduced the amplitude of EPSCs by 83% and 52%, respectively (Figure 1F,G).
                                   The SNX-482-mediated reduction in EPSC amplitudes was significantly stronger in the ventral MHb
                                   to rostral IPN pathway compared to the dorsal MHb to lateral IPN pathway (main effect of IPN sub-
                                   nucleus F1, 395 = 213.7, p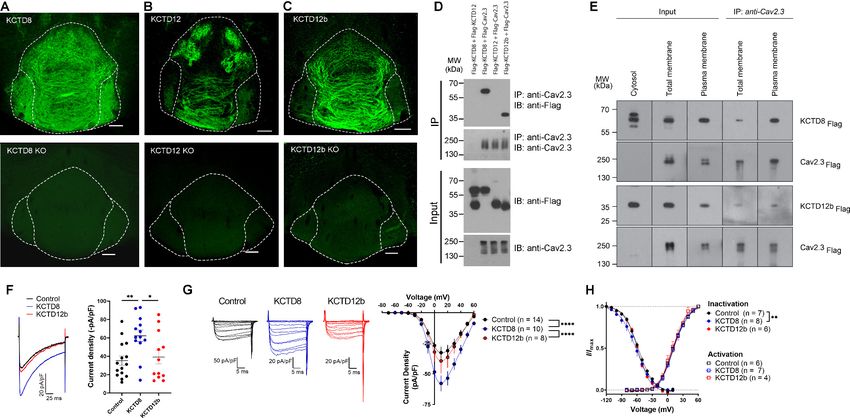
Research article                                                                                                                 Neuroscience

                                     KCTD8 and KCTD12b directly bind Cav2.3 and KCTD8 enhances
                                     currents through Cav2.3 in HEK cells
                                     GBRs strongly modulate release in both pathways. Therefore, we next investigated the expression of
                                     GBR auxiliary subunits, KCTDs, in the IPN. Immunoreactivity for KCTD8 appeared strong in all IPN
                                     subnuclei (Figure 2A), consistent with its strong expression throughout MHb and presynaptic locali-
                                     zation in IPN. KCTD12 immunofluorescence appeared strong in the rostral and central subnuclei but
                                     faint in the lateral subnucleus (Figure 2B). In contrast, immunoreactivity for KCTD12b was only pres-
                                     ent in the rostral and central but not the lateral IPN subnuclei, indicating its absence in the dorsal
                                     MHb-IPN pathway (Figure 2C). While KCTD12 immunofluorescence patterns in the rostral region
                                     suggested a mostly postsynaptic expression, KCTD12b signal showed the characteristic pattern of
                                     cholinergic MHb axons inside the rostral/central IPN, suggesting presynaptic expression. Antibody

Figure 2. KCTD subtype expression in the IPN and interaction of Cav2.3 with KCTD8 and KCTD12b in vitro. (A–C) Confocal images of
immunofluorescence signals of KCTD8, KCTD12, and KCTD12b in the IPN of WT (upper panels) and respective KO mice (lower panels). KCTD8
immunofluorescence was present in all IPN subnuclei, whereas KCTD12 and KCTD12b signals were observed only in the rostral/central but not the
lateral IPN subnuclei. Scale bars: 100 mm. (D) Co-immunoprecipitation from total cell lysates of HEK293T cells transfected with Flag-tagged KCTDs and
Cav2.3. Immunoprecipitation of Cav2.3 co-precipitated KCTD8 and KCTD12b, but not KCTD12. Input lanes (bottom) indicate expression of the tagged
proteins in the cell lysates. (E) KCTDs are co-localized and interact with Cav2.3 at the cell surface of HEK293T cells. The three input lanes to the right
show expression of Flag-tagged KCTD8 (top) and Flag-tagged KCTD12b (bottom) in the cytosol, the total membrane fraction (‘total membrane’) and
the plasma membrane fraction, from left to right. The two IP lanes to the left show that immunoprecipitation of Cav2.3 in the total membrane fraction
(‘total membranes’) and the plasma membrane fraction co-precipitated KCTD8 (top) and KCTD12b (bottom), from left to right. Membrane-bound
Cav2.3 (bottom lanes) is expressed in the total membrane fraction and the plasma membrane fraction, but absent from the cytosol fraction. (F) Whole-
cell recordings from HEK293 cells stably expressing Cav2.3. Ba2+ current densities measured in response to a single depolarizing voltage step from 80
to 10 mV were significantly increased in KCTD8 co-transfected cells. *p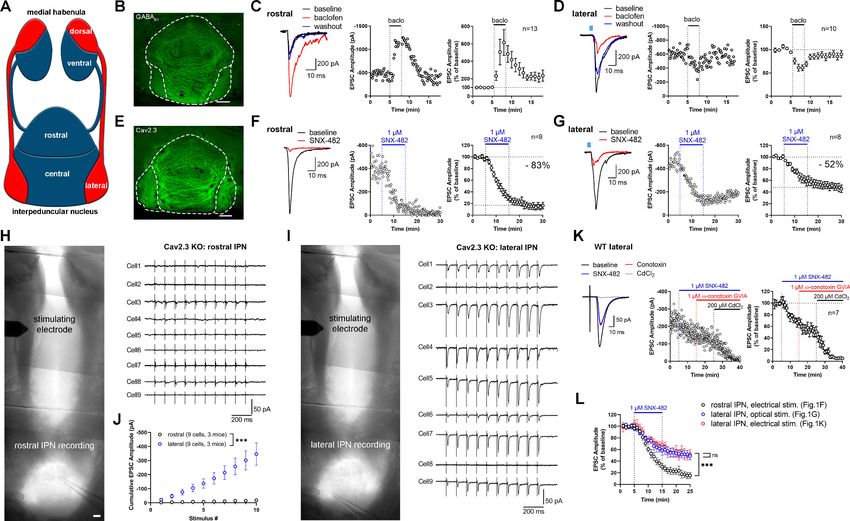
Research article                                                                                                Neuroscience

                                   specificity for all KCTD antibodies was confirmed using the corresponding KO animals (Figure 2A–
                                   C), while the specificity of the anti-Cav2.3 and anti-GABAB1 antibodies has been confirmed previ-
                                   ously (Kulik et al., 2002; Parajuli et al., 2012).
                                      A previous study positioned presynaptic Ca2+ channels at the center of large, macromolecular
                                   complexes that also contained GBRs and KCTDs (Müller et al., 2010), and some KCTDs were found
                                   to co-purify with Cav2.2 subunit of N-type Ca2+ channels in the absence of GBRs (Schwenk et al.,
                                   2016). To test whether presynaptic KCTDs in MHb terminals may directly interact with Cav2.3, we
                                   performed co-immunoprecipitation (co-IP) experiments in HEK293T cells transiently expressing
                                   Cav2.3 and either KCTD8, KCTD12, or KCTD12b. Interestingly, we found selective binding of Cav2.3
                                   to KCTD8 and KCTD12b, but not to KCTD12 (Figure 2D). Plasma membrane preparations (see
                                   Materials and methods) revealed that in HEK293T cells co-expressing Cav2.3 and KCTDs, both
                                   KCTD8 and KCTD12b are highly and similarly enriched in plasma membrane extracts, when com-
                                   pared to total membrane extracts (Figure 2—figure supplement 1; KCTD8: 10.7-fold [±1.9],
                                   KCTD12b: 12.7-fold [±2.6], no significant difference between KCTD8 and KCTD12b, p=0.34,
                                   unpaired t-test). We next performed co-IP experiments using total and plasma membrane extracts
                                   of transfected HEK293T cells and found that both KCTD8 and KCTD12b associate with Cav2.3 at the
                                   plasma membrane (Figure 2E). These results suggest that KCTD8 and KCTD12b in MHb-derived
                                   axon terminals may directly interact with presynaptic Cav2.3, even in the absence of GBRs.
                                      Using a cell line stably expressing human Cav2.3 (Dai et al., 2008), we next co-expressed either
                                   an empty vector (Control), KCTD8, or KCTD12b, and measured Ba2+ currents through Cav2.3. Cur-
                                   rent densities resulting from a single voltage step (–80 mV to 10 mV) were significantly increased in
                                   cells co-expressing KCTD8 compared with control- and KCTD12b-transfected cells (Figure 2F, F2,
                                   37 = 5.614; p=0.0074; Control vs. KCTD8: p=0.0086; Control vs. KCTD12b: p=0.8959; KCTD8 vs.
                                   KCTD12b: p=0.0382; one-way ANOVA with Tukey post hoc test). The current density-to-voltage
                                   relationship showed a significant difference between KCTD8 and both Control- and KCTD12b-trans-
                                   fected cells (Figure 2G; main effect of transfection: F2, 406 = 29.23, p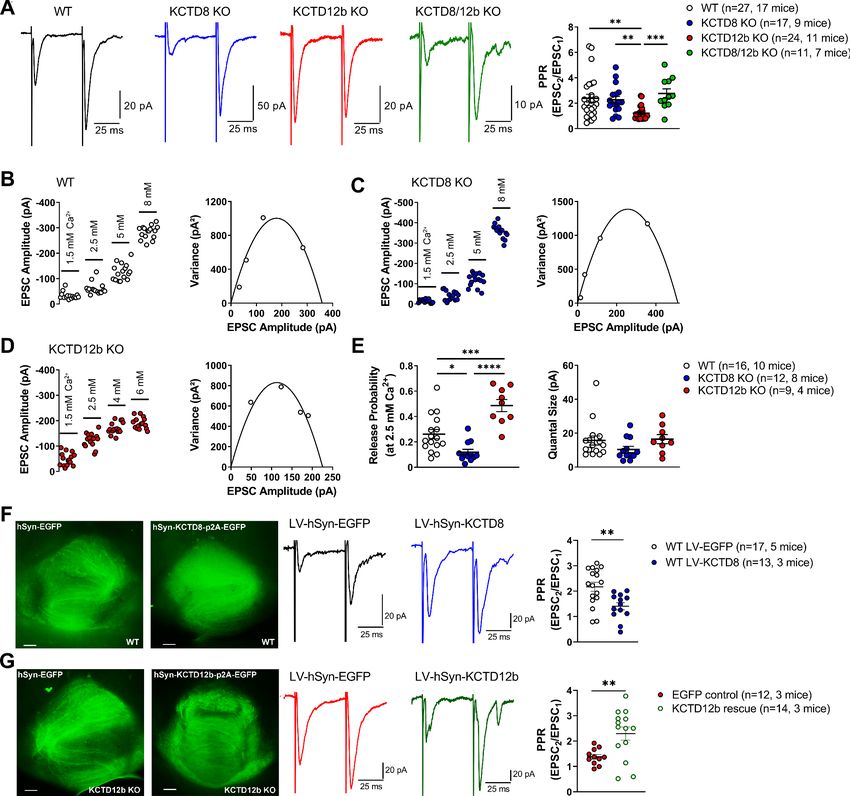
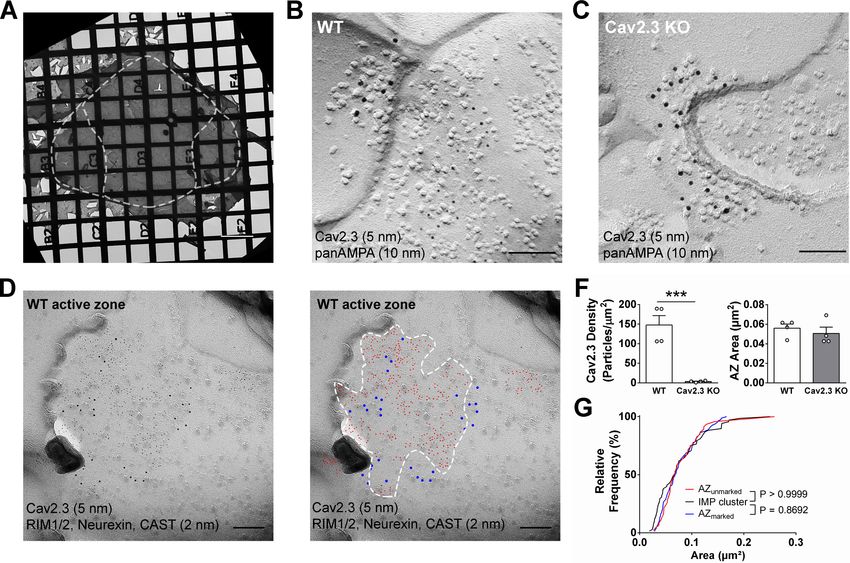
Research article                                                                                                               Neuroscience

Figure 3. Quantification of the presynaptic localization of Cav2.3, GBRs, and KCTDs along the ventral and dorsal MHb-IPN pathways. Transmission
electron microscopy images of 70 nm thick sections following pre-embedding immunolabeled IPN slices for Cav2.3 (A), GABAB1 (B), KCTD8 (C),
KCTD12 (D), and KCTD12b (E) from synapses in the rostral (left images) and lateral (right image) IPN subnuclei. Scale bars: 200 nm. Graph on the right
displays quantification of relative and absolute silver-enhanced gold particle densities in the active zone and at distances of 50–200 nm from the edge
Figure 3 continued on next page

Bhandari et al. eLife 2021;10:e68274. DOI: https://doi.org/10.7554/eLife.68274                                                                   7 of 28
Research article                                                                                                                  Neuroscience

Figure 3 continued
of the active zone (50 nm bins). (F) Absolute labeling densities are summarized for synapses in the rostral (left) and lateral IPN (right). Note the absence
of KCTD12 and KCTD12b particles in presynaptic terminals inside the lateral IPN subnuclei. KCTD12 was not included in panel F because of
predominantly postsynaptic localization inside the rostral IPN. Data was pooled from two animals, showing no significant difference in gold particle
distribution patterns with Kolmogorov-Smirnov test (see Figure 3—figure supplement 1 and Figure 3—figure supplement 2).
The online version of this article includes the following source data and figure supplement(s) for figure 3:
Source data 1. Quantification of the presynaptic localization of Cav2.3, GBRs, and KCTDs along the ventral and dorsal MHb-IPN pathways.
Figure supplement 1. Comparison of distribution of silver-enhanced immunogold particles outside the active zone for Cav2.3, KCTD8, KCTD12, and
KCTD12b in MHb terminals inside the rostral and lateral IPN.
Figure supplement 1—source data 1. Comparison of distribution of silver-enhanced immunogold particles outside the active zone for Cav2.3, KCTD8,
KCTD12, and KCTD12b in MHb terminals inside the rostral and lateral IPN.
Figure supplement 2. Two example pictures of postsynaptic immunogold labeling for KCTD12 in the rostral IPN.

                                          To circumvent potential antigen-masking effects due to the protein-dense active zone region in
                                      conventional pre-embedding immunolabeling, we performed SDS-digested freeze-fracture replica
                                      labeling (SDS-FRL) (Fujimoto, 1995). This method enables unhindered access of antibodies to pro-
                                      teins inside/close to the pre- or postsynaptic membrane specialization and allows for multiple label-
                                      ing with gold particles of distinct sizes (Hagiwara et al., 2005; Indriati et al., 2013; Miki et al.,
                                      2017; Tanaka et al., 2005). In order to distinguish IPN subnuclei, we used an improved version of
                                      the grid-glued SDS-FRL method (Harada and Shigemoto, 2016), which facilitates the preservation
                                      of complete replicas during the handling procedures, a critical requirement for the identification of
                                      IPN subnuclei in the electron microscope (Figure 4A). We detected gold particles for Cav2.3 on the
                                      P-face of the presynaptic active zone and confirmed antibody specificity using Cav2.3 KO mice
                                      (Figure 4B,C,F; average density WT: 147.8 ± 23.9 particles/mm2, n = 4 replicas; KO: 3.4 ± 0.99 par-
                                      ticles/mm2, n = 4 replicas; WT vs. KO: t3 = 5.87, p=0.0099, paired t-test). In addition, we confirmed
                                      the concentrated localization of Cav2.3 within the active zone using co-immunolabelings with a mix-
                                      ture of antibodies against marker proteins for the active zone, RIM1/2, neurexin, and CAST
                                      (Figure 4D; Miki et al., 2017). In the absence of marker protein labeling, demarcation of the presyn-
                                      aptic active zone was based on multiple criteria, including P-face curvature and intramembrane parti-
                                      cle (IMP) size and density. The area of active zones demarcated without marker protein labeling
                                      (AZunmarked) was not significantly different from that with marker labeling (AZunmarked: 0.080 ± 0.0064
                                      mm2, n = 46 active zones, AZmarked: 0.077 ± 0.0040 mm2, n = 80 active zones; p=0.8692, Kolmo-
                                      gorov–Smirnov test) or from the area of postsynaptic IMP clusters on the E-face, the replica equiva-
                                      lent of the postsynaptic density seen in conventional ultrathin sections (IMP cluster: 0.077 ± 0.0059
                                      mm2, n = 68 active zones; p>0.9999, Kolmogorov–Smirnov test), verifying our criteria for active zone
                                      demarcation.
                                          The result of our pre-embedding immunolabeling suggested that Cav2.3, GBR, and KCTDs are
                                      localized in and around the active zone of MHb terminals (Figure 3). In order to confirm that these
                                      molecules are actually co-localized inside the same terminals, we performed double immunolabel-
                                      ings for Cav2.3 and either GABAB1, KCTD8, or KCTD12b in SDS-FRL (Figure 5). We focused on
                                      these main presynaptic KCTDs because immunogold labeling for KCTD12 was observed in few pre-
                                      synaptic terminals (Figure 3D) and was located mostly postsynaptically in the rostral IPN (Figure 3—
                                      figure supplement 2). We found that in ventral MHb terminals in the rostral IPN, Cav2.3 is co-local-
                                      ized with GABAB1, KCTD8, and KCTD12b in over 97% of all Cav2.3-positive active zones (Figure 5A,
                                      B; GABAB1: 98 ± 0.70%, n = 3 replicas; KCTD8: 98 ± 1.10%, n = 3 replicas; KCTD12b: 97 ± 1.8%,
                                      n = 4 replicas). Similar co-localization patterns were seen in dorsal MHb terminals located inside the
                                      lateral IPN (Figure 5A,B; GABAB1: 99 ± 0.69%, n = 3 replicas; KCTD8: 97 ± 0.57%, n = 3 replicas),
                                      with the exception of an absence of KCTD12b. Particle numbers and densities of all tested mole-
                                      cules, except KCTD12b, were comparable between MHb terminals in the rostral and lateral IPN
                                      (Figure 5B). In addition, the nearest-neighbor distances (NND) of all tested molecules were signifi-
                                      cantly smaller than those obtained from simulations of randomly distributed particles (Figure 5C),
                                      suggesting that Cav2.3, GABAB1, and KCTDs are clustered inside the active zone.

Bhandari et al. eLife 2021;10:e68274. DOI: https://doi.org/10.7554/eLife.68274                                                                       8 of 28
Research article Neuroscience Figure 4. SDS-digested freeze-fracture replica labeling confirms Cav2.3 in the active zone of medial habenula terminals in the IPN. (A) Example image of a grid-glued replica containing the whole IPN. White dashed line indicates demarcation of rostral/central and lateral subnuclei. Scale bar: 20 mm. (B) Example image of a presynaptic P-face and a postsynaptic E-face of a habenular synapse in the rostral IPN that was double labeled with antibodies against AMPA receptors (10 nm gold) and Cav2.3 (5 nm gold). Scale bar: 100 nm. (C) Example image of a similar synaptic profile double labeled with antibodies against AMPA receptors (10 nm gold) and Cav2.3 (5 nm gold) in the rostral IPN of a Cav2.3 KO mouse. Scale bar: 100 nm. (D) Left: double labeling of a WT carbon-only replica with antibodies against Cav2.3 (5 nm gold) and a mixture of active zone proteins (2 nm gold), including RIM1/2, CAST, and neurexin. Right: the same image with additional coloring of 2 nm (red) and 5 nm (blue) particles and demarcation of the active zone area based on active zone-marker labeling. Scale bars: 100 nm. (F) Left: quantification of Cav2.3 labeling densities in the presynaptic P-face in WT and Cav2.3 KO mice. ***p
Research article                                                                                                               Neuroscience

Figure 5. Co-localization of Cav2.3 with GBR and KCTDs in the active zone of medial habenula terminals. (A) Active zones double labeled for Cav2.3
and either GABAB1 (left), KCTD8 (middle), or KCTD12b (right) in IPN replicas. Top row images are from presynaptic terminals in the rostral IPN; bottom
row images are from presynaptic terminals in the lateral IPN. Scale bar: 100 nm. (B) Quantification of active zone immunolabeling in the rostral and
lateral IPN. With the exception of the absence of KCTD12b in lateral IPN terminals, absolute particle numbers per active zone (left graph) and particle
Figure 5 continued on next page

Bhandari et al. eLife 2021;10:e68274. DOI: https://doi.org/10.7554/eLife.68274                                                                 10 of 28
Research article                                                                                                               Neuroscience

Figure 5 continued
densities (middle graph) are comparable between MHb terminals in the rostral and lateral IPN. Right graph: Over 97% of active zones positive for
Cav2.3 labeling also show labeling for one of the other molecules (GABAB1, KCTD8, or KCTD12b), suggesting co-localization of all presynaptic
molecules inside the same active zone. Numbers inside the bars indicate the number of replicas used for each quantification. (C) Nearest-neighbor
distance (NND) for all presynaptic molecules in MHb terminals inside the rostral and lateral IPN based on the real (black line) and simulated random
distribution (blue line). Smaller NND values in real distributions compared to simulation suggest clustering of all presynaptic molecules. p-values
calculated via Kolmogorov–Smirnov test.
The online version of this article includes the following source data for figure 5:
Source data 1. Co-localization of Cav2.3 with GBR and KCTDs in the active zone of medial habenula terminals.

                                     KO lines with similar intensities (Figure 6—figure supplement 1; WT: 615.1 ± 148.9% of baseline;
                                     n = 13; KCTD8 KO: 470.8 ± 73.5%; n = 9; KCTD12b KO: 485.4 ± 146.6%; n = 12; KCTD8/12b double
                                     KO: 445.8 ± 76.2%; n = 10; F4, 51 = 0.4723, p=0.7558, one-way ANOVA), suggesting that KCTDs are
                                     not involved in the GBR-mediated enhancement of EPSC amplitudes.
                                         PPR values are generally thought to be inversely correlated with release probability
                                     (Dobrunz and Stevens, 1997). Therefore, our findings suggest that basal release in KCTD12b KO
                                     mice is higher than in WT and KCTD8 KO mice and that this effect is KCTD8 dependent. To confirm
                                     the increase in release probability in KCTD12b KO mice, we performed variance-mean analysis
                                     (Figure 6B–E) to estimate the values of release probability (at 2.5 mM external Ca2+) and quantal
                                     size (Figure 6E; Clements and Silver, 2000). Compared with WT mice (WT release probability:
                                     0.26 ± 0.04, n = 16 cells), the release probability from ventral MHb terminals of KCTD12b KO mice
                                     (0.49 ± 0.05, n = 9 cells) was significantly increased (Figure 6E; F2, 34 = 21.23, p
Research article Neuroscience Figure 6. KCTDs modulate release probability of ventral MHb terminals. (A) In whole-cell recordings from rostral IPN neurons, paired-pulse ratios (PPR) of electrically evoked glutamatergic excitatory postsynaptic currents (EPSCs) were significantly lower in KCTD12b KO mice compared with WT, KCTD8 KO, and KCTD8/12b double KO mice; **p
Research article Neuroscience
Figure 6 continued
Figure supplement 1. Baclofen still potentiated release in all KCTD KO lines.
Figure supplement 1—source data 1. Baclofen still potentiated release in all KCTD KO lines.
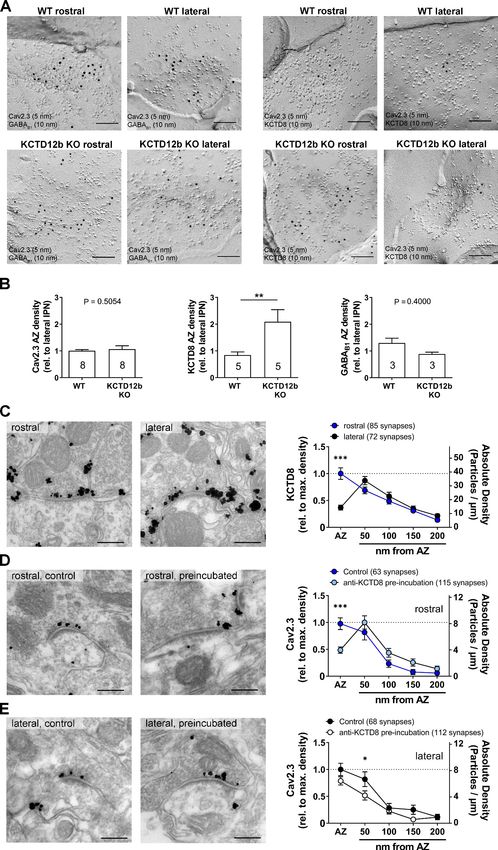
relative to the lateral IPN (Figure 7B; WT rostral: 1.01 ± 0.04 fold of lateral IPN, n = 8 replicas from
eight mice; KCTD12b KO: 1.06 ± 0.13 fold of lateral IPN, n = 8 replicas from eight mice; p=0.5054,
Mann–Whitney test). Interestingly, the relative density of KCTD8 in the active zone of MHb terminals
was increased approximately twofold in KCTD12b KO mice compared with those of WT mice
(Figure 7B; WT rostral: 0.84 ± 0.12 fold of lateral IPN, n = 5 replicas from five mice; KCTD12b KO:
2.09 ± 0.45 fold of lateral IPN, n = 5 replicas from five mice; p=0.0079, Mann–Whitney test). This
result indicates that the increased release probability in KCTD12b KO mice could be ascribable to a
compensatory increase of KCTD8 in the active zone resulting in enhanced association of KCTD8 with
Cav2.3. On the other hand, GABAB1 expression in the presynaptic active zone of MHb terminals was
not significantly different between WT and KCTD12b KO (Figure 7B; WT rostral: 1.30 ± 0.18 fold of
lateral IPN, n = 3 replicas from three mice; KCTD12b KO: 0.89 ± 0.07 fold of lateral IPN, n = 3 repli-
cas from three mice; p=0.4000, Mann–Whitney test). To confirm the compensatory increase of
KCTD8 in ventral MHb terminals in the absence of KCTD12b, we next performed pre-embedding
immunolabeling for KCTD8 in presynaptic terminals in rostral and lateral IPN of KCTD12b KO mice
(Figure 7C). The distribution pattern of KCTD8 in the lateral IPN showed peak densities in the peri-
synaptic region, as seen in WT (Figure 3C). In contrast, the density of KCTD8 particles in the active
zone, but not in the peri- or extrasynaptic area of rostral IPN synapses was significantly increased
compared with lateral IPN synapses (main effect of presynaptic distribution: F4, 775 = 31.65,
pResearch article Neuroscience Figure 7. Absence of KCTD12b leads to a compensatory increase of KCTD8 inside the active zone of ventral MHb terminals. (A) Example images of active zones containing Cav2.3 and either GABAB1 (left) or KCTD8 (right) in replicas of WT (upper row) and KCTD12b KO IPN tissue (lower row). Scale bars: 100 nm. (B) Quantification of relative densities for Cav2.3, KCTD8, and GABAB1 in active zones located in the rostral IPN of WT and KCTD12b KO mice. Densities were normalized to the average density in MHb terminals inside the lateral IPN of the same replica. The number inside the bars Figure 7 continued on next page Bhandari et al. eLife 2021;10:e68274. DOI: https://doi.org/10.7554/eLife.68274 14 of 28
Research article                                                                                                                 Neuroscience

Figure 7 continued
indicates the number of replicas used for quantification. **p
Research article Neuroscience
fits the data of the Allen Brain Atlas, which shows no expression of Cav2.1 and Cav2.2 in MHb neu-
rons (Figure 8—figure supplement 1; images from Allen Institute for Brain Science, 2004)
(Lein et al., 2007). Although the predominant presynaptic localization of Cav2.3 immunoreactivity
was previously reported (Parajuli et al., 2012), the functional implications of this localization were
not determined. Our data confirmed that both MHb-IPN pathways heavily rely on Cav2.3 for release.
Interestingly, projections from the ventral MHb to the rostral IPN were more affected by SNX-482
than the dorsal MHb to lateral IPN pathway. Using Cav2.3 KO mice, we found residual EPSC
responses in lateral but not rostral IPN neurons, confirming that exclusively Cav2.3 mediates trans-
mitter release from ventral MHb terminals. The remaining release from dorsal MHb terminals in the
lateral IPN of Cav2.3 KO mice could be explained either by a compensatory upregulation of other
Ca2+ channels or by the presence of additional Ca2+ channels in WT mice. In dorsal MHb terminals
of WT mice, the SNX-482-insensitive EPSC component was also insensitive to w-conotoxin GVIA, rul-
ing out N-type Ca2+ channels, but was completely abolished by CdCl2. Therefore, dorsal MHb termi-
nals likely express Cav2.3 together with other Ca2+ channels, potentially L-type Ca2+ channels.
Role of KCTDs in potentiation of Cav2.3-mediated release by GBR
activation
A previous report of the potentiating action of presynaptic GBRs on cholinergic MHb terminals iden-
tified Cav2.3 as a critical mediator of this effect, based on the observations that both genetic abla-
tion of Cav2.3 and pharmacological inhibition of Cav2.3 with Ni+ prevented the potentiation
(Zhang et al., 2016). Given the modulatory roles of KCTDs in shaping GBR effector responses
(Fritzius et al., 2017), we initially hypothesized that the unique repertoire of KCTDs in ventral MHb
neurons may be involved in the facilitatory action of GBRs. However, deletion of neither KCTD8,
KCTD12b, nor both prevented the potentiation of EPSC amplitudes by baclofen, suggesting a
KCTD-independent effect.
Regulation of Cav2.3-mediated release by KCTDs
In addition to the co-localization of Cav2.3 with KCTDs at the active zone in habenular terminals, we
identified a hitherto unknown direct interaction of Cav2.3 with KCTD8 and KCTD12b in vitro. Previ-
ous proteomics studies revealed co-precipitations of N-type/Cav2.2 Ca2+ channels with KCTD8 and
KCTD16, but no other KCTD Cav2 interactions were reported (Müller et al., 2010; Schwenk et al.,
2016). Possibly, the use of total brain extracts may have limited detection to the most prominent
protein interactions. Thus, brain-wide approaches to study presynaptic Ca2+ channel-interacting pro-
teins may have failed to detect interactions uniquely occurring inside MHb terminals. In contrast, our
pre-embedding EM approach utilizing interference in Cav2.3 immunogold labeling by steric hin-
drance with KCTD8 antibody in the AZ of MHb terminals (Figure 7D) indicates a close association in
situ of these molecules within 16 nm (two times of IgG size 8 nm), if not a direct binding.
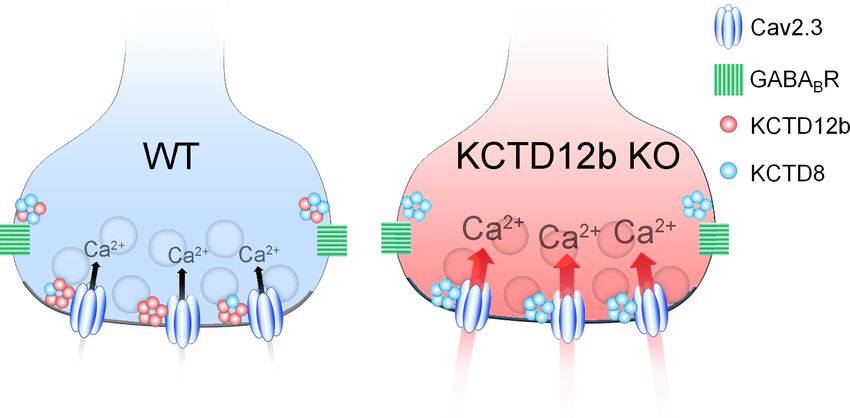
The selective KO of KCTD8 lowered basal levels of release probability from ventral MHb terminals
below that of WT synapses. On the other hand, KO of KCTD12b resulted in a significant increase of
basal release probabilities. This finding of modulation of release independent of GBR activation
could be explained by the current-enhancing effects of KCTD8 on Cav2.3 observed in a heterolo-
gous expression system. Since the probability of neurotransmitter release is relatively low in WT ter-
minals (0.26), the additional reduction in release probability in KCTD8 KO mice (0.12) may not be
detectable by PPR measures. An important indication that KCTD8 functionally increases synaptic
strength was the observation that viral overexpression of KCTD8 in WT ventral MHb neurons signifi-
cantly lowered PPR values compared with EGFP controls. This result suggests that KCTD8 and
KCTD12b may be in a state of dynamic balance. Creating an imbalance appears to result in altera-
tions in synaptic strength. This possibility would be in line with our pre-embedding EM result, with
KCTD12b showing peak densities inside the active zone of ventral MHb terminals, whereas KCTD8
shows peak expression in the peri-synaptic region. This could be an indication for the preferred
interaction of synaptic Cav2.3 with KCTD12b over KCTD8 due to spatial proximity or higher binding
affinity. Although the increase in release probability at ventral MHb terminals is likely caused by a
direct effect of KCTD8 on Cav2.3, it is unknown whether other Ca2+ channels involved in transmitter
release from dorsal MHb terminals are equally affected by KCTD8.
Bhandari et al. eLife 2021;10:e68274. DOI: https://doi.org/10.7554/eLife.68274 16 of 28Research article Neuroscience
It is unclear whether a compensatory increase of KCTD12b occurs in KCTD8 KO mice. Our initial
results from WT pre-embedding EM indicate that KCTD12b displays peak densities in the active
zone, whereas KCTD8 shows peak densities in the peri-synaptic region. Therefore, although it may
be possible to see a compensatory increase in KCTD12b in the active zone of KCTD8 KO mice, due
to the weaker expression of KCTD8 in the WT active zone, such an increase would be expected to
be smaller than the compensatory increase seen in KCTD12b KO animals. Furthermore, the func-
tional consequence of a compensatory increase in KCTD12b in the active zone in KCTD8 KO mice
would not be detected in our functional experiments, as KCTD12b did not alter Cav2.3 function in
vitro and KCTD12b has no effects on PPR in the absence of KCTD8 (no significant difference
between KCTD8 KO and KCTD8/12b double KO in Figure 6A). Our results suggest that the rela-
tively mild reduction in release probability seen in KCTD8 KO mice resulted from removal of the
comparatively low levels of KCTD8 from the WT active zone, rather than from a compensatory
increase in KCTD12b.
To induce synaptic plasticity in the ventral MHb to IPN pathway, release of glutamate, activation
of postsynaptic Ca2+-permeable AMPA receptors on GABAergic IPN neurons, and subsequent retro-
grade release of GABA to activate presynaptic GABAB receptors on MHb terminals are required
(Koppensteiner et al., 2017). Therefore, KCTD-mediated modulation of release probability could
determine a ventral MHb synapse’s propensity to undergo and express activity-dependent plasticity.
Future studies may provide additional insights into whether physiological learning paradigms affect-
ing the MHb-IPN pathway, such as the formation and extinction of aversive memories
(Agetsuma et al., 2010; Koppensteiner et al., 2017; Melani et al., 2019; Zhang et al., 2016),
could alter the ratio of KCTD8 to 12b.
Overall, our study provided new insights into the physiological role of presynaptic Cav2.3, GBRs,
and their auxiliary KCTD subunits in an evolutionary conserved neuronal circuit. It remains to be
determined whether the prominent presence of presynaptic KCTDs at other synapses (Müller et al.,
2010) could be an indication of similar neuromodulatory function of KCTDs in different pathways of
the brain.
Materials and methods
Key resources table
Reagent type
(species) or Source or Additional
resource Designation reference Identifiers information
Strain, strain C57BL/6J The Jackson #000664
background Laboratory
(Mus musculus, ♂)
Strain, strain BALB/cJ The Jackson #000651
background Laboratory
(Mus musculus, ♂)
Strain, strain Cav2.3 KO (gene: Cacna1e) Prof. Tsutomu Tanabe,
background (Saegusa et al., 2000)
(Mus musculus, ♂)
Strain, strain KCTD8 KO Prof. Bernhard Bettler,
background (gene: Kctd8) (Schwenk et al., 2010)
(Mus musculus, ♂)
Strain, strain KCTD12 KO Prof. Bernhard Bettler,
background (gene: Kctd12) (Schwenk et al., 2010)
(Mus musculus, ♂)
Strain, strain KCTD12b KO Prof. Bernhard Bettler,
background (gene: Kctd12b) (Schwenk et al., 2010)
(Mus musculus, ♂)
Strain, strain KCTD8/12b double This paper
background KO (genes:
(Mus musculus, ♂) Kctd8/Kctd12 b)
Continued on next page
Bhandari et al. eLife 2021;10:e68274. DOI: https://doi.org/10.7554/eLife.68274 17 of 28Research article Neuroscience
Continued
Reagent type
(species) or Source or Additional
resource Designation reference Identifiers information
Strain, strain Tac1-IRES-Cre The Jackson #021877
background (B6;129S- Laboratory
(Mus musculus, ♂♀) Tac1tm1.1(cre)Hze/J)
Strain, strain Ai32 The Jackson #012569
background (B6;129S- Laboratory
(Mus musculus, ♂♀) Gt(ROSA)
26
Sortm32(CAG-
COP4*H134R/EYFP)Hze
/J)
Strain, strain Tac1-ChR2-EYFP Offspring of Tac1-
background IRES-Cre and
(Mus musculus, ♂) Ai32 mice
Genetic LV–hSyn–3xFlag/ VectorBuilder Custom-made
reagent (virus) mKCTD8[NM_ GmbH
175519.5]/
P2A/EGFP
Genetic reagent (virus) LV–hSyn–3xFlag/ VectorBuilder Custom-made
mKCTD12b[NM_ GmbH
175429.4]/
P2A/EGFP
Genetic reagent (virus) LV–hSyn–EGFP VectorBuilder Custom-made
GmbH
Cell line (human) HEK293T ATCC, https://web.expasy.org/
(Seddik et al., 2012) cellosaurus/CVCL_0063
Cell line (human) HEK293 cells stably Prof. David
expressing a1E-3 J. Adams,
(Berecki et al., 2014)
Antibody Guinea pig Genovac, Custom-made antibody,
polyclonal (Parajuli et al., 2012) 1 mg/ml for IHC,
anti-Cav2.3 8 mg/ml for SDS-FRL
Antibody Rabbit polyclonal Prof. Akos Kulik, Custom-made
anti-GABAB1 (Kulik et al., 2002) antibody, final
concentration:
(1 mg/ml) for IHC,
(2 mg/ml) for SDS-FRL
Antibody rabbit polyclonal Prof. Bernhard Custom-made antibody,
anti-KCTD8 Bettler, final concentration:
(Schwenk et al., 2010) (1 mg/ml) for IHC,
(4 mg/ml) for SDS-FRL
Antibody Rabbit polyclonal Prof. Bernhard Custom-made antibody,
anti-KCTD12 Bettler, final concentration:
(Schwenk et al., 2010) (1 mg/ml) for IHC,
(4 mg/ml) for SDS-FRL
Antibody Rabbit polyclonal Prof. Bernhard Custom-made antibody,
anti-KCTD12b Bettler, final concentration:
(Schwenk et al., 2010) (1 mg/ml) for IHC,
(4 mg/ml) for SDS-FRL
Antibody Rabbit polyclonal Synaptic Systems 140 203 final concentration:
anti-RIM1/2 (5 mg/ml) for SDS-FRL
Antibody Rabbit polyclonal Prof. Watanabe, final concentration:
anti-CAST (Hagiwara et al., 2018) (3 mg/ml) for SDS-FRL
Antibody Rabbit polyclonal Prof. Watanabe, final concentration:
anti-Neurexin (Miki et al., 2017) (5 mg/ml) for SDS-FRL
Peptide, SNX-482 hellobio HB1235
recombinant
protein
Continued on next page
Bhandari et al. eLife 2021;10:e68274. DOI: https://doi.org/10.7554/eLife.68274 18 of 28Research article Neuroscience
Continued
Reagent type
(species) or Source or Additional
resource Designation reference Identifiers information
Peptide, w-Conotoxin GVIA Alomone Labs 106375-28-4
recombinant
protein
commercial Plasma membrane Abcam ab 65400
assay or kit extraction kit
Chemical R(+)-Baclofen Merck G013
compound, hydrochloride
drug
Chemical 1(S),9(R)-( )- Merck 14343
compound, Bicucullin-Methiodid
drug
Chemical Hexamethonium Tocris 4111
compound, bromide
drug
Chemical Mecamylamine Tocris 2843
compound, hydrochloride
drug
Chemical Cadmiumchloride Merck 202908
compound,
drug
Software, Graphpad Graphpad https://www.graphpad.
algorithm Prism 8 com/scientific-
software/prism/
Software, MATLAB MathWorks https://www.
algorithm mathworks.com/
products/matlab.
html?s_tid=hp_
products_matlab
Software, Reconstruct John C. Fiala, https://synapseweb.
algorithm Ph.D. clm.utexas.edu/
software-0
Animals
Wild-type C57BL/6J (Jax, Bar Harbor, ME; #000664) and BALB/cJ (Jax, #000651) mice were initially
purchased from Jackson Laboratory. Homozygous KCTD KO lines were generated by the lab of
Bernhard Bettler at the University of Basel (Schwenk et al., 2010). For KCTD8 KO line generation,
exon one containing ATG and most of the open reading frame (ORF) of the Kctd8 gene
(MGI:2443804) was replaced with a loxP-flanked neo. To generate KCTD12 KO mice, 50 part of exon
one containing complete ORF of the Kctd12 gene (MGI:2145823) was replaced with a loxP-flanked
neo (Cathomas et al., 2015). Similarly, KCTD12b KO line was generated by replacing the 50 part of
exon three containing complete ORF of the Kctd12b gene (MGI:2444667) with a loxP-flanked neo.
All KCTD KO lines had the neo removed by crossing founders with a Cre-deleter line, leaving one
loxP site behind. The KCTD8/12d double KO line was generated by mating F2 hybrids of the paren-
tal lines. Background strains of KCTD KO lines were as follows: KCTD8 (C57BL/6J and 129), KCTD12
(C57BL/6J, 129, BALB/cJ), KCTD12b (BALB/cJ), and KCTD8/12b (C57BL/6J, 129, BALB/cJ). Cav2.3
KO mice were generated by the lab of Tsutomu Tanabe (Saegusa et al., 2000). To obtain Tachyki-
nin1 (Tac1)-ChR2-EYFP mice, we crossed Tac1-Cre (Jax, #021877) with Ai32 (Jax, #012569) mice. All
mice were bred at the preclinical facility of IST Austria on a 12:12 light–dark cycle with access to
food and water ad libitum. All experiments were performed in accordance with the license approved
by the Austrian Federal Ministry of Science and Research (Animal license number: BMWFW-66.018/
0012-WF/V/3b/2016) and the Austrian and EU animal laws. Only male mice aged 2–5 months were
used for all experiments.
Bhandari et al. eLife 2021;10:e68274. DOI: https://doi.org/10.7554/eLife.68274 19 of 28Research article Neuroscience
Transcardial perfusion for brain fixation
Mice were anaesthetized with a mixture of ketamine (90 mg/kg body weight) xylazine (4.5 mg/kg)
solution intraperitoneally, and 25 mM ice-cold phosphate-buffered saline (PBS) was transcardially
perfused through the left ventricle at a flow rate of 7 ml/min for 30–60 s. Subsequently, paraformal-
dehyde (PFA) solution was perfused for 12 min. PFA solutions of different concentrations were used
for confocal imaging (4% PFA [TAAB Laboratories Equipment Ltd., Aldermaston, UK] and 15% picric
acid in 0.1 M phosphate buffer, PB), pre-embedding (4% PFA and 15% picric acid in 0.1 M PB
+0.05% glutaraldehyde [TAAB]), and SDS-digested freeze-fracture replica labeling (SDS-FRL, 2%
PFA and 15% picric acid in 0.1 M PB). The pH of all PFA solutions was adjusted to 7.4 ± 0.05 with
HCl. After perfusion, the brain was excised and placed in 0.1 M PB and sectioned within 3 days. Sli-
ces of different thickness (50 mm for confocal microscopy and pre-embedding, 70 mm for SDS-FRL)
were cut with a vibratome (Linear-Pro7, Dosaka, Japan) in ice-cold 0.1 M PB.
Immunohistochemistry
Brain slices containing the IPN were washed with phosphate-buffered saline (PBS) and subsequently
incubated in blocking buffer (10% normal goat serum, 2% BSA, 0.5% Triton-X100 in 0.1 M PBS) for 1
hr prior to incubation with primary antibodies: guinea pig anti-Cav2.3 (1 mg/ml, two overnight [O/N],
Genovac), rabbit anti-GABAB1 (B17, 1 mg/ml, 1 O/N [Kulik et al., 2002]), rabbit anti-KCTD8 (1 mg/ml,
Bettler lab, Univ. Basel), rabbit anti-KCTD12 (1 mg/ml, 1 O/N, Bettler lab, Univ. Basel), and rabbit
anti-KCTD12b (polyclonal, raised against a synthetic peptide comprised of the N-terminal amino
acids 1–16 of KCTD12b) (1 mg/ml, 1 O/N, Bettler lab, Univ. Basel) (Metz et al., 2011;
Schwenk et al., 2010). Brain sections were washed in PBS and subsequently incubated for 1 hr in
secondary antibody (1:500, Alexa-488 anti-guinea pig [Molecular Probes, Eugene, OR] or Alexa-488
anti-rabbit [Molecular Probes]). Sections were mounted onto glass slides, and images were taken
with an LSM 800 (Zeiss, Oberkochen, Germany) confocal microscope.
Pre-embedding immunolabeling
Brain slices were washed in 0.1 M PB (two times, 10 min each) and cryo-protected by incubation in
0.1 M PB containing 20% sucrose O/N at 4˚C. The next day, slices underwent three cycles of freeze-
thawing by freezing the slices on liquid nitrogen for 1 min and thawing them in 20% sucrose on a
hot plate (50˚C) for 2 min. Slices were washed in 0.1 M PB (10 min) followed by washing in TBS (three
times, 20 min each). Free aldehydes were quenched by incubating slices in 50 mM glycine (Sigma–
Aldrich, St. Louis, MO) in TBS (10 min). After washing in TBS (three times, 20 min each), slices were
blocked with blocking buffer (10% NGS, 2% BSA in TBS, 1 hr). Primary antibody incubation was
done with respective antibodies in 2% BSA solution for 2 O/N at 4˚C. The concentration of antibod-
ies was 1 mg/ml for Cav2.3, KCTD8, KCTD12, KCTD12b, and GABAB1. For steric hindrance experi-
ments, slices were pre-incubated with 2 mg/ml of anti-KCTD8 antibody (2 O/N), followed by
incubation with biotinylated anti-rabbit secondary antibody (1:100, 2 O/N) before incubation with
anti-Cav2.3 antibody (2 O/N). Subsequently, slices were rinsed in TBS (three times, 20 min each) and
incubated in respective secondary antibodies (1:100) O/N at 4˚C in 2% BSA in TBS. For Cav2.3, 1.4
nm gold-conjugated anti-guinea pig antibody (Nanoprobes, Yaphank, NY) and for all other antibod-
ies, i.e. GABAB1, KCTD8, KCTD12, and KCTD12b, 1.4 nm gold-conjugated anti-rabbit antibody
(Nanoprobes) was used. Slices were washed in TBS and PBS (two times, 20 min each) followed by
post-fixation in 1% glutaraldehyde in PBS (10 min), washing in PBS (three times, 10 min), and
quenching of free glutaraldehyde in 50 mM glycine in PBS (10 min). Finally, slices were washed in
PBS (three times, 10 min each) and Milli-Q (MQ) H2O (three times, 5 min each).
For silver intensification of immunogold particles, Nanoprobes silver intensification (Nanoprobes)
component A (initiator) and B (moderator) were mixed and vortexed, followed by the addition of
component C (activator). After vortexing, slices were incubated in the mixture for 9 min 15 s in the
dark. Tubes were tapped every 2 min for uniform intensification. Slices were washed with MQ water
(three times, 10 min each) and in 0.1 M PB (10 min), followed by post-fixation in 1% OsO4 in 0.1 M
PB (20 min in the dark). After osmification, slices were washed in 0.1 M PB (10 min) and in MQ water
(three times, 5 min each) and counter-stained in 1% uranyl acetate (Al-labortechnik, Zeillern, Ger-
many) in MQ H2O (35 min in the dark). Subsequently, slices were serially dehydrated in ethanol solu-
tions of different concentrations in ascending order up to 100% (50–95% ethanol in five steps, 5 min
Bhandari et al. eLife 2021;10:e68274. DOI: https://doi.org/10.7554/eLife.68274 20 of 28Research article Neuroscience
each; 100% ethanol two times, 10 min each) and then washed with propylene oxide (Sigma–Aldrich;
two times, 10 min each). Slices were then submerged in Durcupan resin (Sigma –Aldrich; mixture of
components A, B, C, and D in proportion of 10:10:0.3:0.3, respectively) for 1 O/N at room tempera-
ture (RT).
For flat embedding, each slice was isolated on a silicon-coated glass slide, covered with an
ACLAR fluoropolymer film (Science Services, Munich, Germany) and incubated at 37˚C (1 hr) fol-
lowed by incubation at 60˚C (2 O/N). For re-embedding, tissue containing the rostral or lateral IPN
was excised with a surgical blade, placed into the lid of a plastic tube (TAAB), which was then filled
with Durcupan resin and incubated at 60˚C (2 O/N). Each resin block was trimmed using a Leica EM
TRIM2 to remove the resin surrounding the sample. The resin above the sample in the trimmed
block was further cut at 200 nm increments using a glass knife in the ultramicrotome Leica EM UC7
until the sample was exposed. Seventy nanometer sections were cut with a diamond knife (Diatome
Ultra 45˚). A small ribbon of floating sections was collected and mounted onto a copper-grid coated
with formvar. Once the grid was dry, it was stored in a grid box for further observation in Tecnai10
(FEI; accelerating voltage 80 kV) or Tecnai 12 (FEI; accelerating voltage 120 kV) transmission electron
microscopes.
SDS-digested freeze-fracture replica preparation and labeling
Brain slices (70 mm) of mice transcardially perfused with 2% PFA in 0.1 M PB were prepared, and the
whole IPN was manually excised. Tissue was then incubated in 30% glycerol in 0.1 M PB O/N for
cryo-protection. The next day, tissue samples were transferred into gold or copper carriers and fro-
zen under high pressure (>300 bar) using an HPM010 (Leica, Wetzlar, Germany). Frozen samples
were stored in liquid nitrogen until further processing. To craft freeze-fracture replicas, two gold car-
riers containing frozen tissue samples were placed in a carrier holder in liquid nitrogen, which was
inserted into the freeze-fracture machine (BAF060, Leica) and left to equilibrate to --117˚C under
high vacuum (2.0 10 7–1.0 10 6 mbar) for 20 min. Subsequently, tissue was fractured and a car-
bon layer (5 nm at a rate of 0.1–0.3 nm/s) was evaporated onto the tissue at a 90˚ angle, followed by
a platinum/carbon layer (2 nm at a rate of 0.06–0.1 nm/s) applied at a 60˚ angle and another carbon
layer (20 nm at a rate of 0.3–0.6 nm/s) applied at a 90˚ angle. For the preparation of carbon-only rep-
licas, the second layer consisted of a 5 nm carbon layer applied at a 60˚ angle. After evaporation,
replicas were removed from the machine and placed in tris-buffered saline (TBS, 50 mM). Subse-
quently, replicas were glued (tissue-side up) onto a finder grid and the glue (optical adhesive 61,
Norland, Cranbury, NJ) was hardened by applying UV light for 20 s and then transferred into SDS-
solution containing: 2.5% SDS, 20% sucrose in 15 mM Tris buffer (pH 8.3). Tissue was subsequently
digested by incubating the replicas for 48 hr at 60˚C under gentle agitation (50 rpm shaker), fol-
lowed by incubation for 12–15 hr at 37˚C under gentle agitation.
For immunolabeling of SDS-digested replicas, replicas were washed in washing buffer (containing
0.1% Tween-20, 0.05% bovine serum albumin [BSA], 0.05% NaN3pH = 7.4) and incubated in block-
ing buffer (washing buffer+ 5% BSA) for 1 hr. Replicas were transferred to blocking buffer containing
primary antibody (ginea pig anti-Cav2.3, 8 mg/ml) followed by incubation at 15˚C O/N. Thereafter,
replicas were washed and incubated in blocking solution containing secondary antibodies (2 nm
gold-conjugated anti-rabbit, 5 nm gold-conjugated anti-ginea pig, or 10 nm gold-conjugated anti-
rabbit, all diluted 1:30) at 15˚C O/N. The following day, the antibody labeling procedure was
repeated for the next primary antibody (4 mg/ml for anti-KCTD8, anti-KCTD12, anti-KCTD12b; 2 mg/
ml for anti-GABAB1) and corresponding secondary antibodies. Labeled grid-glued replicas received
a final carbon layer (20 nm) onto the labeled replica side using a High-Vacuum Coater ACE600
(Leica), followed by dissolution of the glue in Dynasolve 711 (Dynaloy, Indianapolis, IN) at 60˚C under
gentle agitation (60 rpm) for 2 hr. Solvent was subsequently removed by washing the grid in 100%
methanol for 10 min followed by ethanol (100, 95, 90, 70, 50%, 5 min each). After short air drying,
replicas were stored in grid boxes until observation under the transmission electron microscope.
Acute brain slice electrophysiology
Mice were anesthetized with a mixture of ketamine (90 mg/kg) and xylazine (4.5 mg/kg) and trans-
cardially perfused with ice-cold, oxygenated (95% O2, 5% CO2) artificial cerebrospinal fluid (ACSF)
containing (in mM) 118 NaCl, 2.5 KCl, 1.5 MgSO4, 1 CaCl2, 1.25 NaH2PO4, 10 D-glucose, 30
Bhandari et al. eLife 2021;10:e68274. DOI: https://doi.org/10.7554/eLife.68274 21 of 28Research article Neuroscience
NaHCO3, (pH = 7.4). The brain was rapidly excised, and coronal brain slices of 250 mm thickness
were prepared with a Dosaka Linear-Pro7. For SNX-482 experiments in rostral IPN, brain slices were
prepared at a 54˚ angle to allow for electrical stimulation of FR. For angled slice recordings in lateral
IPN of WT and Cav2.3 KO mice (Figure 1H–K), slices were cut at 1 mm thickness to assure that FR
remained intact all the way to the lateral IPN. Slices were recovered at 35˚C for 20 min and thereaf-
ter slowly cooled down to RT over the course of 1 hr. After recovery, one slice was transferred to the
recording chamber (RC-26GLP, Warner Instruments, Holliston, MA) and superfused with ACSF con-
taining 2.5 mM CaCl2, 20 mM bicuculline methiodide, 50 mM hexamethonium bromide, and 5 mM
mecamylamine hydrochloride at a rate of 3–4 ml/min at 32.0 ± 2.0˚C. Rostral or lateral IPN nuclei
were visually identified using an infrared differential interference contrast video system in a BX51
microscope (Olympus, Tokyo, Japan). Electrical signals were acquired at 10–50 kHz and filtered at 2
kHz using an EPC 10 (HEKA, Lambrecht/Pfalz, Germany) amplifier. Glass pipettes (BF150-86-10, Sut-
ter Instrument, Novato, CA) with resistances of 3–4 MW were crafted using a P97 horizontal pipette
puller (Sutter Instrument) and filled with internal solution containing (in mM) 130 K-Gluconate, 10
KCl, 5 MgCl2, 5 MgATP, 0.2 NaGTP, 0.5 EGTA, 5 HEPES; pH 7.4 adjusted with KOH. Whole-cell
patch-clamp recordings were performed in voltage-clamp mode at a holding potential of –60 mV,
and access resistance was constantly monitored via a –10 mV voltage step at the end of each sweep.
Recordings with access resistances exceeding 20 MW or with changes in access resistance or holding
current by more than 20% were discarded. To evoke glutamatergic excitatory postsynaptic currents
(EPSCs) in rostral IPN neurons, voltage pulses (0.5–3.5 V, 0.2 ms duration) were applied with an ISO-
Flex stimulus isolator (AMPI, Jerusalem, Israel) to a concentric bipolar stimulating electrode
(CBBPC75, FHC, Bowdoin, ME) located inside the IPN, ~200–300 mm distal to the recorded neuron.
For optogenetic stimulation in Tac1-ChR2 mice, blue light (l = 465 nm) was emitted directly onto
the lateral IPN through a 5 mm long mono fiber-optic cannula (fiber diameter 200 mm, total diameter
230 mm, Doric lenses, Quebec, Canada) connected to a PlexBright LED (Plexon, Dallas, TX), with an
optical patch cable (fiber diameter 200 mm, total diameter 230 mm, 0.48 NA). The LED was triggered
via 200–290 mA current pulse (2 ms duration) from a LED Driver (LD-1, Plexon), which was controlled
directly via the HEKA EPC10 amplifier. The sweep interval of all stimulation protocols (electrical and
optogenetic) was 10 s. For the application of SNX-482 (1 mM, hellobio, Bristol, UK) and w-Conotoxin
GVIA (1 mM, Alomone Labs, Jerusalem, Israel), 0.1% bovine serum albumin was added to the ACSF.
For variance-mean analysis, ACSF with four different Ca2+ concentrations (1.5–8 mM) was applied to
measure variance and mean EPSC amplitude at different release probabilities. Each Ca2+ concentra-
tion was washed in for 5–10 min. Once EPSC amplitudes stabilized, 15–20 consecutive EPSC
responses were used for the calculation of mean EPSC amplitude and variance, followed by the
wash-in of the next Ca2+ concentration. The order of application was 2.5 mM Ca2+, followed by 1.5
mM Ca2+, followed by 6–8 mM Ca2+, followed by 4–5 mM Ca2+. Baseline noise was much smaller
than synaptic noise. The values for release probability and quantal size were calculated according to
the equations Var = Iq – I2/N and I = Nqp, with I being the average EPSC amplitude, N the number
of release sites, and q the quantal size. To measure the paired-pulse ratio (PPR) of two consecutively
evoked EPSCs at 20 Hz, the PPRs of 20–30 EPSC pairs evoked at 10 s intervals were averaged. To
study the effect of GBR activation on EPSC amplitude, R(+)-Baclofen hydrochloride (1 mM) was bath
applied for 3 min and washed for 10 min. For PPR and variance-mean experiments, data from wild-
type C57BL/6J and BALB/c mice were found to not differ significantly and thus were pooled. To
measure action potential properties in ventral MHb neurons, a 50 pA current was injected for 100
ms, which reliably evoked a train of action potentials. Action potential peak times were measured as
the time from the threshold potential to the peak. Action potential full-width at half maximum was
measured as the time between rising and the falling phase of the action potential at half of the maxi-
mal action potential amplitude. Only the first action potential in the train was analyzed.
Cell lines
Human Embryonic Kidney 293T (HEK293T) were directly obtained from ATCC (https://web.expasy.
org/cellosaurus/CVCL_0063)and maintained in DMEM supplemented with GlutaMAX (Invitrogen)
and 10% FCS in a humidified atmosphere (5% CO2) at 37˚C. HEK293 cells (RRID:CVCL_0045), stably
expressing the human Cav2.3 (R-type) channel a1E-3 splice variant (also called a1E-c; GenBank
L29385), the Ca2+ channel auxiliary subunits human a2bd 1 (M76559) and human b3a (NM_000725),
as well as the human potassium channel KCNJ4 (Kir2.3; U07364), were a kind gift from the
Bhandari et al. eLife 2021;10:e68274. DOI: https://doi.org/10.7554/eLife.68274 22 of 28You can also read