ROMANIA VOCATIONAL EDUCATION AND TRAINING IN EUROPE - VET IN EUROPE REPORTS I 2016
←
→
Page content transcription
If your browser does not render page correctly, please read the page content below
VOCATIONAL EDUCATION
AND TRAINING IN EUROPE

ROMANIA

           VET IN EUROPE REPORTS I 2016
Please cite this publication as:
Cerkez, E.B.; Stroie, D.C.; Vladut, Z.E. (2016). Vocational education and training in
Europe – Romania. Cedefop ReferNet VET in Europe reports.
http://libserver.cedefop.europa.eu/vetelib/2016/2016_CR_RO.pdf
Authors: Elena-Beatrice Cerkez, Dana-Carmen Stroie, Zoica-Elena Vlăduț
Contributors: Florin Mărginean, Ana Rădulescu, Ana-Maria Zamfir, Lucian Voinea
Validated by: Ciprian Fartușnic, Institute of Education Sciences - Ministry of
National Education and Scientific Research
Reviewed by Cedefop
© National Centre for TVET Development (Cedefop ReferNet Romania), 2016
Reproduction is authorised, provided the source is acknowledged.
This VET in Europe report is part of a series prepared by Cedefop’s ReferNet network.
VET in Europe reports provide an overview of national vocational education and training
(VET) systems of the EU Member States, Iceland and Norway. The reports help to
understand VET’s main features and role within countries’ overall education and training
systems from a lifelong learning perspective, and VET’s relevance to and interaction with
the labour market.
VET in Europe reports follow a common Cedefop format. They are available at
http://www.cedefop.europa.eu/EN/Information-services/vet-in-europe-country-
reports.aspx.
The opinions expressed here do not necessarily reflect those of Cedefop.
VET in Europe reports are cofinanced by the European Union and ReferNet national
partners.
ReferNet is a network of institutions across Europe representing the 28 Member States,
plus Iceland and Norway. The network provides Cedefop with information and analysis on
national vocational education and training. ReferNet also disseminates information on
European VET and Cedefop’s work to stakeholders in the EU Member States, Iceland
and Norway.
http://www.cedefop.europa.eu/en/events-and-projects/networks/refernet
/cedefop @cedefop refernet
1Contents
Chapter 1: External factors influencing VET............................................ 5
1.1. Population and demographics .................................................................. 5
1.2. Labour market indicators........................................................................... 7
1.2.1 Active population ..................................................................................................... 7
1.2.2 Employment ............................................................................................................. 8
1.2.3. Unemployment ..................................................................................................... 11
1.2.4. Long-term unemployment ................................................................................... 13
1.3. Qualification level of the population....................................................... 14
CHAPTER 2: Providing VET in a lifelong perspective .......................... 17
2.1. Chart of the national education and training system ....................... 17
2.2. Government-regulated VET provision.................................................... 18
2.2.1 Legislative framework ........................................................................................... 18
2.2.1.1. Pre-university education .............................................................................. 21
2.2.1.1.1 Pre-university education - general framework ................................... 21
2.2.1.1.2 Initial VET pathways: access requirements, balance between
school and work-based learning, qualifications ................................................. 23
2.2.1.2 Higher education system .............................................................................. 27
2.2.2 Financing ................................................................................................................ 28
2.2.3 Governance ........................................................................................................... 29
2.2.4 Teachers................................................................................................................. 30
2.3. Other forms of training ......................................................................... 31
2.3.1. Adult vocational training (Continuing VET) ...................................................... 31
2.3.1.1 Legislative framework and general CVET provisions .............................. 31
2.3.1.2 CVET offered through the National plan for vocational training ............. 33
2.3.1.3 Other form of support to adults .................................................................... 35
2.3.2. Apprenticeship ...................................................................................................... 36
2.3.3. Other forms of training......................................................................................... 38
Chapter 3: Shaping VET qualifications ................................................... 40
3.1. The development of VET qualifications ............................................. 40
3.2. Quality assurance in VET......................................................................... 40
3.3. Mechanisms and processes to anticipate qualification requirements43
CHAPTER 4: Promoting participation in vocational education and
training………….. ....................................................................................... 46
4.1 Educational counselling and career guidance .................................. 46
4.2. Incentives to promote participation in VET and access to the labour
market ................................................................................................................ 49
Annex 1… .................................................................................................... 53
2Annex 2… .................................................................................................... 63
Annex 3… .................................................................................................... 64
Abbreviations ............................................................................................. 65
Main laws regulating the provision of VET ............................................ 66
References .................................................................................................. 67
Web-sites consulted .................................................................................. 68
List of tables and figures
F IGURES
Figure 1.1 Population by age group (% as of 1 January) ............................................. 5
Figure 1.2 Activity rates by age groups ........................................................................ 7
Figure 1.3 Employment rates by educational attainment level, age group 20-
64…………….. .................................................................................................................... 9
Figure 1.4 Employment by occupation in 2015 – age group 15 years and
over…………… ................................................................................................................. 11
Figure 1.5 Long-term unemployment rates in % of the active population, EU-28 and
Member States, 2010 -2015 .............................................................................................. 13
Figure 1.6 Active population by educational attainment level – age group 20-
24…………….. .................................................................................................................. 15
Figure 1.7 Active population by educational attainment level – age group 25-
29…………….. .................................................................................................................. 15
Figure 2.1 Chart of the national education and training system ................................. 17
Figure 2.2. Share of students in technological and ‘school- and work-based VET’
programmes of all students enrolled in upper secondary education ................................ 26
Figure 2.3. Share of students in ‘school- and work-based VET’ programmes of all
students enrolled in upper secondary VET ....................................................................... 27
Figure A.1. Permanent and temporary emigrants and immigrants by age groups ........... 53
Figure A.2. Activity rates by age groups and sex .............................................................. 54
Figure A.3. Employment rates by age groups ................................................................... 55
Figure A.4. Employment rates by age groups and sex ..................................................... 56
Figure A.5. Employment by occupation in 2005 – 2015 – age group 15 years and over . 57
Figure A.6. Long-term unemployment rates of the total unemployment, age group 15 to
24 years old, EU-28 and Romania, 2002 – 2015 .............................................................. 57
Figure A.7. Long-term unemployment rates of the total unemployment, sex and age
group 15 to 24 years old, in Romania, 2002 – 2015 ........................................................ 58
Figure A.8. Active population by educational attainment level – age group 15-64 ........... 58
Figure A.9. Active population by sex and educational attainment level – age group 15-64
years .................................................................................................................................. 59
Figure A.10. Active population by sex and educational attainment level – age group 20-24
........................................................................................................................................... 60
Figure A.11. Active population by sex and educational attainment level in 2015 – age
group 25-29 ....................................................................................................................... 61
Figure A.12. Tertiary educational attainment in 2015 ....................................................... 62
Figure A.13. Percentage of qualified VET teachers .......................................................... 62
3T ABLES
Table 1.1. Employment rate, 20-64 years old, during the period 2010-2015...................... 8
Table 1.2. Employment rates of young people, 20-34 years old, not in education and
training, by educational attainment level, from 1 to 3 years since completion of highest
level of education .............................................................................................................. 10
Table 1.3. Unemployment rates by educational attainment level, for the age group 15-64
........................................................................................................................................... 12
Table 1.4. Unemployment rates by educational attainment level, age group 15 to 24 ..... 12
Table 1.5. Unemployment rates by educational attainment level, age group 25 to 29 ..... 13
Table 1.6. Early leavers from education and training, 2002-2015 .................................... 16
Table 2.1. Number of persons trained by field of activity registered in 2015 and beginning
of 2016 .............................................................................................................................. 34
Table 2.2. Graduates of free of charge vocational training programmes approved in 2015
........................................................................................................................................... 34
Table A.1. Population projection until 2080 ...................................................................... 53
4CHAPTER 1: EXTERNAL FACTORS INFLUENCING VET
1.1. P OPULATION AND DEMOGRAPHICS
In January 2015, Romania’s population was 19 870 647. From the total
population, 48.9% were men and 51.1% women. Between 2000 and 2015 the
population has decreased by 11.5%, caused equally by natural population
decrease and emigration.
Between 2000 and 2015, population aged less than 15 decreased by
more than one million, with very important consequences for the education and
training system. Population aged 15-64 decreased by approximately 1.9 million
people. More specifically, vocational education and training (VET) learners age
population (10-14) decreased by more than 691 thousand persons, while the
population aged 15 to 19 decreased by more than 603 thousand persons. The
elderly population (65+) has increased reaching approximately 3.3 million at the
beginning of 2015 (Figure 1.1).
Figure 1.1 Population by age group (% as of 1 January)
Source: Eurostat (demo_pjanbroad)
According to the National Institute of Statistics the resident population in
rural areas was about 9.1 million people in 2015 which represents 46.2 % of the
population. During the 2003-15 period the population residing in rural areas
decreased by more than one million people. For the age group 15-19 the decline
was more prominent in urban areas than in rural areas, reaching close values in
2015 (498 223 in urban areas vs. 583 080 in rural areas).
According to Eurostat data, the old-age dependency ratio (the percentage
ratio between population with 65 years or over and population aged 15-64) has
5risen from 19.3% in 2000 to 25.2% in 2015). Thus, the median age of population
increased from 34.4 years to 41 years.
Population forecast data up to 2080 (Europop 2013) shows that the
ageing process will continue for the next twenty years: Romania's population is
expected to drop by more than 3.5 million people by the year 2080, falling to 16.3
million people. On a shorter time-horizon, by 2020, total population is expected to
decrease by 260 000 persons (see Annex 1, Table A.1.).
Population ageing will also have consequences on the education and
training system. On a shorter-time horizon, by 2020, population aged 14 is
expected to decrease by more than 5 300 persons.
Reduced number of students has generated a process of merging of
schools and, in some cases even the closure of some of them. In such cases
schools from smaller communities merge with schools in larger communities. The
needs of the adjacent communities are addressed as transportation is made
available for students residing outside the community where the remaining
schools are based. Funding for transportation (subsidized transportation cost) is
the responsibility of local authorities (local budgets).
Between 2000 and 2014 the number of permanent emigrants (1)
increased, amounting, for the indicated period to a total of 184 019 people. Of
those, 11 912 were people aged between 15 and 19 years old. The number of
temporary emigrants (2) has been declining in the period 2008-13, but remained
at high levels (172 871 persons in 2014 vs. 302 796 persons in 2008). The
number of temporary emigrants from the age group 15-19 also was decreasing
from 20 542 in 2008 to 9 503 in 2014. Emigration of the population aged between
15 and 19 also affected education and training system.
In the same period the number of immigrants amounted to 178 661
persons, of which 9 058 young people between 15 and 19 years. It is noted that,
in the analysed period the total number of permanent immigrants increased from
11 024 persons to 36 644, exceeding the number of permanent emigrants. The
number of permanent immigrants aged between 15 and 19 years old has
registered fluctuations between a minimum of 196 people and a maximum of 1
355 people in the analysed period (see Annex 1, Figure A.1.). It should be noted
that the number of immigrants was growing in the analysed period. This requires
a series of adjustments of the initial and continuing VET systems for increasing
(1) Permanent emigrants are the persons, Romanian citizen, who establish their
permanent residence abroad.
(2) Temporary emigrants are the persons, Romanian citizen, who emigrate abroad for a
period of at least 12 months.
6their capacity to adapt to specific needs of different immigrant groups and their
socio-economic integration.
1.2. L ABOUR MARKET INDICATORS
1.2.1 ACTIVE POPULATION
Romania's active population (age group 15 to 64 years old) continuously
decreased during 2001-15 from 10.4 million people to 8.8 million people.
Comparison of the activity rate between EU 28 and Romania (Figure 1.2)
shows that Romania is below the EU 28 average values, all over the period
2002-15 and at all age groups. Moreover, the gap was increased from 4.4 pp in
2002 (68.6% EU 28, 64.2% Romania) to 6.4 pp in 2015 (72.5% EU 28, 66.1%
Romania). In the first quarter of 2016, the activity rate for the age group 15-64
years old was of 64.2%. The rate of activity in Romania in 2015 for the age group
20-24 was more than 12 percentage points below the EU average (61.3% in EU
28 vs. 49.2% in Romania), decreased from 55.7% in 2002 to 49.2% in 2015
(42.5% in the first quarter of 2016). In the age group 25-29 the gap is lower
(82.2% in EU 28 vs. 80.2% in Romania in 2015). In the first quarter of 2016, the
activity rate for the age group 25-29 was 77.6%.
Figure 2.2 Activity rates by age groups
Source: Eurostat [lfsa_argan]
7Regarding the activity rate of the population aged 15 to 64 by gender; a
significant disparity is noticed. The activity rate for males is 18.6 percentage
points higher than the activity rate for females in 2015. Also, the employment rate
for men in Romania is below the European average by only 3 percentage points
while for women the difference is 10.1 percentage points. In the first quarter of
2016, the activity rate was of 77.1% for males and 58.2% for females. In 2015,
for the age group between 25 and 29, the activity rate for men was higher than
the EU 28 average by 2.1 percentage points while for women it was lower by 6.8
percentage points (see Annex 1, Figure A.2.).
1.2.2 EMPLOYMENT
The employment rate of the population aged between 20 and 64 in Romania in
2015 was 66% (compared to the EU average of 70%), with no significant
progress in the analysed period (Table 1.1). In the first quarter of 2016, the
employment rate was 64.5% (20-64 years). The national target set for 2020 is
70%.
Table 1.1. Employment rate, 20-64 years old, during the period 2010-2015
GEO/ Target
2002 2005 2008 2009 2010 2011 2012 2013 2014 2015
TIME 2020
EU28 66.7 67.9 70.3 69 68.6 68.6 68.4 68.4 69.2 70 75
Romania 63.3 63.6 64.4 63.5 64.8 63.8 64.8 64.7 65.7 66 70
Source: Eurostat (t2020_10)
Employment rates show very different situations by age groups. For the
age group 20-24 the employment rate stands for the entire period 2002-15 below
the EU 28 average (in the year 2015 it was 39.6%, 10 percentage points below
the EU average of 49.6%). For the age group 25-29 and the age group 30-34,
employment rates in the last years have been very close to the EU 28 average
(e.g. 72.1% at the age group 25-29 in 2015 vs. 72 the EU 28 average and 78% at
the age group 30-34 in 2015 vs. 77.7 the EU 28 average) (see Annex 1, Figure
A.3.).
Evolution of employment rates by sex, for the age group 20-64, shows an
increasing trend in the last 4 years for both men and women. However a
significant gap between employment rates of men and that of women remains.
Thus, while the employment rate for men in 2015 was 74.7%, i.e. more than one
percentage point follow EU average, the employment rate for women was 57.2%,
i.e. seven percentage points below the EU average. In 2015, for the age group
20-24, the employment rate for men has been 46.8% and 31.7% for women.
8For men in the age groups 25-29 and 30-34, the last five years the
employment rate was higher than the European average. For women, in the
same age groups, in the last 5 years, the employment rates were close to
European averages. In 2015, for the age group 30-34 the employment rate was
lower than European average (68.8% vs. 70.7% EU 28 average) (see Annex 1,
Figure A.4.).
Comparative analysis between Romania and EU 28 (Figure 1.3) shows
that the employment rates in the age group 20-64 are similar for the educational
attainment levels ISCED 0-2 (EU28 52.6%, Romania 53.3% in 2015) and 5-8
(EU28 82.7%, Romania 85.3% in 2015). The employment rate in Romania for the
ISCED 3-4 group, in 2015, was below the EU average by 4.7 percentage points.
Since 2006, the national employment rate for the ISCED 5-8 group is
descending, except for 2015 when it registers a slight increase (from 82.5% to
85.3% in 2015, an 85.7% in the first quarter of 2016). For the ISCED 0-2 group, a
decline of the employment rate is recorded in 2015 as against 2014, from 55% to
53.3% (48.5% in the first quarter of 2016).
Figure 3.3 Employment rates by educational attainment level, age group 20-
64
Source: Eurostat [lfsa_ergaed]
Regarding employment rate of graduates of educational levels ISCED 3-8
in 2015, Romania with 68.1% ranks below the European average of 76.9% and
away from the target proposed at European level for 2020 (82%). In the first
quarter of 2016 the rate was of 64.9%.
The employment rate of graduates aged between 20 and 34 years, from 1
to 3 years after graduation (Table 1.2), decreased after 2009, except for 2015
9(68%). The employment rate of graduates with upper secondary education
attainment level (ISCED 3-4) was 59.8% in 2015 versus 57.2% in 2014. The
employment rate of young people with tertiary attainment level (ISCED 5-8) has
registered an increase in 2015 to 77.1% from 74.2% in 2014.
Table 1.2. Employment rates of young people, 20-34 years old, not in education
and training, by educational attainment level, from 1 to 3 years since completion
of highest level of education
GEO/TIM
E 2006 2007 2008 2009 2010 2011 2012 2013 2014 2015
ISCED levels 3-8
EU 28 78.9 80.8 82.0 78.3 77.4 77.0 75.9 75.4 76.0 76.9
Romania 74.7 79.3 84.8 77.6 71.2 70.8 70.2 67.2 66.2 68.1
ISCED levels 3 and 4
EU 28 73.7 75.5 77.0 72.6 72.0 71.2 69.7 69.4 70.7 70.8
Romania 64.8 70.7 77.1 69.1 60.8 58.9 59.3 55.0 57.2 59.8
ISCED Levels 5-8
EU 28 84.3 86.1 86.9 83.8 82.6 82.5 81.5 80.8 80.5 81.9
Romania 86.4 89.0 92.9 85.7 82.5 81.4 79.1 77.2 74.2 77.1
Target 82.0%
Source: Eurostat [edat_lfse_24]
Analysis of employment by professional status in 2015 shows that the
skilled non-manual workers (i.e. managers, professionals, technicians and
associate professionals, clerical support workers) represented more than a
quarter of employed population. Still, employment rates of technicians and
associate professionals dropped from 8.9% in 2010 to 5.9% in 2014 and 6% in
2015 (Figure 1.4). Persons with elementary occupations represented 10% of
employed population (decreased from 11.6% in 2010) and skilled agricultural,
forestry and fishery workers represented 21% of employed population (from 25%
in 2010).
In the same period (2010-15) an increasing trend was registered for
professionals, service and sales workers, craft and related trades workers, plant
and machine operators and assemblers (see Annex 1, Figure A.5.).
10Figure 4.4 Employment by occupation in 2015 – age group 15 years and over
Source: Eurostat [lfsa_egais]
1.2.3. UNEMPLOYMENT
During the period 2004-08 unemployment rates registered an important decrease
followed a period of growth until 2011. Since 2011, they returned to a decreasing
trend. Throughout the period 2002-15 the unemployment rate in Romania was
below the EU 28 average for the age groups 15-64 years, 20-24 and 25-29. This
is mainly due to (under)employment in the agricultural sector (i.e. subsistence
farming), a lower activity rate due to the increased education enrolment of
school-age population, and migration for employment abroad. The 2015 total
unemployment rate is 6.8% compared to 7.1% in 2013. It is noteworthy that
unemployment in Romania in 2015 is more than three percentage points below
the EU 28 average (6.8% in Romania vs. 9.4% EU28).
In terms of unemployment by level of education, the age group 15-64
recorded the highest value at the ISCED levels 0-2 followed by levels 3-4 and
levels 5-8 (Table 1.3). It is significant that while at ISCED levels 0-2 and 3-4 the
unemployment rate increased, at 5-8 levels there was a decrease in
unemployment in 2015.
11Table 1.3. Unemployment rates by educational attainment level, for the age
group 15-64
GEO/ ISCED 2002 2005 2008 2009 2010 2011 2012 2013 2014 2015
TIME levels
0-2 11.6 12.1 11.5 14.8 16.1 16.7 18.6 19.7 19.0 17.9
EU28 3-4 9.6 9.3 6.5 8.4 9.0 9.0 9.7 10.1 9.5 8.8
5-8 4.8 5.0 3.8 5.0 5.4 5.6 6.1 6.5 6.2 5.7
0-2 7.6 8.0 8.6 8.9 6.9 8.5 7.9 7.9 7.7 9.1
Romania 3-4 10.0 8.1 6.0 7.3 8.0 7.9 7.4 7.8 7.2 7.3
5-8 4.1 3.9 2.7 4.4 4.8 4.8 5.1 5.4 5.9 4.1
Source: Eurostat [lfsa_urgaed]
Much higher unemployment rates were recorded for the age group 15-24
recorded in all levels of education attainment (Table 1.4), compared to the age
group 15-64. It is noteworthy that the group ISCED 5-8 has recorded the highest
unemployment rate while at group ISCED 0-2 was the lowest unemployment rate
(23.2% at levels 5-8 vs. 19.9% at levels 0-2, in 2015). In the first quarter of 2016,
the unemployment rate for ISCED level 0-2 was 18.8%, for ISCED level 3-4
23.1% and for ISCED level 5-8 24.6%.
Also, much higher unemployment were recorded for the age group 25-29
recorded rates in all levels of education attainment (Table 1.5) compared to the
age group 15-64, but lower than the age group 15-24. Moreover, the
unemployment rate at ISCED group 0-2 levels was higher than the rates from
groups 3-4 and 5-8 ISCED levels. In the first quarter of 2016, the unemployment
rate for ISCED level 0-2 was 12%, for ISCED level 3-4 11.7% and for ISCED
level 5-8 9.1%. This shows that, for people aged 15-24, the labour market is
oriented slightly more towards people with 3-4 ISCED education level, and for
people aged 25-29 to those with work experience and mainly with 5-8 ISCED
education. Still, for ISCED 3-4 graduates, unemployment level for the age group
25-29 is significantly lower than for the age group 15-24.
Table 1.4. Unemployment rates by educational attainment level, age group 15 to
24
GEO/ ISCED 2002 2005 2008 2009 2010 2011 2012 2013 2014 2015
TIME levels
0-2 19.9 21.8 21.3 26.2 27.6 28.8 31.0 31.5 30.3 28.0
EU28 3-4 17.9 17.5 13.0 17.1 18.3 18.9 20.4 21.0 19.9 18.1
5-8 12.5 14.3 11.7 15.5 16.3 16.9 18.1 18.9 16.5 15.4
0-2 18.2 16.3 20.3 19.4 16.2 19.4 17.0 17.2 18.7 19.9
Romania 3-4 25.0 22.5 17.5 20.9 24.7 25.6 25.0 25.9 25.4 22.4
5-8 19.8 22.1 20.4 24.9 27.9 28.3 26.6 31.3 33.2 23.2
Source: Eurostat [lfsa_urgaed]
12Table 1.5. Unemployment rates by educational attainment level, age group 25 to
29
GEO/ ISCED 2002 2005 2008 2009 2010 2011 2012 2013 2014 2015
TIME levels
0-2 16.1 16.6 16.0 21.6 23.7 24.3 26.8 28.5 26.9 25.9
EU28 3-4 10.9 10.8 7.7 10.4 11.3 11.4 12.6 13.2 12.2 11.2
5-8 8.0 8.0 5.9 8.0 9.0 9.2 10.2 10.8 10.5 9.2
0-2 8.5 9.6 10.4 13.0 12.2 12.1 11.9 11.3 12.6 12.1
Romania 3-4 9.4 8.7 6.7 7.9 8.9 9.6 10.0 10.2 8.7 9.9
5-8 6.8 7.5 4.1 6.1 9.0 8.0 9.9 10.7 12.1 9.2
Source: Eurostat [lfsa_urgaed]
When analysing the unemployment rate by gender and level of education,
it is found that at the age group 15-64, female unemployment rate is lower than
the rate for men at ISCED levels 0-2 and 3-4 but slightly higher at 5-8. At the age
group 15-24, female unemployment rate is higher than the rate for men for
ISCED levels 0-2 and 3-4 and lower in ISCED levels 5-8. This may suggest that,
regarding employment, in the case of young people the principle of gender
equality is not sufficiently respected.
1.2.4. LONG-TERM UNEMPLOYMENT
Between 2010 and 2015 the long-term unemployment rate in the EU-28 has
increased from 3.8% to 4.5%. In Romania, the indicator has also recorded an
increase from 2.4% to 3% (Figure 1.5).
Figure 5.5 Long-term unemployment rates in % of the active population, EU-
28 and Member States, 2010 -2015
Source: Eurostat [une_ltu_a]
The evolution of the long-term unemployed in the total active population
indicates a decrease in the period 2002-08 followed by an increase in the period
132009-15, both at EU 28 level and Romania. It is worth mentioning that during
2002-08, long-term unemployment in Romania was higher than in the EU 28 and
in the period 2009-15 was below the EU 28 average, both as share of the total
active population and of all unemployment, for both men and women. Evolution of
long-term unemployment in all the analysed period shows that although long-
term unemployment among women was higher than among men, in the case of
very long-term unemployment situation between men and women is reversed.
In the case of young people (age group 15-24), long-term unemployment
as a percentage of the total unemployment in Romania recorded small
fluctuations during 2002-06, followed by a continuous decrease around 50%
during 2006-09, to 29.5%. In 2009-2012 another increase to 41.6% was
registered followed by a decrease in the next two years 2013 and 2014, by more
than 5 percentage points to 36.4% and an increase to 37.2% in 2015. Long-term
unemployment among young people (age group 15-24) in Romania was higher
compared to the EU average in the entire analysed period. Long-term
unemployment affects men and young people more than other groups on the
labour market (see Annex 1, Figure A.6., and Figure A.7.).
1.3. Q UALIFICATION LEVEL OF THE POPULATION
An important change to the structure of levels of education attainment for the
active population aged between 15 and 64 is worth mentioning. The share of
population with tertiary education increased from 10.7% in 2002 to 20.2% in
2015, and the share of active population with level of education less than
primary, primary and lower secondary education (levels 0-2) dropped from 25.7%
in 2003 to 22.9% in 2015, although still maintained at high values. This change
was more prominent for females as their share of those with levels of education
5-8 increased from 9.9% in 2001 to 24.2% in 2015, while for males the increase
was from 10.2% to 17.3% (see Annex 1, Figure A.8. and Figure A.9.).
Regarding young active population aged between 20 and 24, the share of
those with tertiary education increased from 4.2% in 2002 to 10.4% in 2015,
partly at the expense of those with upper secondary and post-secondary
education that dropped from 66.5% in 2002 to 62.1% in 2014 to rise again at
65.3% in 2015. The share of young people with ISCED 0-2 is maintained at a
high percentage, around 25% in the last 4 years, but has dropped considerably
from 29.2% in 2002. Female population aged 20 to 24 registered a more
pronounced increase (from 6.2% in 2002 to 15.4% in 2015) in the share of those
with ISCED level 5-8 compared to the male population (from 2.6% in 2002 to
7.2% in 2015). However, it appears that during the last four years the share of the
14female active population with education level ISCED 5-8 in the age group 20-24
decreased continuously (see Figure 1.6 below and Annex 1, Figure A.10).
Figure 6.6 Active population by educational attainment level – age group 20-
24
Source: Eurostat [lfsa_agaed]
The age group 25-29 is more representative of the changed structure by
level of education of the young people in the active population. Within this age
group, 28.6% of young people in 2015 have tertiary education attainment level
(from 13.9% in 2002) and only 19.3% with less than primary, primary and lower
secondary education. For females the increase was more prominent (from 18.9%
in 2002 to 37.2% in 2015). However the total share of those with ISCED levels 0-
2 increased during the analysed period from 16.8% to 19.3% (see Figure 1.7
below and Annex 1, Figure A.11).
Figure 7.7 Active population by educational attainment level, age group 25-29
Source: Eurostat [lfsa_agaed]
15Early school leaving negatively affects the quality and competitiveness of
the human capital. The early school leaving rate decreased from 23.0% in 2002
to 17.3% in 2013 (Table 1.6). Still, in 2014 and 2015 it recorded an increase, up
to 19.1% in 2015. The rate of early leavers from education and training for males
was higher than the rate for females by one percentage point in 2014 (19.5% for
males vs. 18.5% for females).
Table 1.6. Early leavers from education and training, 2002-2015
GEO/ Target
2002 2005 2008 2009 2010 2011 2012 2013 2014 2015
TIME 2020
EU28 17 15.7 14.6 14.2 13.9 13.4 12.7 11.9 11.2 11.0 10
Romania 23 19.6 15.9 16.6 19.3 18.1 17.8 17.3 18.1 19.1 11.3
NB: Percentage of the population aged 18-24 with at most lower secondary education and who were not in
further education or training during the last four weeks preceding the survey.
Source: Eurostat (t2020_40)
Adults’ participation in education and training did not register significant
progress in the period 2000-14, fluctuating between 0.9% in 2000 and 1.3% in
2015.
16CHAPTER 2: PROVIDING VET IN A LIFELONG PERSPECTIVE
2.1. C HART OF THE NATIONAL EDUCATION AND TRAINING SYSTEM
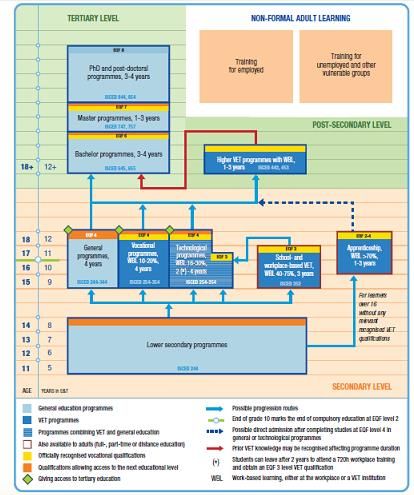
Figure 2.1 Chart of the national education and training system
Source: Cedefop and ReferNet Romania
172.2. G OVERNMENT - REGULATED VET PROVISION
The main vocational education and training (VET) opportunities leading to
formally recognised qualifications in Romania are:
(a) initial VET (IVET), including upper secondary technological programmes,
‘school- and work-based VET’ programmes and post-secondary programmes
(see section 2.2.1.1) and
(b) continuing VET (CVET), as part of adult education(see section 2.3.1).
2.2.1 LEGISLATIVE FRAMEWORK
The National Law of Education no.1/2011 with its latest revisions and updates
(until 2014) provides the general legal framework and describes the general
objectives, aims, principles, structure, organization and functioning of the
education system in Romania. The general legal framework has been subject of
frequent updates. The latest updates include:
(a) the extension of compulsory education to 11 years in total, by introducing the
preparatory grade (grade 0 before primary education) and extending the
length of compulsory studies from the 8th, later to 9th and presently to the 10th
grade; and
(b) the professionalization of the teaching career by introducing the Master of
Arts for the teaching profession.
Extension of compulsory education had two pursuits:
(a) ensuring that young people can benefit from education and training and
develop their personal, psychological and competences profile until the age of
15-16, which corresponds to the legal minimum age requirements to enter the
labour market (with reduced work-load); and
(b) decreasing the school drop-out rate.
The National Law of Education is complemented by a set of strategic
documents in the context of the National Reform Programme elaborated in line
with European recommendations in all sectors.
1. The National strategy on reducing early school leaving (ESL) (adopted
by Government decision no. 417/03 June 2015).
The main objective of the strategy is to help reduce the ESL rate from 17.6% in
2013 to 11.3% in 2020 through measures for prevention, intervention and
compensation targeted at early school leavers who want to continue their studies.
The strategy adopts four main directions: ensuring and increasing access to
education and quality education for all children, ensuring completion of
compulsory education by all children, re-integrating early school leavers into the
education system, and developing the appropriate institutional system for
reintegrating early leavers.
18The main objective related to VET is to improve attractiveness, inclusion,
quality and relevance of initial VET through updated and revised curricula.
The ESL Strategy emphasises the necessity to ensure completion of
compulsory education by all children by three main actions:
(a) giving access to flexible, permeable and qualitative learning routes. This can
be pursued through updated curricula, continuing teacher training, relevance
of qualifications to labour market needs;
(b) establishing certain instruments of early detection and prevention of school
leaving as well enforcing, extending and tailoring counselling services; and
(c) promoting student-centred remedial education programmes in schools
(‘School after school’ programme).
The Strategy promotes the acquisition of key competences that ensures
personal, professional development and easier labour market access. Second
chance programmes are also envisaged for all levels of education including for
IVET route at national level with the support of school county inspectorates.
2. The VET Strategy for 2016-20 (adopted by Government decision no.
317/27 April 2016)
The VET Strategy includes four main objectives:
(a) increasing VET relevance to labour market needs;
(b) increasing participation and facilitating access to VET programmes;
(c) improving VET quality;
(d) developing innovation and national and international cooperation in VET.
The strategy was complemented by a specific action plan that includes:
(a) updating instruments describing the occupations, qualifications, curricula and
curricular auxiliaries across levels of qualifications through the National
Qualification Framework (NQF), for better articulating subsystems, facilitating
VET mobility and improving the relevance to labour market needs. In this
respect CVET curricula will be developed / updated on the basis of revised
occupational standards, according to their relevance for the labour market,
mainly for the green economy and national development priority sectors. This
measure is complemented by the provisions in the National Strategy for
Lifelong Learning for 2015-20 (see point 3 below) concerning the link
between the Romanian Classification of Occupations (Clasificarea ocupațiilor
din Romania – COR) with the NQF by updating/reviewing most standards
(2000 to 3000 standards);
(b) developing / reviewing current IVET curricula fundamentals: qualifications,
training standards, curricula, syllabi, curricula auxiliaries, on the basis of their
relevance to the labour market, mainly for the green economy and national
development priority sectors;
19(c) developing mechanisms for anticipating skills required by the labour market
and for defining job profiles, in order to develop / review qualifications in
terms of knowledge, learning outcomes and skills relevant to the labour
market needs; and for adapting curricula to labour market needs and trends.
Key competences will be included in curricula to promote better access to
the labour market;
(d) strengthening existing and creating new flexible mechanisms for recognition
and validation of learning outcomes achieved in non-formal and informal
context. This will be achieved through the revision of the existing specific
methodology, the development of system-level quality assurance
mechanisms for the recognition and validation of learning outcomes, and the
appropriate training of relevant staff (approx. 1 000 persons). The extensive
implementation of the recognition and validation will also be a valuable
instrument to ensure that key competences acquired in other context than
formal one, once recognised and validated, can help the individual better
integrate into real work-based contexts.
3. The National strategy for Lifelong learning for 2015-20 (adopted by
Government decision no. 418/03 June 2015)
The LLL Strategy is structured on three main pillars:
(a) access and incentives to participation: access and participation to lifelong
learning should be increased for all;
(b) quality and relevance: lifelong learning should be relevant to individual and
labour market needs; and
(c) partnerships for better information: lifelong learning should be developed in
close collaboration with social partners and all relevant stakeholders.
These strategies were elaborated in joint cooperation with VET-related
institutions in order to support and reach common, national goals and objectives
also in accordance with the general recommendations and objectives of the 2020
Strategy.
In June 2016 the National Centre for Technical Vocational Education and
Training Development (NCTVETD) and the Ministry of Education launched a
public debate referring to the opportunity of introducing dual initial VET in the
present context, as an answer to employers’ demands by increasing their
participation and the work-based training share.
202.2.1.1. Pre-university education
2.2.1.1.1 Pre-university education - general framework
According to the National Education Law (no. 1/2011), the national pre-university
educational system includes the following levels:
(a) early education (0-6 years), including the ante-preschool level (0-3 years)
and pre-school education (3-6 years);
(b) primary education (grades 0-4);
(c) secondary education, which includes:
(i) the lower secondary education (grades 5-8);
(ii) the upper secondary education, which can be:
I. high school programmes (grades 9-12/13) (see 2.2.1.1.2.a) granting
access to higher education:
1. general programmes (sciences and humanities),
2. programmes with work-based learning (WBL) component of 10-20%
of the total programme (military, theological, sports, artistic, and
pedagogic qualifications) – these programmes are referred to as
‘vocational’ in the national context, but are not actually considered to
be part of IVET (see 2.2.1.1.2),
3. technological programmes with a WBL component of 16-30%,
providing qualifications in three areas: technical professions, services,
natural resources and environmental protection – these programmes
are considered as part of IVET.
II. ‘school- and work-based VET’ programmes (învățământ profesional)
(see 2.2.1.1.2.b), which include:
1. 3-year ‘school- and work-based VET’ programmes, after the
completion of the 8th grade with WBL share varying between 20 and
70%,
2. 2-year ‘school- and work-based VET’ programmes, after the
completion of the 9th grade (offered from the 2012-13 until the 2015-
16 school year),
3. 6-month practical traineeships, after the completion of the 10th grade
attended in a technological programme (offered mostly through
second-chance programmes).
(d) tertiary non-university education, which includes post-secondary IVET
programmes (see 2.2.1.1.2.c)
General compulsory education is based on an 11-year education system
and includes preparatory class, primary, lower secondary education and first two
grades of upper secondary education (grades 9 and 10).
21Persons from minorities have the right to study in their mother tongue at
all levels, types and forms of school education. Special education is provided for
all levels for people with special educational needs or other educational
requirements set by the Minister of Education, differentiated by type and degree
of special needs identified. Schools, by decision of the School Board, may
expand their activities with students after classes, through programmes referred
to as ‘School after school’. Private and confessional education is organised in
non-profit educational institutions, at all levels and forms, according to current
legislation.
After completing lower secondary education (gimnaziu), students can
continue their studies in upper secondary education, including enrolling to VET
i.e. either a technological programme or a ‘school- and work-based VET’
programme. Admission is based on each pupil portfolio including: graduating
diploma, personal transcript (foaie matricola) and results of national evaluation
exams taken individually at the end of the 8th grade. The national evaluation
consists of written examinations in Romanian language and literature, mother
language (if different from Romanian) and mathematics.
VET graduates (i.e. from the technological programme or ‘school- and
work-based VET’ programme) who have acquired formal, non-formal or informal
vocational competences can undergo a qualification certification exam organised
by the school. Graduates passing the certification exam acquire a qualification
certificate and a supplement certificate, according to Europass provisions.
Graduates from ‘school- and work-based VET’ programmes, that are
successful in the professional qualification certification exam, also receive a
compulsory education certificate and can attend the higher cycle of upper
secondary education (grades 11th and 12th) of school-based programmes.
Graduates of any upper secondary education programmes, including VET
graduates from technological schools or graduates of ‘school- and work-based
VET’ programmes only after graduating from the higher cycle of school-based
programmes, can enrol in:
(a) a tertiary non-university programme (postliceu) as post-secondary education
or
(b) higher education provided they take and pass the national baccalaureate
examination receive a baccalaureate diploma, which entitles them to access
higher education. (for the organisation of the baccalaureate examination see
Annex 2).
222.2.1.1.2 Initial VET pathways: access requirements, balance between
school and work-based learning, qualifications
Initial vocational education and training (IVET) is organized and operates under
the National Education Law no. 1/2011 and includes:
(a) upper secondary technological programmes (liceu tehnologic) (lower cycle:
9th and 10th grades, higher cycle: 11th and 12th grades).
They last 4 years (or 5 years for full-time education with evening classes)
and are available after the completion of the 8th grade. Upon successful
completion graduates can acquire a qualification certificate at level 4 of the
National Qualifications Framework (NQF) / European Qualifications Framework
(EQF) (technician). Graduates also receive a graduation diploma, the school
transcript, part of the educational portfolio attesting the completion of high school
studies and giving graduates the right to access tertiary non-university
programmes, as well the right to attend the baccalaureate examination.
Examples of qualifications offered include:
Mechanics – Industrial design technician;
Mechatronics and Informatics – Mechatronics technician;
Electronics – Computing technical operator;
Constructions, installation, architecture and systematization –
Construction technician, plumbing technician, drawing technician
designer;
Wood industry – Furniture designer;
Agricultural and alimentary – Agronomist technician, floriculturist
technician;
Environmental protection – Meteorologist technician, environmental
protection technician;
Tourism – Banqueting organizer, hotel technician, gastronomy technician;
Textile and skins – Textile technician;
Text and image processing – Polygraphic production technician;
Economics – technician in administration.
(b) upper secondary ‘school- and work-based VET’ programmes (‘professional
training’ programmes - învățământ profesional) are available after the
completion of the 8th or 9th grade and last two or three years.
Upon successful completion graduates can acquire a qualification
certificate at level 3 NQF/EQF (skilled worker). Studies are free of charge if
completed until the age of 18 years. ‘School - and work-based programme’ is the
pathway providing IVET in close cooperation with companies. To ensure
alignment of state-funded VET provision with labour market needs, prior to the
approval of the number of students funded by governmental funds, every school
23is required to submit to the School inspectorates’ framework contracts with
companies that will provide workplace to students (based on the Order of the
Ministry of Education no. 3539/14.03.2012). These framework contracts establish
clear responsibilities for both school representatives and their partner companies
concerning:
students’ training during the workplace learning component (practical
training);
technical and human resources to be provided by the company, that are
necessary for students’ training and their certification exams.
The share of work-based learning (practical training in schools’
laboratories or in companies) is significant:
for the 2-year ‘school- and work-based VET’ programme (starting after the
9th grade):
o In the 1st year, WBL represents 60% of the total number of hours,
including 6 weeks in the company;
o In the 2nd year, WBL represents 75% of the total number of hours,
including 5 weeks in the company;
for the 3-year ‘school- and work-based VET’ programme (starting after the
8th grade):
o in the 1st year, WBL represents 20% of the total number of hours,
including 5 weeks in the company;
o In the 2nd year, WBL represents 60% of the total number of hours,
including 9 weeks in the company;
o In the 3d year, WBL represents 72% of the total number of hours,
including 10 weeks in the company;
The National Centre for TVET Development (www.tvet.ro and
http://www.alegetidrumul.ro/) and the platform ‘Choose your path!’ (‘Alege-ți
drumul!’) promote the ‘school- and work-based VET’ programmes.
The two-year ‘school- and work-based VET’ programme was introduced
for the period 2012-16 (based on Minister Order no.3168/03.02.2012) and was
implemented starting with the school year 2012-13, after the 9th grade for grades
10 and 11. The school year 2015-16 was the last one organised under this form
for those students enrolled in 2014.
In 2014 new updates of the National Law on Education introduced the
three-year ‘school- and work-based VET’ programme, (approved by Minister
Order no.3136/20.02.2014), which was organised since the school year 2014-15,
for graduates of the 8th grade. The programme is also open to graduates of 9th
grades from previous generations if students are willing to re-enter education. Its
duration is from 9th to 11th grade. It was continued in 2015 and 2016.
24After completing their studies, learners undertake a qualification
certification exam which is organized by their school that allows them to acquire a
professional qualification at level 3 of the NQF/EQF. After completing the
programme, students also acquire a compulsory education certificate, which
allows them to continue their studies in high school (grades 11-12th) if they wish
to obtain the baccalaureate diploma and continue in higher education (see Annex
2).
In 2013-14, 12 693 places were offered by 481 schools in 74
qualifications based on 1 878 partnerships with employers. In 2014-15, 651
school units have offered the programmes and have established partnerships
agreements with 2 664 employers for more than 35 740 students for 79
qualifications. In 2015-16, there were 34 984 young students enrolled in ‘school-
and work-based VET’ programmes. Examples of qualifications offered include:
Mechanics – Welder, miller, roller, locksmith, tinman, car mechanic;
Mechatronics and Informatics – Fine mechanic worker;
Electronics – Electronics worker;
Constructions, installation, architecture and systematization – Carpenter,
plumber;
Agricultural and alimentary – Farmer, pisciculturist, animal husbandry;
Tourism – Baker, pastry maker, hotels worker;
Textile and skins – Spinner, weaver;
Text and image processing – Printing worker.
(c) post-secondary VET and foremen education through tertiary non-university
programmes (postliceu). They last for one to three years after completion of
upper secondary education (with or without baccalaureate diploma).
Upon successful completion graduates can acquire a qualification
certificate at level 5 of the NQF/EQF (technician). Curricula may be offered on a
regular basis or be especially arranged to meet the needs of specific employers.
Post-secondary VET programmes provide an opportunity for advanced
vocational training for the graduates of upper secondary schools (including those
who do not hold the baccalaureate diploma). Examples of qualifications offered
through post- secondary programmes include:
Mechanics – Optician;
Mechatronics and Informatics – Local networks and communication
administrator, analyst programmer;
Electronics – Automation equipment technician, infrastructure of
telecommunication networks technician;
Constructions, installation, architecture and systematization –
Constructions topographer, constructions and architecture designer,
treasurer expert in science of commodities for constructions materials and
25installations, renovation and building repair designer, constructions
entrepreneur;
Transport – Inventory assistant in transport, railroad agent, waterside /
harbour operator
Wood industry – Gauger - taskmaster in wood industry, restaurateur of
(pipe) organ and handcrafted carpentry;
Agricultural and alimentary – Mountain agritourism technician;
Environmental protection – Meteorologist technician, environmental
protection technician;
Services – Interior decoration designer, cosmetician, stylist, librarian,
private detective;
Tourism – Tourism agent – guide, inventory assistant in accommodation
and alimentation units, events organizer;
Textile and skins – Creator, costume designer;
Text and image processing – Audio-video processing operator, techno
editor, cameramen - photo reporter, publicity designer, publicity editor,
image and communication expert, image editor;
Economic – Commercial agent, inventory assistant, bank clerk, fiscal
agent, broker, customs agent.
The share of students in upper secondary VET (technological education
programmes and ‘school- and work-based VET’ programmes) of all students
enrolled in upper secondary education registered a decrease in the 2004-15
period (dropped from around 60% in the period 2004-08 to 49.8% in 2015). This
decrease is due, among other reasons, to the political decision to reduce the
enrolment plan for ‘school- and work-based VET’ programmes and frequent
changes of National Education Law, which since 2011 has introduced various
forms of access to vocational schools. A significant increase was noticed in the
number of students enrolled in ‘school- and work-based VET’ programmes after
returning in 2014-15 to the three-year programmes that admit students after
completion of lower secondary education (after 8th grade): from 12 000 students
in the 2011-12 school year, representing 2.4% of all students enrolled in upper
secondary IVET, to more than 68 000 in the 2015-16 school year, representing
18.7% of all students enrolled in upper secondary IVET.
Figure 2.2. Share of students in technological and ‘school- and work-based VET’
programmes of all students enrolled in upper secondary education
26The share of students in technological high school and school and
work-based programmes of all students enrolled in upper
secondary education
100% 60.0% 59.8% 59.9% 60.1% 59.1% 59.2% 58.1% 56.5% 54.3% 51.1% 49.8% 49.6%
50%
0%
2004 - 2005 - 2006 - 2007 - 2008 - 2009 - 2010 - 2011 - 2012 - 2013 - 2014 - 2015 -
2005 2006 2007 2008 2009 2010 2011 2012 2013 2014 2015 2016
School year
Source: National Institute of Statistics
Figure 2.3. Share of students in ‘school- and work-based VET’ programmes of all
students enrolled in upper secondary VET
The share of students in school and work-based programmes of all
students enrolled in upper secondary education IVET
50% 45.4% 45.2%
40.5%
40% 36.2%
32.9%
30%
20.5% 18.7%
20% 13.1%
10.2%
10% 4.3% 6.5%
2.4%
0%
2004 - 2005 - 2006 - 2007 - 2008 - 2009 - 2010 - 2011 - 2012 - 2013 - 2014 - 2015 -
2005 2006 2007 2008 2009 2010 2011 2012 2013 2014 2015 2016
School year
Source: National Institute of Statistics
Regarding overall enrolment rates, since 2005 an increase is registered
for age groups 11-14 (from 81.6% in 2005 to 90.8% in 2015) and 19-23 (from
51.8% in 2006 to 90.8% in 2015), while both groups reached their highest figures
between 2009 and 2011. Enrolment rates for the 15-18 age group have slightly
deteriorated from 81.6% in 2006 to 80.2% in 2015, despite a high of 88.8% in
2010.
2.2.1.2 Higher education system
The higher education system in Romania has a three-cycle structure, following
the Bologna system: Bachelor, Master and Doctorate (at levels 6, 7 and 8 of the
EQF) (see Figure 2.1). Moreover, the National Education Law (Law no.1/2011)
foresees post-university continuing training and personal development studies
27You can also read