A dynamic and thermodynamic analysis of the 11 December 2017 tornadic supercell in the Highveld of South Africa - WCD
←
→
Page content transcription
If your browser does not render page correctly, please read the page content below
Weather Clim. Dynam., 2, 373–393, 2021
https://doi.org/10.5194/wcd-2-373-2021
© Author(s) 2021. This work is distributed under
the Creative Commons Attribution 4.0 License.

A dynamic and thermodynamic analysis of the 11 December 2017
tornadic supercell in the Highveld of South Africa
Lesetja E. Lekoloane1,2 , Mary-Jane M. Bopape1 , Tshifhiwa Gift Rambuwani1 , Thando Ndarana3 ,
Stephanie Landman1 , Puseletso Mofokeng1,4 , Morne Gijben1 , and Ngwako Mohale1
1 South African Weather Service, Pretoria, 0001, South Africa
2 Global Change Institute, University of the Witwatersrand, Johannesburg, 2050, South Africa
3 Department of Geography, Geoinformatics and Meteorology, University of Pretoria, Pretoria, 0001, South Africa
4 School of Geography, Archaeology and Environmental Studies, University of the Witwatersrand,

Johannesburg, 2050, South Africa

Correspondence: Lesetja E. Lekoloane (lesetja.lekoloane@weathersa.co.za)

Received: 28 July 2020 – Discussion started: 3 August 2020
Revised: 16 February 2021 – Accepted: 19 February 2021 – Published: 28 April 2021

Abstract. On 11 December 2017, a tornadic supercell ini-           vergence. Future investigations will involve experimental re-
tiated and moved through the northern Highveld region of           search over the Highveld region of South Africa to under-
South Africa for 7 h. A tornado from this supercell led to         stand mesoscale and local dynamics processes responsible
extensive damage to infrastructure and caused injury to and        for tornadogenesis in some severe storms. Such a study, to
displacement of over 1000 people in Vaal Marina, a town lo-        the best of our knowledge, has never been conducted.
cated in the extreme south of the Gauteng Province. In this
study we conducted an analysis in order to understand the
conditions that led to the severity of this supercell, includ-
ing the formation of a tornado. The dynamics and thermo-
dynamics of two configurations of the Unified Model (UM)           1   Introduction
were also analysed to assess their performance in predicting
this tornadic supercell. It was found that this supercell initi-   Human survival and development are directly and indirectly
ated as part of a cluster of multicellular thunderstorms over a    impacted by weather and climate extremes (Nuttall, 1998;
dry line, with three ingredients being important in strength-      IPCC, 2014). In their different spatial and temporal scales
ening and maintaining it for 7 h: significant surface to mid-      and reach, extreme weather events can result in prolonged
level vertical shear, an abundance of low-level warm mois-         negative socio-economic impacts and affect different facets
ture influx from the tropics and Mozambique Channel, and           of the society, including ecosystems (Meehl et al., 2000). Ex-
steep mid-level lapse rates. It was also found that the 4.4 km     amples of these extremes include powerful synoptic tropical
grid spacing configuration of the model (SA4.4) performed          systems such as Tropical Cyclone Eline (Reason and Keibel,
better than the 1.5 km grid spacing version. SA1.5 underes-        2004) and Tropical Cyclone Idai (WMO, 2019) that occurred
timated the low-level warm moisture advection and conver-          in the years 2000 and 2019, respectively. These severe storms
gence, and missed the storm initiation. SA4.4 captured the         affected millions of people in the southern African mainland.
supercell; however, the mid-level vorticity was found to be        Extreme weather events have been observed in other parts
1 order of magnitude smaller than that of a typical meso-          of the world, for instance the unusually extended tornado
cyclone. A grid length of 4.4 km is too coarse to fully cap-       outbreak that occurred across the central and eastern United
ture the details of a mesocyclone, which may also explain          States during May 2003 and resulted in about USD 829 mil-
why the model underestimated the surface to mid-level wind         lion of property damage (Hamill et al., 2005). There is grow-
shear and low-level horizontal mass and moisture flux con-         ing evidence suggesting that these extreme events are becom-
                                                                   ing more common across the globe and can be expected to in-

Published by Copernicus Publications on behalf of the European Geosciences Union.
374         L. E. Lekoloane et al.: A dynamic and thermodynamic analysis of the 11 December 2017 tornadic supercell

crease in intensity and frequency due to climate change (e.g.    but they are frequently reported in the Highveld regions of
Handmer et al., 2012; Melillo et al., 2014; EASAC, 2018).        Gauteng, north-eastern Free State, western Mpumalanga, and
   There is no region on Earth immune to extreme or severe       south-central KwaZulu Natal (Goliger and Retief, 2007).
weather events, but the most vulnerable communities are es-         Research has shown that the possible two main important
pecially those from developing countries (Mirza, 2003). For      factors for the initiation of tornadoes in thunderstorms are
example, many developing countries’ economies and liveli-        large amounts of low-level water vapour and the presence of
hoods are highly dependent on primary sectors of the econ-       boundary layer vertical wind shear (Markowski and Richard-
omy (UN, 2018a) such as agriculture and fishing, the nega-       son, 2009). A recent study by Dahl (2017) has shown that
tive effects of which have already been experienced due to an    the tilting of horizontal vorticity alone is not enough to pro-
increase in high-impact weather events (Adger et al., 2003;      duce a rotating updraught in supercells. For the tilting of hor-
Awojobi and Tetteh, 2017). Therefore, an understanding of        izontal vorticity, a downdraught is needed possibly at the rear
these high-impact weather events, and being able to predict      flank of the storm to pair the updraught in the inflow side of
them precisely, is of importance for sustainable development     the storm (Davies-Jones et al., 2001). However, this down-
as well as mitigation and adaptation strategies.                 draught is not necessary if near-surface vertical vorticity pre-
   One of the regions identified as highly vulnerable to cli-    existed before the storm genesis, in which case near-surface
mate change and its effects is sub-Saharan Africa (Boko          convergence alone is enough for tornadogenesis (Markowski
et al., 2007). Most countries in this region of the world        and Richardson, 2009). Davies-Jones (2015) has summarised
are lacking behind in the development scale (Carley and          tornadogenesis in supercells as occurring in three stages: the
Bustelo, 1986) and have many stressors including high-           formation of mesocyclone in the mid-level, rotation at the
impact weather events (UN, 2018b). Although no sin-              ground, and tornado formation or failure.
gle weather event can be confidently attributed to climate          On 11 December 2017, a supercell thunderstorm associ-
change, an increasing number of studies are documenting a        ated with large hail, strong damaging winds, and a tornado
positive trend of severe weather events in southern Africa       tracked through Vaal Marina, a town in the extreme south of
(Davis-Reddy and Vincent, 2017; Kruger and Nxumalo,              the Gauteng Province of South Africa. The tornadic supercell
2017). These include an increase in the frequency of extreme     led to trees being uprooted, destroyed commercial and resi-
rainfall events associated with land-falling tropical cyclones   dential properties, and left about 50 people injured and over
and severe thunderstorms, particularly in the eastern parts of   1100 informal settlement dwellers displaced (SAWS, 2018).
southern Africa and south of South Africa (Malherbe et al.,      The aim of this study is to perform an analysis of this su-
2013; Engelbrecht et al., 2013).                                 percell in order to understand the conditions that led to its
   A climatological analysis over South Africa indicates an      severity, including the formation of a tornado in Vaal Marina.
increase in extreme rainfall events, especially during spring    The dynamics and thermodynamics of two configurations of
and summer months (Engelbrecht et al., 2013; DEA, 2016)          a numerical weather prediction (NWP) model operationally
mostly in the form of convective precipitation (Tyson and        run at the South African Weather Service (SAWS) are also
Preston-Whyte, 2000; Hart et al., 2013). The eastern parts of    analysed and evaluated to see how they performed in pre-
South Africa are dominated by thunderstorms during sum-          dicting this tornadic supercell.
mer months which often result in fatalities, serious injuries,      NWP has advanced over the years (Bauer et al., 2015),
and extensive damage to infrastructure including crops and       with current NWP models operating in the convection-
livestock (Gijben, 2012; NDMC, 2018).                            permitting scale where convection schemes are switched off
   Thunderstorms are primarily classified either as single       or restricted (Clark et al., 2016). A numerical modelling
cell, multicell, or supercell – all three types could be-        study by Weisman et al. (1997) found that a 4 km model
come very severe and destructive, with supercell thunder-        grid spacing may be sufficient to reproduce mesoconvec-
storms notoriously known for producing spectacular torna-        tive circulations and net momentum and heat transport of
does (Houze, 1993). It should be noted that some multi-          midlatitude-type convective systems. With this understand-
cell thunderstorms can also produce tornadoes (including         ing the super-parameterisation modelling procedure was de-
non-mesocyclonic tornadoes) and that not all supercell thun-     veloped with most of the embedded cloud-resolving mod-
derstorms produce tornadoes (Markowski and Richardson,           els running with a grid length of 4 km (Randall et al., 2003,
2009). Tornadoes are common around the world, but the most       2016). Other studies, however, argue that models of grid
severe are often reported in the United States of America        spacing of 1 km or less are the ones adequate to represent
(e.g. Hamill et al., 2005).                                      dynamics and local processes responsible for triggering con-
   South Africa experiences a significant number of severe       vection (see Roberts, 2008; Bryan et al., 2003). In this study,
thunderstorms annually, especially during summer months          we consider a model run with a grid length of 4.4 and 1.5 km.
over the Highveld (Gijben, 2012). A few of these inten-
sify to severe supercell type and often result in strong dam-
aging winds, large hail, and tornadoes (Rae, 2014; Glick-
man, 2000). Tornadoes can occur anywhere in South Africa,

Weather Clim. Dynam., 2, 373–393, 2021                                               https://doi.org/10.5194/wcd-2-373-2021
L. E. Lekoloane et al.: A dynamic and thermodynamic analysis of the 11 December 2017 tornadic supercell                      375

2     Data and methods                                            and surface coupling) which are treated and computed differ-
                                                                  ently.
2.1     Area of interest
                                                                  2.2.2   Radiosonde, satellite, station, and radar data
The focus area of this study is in the northern parts of the
Highveld region of South Africa and covers Vaal Marina lo-        To perform an analysis of the thunderstorm and its proximal
cated in the extreme south of the Gauteng Province and the        environment during its life cycle, surface weather station data
storm track in the Free State and Mpumalanga provinces as         and radar data are obtained from the SAWS weather station
shown in Fig. 1. The locations of SAWS radars used to track       and radar networks. Surface observation data from a total of
the storm of interest and weather stations where data were        up to 228 automatic weather stations across South Africa
analysed for mesoscale circulations, in this study, are also      were regridded and used for synoptic analysis. The regrid-
shown. The storm track as shown in Fig. 1 was identified and      ding is done using the Cressman objective analysis scheme
reproduced using the Thunderstorm Identification, Tracking,       which is described in detail by Cressman (1959). The re-
Analysis and Nowcasting (TITAN) and QGIS software to              gridded surface data points are 25 km apart. Only a selected
mark geographic information system (GIS) locations of the         number of stations proximally closer to the storm track in the
cell for each radar scan (for both radars in Irene and Ermelo,    Free State, Gauteng, and Mpumalanga provinces were used
individual and merged for validation) from initiation to dis-     for mesoanalysis (see Fig. 1). The surface station data used
sipation of the storm.                                            contain temperature, dew point temperature, pressure, wind
                                                                  speed, wind direction, and rainfall. A surface chart analysis
                                                                  was also performed using data from these stations.
2.2     Datasets                                                     To capture data from middle to lower levels of the
                                                                  storm, the Irene (25.87◦ S, 28.22◦ E) and Ermelo (26.53◦ S,
2.2.1    The Unified Model                                        30.03◦ E) weather radars are used to track the storm through-
                                                                  out its cycle, from initiation to dissipation (see Fig. 1).
The primary model data analysed in this study are from the        We also include the Integrated Multi-satellite Retrievals for
Unified Model (UM) (version 10.4). The UM is a seam-              Global Precipitation Measurement (GPM) (IMERG) for pre-
less and deterministic numerical modelling system originally      cipitation observation (Huffman et al., 2019).
developed by the United Kingdom’s Meteorological Office              A 12:00 UTC Irene weather office radiosonde sounding,
(UKMO) for weather prediction and climate studies (Davies         on the day considered, is used as a proximity sounding
et al., 2005). This model is operationally run four times a       of the atmospheric conditions at Vaal Marina. The Irene
day on the SAWS CRAY XC-30 high-performance comput-               weather office is located about 110 km north of Vaal Ma-
ing system. Initial and boundary conditions from the Global       rina and is therefore within the proximity sounding criteria
Atmosphere (GA, Walters et al., 2017) are used as the driv-       for the location as defined by Craven and Brooks (2004). Ra-
ing data for the purpose of producing short-range operational     diosonde sounding from the Bram Fischer International Air-
weather forecasts of up to 3 d ahead.                             port (FABL) in Bloemfontein was also used to capture up-
   The UM is run in two configurations of the regional and        stream winds.
sub-regional domains with 70 vertical levels. The first config-
uration runs at a horizontal grid length of 4.4 km (this con-     2.2.3   Reanalysis data and synoptic analysis
figuration is hereafter referred to as SA4.4) and covers the
domain from 0 to 36◦ S and 5 to 54◦ E. This setup essen-          The fifth-generation reanalysis of the atmosphere (ERA5)
tially covers the Southern African Development Community          produced by the European Centre for Medium-Range
(SADC) except the northern parts of the Democratic Repub-         Weather Forecasts (ECMWF) on single and pressure levels
lic of the Congo. The second configuration is centred over        is utilised to analyse meteorological conditions of the day.
South Africa from 20 to 36◦ S and 15 to 34◦ E and is run at       The ERA5 dataset is the state-of-the-art atmospheric reanal-
a horizontal grid length of 1.5 km (this configuration is here-   ysis of the global climate with a horizontal grid length of
after referred to as SA1.5). The model configurations anal-       0.25◦ ×0.25◦ and 137 vertical levels up to 1 Pa (Hersbach and
ysed in this study were both operationally initialised and run    Dee, 2016). Parameters analysed from this dataset include
at 00:00 UTC on 11 December 2017.                                 10 m winds; mean sea level pressure; convective and non-
   The dynamical core of the model configurations in              convective precipitation; and geopotential heights at 850,
this study uses a semi-implicit semi-Lagrangian formula-          500, and 300 hPa levels. A surface chart analysis performed
tion to solve the non-hydrostatic, fully compressible deep-       by operational forecasters at the SAWS for 12:00 UTC on
atmosphere equations of motion (Wood et al., 2014). On the        11 December 2017 is also used in the synoptic analysis and
other hand, physical parameterisations of sub-grid processes      mesoanalysis.
are split into slow processes (radiation and microphysics) and       To further analyse instability, the ERA5 dataset is used
fast processes (atmospheric boundary layer turbulence, cloud      to plot and analyse the environmental lapse rate (ELR) and

https://doi.org/10.5194/wcd-2-373-2021                                             Weather Clim. Dynam., 2, 373–393, 2021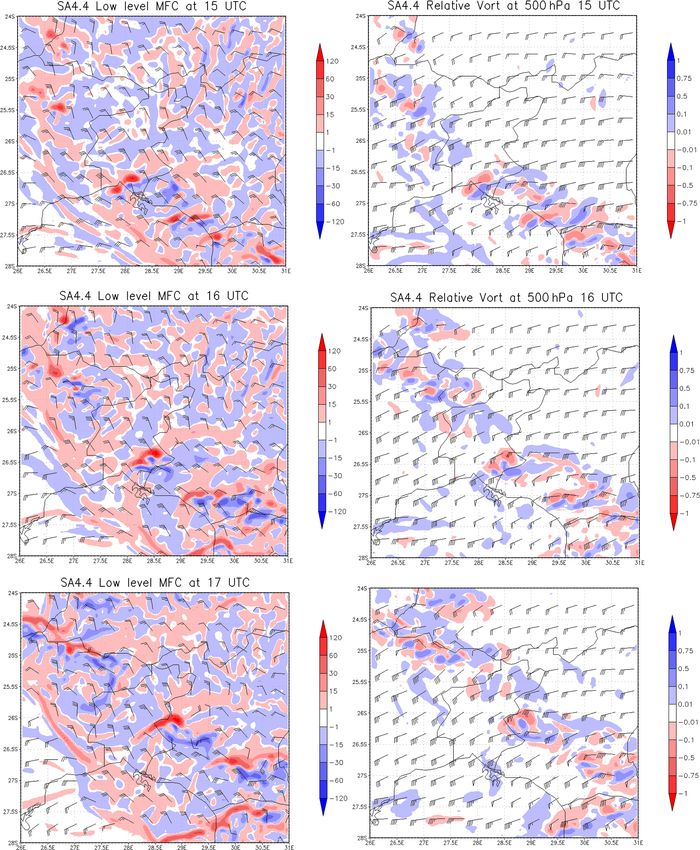
376 L. E. Lekoloane et al.: A dynamic and thermodynamic analysis of the 11 December 2017 tornadic supercell
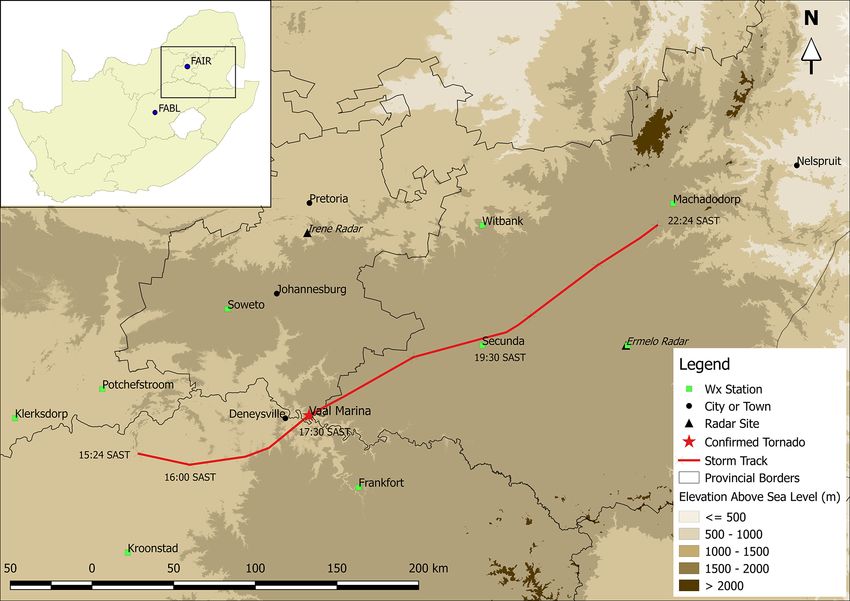
Figure 1. The map of South Africa highlighting northern parts of the Highveld (defined as enclosed by the 1500 m a.s.l. height). The supercell
track is indicated with a red line and includes the location of the storm at local times during its 7 h propagation. Weather stations (Wx Stations)
where surface data were analysed for mesoscale circulations are also indicated, including the location of the Vaal Marina tornado. The top
left embedded image indicates locations where radiosondes analysed were released, in Irene (FAIR) and Bloemfontein (FABL).
used to supplement upper-air sounding data. ELR fields are noring the effects of friction, the Boussinesq approximation
analysed between 700 and 500 hPa, which typically repre- of the vorticity equation can be written as
sents the mid-levels of the atmosphere. The mid-level ELRs
∂ω
are calculated by looking at the decrease in temperature with = ∇ × V × ω + ∇ × (B k̂), (1)
height (Glickman, 2000) as indicated by the following equa- ∂t
tion: where ω = (ξ, η, ζ ) and V = (u, v, w) respectively repre-
dT sents vorticity and velocity vectors in the horizontal (x, y
0=− , axis) and vertical (z axis), and B is the buoyancy.
dz
It is not uncommon for thunderstorms to rotate, with
where T is the temperature in degrees Celsius (◦ C), z is supercell thunderstorms spectacularly distinguished by an
the altitude in kilometres (km), and 0 is the lapse rate in even stronger and persistent vertically rotating updraught
◦ C km−1 . (Doswell and Burgess, 1988; Houze, 1993). Consequently,
the current study utilises the vertical component of relative
2.2.4 Dynamic and thermodynamic analysis vorticity ζ as a diagnostic tool of rotation in the vertical axis.
It can be derived from Eq. (1) to get
In this study, both the 4.4 and 1.5 km horizontal grid spac-
ing of the model configurations are not high enough to re- ∂ζ
= k̂ × ∇ × V × ω + k̂ × ∇ × (B k̂). (2)
liably use only wind vectors as a determinant of organised ∂t
mesoscale rotation. As an alternative, vorticity is used as a
It should be noted from Eq. (2) that k̂ × ∇ × B k̂ = 0. This
measure of rotation and has an added advantage in that it in-
cludes most of the flow even in our considered resolutions implies that buoyancy is not directly responsible for the gen-
and is also much easier to use for rotation analysis compared eration of vertical vorticity and therefore vertical rotation in
to only using wind vectors (Stevens and Crum, 2003). thunderstorms. Further simplifying Eq. (2) gives
Vorticity is a curl of velocity and gives the measure of a ∂ζ ∂w
fluid’s infinitesimal rotation (Holton and Hakim, 2013). Ig- = −V × ∇ζ + ωH × ∇H w + ζ , (3)
∂t ∂z
Weather Clim. Dynam., 2, 373–393, 2021 https://doi.org/10.5194/wcd-2-373-2021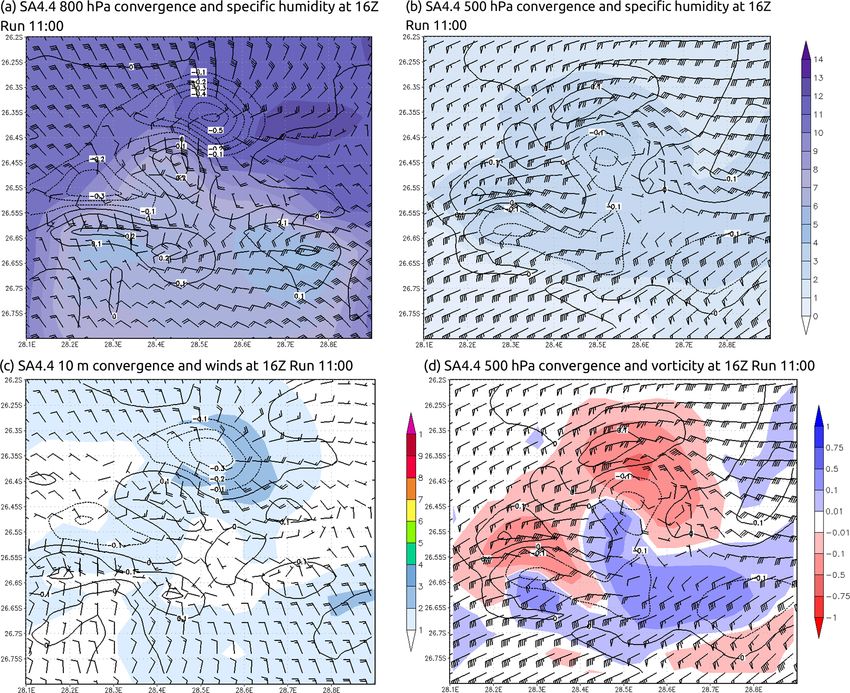
L. E. Lekoloane et al.: A dynamic and thermodynamic analysis of the 11 December 2017 tornadic supercell 377
where the terms on the right-hand side of the equation respec- winds and large hail (SABC, 2017). Visual impacts of the
tively represent the advection, tilting, and stretching terms. observed severe storm were also captured by some reports
In this study our dynamical definition of a mesocyclone and indicate uprooted trees, damaged houses, and shacks, in-
follows that of Glickman (2000), which defines it as a cy- cluding damaged infrastructure such as overhead power lines
clonically rotating vortex in a thunderstorm associated with (Storm Report SA, 2017). From these vast reports, it is clear
vorticity on the order of 10−2 s−1 or greater. The horizontal that this was a high-impact weather system and is therefore
scale of this vortex is normally somewhere between 2 and important to analyse.
10 km in a thunderstorm.
To analyse the significance of low-level moisture in the 3.1 Synoptic setting and meteorological conditions of
event considered, the convergence of moisture flux is inte- 11 December 2017
grated from the surface up to 600 hPa level. Moisture flux
convergence (MFC) is a useful diagnostic tool for convection On 11 December 2017, the analysis indicates the pres-
initiation as it combines the effects of moisture advection and ence of a ridging anticyclone which extended north of the
convergence and can be computed at any atmospheric pres- south-eastern subcontinent and in the process of breaking
sure level (Banacos and Schultz, 2005). The reason we inte- off from the parent Atlantic anticyclone to merge with the
grate from the surface to 600 hPa is because we want to cap- south Indian Ocean anticyclone located east of South Africa
ture the significance of the convergence of low-level moisture (indicated by the letter H over south-west Indian Ocean,
fluxes. Ndarana et al. (2021) argues that the flow associated SWIO; Fig. 2d). The Atlantic anticyclone began ridging be-
with ridging South Atlantic anticyclones, a low-level synop- hind a cold front which moved over south of the conti-
tic driver in our study, changes completely beyond 600 hPa nent between 8 and 9 December and was located south-
to become sinusoidal and westerly. east of the continent on 10 December. The ridging anti-
To derive an equation for MFC, the conservation of water cyclone, which was situated in the south-eastern subconti-
vapour is used and is further expanded and written in flux nent on 10 December, led to an influx of warm and un-
form using the continuity equation to get stable low-level moisture from SWIO through the Mozam-
bique Channel into the eastern and central provinces of South
∂q ∂ Africa: Mpumalanga, Limpopo, Gauteng, North West, and
+ ∇ × qV h + (qω) = S = E − P , (4)
∂t ∂p Free State. The northward-extended, and now breaking, ridg-
where q is the specific humidity, and the second and third ing anticyclone on 11 December was coupled with a deep-
terms respectively represent horizontal and vertical moisture ened surface trough in the central interior of South Africa (in-
flux divergence. S represents the sources and sinks of the air dicated by the letter L over South Africa; Fig. 2d, cf. Fig. 2c),
parcel’s water vapour evaporation rate (E) and precipitation resulting in moisture level increase in the eastern half of the
rate (P ), assuming that all condensed water precipitates im- country due to warm tropical inflow of unstable air mass.
mediately. MFC is computed by taking the negative of the The analysis also indicates the presence of a mid-
horizontal moisture flux divergence in Eq. (4), which gives tropospheric trough over the south-east of the continent and a
ridge extending over Namibia and the western parts of South
MFC = −∇ × qV h . (5) Africa (Fig. 2b). This mid-level circulation pattern resulted
in mid-atmospheric south-westerly winds over the interior
MFC is then integrated from the surface (ps ) to 600 hPa and of South Africa, which enhanced convective instability over
becomes the east-central part of the country as a result of the steep
Zps mid-level lapse rates and low-level warm and moist air in the
∗ 1 east. This instability can clearly be seen from environmental
MFC = − ∇ × qV h dp. (6)
g lapse rates which are discussed in much detail in Sect. 3.2
600 (mesoanalysis). A weak upper-air trough was also present
over South Africa (Fig. 2a).
3 Results and discussion These synoptic settings and conditions (as indicated in
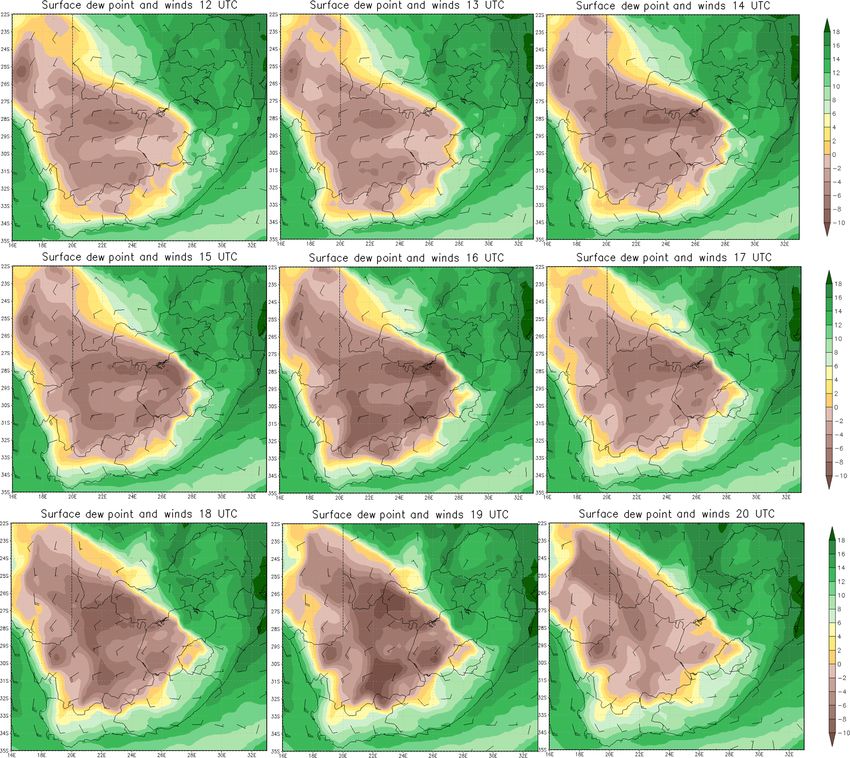
Fig. 2) resulted in the western half of South Africa being
Media reports indicated that on the late afternoon of 11 De- hot and dry, while the eastern parts were cool and moist
cember 2017, a severe thunderstorm, which resulted in exten- with low-level clouds present (Figs. 3–5). Figure 3 indi-
sive damage, tracked through the extreme south of the Gaut- cates that conditions that prevailed at 12:00 UTC, also pre-
eng Province of South Africa (Mitchley, 2017). Some eye- vailed throughout the afternoon (12:00 to 16:00 UTC; 14:00
witnesses reported seeing a tornado close to Deneysville near to 18:00 local time; Fig. 4 and 5) with little fluctuation.
the Vaal Dam, which later made its way to Vaal Marina and The 12:00 UTC surface dew point temperature analysis
Mamello informal settlement (all these locations are here- for 11 December 2017 conducted by operational forecast-
after collectively referred to as VAM) (Mashaba and ANA ers at the SAWS indicated the presence of a dry line over
reporter, 2017). Witnesses also reported strong, damaging the central Free State Province, which extended through the
https://doi.org/10.5194/wcd-2-373-2021 Weather Clim. Dynam., 2, 373–393, 2021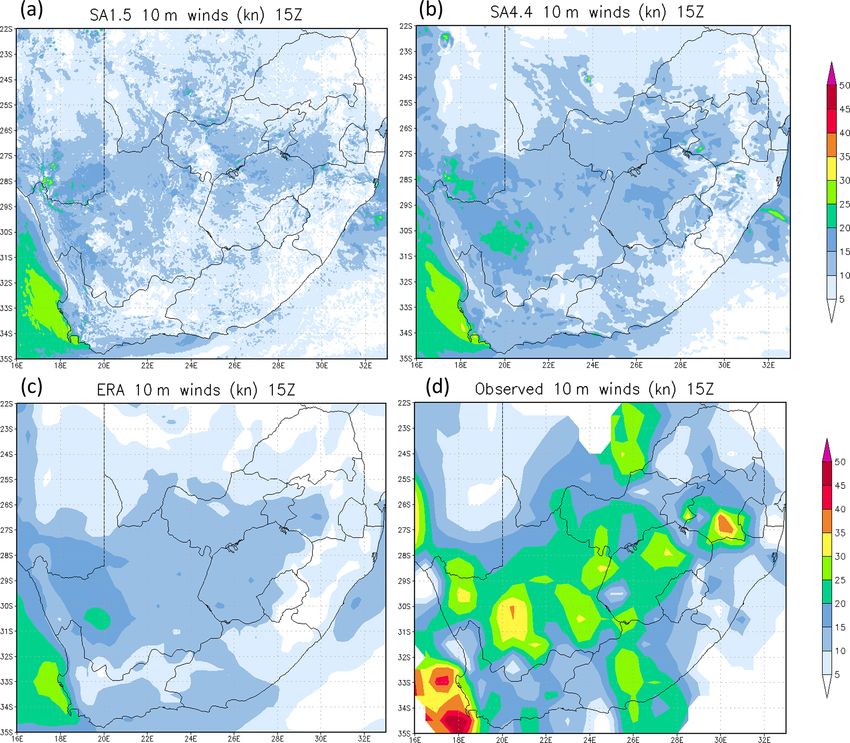
378 L. E. Lekoloane et al.: A dynamic and thermodynamic analysis of the 11 December 2017 tornadic supercell
Figure 2. Synoptic chart analysis indicating mean sea level pressure (in hPa) and 850, 500, and 300 hPa Geopotential heights for 11 December
2017 at 12:00 UTC over southern Africa and the surrounding oceans. Descriptions for each frame are contained in the body text.
south-western areas of the North West Province and south- 3.2 Mesoanalysis
western parts of Botswana (Fig. 3). Figure 4 indicates that
at 12:00 UTC, the reanalysis data compares well with that 3.2.1 Surface analysis
of the surface chart analysis. It also clearly indicates the dry
line over the central Free State Province, which also extends
Surface station data near the thunderstorm track were used
through the south-western areas of the North West Province
for mesoanalysis. Data analysis from radar and four weather
and south-western parts of Botswana. The dry line separated
stations close to the location of the storm initiation (Potchef-
the hot dry air in the west from the warm moist air in the east
stroom, Soweto, Klerksdorp and Kroonstad) indicates that
and was moving eastwards after sunrise as differential heat-
the storm of interest initiated after 13:00 UTC over a dry
ing allowed vertical mixing to entrain dry air from the west
line. Figures 6 and 7 indicate that along the dry line there
into the moist boundary layer to the east of the dry line. This
was a convergence of moist northerly winds and relatively
dry line was responsible for initiating several severe convec-
dry westerly winds. Throughout the analysis period (from
tive storms in the Free State Province, from which one in-
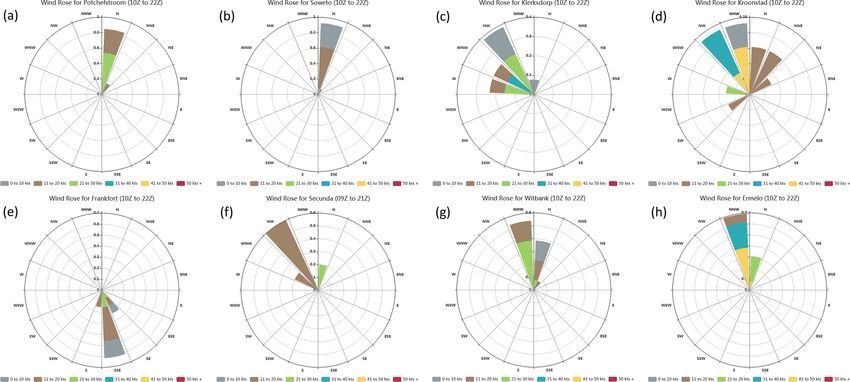
10:00 to 22:00 UTC) Potchefstroom and Soweto recorded an
tensified into a supercell thunderstorm that lasted for 7 h and
advection of moist air from northerly winds, which respec-
resulted in the observed VAM tornado.
tively averaged 25 and 17 kn between 13:00 and 14:00 UTC
(Figs. 6 and 7a and b). During the same analysis period, sta-
Weather Clim. Dynam., 2, 373–393, 2021 https://doi.org/10.5194/wcd-2-373-2021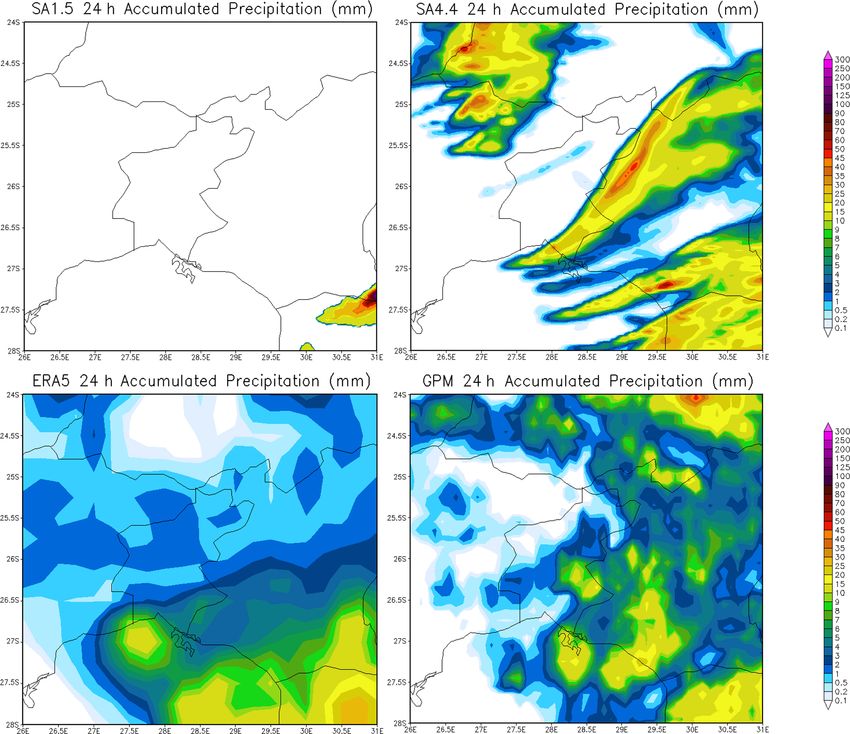
L. E. Lekoloane et al.: A dynamic and thermodynamic analysis of the 11 December 2017 tornadic supercell                       379

Figure 3. Surface chart analysis performed at the South African Weather Service for 12:00 UTC on 11 December 2017. The dry line is
stretching from the Free State Province to the North West Province.

tions at Klerksdorp and Kroonstad reported an advection of          speeds and directions generally represent mesoscale circula-
warm moist air from north-westerly winds which eventually           tion at locations south and proximally closer to VAM since
became hot and dry and changed to westerly after a pas-             it is the only station available around that area. If it does
sage of the dry line (Figs. 6 and 7c and d). The average hot        represent mesoscale circulation south of VAM, then it is
and relatively dry winds in those stations between 13:00 and        more likely that there was convergence of cool and moist
14:00 UTC were 33 kn, with Kroonstad respectively record-           air close to VAM before tornadogenesis occurred between
ing 43 and 33 kn.                                                   Deneysville and Vaal Marina. It is important to note this be-
   After initiation, the storm initially propagated eastwards       cause studies conducted by Seko et al. (2015) and Yokota
and then suddenly changed direction to north-east towards           et al. (2016) revealed that low-level water vapour and con-
the Vaal Dam as it matured into a supercell thunderstorm            vergence near the storm are important factors for low-level
from a continual merger of several cells (see Fig. 1). As           mesocyclogenesis, which is a process important in supercell
the supercell approached the Vaal Dam, it intensified further       tornadogenesis.
and was now associated with large hail and strong damaging
winds, with the first sighting of a tornado near Deneysville        3.2.2   Soundings
(town in the north-western edge of the Vaal Dam). The now
tornadic supercell then moved across the Vaal Dam and               The 12:00 UTC Irene upper-air sounding (Fig. 8) captured
reached Vaal Marina (town in the north-eastern edge of the          north-north-easterly cool and moist surface winds of 10 kn
Vaal Dam), in the extreme south of the Gauteng Province.            which back with height (turns anticlockwise with height,
In Vaal Marina (and Mamello informal settlement), the su-           comparative to veering in the Northern Hemisphere) to west-
percell was still associated with large hail and strong dam-        south-westerly at 500 hPa to become 25 kn. The Bram Fis-
aging winds, and a tornado touchdown track of about 1.5 km          cher International Airport (FABL) sounding indicates much
(1500 m) was confirmed from a site visit (and by confirming         greater mid-level winds of 45 kn upstream. The FAIR and
this in situ data with radar and satellite data).                   FABL upper-air soundings in Fig. 8 confirm winds captured
   It might be significant to note that Frankfort station located   by the synoptic analysis in Fig. 2 close to the soundings
a little over 50 km south-south-east of VAM (see Fig. 1) re-        vicinity. This indicates significant directional shearing be-
ported cool and moist southerly to south-easterly winds al-         tween the surface and the mid-troposphere, while the speed
most throughout the day (Fig. 7e) while stations north of           shearing was respectively weak in FAIR (15 kn at 500 hPa) to
VAM reported cool to warm and moist northerly to north-             moderate (40 kn at 300 hPa). The FABL hodograph indicates
westerly winds. There is not enough surface data in the             unidirectional shearing, while that of FAIR is curved and has
vicinity and south of VAM to know whether Frankfort wind            a common signature for classic supercell development. The

https://doi.org/10.5194/wcd-2-373-2021                                               Weather Clim. Dynam., 2, 373–393, 2021
380         L. E. Lekoloane et al.: A dynamic and thermodynamic analysis of the 11 December 2017 tornadic supercell

Figure 4. Surface dew point and wind analysis between 12:00 and 20:00 UTC. The dew point is in degrees Celsius (◦ C). The dry line can
clearly be seen in the Free State Province and compares well with that identified by the surface chart analysis in Fig. 3.

FAIR sounding also indicates a 35 kn lower mid-level jet and         between Irene and VAM had lapse rate values of between 6
an upper-level west-north-westerly jet of 65 kn, which also          and 7 ◦ C km−1 . These are comparable to lapse rates calcu-
confirm the synoptic analysis in Fig. 2. The lower levels were       lated from the Irene upper-air sounding (FAIR) released at
moist with an average relative humidity of 91 % between the          12:00 UTC, which was approximately 6.5 ◦ C km−1 , increas-
surface and 625 hPa, while the mid-levels were dry with rel-         ing our confidence that the ELRs from the ERA5 reanalysis
ative humidity averaging 26 % between 573 and 400 hPa.               are reliable. This indicates an atmosphere that was condition-
                                                                     ally unstable between Irene and VAM. At the time and loca-
3.2.3   Lapse rate analysis                                          tion of the storm initiation (15:24 local time (13:24 UTC),
                                                                     cf. Fig. 1), Fig. 9 indicates lapse rates of between 7 and
ELR fields shown in Fig. 9 indicate that with availabil-             9 ◦ C km−1 , implying an unstable atmosphere. As the storm
ity of moisture and lift, deep convection was favourable             was propagating north-eastward, ELRs along the storm track
in central and eastern South Africa. Between 10:00 and               were increasing. Figure 9 further indicates that between
14:00 UTC (12:00 and 14:00 local time), the mid-atmosphere           10:00 and 16:00 UTC (12:00 and 18:00 local time), lapse

Weather Clim. Dynam., 2, 373–393, 2021                                                   https://doi.org/10.5194/wcd-2-373-2021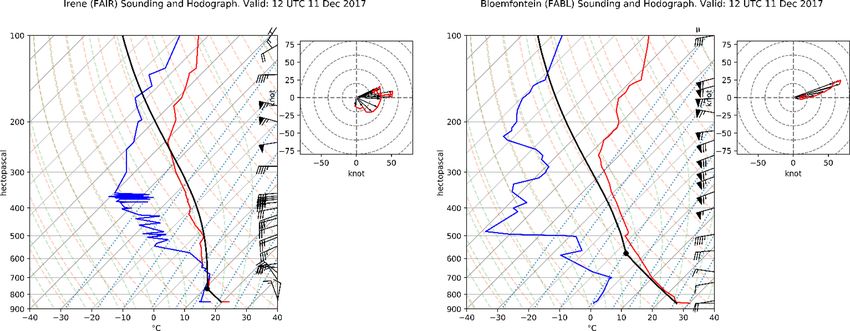
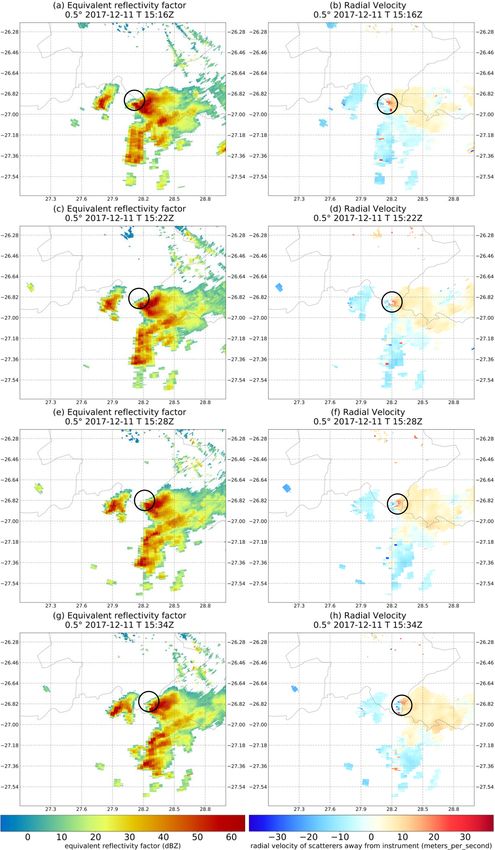
L. E. Lekoloane et al.: A dynamic and thermodynamic analysis of the 11 December 2017 tornadic supercell                           381

Figure 5. Surface temperature and wind analysis between 12:00 and 20:00 UTC. The temperature is in degrees Celsius (◦ C). The analysis
compares well with that of the surface chart analysis in Fig. 3.

rates between VAM and Machadodorp ranged between 6 and               storms (including supercell type) developing in the vicin-
7 ◦ C km−1 . Between 17:00 and 20:00 UTC (19:00 and 22:00            ity. This analysis indicates that three ingredients important
local time) the lapse rates in the same area ranged between          for strengthening and maintaining typical supercell thunder-
7 and 8 ◦ C km−1 . This analysis indicates an increasingly un-       storms were present and can be summarised for this case
stable atmosphere as the storm propagated north-eastward.            as follows: significant surface to mid-level vertical shear, an
The availability of low-level moisture, conditionally unsta-         abundance of low-level warm moisture influx from the trop-
ble atmosphere, and vertical wind shearing made it possible          ics and Mozambique Channel, and the unstable mid-levels
for the storm to initiate, intensify to supercell, and then be       as a result of steep mid-level lapse rates. Prevailing synoptic
maintained for 7 h.                                                  environmental conditions further show that these ingredients
   Therefore, the availability of low-level moisture, steep          also prevailed in the eastern parts of the country, over the
mid-level lapse rates, and vertical wind shearing provided           Highveld region (see Fig. 1), and therefore along the vicinity
favourable conditions for the possibility of dynamically             of the storm track, which indicates that they likely played a
and thermodynamically induced organised severe thunder-

https://doi.org/10.5194/wcd-2-373-2021                                                 Weather Clim. Dynam., 2, 373–393, 2021
382          L. E. Lekoloane et al.: A dynamic and thermodynamic analysis of the 11 December 2017 tornadic supercell

Figure 6. The graph is indicating changes in temperature and dew point temperature as reported by four weather stations located proximally
closer to the location of the storm initiation between 00:00 and 23:00 UTC on 11 December 2017.

Figure 7. Wind rose diagrams of eight weather stations proximally closer to the storm track (as depicted in Fig. 1) between 10:00 and
22:00 UTC on 11 December 2017.

role in ensuring that the supercell storm is strengthened and          (Fig. 10). Figure 10a indicates a hook echo west of the Vaal
maintained throughout its lifetime.                                    Dam at 15:16 UTC which was associated with local strong
                                                                       cyclonically rotating winds as indicated by the radial veloc-
3.2.4   Radar data                                                     ity inbound–outbound maxima in Fig. 10b (this could explain
                                                                       the tornado observed near Deneysville). A hook echo was
A hook echo can clearly be seen from the low levels of                 also observed 12 min later at 15:28 UTC over Mamello, an
the storm between 15:16 and 15:34 UTC as observed by the               informal settlement located in the eastern outskirts of Vaal
first sweep of the Irene radar (at an elevation angle of 0.5◦ )        Marina (Fig. 10e). Figure 10f indicates that this hook echo

Weather Clim. Dynam., 2, 373–393, 2021                                                      https://doi.org/10.5194/wcd-2-373-2021
L. E. Lekoloane et al.: A dynamic and thermodynamic analysis of the 11 December 2017 tornadic supercell 383
Figure 8. Irene (FAIR) upper-air sounding at 12:00 UTC on 11 December 2017. This is used to proximate atmospheric conditions over VAM.
The Bram Fischer International Airport (FABL) upper-air sounding at 12:00 UTC is also included and indicates upstream mid-level winds
of about 45 kn. Hodographs are included for each sounding, indicating wind shear between the surface and 10 km above ground level.
over Mamello was also associated with local strong circu- VAM between 15:00 and 16:00 UTC. The timing of this pre-
lating winds. This analysis indicates that it is most likely cipitating storm as predicted by SA4.4 was correct; however,
that the tornado that was reported to have devastated VAM the location was slightly north of the actual observation (cf.
touched down multiple times between 15:15 and 15:30 UTC Fig. 10). This is a common issue with convection-permitting
(17:15 and 17:30 local time) but could also have been on the models which prompted the scientific community to develop
ground during this entire period or for a period longer than new metrics to verify these types of models to avoid penalis-
the mesocyclone that was captured by the radar. ing them twice for misplacing rainfall (e.g. Davis et al., 2009;
After passing through the VAM area, the supercell contin- Gilleland et al., 2009). On the other hand, SA1.5 failed to
ued in the north-easterly direction, weakening and strength- predict any precipitation close to VAM between 15:00 and
ening throughout before dissipating just before reaching 16:00 UTC or anytime during the analysis period (between
Machadodorp in Mpumalanga Province. Near the storm track 12:00 and 24:00 UTC) (see Fig. 11).
throughout (except for Frankfort), surface winds were vari- An analysis of the 10 m wind directions in SA4.4 and
able between northerly and north-westerly (Fig. 7). The su- SA1.5 generally agrees with observed surface northerly to
percell dissipated on approach to Machadodorp, where winds north-westerly wind directions close to VAM; however, the
were variable between north-easterly to easterly between wind speeds are underestimated in both models (Fig. 12).
19:00 and 20:00 UTC (21:00 and 22:00 local time) and av- Figure 12a and b show that SA1.5 and SA4.4 predicted al-
eraged 8 kn. most similar wind speeds at 15:00 UTC, which are under-
estimated compared to observations (Fig. 12d). The simu-
3.3 Unified Model analysis lated wind speeds by the UM are more similar to the ERA5
(Fig. 12c), and the similarities are larger with the SA4.4. The
The 24 h rainfall total is shown in Fig. 11 for both SA1.5 ERA5 winds are also lower than those observed using SAWS
and SA4.4, as well as the ERA5 reanalyses and IMERG, ground stations. A sample of three stations along the storm
which represents observations. Both the ERA5 and IMERG track taken proximally closer to the location of initiation,
captured rainfall in the area where the storm passed; how- propagation, and dissipation stages of the storm (Klerksdorp,
ever, there are differences in the two datasets. For example, Witbank (also known as Emalahleni) and Machadodorp) in-
IMERG indicates a large amount of rainfall in the north-east dicates that SA4.4 and SA1.5 especially underestimated the
border of the plot. The ERA5 shows a large amount of rain- wind speeds during the initiation stage of the storm (Fig. 13).
fall only in the south-east of the domain shown. The SA4.4 The ERA5 winds are stronger than both UM configurations,
simulated a large amount of rainfall in different parts of the despite the ERA5’s lower resolution compared to these con-
domain, while the SA1.5 only simulated a large amount of figurations.
rainfall in the south-east border of the domain. We also inves- The SA4.4 generally indicates westerly and south-
tigated the timing of rainfall in the SA4.4 and found that the westerly 500 hPa winds at 15:00 UTC over VAM (Fig. 14).
model predicted a precipitating storm propagating north of Considering surface winds, the SA4.4 indicates the pres-
https://doi.org/10.5194/wcd-2-373-2021 Weather Clim. Dynam., 2, 373–393, 2021384 L. E. Lekoloane et al.: A dynamic and thermodynamic analysis of the 11 December 2017 tornadic supercell Figure 9. Environmental lapse rates (in ◦ C km−1 ) fields calculated between 700 and 500 hPa (mid-levels) from ERA5 reanalysis. The fields have an interval of 0.5 ◦ C km−1 . ence of vertical shear between the surface and the mid-levels; dynamical definition of a mesocyclone, which is an indica- however, the speed shearing is possibly underestimated espe- tor that SA4.4 did not capture the mesocyclone of the VAM cially during the initiation phase of the storm. The SA4.4 pre- storm and therefore underestimated its severity. However, dicted a south-westerly propagation of 500 hPa vertical vor- contrary to supercell storms in the midlatitudes, most storms ticity north of VAM between 15:00 and 16:00 UTC (Fig. 14). developing in the subtropics (which is where South Africa The maximum negative vorticity at 500 hPa reached by the is located) do so without strong vertical shear and are rather VAM storm, as predicted by SA4.4, ranged between −0.5 × associated with weak or moderate vertical wind shear (San- 10−2 and −0.75×10⁻² s−1 from 16:00 and 17:00 UTC. This som, 1966; Hand and Cappelluti, 2011). It may therefore be vertical vorticity was 1 order of magnitude smaller than a argued that relatively lower amounts of vertical wind shear Weather Clim. Dynam., 2, 373–393, 2021 https://doi.org/10.5194/wcd-2-373-2021
L. E. Lekoloane et al.: A dynamic and thermodynamic analysis of the 11 December 2017 tornadic supercell                                   385

Figure 10. Irene radar equivalent reflectivity factor (dBZ) and radial velocity of scatterers (m s−1 ) of the supercell thunderstorm as plotted
using the Python ARM Radar Toolkit (Py-ART) (Helmus and Collis, 2016). Panel (a), (c), (e), and (g) indicate low-level reflectivity as
captured by the first radar sweep at an elevation angle of 0.5◦ for every 6 min, between 15:16 and 15:34 UTC. Panel (b), (d), (f), and (h)
radar scans have similar properties to the panel (a), (c), (e), and (g) radar scans but for the radial velocity of scatterers.

https://doi.org/10.5194/wcd-2-373-2021                                                       Weather Clim. Dynam., 2, 373–393, 2021
386          L. E. Lekoloane et al.: A dynamic and thermodynamic analysis of the 11 December 2017 tornadic supercell

Figure 11. Total precipitation for 11 December 2017, in the area of interest (in mm) as predicted by SA1.5 and SA4.4, and also from ERA5
and GPM.

in the subtropics, and in our case study, correlate with rel-         the equatorward side of the storm and then gets uplifted as
atively lower relative vertical vorticity and therefore rela-         updraughts. Figure 15a also indicates that low-level diver-
tively weaker mesocyclone according to classical definitions          gence is associated with relatively lower values of specific
as stated by Glickman (2000).                                         humidity, which implies that there is low-level diverging dry
   A relationship between MFC and vertical vorticity was              air in the polarward side of the storm. Figure 15b shows that
also determined. It was found that SA4.4 predicted vorticity          the low-level diverging dry air depicted in Fig. 15a particu-
maxima at 500 hPa, which is associated with MFC maxima                larly originates from the mid-levels.
at low levels. MFC initiates first at the low level followed             The analysis also indicates a coupling of 800 hPa conver-
by vorticity genesis at 500 hPa. This implies that the devel-         gence (divergence) fields with 500 hPa (divergence) conver-
opment of MFC in the low levels could be a precursor of               gence fields, which is an indicator that the low-level con-
vertical vorticity initiation in the mid-levels. Since there is a     verging moist air in the equatorward side of the storm gets
positive relationship between low-level MFC and mid-level             uplifted with updraughts to the dry mid-levels and then later
vorticity, it follows that the stronger the low-level MFC, the        gets advected to the low levels with the downdraughts in the
stronger the mid-level vorticity would be. This finding is in         polarward side of the storm (Fig. 15a and b).
agreement with a study by Banacos and Schultz (2005).                    Figure 15c depicts 10 m winds and convergence (diver-
   Further examination of the VAM storm during its 500 hPa            gence) analysis. It should be noted that this analysis indicates
vorticity maxima as predicted by SA4.4 (which occurred be-            that near-surface convergence (divergence) field patterns are
tween 16:00 and 17:00 UTC) reveals that low-level conver-             similar to those at 800 hPa shown in Fig. 15a, which are to-
gence occurred in the equatorward side of the storm and di-           gether coupled with 500 hPa divergence (convergence) fields
vergence in the polarward side of the storm. Figure 15a in-           shown in Fig. 15b. Figure 15c indicates that there are two ar-
dicates that low-level convergence was associated with rel-           eas of updraught origin near the surface (ahead of the storm
atively higher values of specific humidity. This implies that         and at the rear flank of the storm), which are both located in
there is an inflow of low-level moist air which converges in          the equatorward side of the storm, as also confirmed by the

Weather Clim. Dynam., 2, 373–393, 2021                                                     https://doi.org/10.5194/wcd-2-373-2021
L. E. Lekoloane et al.: A dynamic and thermodynamic analysis of the 11 December 2017 tornadic supercell                          387

Figure 12. A comparison of observed surface wind speed from weather stations across South Africa at 15:00 UTC (d) with 10 m predicted
winds by (a) SA1.5 and (b) SA4.4. Panel (c) indicates ERA5 winds. All the wind magnitudes are given in knots at an interval of 5 kn.

mid-level convergence and vorticity analysis (Fig. 15d). Fig-        dry air which is being entrained from behind the storm and
ure 15c also indicates areas of forward-flank and rear-flank         are later advected to the surface as the rear-flank down-
downdraughts, which are in the polarward side of the storm,          draughts. Figure 15 further indicates that surface and low-
as also confirmed by the mid-level convergence and vorticity         level convergence is associated with the storm’s cyclonic up-
analysis (Fig. 15d).                                                 draughts, while divergence is associated with anticyclonic
   Figure 15 can be summarised as follows. There is a conver-        downdraughts.
gence of moist and relatively stronger surface and low-level            It is interesting to note that this analysis indicates that
winds ahead of the storm which are uplifted as updraughts            SA4.4 predicted thunderstorm dynamics consistent with
to the mid-levels. Some of these updraughts diverge as they          those of a classic supercell. Therefore, from a dynamical per-
reach the mid-levels and are later advected to the lower levels      spective, SA4.4 was able to predict the VAM supercell, even
and surface as relatively dry downdraughts, which then also          though its strength was underestimated and location was in-
diverge ahead of the downdraught area (toward the north-             correct possibly due to a lack of data assimilation.
east as part of a front-flank gust front) and toward the rear
flank of the storm (toward the west as part of a rear-flank
gust front) on reaching the surface. The north-eastward di-          4   Summary and conclusion
verging winds then contribute to uplifting the inflowing moist
air ahead of the storm. On the other hand, the westward di-          In this study an analysis of the tornadic supercell that tracked
verging winds converge with north-westerly inflowing moist           through the northern parts of the Highveld in South Africa on
air in the rear flank of the storm, initiating a second area of      11 December 2017 was performed. It was found that this su-
updraughts in the rear flank of the storm. These rear-flank up-      percell initialised in the Free State Province as part of a clus-
draughts also diverge in the mid-levels and contribute to the        ter of multicellular thunderstorms over a dry line and prop-
forward-flank downdraughts. The diverging mid-level winds            agated in a north-easterly direction while strengthening and
from the rear-flank updraughts also converge with mid-level          weakening throughout its lifetime, until it dissipated 7 h later

https://doi.org/10.5194/wcd-2-373-2021                                                 Weather Clim. Dynam., 2, 373–393, 2021
388         L. E. Lekoloane et al.: A dynamic and thermodynamic analysis of the 11 December 2017 tornadic supercell

Figure 13. A comparison of average wind speeds from three stations along the storm track (Obs) compared to SA1.5, SA4.4, and ERA5 data
for those stations between 01:00 and 23:00 UTC. All the wind magnitudes are given in knots at an interval of 5 kn.

on approach to Machadodorp in the Mpumalanga Province.               analysed had a diameter of between 20 and 30 km, which
It was also found that three ingredients were likely impor-          may provide an explanation of why SA1.5 does not capture
tant in strengthening and maintaining this supercell: signifi-       any storm, and therefore may be a case of missed convection
cant surface to mid-level vertical shear, an abundance of low-       initiation.
level warm moisture influx from the tropics and Mozambique              SA4.4 was able to capture the supercell being analysed.
Channel, and the steep mid-level lapse rates.                        However, the severity of this supercell was underestimated,
   On approach to the extreme south of the Gauteng                   possibly due to an underestimation in the mid-level vortic-
Province, the already severe supercell encountered even              ity which was found to be 1 order of magnitude smaller than
more low-level moisture in the area which resulted in a tor-         that of a typical mesocyclone. This underestimation in mid-
nado being initiated south of Deneysville town at approxi-           level vorticity might be a result of poor model resolution of
mately 17:15 local time. The supercell tracked through the           surface to mid-level vertical wind shear and low-level hori-
Vaal Dam and continued through the town of Vaal Marina               zontal mass and moisture flux convergence, due to the model
and the Mamello informal settlement at around 17:30 local            grid spacing. The poor model resolution is, therefore, a pos-
time.                                                                sible explanation of why SA4.4 might have underestimated
   NWP models operationally run at the SAWS were also                the mesocyclone. SA4.4 also predicted a correct timing of
analysed and evaluated to see how they performed in predict-         the supercell; however. the location was incorrect, which
ing this tornadic supercell. It was found that the 4.4 km grid       is a common issue found in convection-permitting models.
spacing model (SA4.4) performed better than the 1.5 km grid          This result is consistent with those from studies by Stein et
spacing model (SA1.5) in predicting this supercell. This is in       al. (2019), which found that while the correct cover of rain-
spite of the horizontal resolution of SA1.5 being higher than        fall may be predicted by SA4.4, it may be predicted in the
that of SA4.4 and, therefore, expected to be able to repre-          wrong location.
sent small-scale atmospheric processes better. The poor per-            From these results, it is recommended that research into
formance of SA1.5 might have emanated from a significant             the possibility and benefits of implementing dynamic and
underestimation in low-level warm moisture advection and             thermodynamic objective analysis schemes, which are de-
convergence (which act as dynamic lifting mechanisms). Al-           rived from both NWP model data output and near-real-time
ternatively, it could be a case of missed convection initiation.     surface and upper-air observations, be conducted for a very-
Keat et al. (2019) have found that most rainfall, as simulated       short-range objective prediction of severe thunderstorm (in-
by SA1.5, is produced by large storms of at least 50 km in           cluding supercells) initiation over the central and eastern
diameter. In our study, radar indicates that the storm being         parts of South Africa.

Weather Clim. Dynam., 2, 373–393, 2021                                                   https://doi.org/10.5194/wcd-2-373-2021
L. E. Lekoloane et al.: A dynamic and thermodynamic analysis of the 11 December 2017 tornadic supercell                               389

Figure 14. Low-level MFC and 500 hPa relative vorticity and wind barbs as depicted by SA4.4. The shades in the relative vorticity figures
represent negative (red) and positive (blue) relative vorticity in 10−2 s−1 . MFC is in 10−6 g kg−1 s−1 , with positive values (red shades)
representing areas of convergence of moisture and negative values (blue) representing areas of divergence of moisture.

https://doi.org/10.5194/wcd-2-373-2021                                                     Weather Clim. Dynam., 2, 373–393, 2021
390          L. E. Lekoloane et al.: A dynamic and thermodynamic analysis of the 11 December 2017 tornadic supercell

Figure 15. The 16:00 UTC SA4.4 analysis of the (a) 800 hPa and (b) 500 hPa convergence/divergence (in 10−2 s−1 ) at contour intervals of
0.1 × 10⁻² s−1 and specific humidity (in g kg−1 ) at shaded fields of interval 1 × g kg−1 . Panel (c) indicates 10 m convergence/divergence
contour fields (in 10−2 s−1 ) at 0.1 × 10⁻² s−1 intervals and wind barbs and wind magnitude shades (in kn) at 10 kn intervals. Panel (d)
indicates 500 hPa convergence/divergence (in 10−2 s−1 ) at contour intervals of 0.1 × 10⁻² s−1 and vorticity (in 10−2 s−1 ) shaded fields.

   Future investigations will involve experimental research             Author contributions. LEL and MJMB conceived and designed the
over the Highveld region of South Africa to understand                  study. LEL, TGR, MJMB, PM, and TN performed the analysis
mesoscale and local dynamics processes responsible for tor-             while continuously discussing results with all authors, who in turn
nadogenesis in some severe storms. Such a study, to the best            contributed through their feedback. TGR, MG, LEL, and NM cu-
of our knowledge, has never been conducted. This will help              rated the data. LEL wrote the initial draft of the manuscript, with
                                                                        all authors reviewing and contributing in various proportion to sec-
improve representation of regional and local processes in
                                                                        tions. All authors edited the final draft and provided significant com-
mesoscale NWP models which will in turn improve the skill
                                                                        ments and suggestions for further clarity and improvements.
of severe storm prediction over South Africa.

                                                                        Competing interests. The authors declare that they have no conflict
Data availability. The UM is licensed, and legal possibili-             of interest.
ties of accessing its operational data should be cleared with
the SAWS. Radiosonde data can be obtained from the Inte-
grated Global Radiosonde Archive Version 2 (IGRA 2) via
                                                                        Acknowledgements. The authors thank the SAWS for providing
https://doi.org/10.1175/JTECH-D-17-0223.1 (Durre et al., 2018).
                                                                        model and observational data for this study. This work was par-
Radar and weather station data can be obtained from the
                                                                        tially supported through the Climate Research for Development
SAWS. ERA5 data can be obtained from Copernicus Climate
                                                                        (CR4D) Fellowship implemented by the African Academy of Sci-
Change Service Climate Data Store via https://climate.copernicus.
                                                                        ences (AAS) in partnership with the United Kingdom’s Department
eu/climate-reanalysis (Hersbach and Dee, 2016).
                                                                        for International Development (DfID) Weather and Climate Infor-

Weather Clim. Dynam., 2, 373–393, 2021                                                        https://doi.org/10.5194/wcd-2-373-2021
L. E. Lekoloane et al.: A dynamic and thermodynamic analysis of the 11 December 2017 tornadic supercell 391
mation Services for Africa (WISER) programme and the African Davies, T., Cullen, M. J. P., Malcolm, A. J., Mawson, M. H.,
Climate Policy Centre (ACPC) of the United Nations Economic Staniforth, A., White, A. A., and Wood, N.: A new dynam-
Commission for Africa (UNECA). The authors also acknowledge ical core for the Met Office’s global and regional modeling
the SAWS for supporting this study. of the atmosphere, Q. J. Roy. Meteor. Soc., 131, 1759–1782,
https://doi.org/10.1256/qj.04.101, 2005.
Davies-Jones, R.: A review of supercell and tor-
Financial support. This research has been supported by the African nado dynamics, Atmos. Res., 158, 274–291,
Academy of Sciences (grant no. CR4D-19-11). https://doi.org/10.1016/j.atmosres.2014.04.007, 2015.
Davies-Jones, R., Trapp, R. J., and Bluestein, H. B.: Tornadoes
and tornadic storms, chap. 5, Meteorol. Monogr., 28, 167–221,
Review statement. This paper was edited by Johannes Dahl and re- https://doi.org/10.1007/978-1-935704-06-5_5, 2001.
viewed by two anonymous referees. Davis, C. A., Brown, B. G., Bullock, R., and Halley-Gotway,
J.: The Method for Object-Based Diagnostic Evaluation
(MODE) Applied to Numerical Forecasts from the 2005
NSSL/SPC Spring Program, Weather Forecast., 24, 1252–1267,
https://doi.org/10.1175/2009WAF2222241.1, 2009.
References Davis-Reddy, C. L. and Vincent, K.: Climate risk and vulnerability:
A handbook for southern Africa, 2nd ed., CSIR, Pretoria, South
Adger, W. N., Huq, S., Brown, K., Conway, D., and Hulme, M.: Africa, 2017.
Adaptation to climate change in the developing world, Prog. Dev. DEA: Long-Term Adaptation Scenarios Flagship Research Pro-
Stud., 3, 179–195, https://doi.org/10.1191/1464993403ps060oa, gramme for South Africa: Summary for Policy-Makers, Depart-
2003. ment of Environmental Affairs, Pretoria, South Africa, 2016.
Awojobi, O. N. and Tetteh, J.: The impacts of climate change in Doswell, C. A. and Burgess, D. W.: On some issues
Africa: A review of the scientific literature, J. Interdiscip. Multi- of United States tornado climatology, Mon. Weather
discip. Res., 5, 39–52, 2017. Rev., 116, 495–501, https://doi.org/10.1175/1520-
Banacos, P. C. and Schultz, D. M.: The use of moisture flux 0493(1988)1162.0.CO;2, 1988.
convergence in forecasting convective initiation: Historical Durre, I., Yin, X., Vose, R. S., Applequist, S., and Arnfield,
and operational perspectives, Weather Forecast., 20, 351–366, J.: Enhancing the data coverage in the integrated global ra-
https://doi.org/10.1175/WAF858.1, 2005. diosonde archive, J. Atmos. Ocean. Tech., 35, 1753–1770,
Bauer, P., Thorpe, A., and Brunet, G.: The quiet revolu- https://doi.org/10.1175/JTECH-D-17-0223.1, 2018.
tion of numerical weather prediction, Nature, 525, 47–55, EASAC: Extreme weather events in Europe: Preparing for climate
https://doi.org/10.1038/nature14956, 2015. change adaptation: an update on EASAC’s 2013 study, EASAC,
Boko, M., Niang, I., Nyong, A., Vogel, C., Githeko, A., Medany, Teutschenthal, Germany, 1–8, 2018.
M., Osman-Elasha, B., Tabo, R. and Yanda, P.: Africa. Climate Engelbrecht, C. J., Engelbrecht, F. A., and Dyson, L. L.: High-
Change 2007: Impacts, Adaptation and Vulnerability. Contribu- resolution model-projected changes in mid-tropospheric closed-
tion of Working Group II to the Fourth Assessment Report of the lows and extreme rainfall events over southern Africa, Int. J. Cli-
Intergovernmental Panel on Climate Change,edited by: Parry, M. matol., 33, 173–187, https://doi.org/10.1002/joc.3420, 2013.
L., Canziani, O. F., Palutikof, J. P., van der Linden, P. J., and Han- Gijben, M.: The lightning climatology of South Africa, S. Afr. J.
son, C. E., Cambridge University Press, Cambridge, UK, 433– Sci., 108, 1–10, https://doi.org/10.4102/sajs.v108i3/4.740, 2012.
467, 2007. Gilleland, E., Ahijevych, D., Brown, B. G., Casati, B., and
Bryan, G., Wyngaard, J., and Fritsch, J.: Resolution Requirements Ebert, E. E.: Intercomparison of Spatial Forecast Ver-
for the Simulation of Deep Moist Convection, Mon. Weather ification Methods. Weather Forecast., 24, 1416–1430,
Rev., 131, 2394–2416, 2003. https://doi.org/10.1175/2009WAF2222269.1., 2009.
Carley, M. and Bustelo, E.: Social indicators Glickman, T. S. (Ed.): Glossary of Meteorology, 2nd ed., American
and development, Proj. Apprais., 1, 266–268, Meteorological Society, Boston, 2000.
https://doi.org/10.1080/02688867.1986.9726580, 1986. Goliger, A. M. and Retief, J. V.: Severe wind phenomena in South-
Clark, P., Roberts, N., Lean, H., Ballard, S. P., and Charlton- ern Africa and the related damage, J. Wind. Eng. Ind. Aerodyn.,
Perez, C.: Convection-permitting models: a step-change 95, 1065–1078, https://doi.org/10.1016/j.jweia.2007.01.029,
in rainfall forecasting, Meteorol. Appl., 23, 165–181, 2007.
https://doi.org/10.1002/met.1538, 2016. Hamill, T. m., Schneider, R. S., Brooks, H. E., Forbes, G. S.,
Craven J. P. and Brooks, H. E.: Baseline climatology of sounding- Bluestein, H. B., Steinberg, M., Melendez, D., and Dole, R.
derived parameters associated with deep moist convection, Natl. M.: The May 2003 extended tornado outbreak, B. Am. Meteo-
Weather Dig., 28, 13–24, 2004. rol. Soc., 86, 531–542, https://doi.org/10.1175/BAMS-86-4-531,
Cressman, G. P.: An operational objective analysis system, 2005.
Mon. Weather Rev., 87, 367–374, https://doi.org/10.1175/1520- Hand, W. H. and Cappelluti, G.: A global hail climatology using
0493(1959)0872.0.CO;2, 1959. the UK Met Office convection diagnosis procedure (CDP) and
Dahl, J. M. L.: Tilting of horizontal shear vorticity and the develop- model analyses, Meteorol. Appl., 18, 446–458, 2011.
ment of updraft rotation in supercell thunderstorms, J. Atmos. Handmer, J., Honda, Y., Kundzewicz, Z. W., Arnell, N., Benito, G.,
Sci., 74, 2997–3020, https://doi.org/10.1175/JAS-D-17-0091.1, Hatfield, J., Mohamed, I. F., Peduzzi, P., Wu, S., Sherstyukov, B.,
2017.
https://doi.org/10.5194/wcd-2-373-2021 Weather Clim. Dynam., 2, 373–393, 2021You can also read