Flash drought onset over the contiguous United States: sensitivity of inventories and trends to quantitative definitions - HESS
←
→
Page content transcription
If your browser does not render page correctly, please read the page content below
Hydrol. Earth Syst. Sci., 25, 565–581, 2021
https://doi.org/10.5194/hess-25-565-2021
© Author(s) 2021. This work is distributed under
the Creative Commons Attribution 4.0 License.

Flash drought onset over the contiguous United States: sensitivity of
inventories and trends to quantitative definitions
Mahmoud Osman1 , Benjamin F. Zaitchik1 , Hamada S. Badr1 , Jordan I. Christian2 , Tsegaye Tadesse3 ,
Jason A. Otkin4 , and Martha C. Anderson5
1 Department  of Earth and Planetary Sciences, Johns Hopkins University, Baltimore, MD, USA
2 School of Meteorology, University of Oklahoma, Norman, OK, USA
3 National Drought Mitigation Center, University of Nebraska–Lincoln, Lincoln, NE, USA
4 Space Science and Engineering Center, Cooperative Institute for Meteorological Satellite Studies,

University of Wisconsin–Madison, Madison, WI, USA
5 Hydrology and Remote Sensing Laboratory, Agricultural Research Service, USDA, Beltsville, MD, USA

Correspondence: Mahmoud Osman (mahmoud.osman@jhu.edu)

Received: 23 July 2020 – Discussion started: 19 August 2020
Revised: 23 December 2020 – Accepted: 24 December 2020 – Published: 8 February 2021

Abstract. The term “flash drought” is frequently invoked to        tions based on other surface conditions or fluxes. These re-
describe droughts that develop rapidly over a relatively short     sults indicate that “flash drought” is a composite term that
timescale. Despite extensive and growing research on flash         includes several types of events and that clarity in defini-
drought processes, predictability, and trends, there is still no   tion is critical when monitoring, forecasting, or projecting
standard quantitative definition that encompasses all flash        the drought phenomenon.
drought characteristics and pathways. Instead, diverse defi-
nitions have been proposed, supporting wide-ranging studies
of flash drought but creating the potential for confusion as
to what the term means and how to characterize it. Use of          1   Introduction
different definitions might also lead to different conclusions
regarding flash drought frequency, predictability, and trends      The concept of flash drought (Svoboda et al., 2002) has
under climate change. In this study, we compared five previ-       drawn considerable attention in recent years (Anderson et
ously published definitions, a newly proposed definition, and      al., 2013; Basara et al., 2019; Chen et al., 2019; Christian
an operational satellite-based drought monitoring product to       et al., 2019a; Ford and Labosier, 2017; Gerken et al., 2018;
clarify conceptual differences and to investigate the sensitiv-    Hunt et al., 2009; Koster et al., 2019; Li et al., 2020; Liu et
ity of flash drought inventories and trends to the choice of       al., 2020; Otkin et al., 2013, 2018, 2019; Pendergrass et al.,
definition. Our analyses indicate that the newly introduced        2020; Yuan et al., 2019). While there is no single quantita-
Soil Moisture Volatility Index definition effectively captures     tive definition for what constitutes such an event, it is widely
flash drought onset in both humid and semi-arid regions.           understood that some of the most damaging droughts in the
Analyses also showed that estimates of flash drought fre-          United States in the past decade have been flash droughts, in
quency, spatial distribution, and seasonality vary across the      that they have emerged rapidly and caused significant dam-
contiguous United States depending upon which definition           age to natural and managed vegetation (Zhang and Yuan,
is used. Definitions differ in their representation of some of     2020). These flash droughts have been difficult to predict and
the largest and most widely studied flash droughts of recent       monitor (Chen et al., 2019; Ford and Labosier, 2017; Pender-
years. Trend analysis indicates that definitions that include      grass et al., 2020). There is also an understanding that many
air temperature show significant increases in flash droughts       flash droughts are triggered or exacerbated by high tempera-
over the past 40 years, but few trends are evident for defini-     tures leading to increased evaporative demand (Anderson et
                                                                   al., 2013; McEvoy et al., 2016; Otkin et al., 2013, 2018). The

Published by Copernicus Publications on behalf of the European Geosciences Union.
566 M. Osman et al.: Flash drought onset over the contiguous United States
significant impacts and limited predictability of these events late those inventories using a common set of input data and
and their apparent link to high temperatures have led to stud- thresholds. In other cases, the definitions were published
ies of customized event inventories, forecast methods, and without an inventory and sometimes without any recom-
trend analysis (e.g., Mo and Lettenmaier, 2015, 2016; Ford mended thresholds. For those definitions we adapt the de-
and Labosier, 2017). scriptive definitions to a quantitative framework for the pur-
The burst of research interest in flash droughts has yielded pose of creating an inventory. In addition, we propose our
useful insights on process and predictability. But in the ab- own definition, based on root zone soil moisture volatility,
sence of a single generalizable definition, there is poten- which is designed to complement existing definitions, and
tial for divergent results and general fragmentation of re- we compare all proposed flash drought definitions to selected
search agendas insomuch as the same term “flash drought” indicators of drought impacts.
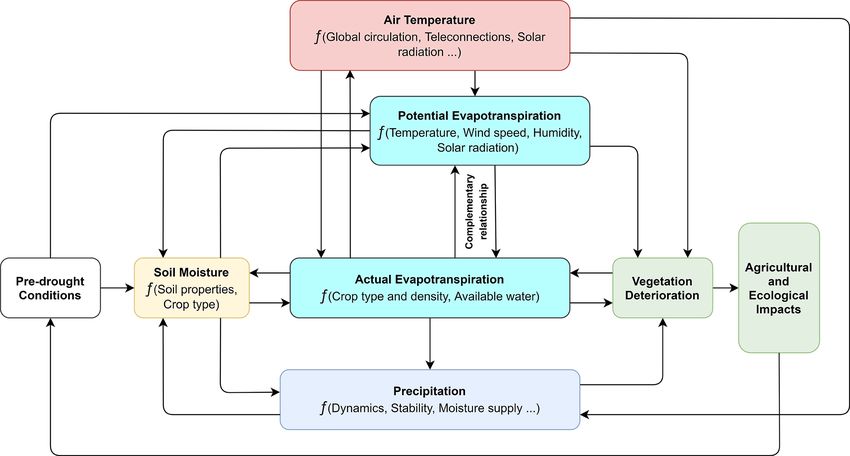
might be applied in inconsistent ways. This potential is ev- In comparing definitions, we can (1) evaluate whether the
ident in Fig. 1, which offers a simplified schematic of key current diversity of flash drought definitions is convergent or
flash drought processes, drawing on previous literature. Flash divergent (i.e., is the concept of flash drought robust to dif-
drought can be triggered due to one or more processes, as for ferent definitions?); (2) identify and characterize the poten-
example in Fig. 1, pre-drought conditions such as early veg- tial divergence between definitions and assess whether dif-
etation green-up due to a warm spring can be a key indicator ferent definitions capture similar processes but diverge be-
of vulnerability (Wolf et al., 2016). Therefore, a feedback cause of threshold effects, timing of diagnosis, or extent
between pre-drought conditions and other climate variables of drought, or whether they capture fundamentally different
should be considered when defining and identifying a flash types of events; and (3) identify events that are considered
drought event. Different colored boxes in the figure indicate to be flash droughts under some definitions but not others
variables or processes that are included in different published and learn from these case studies what elements of a defi-
definitions of flash droughts. For example, as will be de- nition are important when attempting to identify particular
scribed in detail in the Data and methods section, the “heat kinds of flash droughts. We emphasize that the comparison
wave flash drought” definition (Mo and Lettenmaier, 2015) of definitions is not designed to choose a single, “best” way
stresses the role of temperature anomalies and identifies fea- to define flash droughts. Rather, cases of divergence between
tures with short duration, while definitions based on rapid definitions can be used to examine different characteristics of
soil drying (e.g., Hunt et al., 2009; Ford and Labosier, 2017; rapidly intensifying drought events.
Yuan et al., 2019) focus on the rate of change in soil mois-
ture. Other researchers (e.g., Christian et al., 2019a; Pender-
grass et al., 2020) have proposed definitions that use actual 2 Data and methods
and/or potential evapotranspiration anomalies, and still oth-
2.1 Flash drought definitions
ers have applied multivariate products like Quick Drought
Response Index (QuickDRI) hybrid satellite-based maps or We inventory potential flash drought events using a range
the United States Drought Monitor, which consider vegeta- of definitions. As we are concerned primarily with drought
tion status and agricultural impacts in addition to hydrologi- impacts on agriculture and natural vegetation, we focus our
cal variables (e.g., Chen et al., 2019). analysis on spring (MAM), summer (JJA), and fall (SON)
Given this range of variables used to assess flash drought and do not consider winter months. We consider seven meth-
risk and diagnose its occurrence, it is possible that the defini- ods for identifying a flash drought. The first – the Soil Mois-
tions are capturing partially or entirely different pathways in ture Volatility Index (SMVI) – is a new definition proposed
the flash drought process (i.e., different boxes in Fig. 1). here. The next five are drawn from published literature on
This diversity of definitions is not necessarily a weakness flash droughts, and the seventh is based on a remotely sensed
of the literature. Flash droughts, like droughts in general, are product designed to be sensitive to rapid onset droughts.
likely a composite class for which no single definition can Where data coverage allows, we use the 1979–2018 period
meet all needs (Heim, 2002). But it is important to under- for index calculation and comparisons. For some products,
stand the extent to which flash drought inventories are sen- there is a more limited data record, and in those cases, we use
sitive to the choice of definition, as these inventories are the all available data. Differences in input dataset requirements
basis for assessing which regions are most vulnerable to flash and baseline period can affect comparisons across definition
droughts and whether there are trends in flash drought fre- and are noted when relevant. Here we describe each defini-
quencies in any region. These inventories also determine the tion and present the datasets used to calculate them.
population of flash drought events used as prediction targets
when developing forecast systems. 2.1.1 SMVI (Soil Moisture Volatility Index)
With this motivation, this study presents inventories gen-
erated using a number of prominent published flash drought As flash droughts are characterized by rapid onset, we adopt
definitions. In some cases, these definitions have already an approach inspired by studies of market volatility, whereby
been used to generate inventories, and we simply recalcu- robust identification of rapid yet significant changes in stock
Hydrol. Earth Syst. Sci., 25, 565–581, 2021 https://doi.org/10.5194/hess-25-565-2021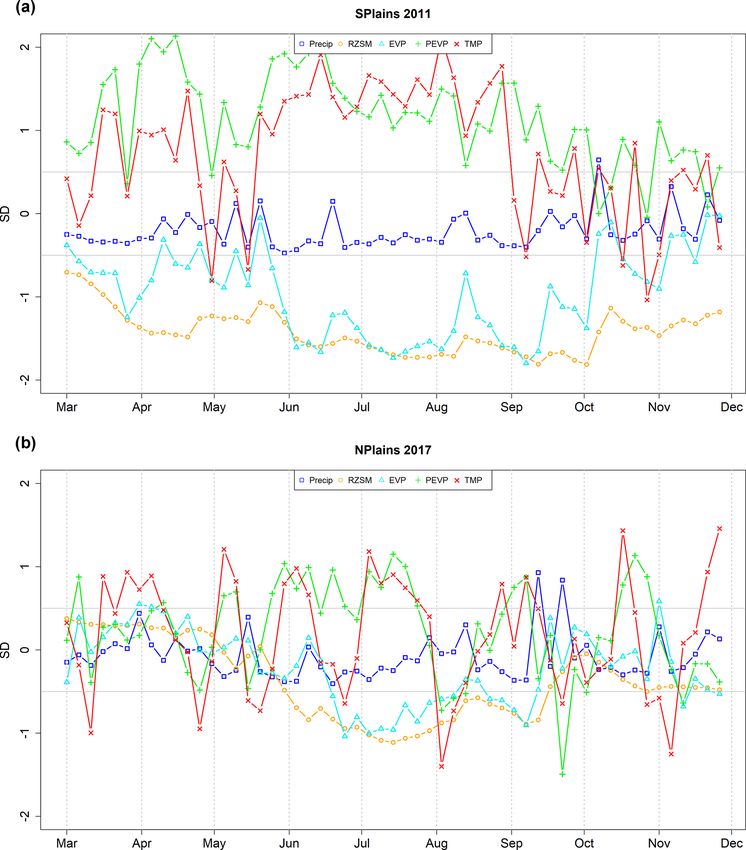
M. Osman et al.: Flash drought onset over the contiguous United States                                                                  567

Figure 1. Schematic of flash drought states and processes. Arrows indicate suggested feedback directions and their relation to the process or
variable (for simplicity, not all proposed feedbacks are represented here). Each color represents a core group of processes used to represent
the different definitions of the onset of flash drought events.

prices is critical. In this definition, a flash drought is said          drought definitions – we prioritize use of a high-quality soil
to occur when (1) the one-pentad (5 d) running average root              moisture estimate. For this reason, we use the Soil MERGE
zone soil moisture (RZSM) falls below the four-pentad (20 d)             (SMERGE) product. SMERGE is a hybrid daily 12.5 km
running average for a period of at least four pentads; and               resolution product generated by combining satellite obser-
(2) by the end of the period, RZSM drops below the 20th                  vations from the European Space Agency Climate Change
percentile for that time of year according to the 1979–2018              Initiative and the North American Land Data Assimilation
period of record. Figure 2 shows an example for the pro-                 System-2 (NLDAS-2; Xia et al., 2012a, b) Noah Land Sur-
posed definition applied over Montana, where the vertical                face Model output for RZSM averaged from 0–40 cm (To-
red-shaded region represents the suggested flash drought on-             bin et al., 2019). The SMERGE dataset has been evaluated
set (climate variables during the event are shown in Fig. S1).           against Normalized Different Vegetation Index (NDVI) prod-
However, specifying the duration of the event, including                 ucts as well as in situ observations, indicating reliability for
transition from flash drought to standard drought, is a sub-             agricultural and ecological applications. For drought moni-
ject of ongoing research. RZSM is chosen over the surface                toring, this product has the advantage of offering spatially
soil moisture (SM) on account of its relevance to vegeta-                and temporally complete RZSM estimates on an NLDAS-2
tion, low noise relative to surface soil moisture, and con-              grid while incorporating additional satellite-derived informa-
sistency with previous studies’ recommendations (Ford and                tion intended to improve these RZSM estimates.
Labosier, 2017; Hunt et al., 2009). Within the framework of
the SMVI, the one-pentad running average represents rapid                2.1.2   SMPD (Soil Moisture Percentiles Drop)
changes in RZSM (short memory), while the four-pentad
running average represents slower changes (longer memory).               Ford and Labosier (2017) introduced a definition based on a
The 20th percentile threshold is selected as recommended                 characterization of flash drought as a rapid descent into agri-
by the USDM (US Drought Monitor) to represent “Moderate                  cultural drought conditions, referred to hereafter as the Soil
Drought – D1” conditions, under which vegetation may start               Moisture Percentiles Drop (SMPD) method. It defines flash
showing signs of water stress. The minimum intensification               drought onset as occurring when the one-pentad running av-
period of four pentads is consistent with recommendations                erage RZSM falls from the 40th to the 20th percentile in a
from Otkin et al. (2018) that a 2-week period of rapid in-               period less than or equal to four pentads. The original defini-
tensification is the minimum length required to capture rapid            tion is based on RZSM from the NLDAS-2 (Xia et al., 2012a,
changes relevant to vegetation health.                                   b) dataset in the eastern United States for the top 40 cm of the
   SMVI is a soil-moisture-based index (yellow box in                    soil column. Here, we apply the definition to gridded 12.5 km
Fig. 1). The strength of the novel SMVI method lies in its               resolution SMERGE data for the 1979–2018 period to gen-
ability to capture rapid changes with respect to a slower dry-           erate a dataset that can be compared to those derived using
ing trend. The index is sensitive to interruptions in drought            other definitions. Like SMVI, SMPD is a soil-moisture-based
onset, however, as it can be reset by rain events. Since RZSM            index (yellow box in Fig. 1).
is key to computing SMVI – as it is to several other flash

https://doi.org/10.5194/hess-25-565-2021                                                  Hydrol. Earth Syst. Sci., 25, 565–581, 2021
568                                                   M. Osman et al.: Flash drought onset over the contiguous United States

Figure 2. SMVI proposed definition as applied to a grid point within the state of Montana in 2017. Shaded red region represents the flash
drought event. Gray shading represents the 10th to 90th percentile climatology of daily RZSM. Vertical blue bars are the region’s averaged
daily precipitation. Vegetation deterioration is evident during the defined flash drought event as NDVI (solid green line) drops below the
climatological NDVI (dashed green line) acquired from MODIS.

2.1.3   SESR (standardized evaporative stress ratio)                   are available in Christian et al. (2019a). It is important to note
                                                                       that SESR has strong criteria that limit flash drought identi-
                                                                       fication to very rapid drought development, and so it is de-
Whereas SMVI and SMPD focus directly on soil moisture,                 signed not to capture flash drought unless there are general
the standardized evaporative stress ratio (SESR) of Chris-             drought conditions. Variables used in SESR are shown in the
tian et al. (2019a) diagnoses flash drought occurrence on              cyan boxes in Fig. 1.
the basis of the normalized ratio between estimated actual                In this paper we use SESR exactly as it was implemented
and potential evapotranspiration. This approach is guided              in the original publication, using the North American Re-
by the principle that development of vegetation stress is              gional Reanalysis (NARR) dataset to provide input variables.
key to an impactful flash drought event, and this stress in-           NARR is a high-resolution atmospheric reanalysis for North
duces a rapid decrease in the transpiration flux during the            America, performed at approximately 0.3◦ resolution. The
drought intensification process (Basara et al., 2019; Chris-           NARR is an appropriate dataset for hydrological applica-
tian et al., 2019b, 2020). For SESR, six pentads is defined as         tions due to the improved analysis of the climate variabil-
the minimum length for flash drought development, with a fi-           ity and diurnal cycle within the model and data assimilation
nal SESR value less than the climatological 20th percentile.           system (Mesinger et al., 2006). We re-grid SESR to match
These two criteria are used to satisfy the drought compo-              the 12.5 km resolution of the other products (SMERGE and
nent of flash drought and to capture flash drought events that         NLDAS-2).
lead to drought impacts. The rate of rapid drought intensifi-
cation is also evaluated with the methodology. Overall, the            2.1.4   HWD (heat-wave-driven)
methodology requires the mean change in SESR during the
six pentads to be less than the 25th percentile to ensure that         In a set of papers, Mo and Lettenmaier (2015, 2016) intro-
the events identified have an overall rapid rate of develop-           duce two paradigms for flash drought definitions. The first
ment toward drought conditions. The percentiles are deter-             is a heat-wave-driven (HWD) flash drought definition, which
mined from the climatological distribution of SESR changes             diagnoses flash drought conditions for any pentad in which
for the given time of year of the flash drought event, with            the 2 m air temperature anomaly is greater than 1 standard
lower percentiles of SESR changes representing a more rapid            deviation, 1 m depth SM falls below the 40th percentile, and
rate toward drought conditions. Additional details of the cri-         the evapotranspiration anomaly is greater than zero. This
teria and an example schematic of the identification process           third condition is designed to capture events in which high

Hydrol. Earth Syst. Sci., 25, 565–581, 2021                                               https://doi.org/10.5194/hess-25-565-2021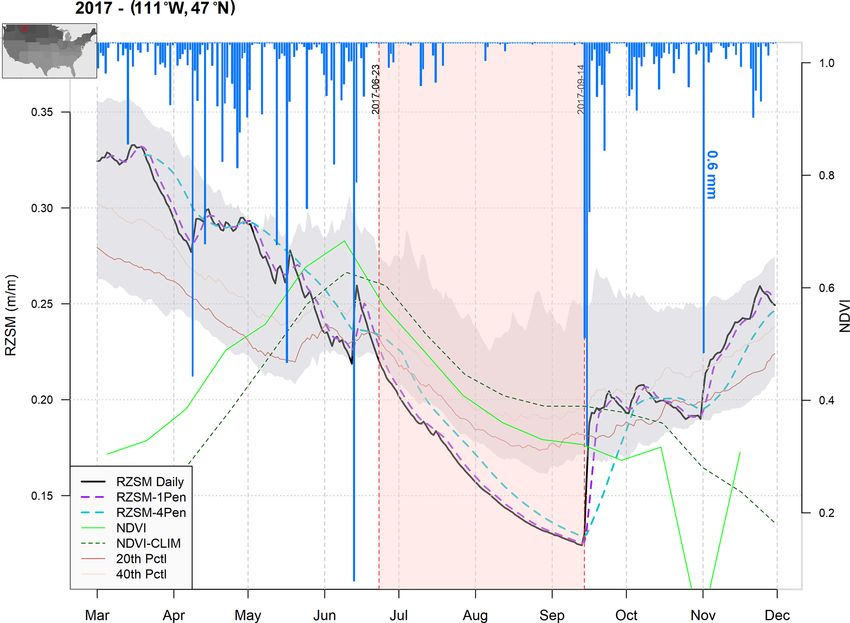
M. Osman et al.: Flash drought onset over the contiguous United States                                                       569

temperature and low soil moisture are defining character-         formation on all of these variables. USDM data are available
istics but for which evapotranspiration has not yet become        from 2000–present.
anomalously low. The HWD definition incorporates informa-
tion from the red, yellow, and (actual evapotranspiration, ET)    2.1.7    QuickDRI (Quick Drought Response Index)
cyan box in Fig. 1.
   We apply the HWD definition using NLDAS-2 meteo-               QuickDRI (Quick Drought Response Index) is a Classi-
rological forcing data and the NLDAS-2 implementation             fication and Regression Trees (CART) machine learning
of the Noah Land Surface Model. We use NLDAS-2 be-                model developed by the National Drought Mitigation Cen-
cause SMERGE does not contain all variables required for          ter (NDMC) and the Center for Advanced Land Manage-
the calculation. However, we have confirmed that replacing        ment Information Technologies (CALMIT) at the University
NLDAS-2 RZSM with SMERGE RZSM has little impact on                of Nebraska. The index was developed specifically to cap-
our HWD flash drought inventory.                                  ture rapidly changing drought conditions. QuickDRI maps
                                                                  drought intensification across the contiguous United States
2.1.5   PDD (precipitation-deficit-driven)                        (CONUS) at 1 km weekly resolution on the basis of nine
                                                                  variables (two vegetation, two hydrologic, one climatic, and
                                                                  four static biophysical parameters) to estimate drought con-
The second paradigm suggested by Mo and Lettenmaier
                                                                  ditions, with resulting drought intensification values scaled
(2015, 2016) is the precipitation-deficit-driven flash drought
                                                                  according to the Standardized Precipitation Evaporation In-
(PDD). In this study we have adopted their recommended
                                                                  dex (SPEI) (https://quickdri.unl.edu/, last access: 2 February
definition, whereby in a one-pentad period, precipitation
                                                                  2021). The QuickDRI inputs span the yellow (included as the
drops below the 40th percentile and the 2 m air tempera-
                                                                  soil moisture), blue (included as the Standardized Precipita-
ture anomaly is greater than 1 standard deviation (similar to
                                                                  tion Index – SPI), cyan (included as the Evaporative Stress
the HWD), while the evapotranspiration anomaly is negative.
                                                                  Index – ESI), and green (included as the Standardized Vege-
The PDD definition incorporates information from the red,
                                                                  tation Index – SVI) boxes in Fig. 1.
blue, and cyan boxes in Fig. 1. Like the HWD, we have also
                                                                     As QuickDRI generates estimates of drought intensifica-
used the NLDAS-2 forcing and Noah model datasets to cal-
                                                                  tion as a continuous variable, it is necessary to define a
culate the definition and to inventory our results.
                                                                  threshold for flash drought occurrence. We set this threshold
   We note that PDD and HWD differ from other proposed
                                                                  as 1 standard deviation below the 4-week historical normal,
flash drought indices in their explicit use of multiple meteo-
                                                                  referred to hereafter as the QuickDRI model flash drought
rological and hydrological variables. Additionally, these def-
                                                                  definition (QD1.0). Since QuickDRI relies heavily on real-
initions diagnose flash droughts on the basis of the duration
                                                                  time remotely sensed data, there are gaps and noise in the
of anomalies rather than their change over time. That is, flash
                                                                  record that must be addressed. We fill in missing data through
droughts in PDD and HWD are acute deviations from clima-
                                                                  linear temporal interpolation, and we mask values greater
tology, rather than periods of rapid intensification.
                                                                  than ±4 standard deviations. QuickDRI data are available
                                                                  from 2000–present.
2.1.6   USDM (US Drought Monitor)
                                                                  2.2     Methods
The United States Drought Monitor (USDM) (Svoboda et al.,
2002), produced by the National Oceanic and Atmospheric           The analyses presented here have been organized using
Administration, the United States Department of Agricul-          Bukovsky regions. The Bukovsky regions are 29 ecore-
ture, and the National Drought Mitigation Center, classifies      gions over United States, Canada, and northern Mexico de-
drought into five intensity categories, ranging from Abnor-       signed to represent climatically homogeneous areas. They
mally Dry (D0) to Exceptional Drought (D4). The USDM is           are similar to the National Ecological Observatory Network
produced in a hybrid process, in which regional expert “au-       (NEON) (Kampe, 2010) ecological regions, with similar
thors” are provided information on more than 40 drought-          sensitivity to variations in regional climatology (Bukovsky,
relevant variables, and these authors then work as a team         2011). Analyses were conducted over the 17 unique regions
to establish the drought map each week. The final prod-           within CONUS (Fig. 3) as well as the eight grouped re-
uct embodies a best estimate of drought conditions as in-         gions as suggested by Bukovsky (2011). Here we present
formed by quantitative indicators, field reports, and expert      results for a subset of regions that capture a relevant diver-
judgment. Data are released as shapefiles, which we raster-       sity of results, while results for all regions are available at
ized to match the resolution of the other products. Following     https://github.com/mosman01/Flash_Droughts/ (last access:
Chen et al. (2019), we then define a flash drought as a degra-    2 February 2021).
dation of two categories or more in a 4-week period. The             The flash drought inventories presented in this paper are
USDM-based flash drought definition potentially includes all      based on flash drought occurrence: as soon as a flash drought
boxes in Fig. 1, as the USDM authors are provided with in-        is identified according to a given definition in a given grid

https://doi.org/10.5194/hess-25-565-2021                                            Hydrol. Earth Syst. Sci., 25, 565–581, 2021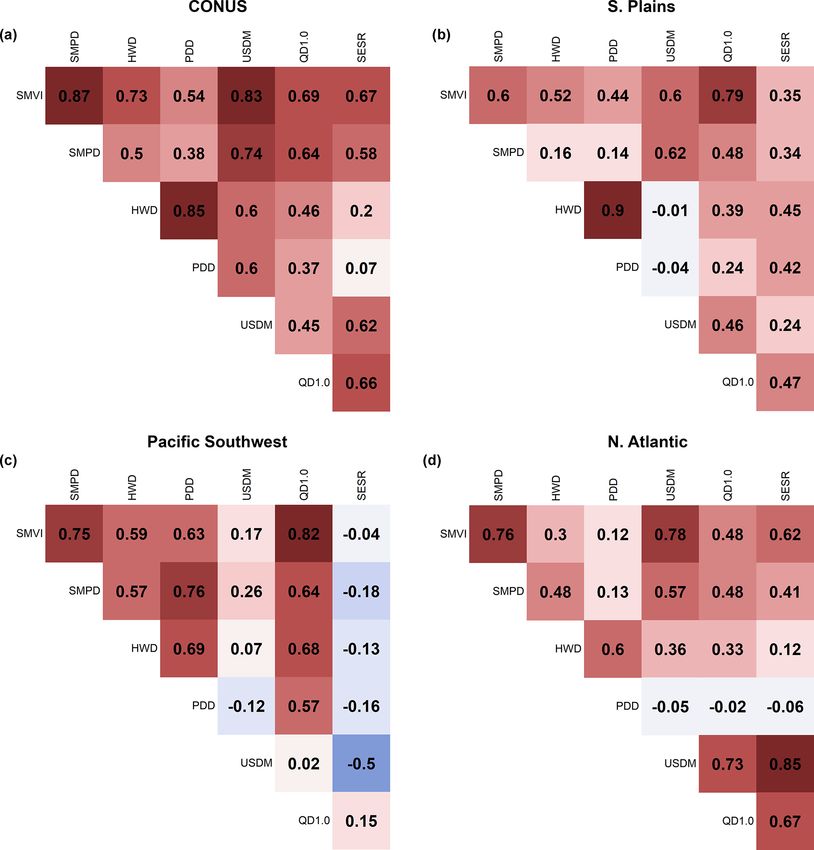
570                                                  M. Osman et al.: Flash drought onset over the contiguous United States

Figure 3. Bukovsky regions within CONUS. Numbers represent groups of regions of similar climate characteristics.

cell, that grid cell is tallied as having experienced flash          for the definitions that can be calculated for the full 40-year
drought in that year. That is, we are concerned with spa-            period (1979–2018).
tial pattern and general seasonality of the occurrence of flash
drought events as diagnosed by different definitions. Inten-
sity and duration of drought are not evaluated. Also, since          3     Results and discussion
definitions differ in if and how they mark the end of a flash
drought event, we count only the first flash drought identi-         3.1    Spatial distribution of flash droughts
fied for a grid cell in each year. The season of this flash
drought (MAM, JJA, or SON) is assigned based on onset                As flash droughts have become recognized as a significant
date. This approach risks missing cases in which two distinct        climate hazard, one key question is whether certain regions
flash drought events hit a single location in one growing sea-       have an elevated probability of experiencing flash drought.
son, but it allows for a consistent inventory across definitions     As shown in Fig. 4, the seven drought definitions consid-
on the basis of “years with flash droughts.” The problem of          ered in this paper offer different answers to this question.
counting multiple events at the same location in a single year       This figure depicts the frequency of flash drought onset at
using different definitions is a point for further research, as      each grid point within the specified season over the period of
differences and ambiguities in how different definitions de-         data availability for each definition through 2018. As noted
fine the end of a flash drought can lead to cases in which one       in Christian et al. (2019a), the SESR identifies the Great
definition diagnoses multiple flash droughts within a period         Plains and western Great Lakes regions as hot spots for flash
that is classified as a single flash drought in another defini-      droughts. This band of high flash drought frequency run-
tion. We do note that this approach captures the first drought,      ning down the middle of the country resembles the region of
so it undercounts late season droughts if they occur in the          strong land–atmosphere coupling identified in Koster et al.
same location as an early season drought. When calculating           (2004) and in subsequent studies of climate feedback zones.
frequency, we use all the available data for each definition         In this sense, the SESR, which depends directly on the ra-
from 1979 to 2018.                                                   tio of actual to potential evapotranspiration, may be empha-
   For results presented by Bukovsky region we calculate the         sizing flash droughts that emerge through land–atmosphere
percentage of area within each region hit by flash drought in        temperature and evaporation couplings, which are strongest
each year. This metric is used for qualitative comparison of         in transitional climate zones. There is a tendency for this
definitions for selected events and for quantitative compari-        SESR hot spot to emerge in the southern Great Plains in
son using Pearson correlations. Spearman and Kendall cor-            the spring (MAM) and to move further north in the summer
relations were also calculated but yielded similar results and       (JJA).
are not presented. Finally, an analysis of the trends in flash          Interestingly, this SESR pattern is nearly inverse to the pat-
droughts annual footprint is carried out for each climatic re-       tern seen for PDD. In PDD, we see the strongest hot spot in
gion within the Bukovsky regions using the Mann–Kendall              the southwest, with a secondary maximum in the more humid
nonparametric trend test. Trend analysis is only performed           eastern United States. While PDD includes actual evapotran-
                                                                     spiration and temperature rules in its definition, it is designed

Hydrol. Earth Syst. Sci., 25, 565–581, 2021                                             https://doi.org/10.5194/hess-25-565-2021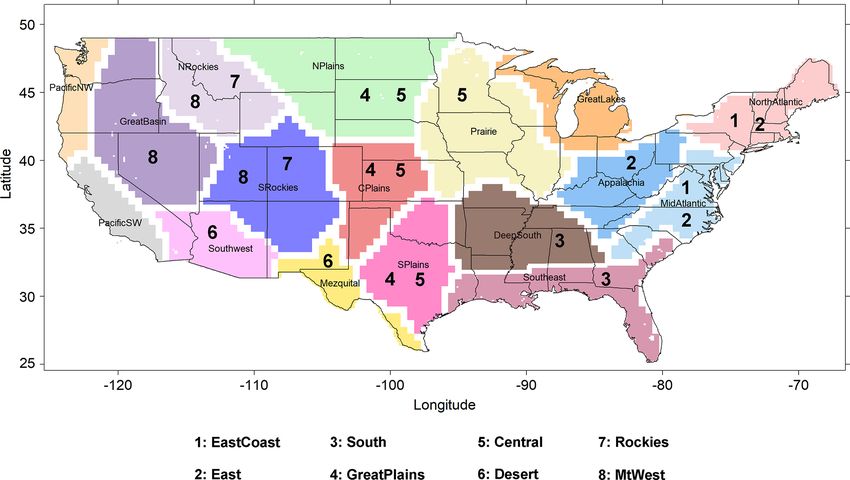
M. Osman et al.: Flash drought onset over the contiguous United States                                                                  571

Figure 4. Flash drought onset frequency for the selected definitions, calculated for the period of available data for each definition through
2018 (1979–2018 for SMVI, SMPD, HWD, PDD, and SESR; 2000–2018 for USDM and QD1.0). White color represents zero frequency.

to capture short meteorological droughts triggered by pre-               Pacific Northwest, followed by a summertime pattern that
cipitation deficit. This results in higher frequencies in semi-          includes significant frequency in the southwest. These differ-
arid regions with high precipitation variability and, to some            ences trace to conceptual differences in the definition. Where
extent, in regions where average rainfall is high and a sig-             SMPD focuses on soil moisture decline over several pentads
nificant negative anomaly in precipitation generally occurs              and thus is likely to capture vegetation-enhanced soil mois-
in concert with the warm conditions required by the PDD                  ture drawdown that occurs in warm or dry springs in highly
definition. In contrast to PDD, the HWD yields a relatively              vegetated areas, SMVI controls for steady decline in order
uniform pattern of flash drought frequency, with lower totals            to isolate very rapid soil moisture drops. This makes it rel-
overall.                                                                 atively less sensitive to seasonal forcing (e.g., warm springs
   Looking at the two soil moisture definitions, SMVI and                leading to steady drying) and more sensitive to subseasonal
SMPD, we see differences in overall frequency and spa-                   processes. SMPD shows a noticeably high frequency of flash
tial and seasonal distribution – which may reflect choice of             drought onset due to the duration threshold of four pentads
threshold values. SMVI shows a relatively muted spatial pat-             or fewer, which allows short meteorological droughts to be
tern, with a broad maximum extending across the middle of                misclassified as flash drought events.
the country and the western northern tier in summer and a                   Considering the hybrid products, USDM and QuickDRI
southwestern maximum in fall. SMPD has a springtime max-                 both show a summertime maximum in flash drought fre-
imum in humid regions of the eastern United States and the               quency but with distinctly different spatial patterns. In gen-

https://doi.org/10.5194/hess-25-565-2021                                                  Hydrol. Earth Syst. Sci., 25, 565–581, 2021
572                                                 M. Osman et al.: Flash drought onset over the contiguous United States

eral, the QuickDRI areas of maximum frequency occur in             ences seen in Fig. 4 and with the fact that the two definitions
drier regions in the western United States, while USDM             are based on very different principles and variables.
shows a maximum in the middle of the country that resem-               These differences become even more pronounced at re-
bles the summertime SESR and SMVI patterns, though with            gional scale. Figure 5b–d show regions in which differ-
a stronger maximum in Texas and Oklahoma. While it is dif-         ences are particularly dramatic – the Southern Plains, Pa-
ficult to diagnose the source of these patterns in a precise way   cific Southwest, and North Atlantic Bukovsky regions – and
given the composite nature of both products and the subjec-        Fig. S2 in the Supplement shows the remaining regions. We
tive component to USDM, it is likely that USDM authors             note that Fig. 5 is designed to highlight regions with sub-
are particularly attuned to agricultural impacts and thus fo-      stantial disagreement between definitions; the full suite of
cus on rapid drying events that have severe impacts on crops       regions shown in Fig. S2 includes a number of regions for
and pastures, while the QuickDRI satellite-derived product         which definitions are in closer agreement with each other.
may also be capturing variability in natural ecosystems and            The Southern Plains is of particular interest, since it is a
regions with less intensive agricultural activities. Different     hot spot in the USDM-based definition and is an active agri-
datasets and different algorithms involved within such com-        cultural region. Here we see that the PDD and HWD defini-
plex model-based products could be a considerable source of        tions have no positive correlation with the USDM definition,
uncertainty and variability.                                       which is again consistent with differences in spatial patterns
   The identification of geographic or seasonal flash drought      seen in Fig. 4 and with the fact that PDD and HWD are de-
hot spots, then, depends strongly on the definition. This          fined to capture short droughts rather than periods of rapid
choice of definition, in turn, will depend on the objective        intensification. Across other definitions, the correlations for
of the flash drought study. Investigating flash drought with       the Southern Plains also tend to be (though are not always)
an emphasis on vegetative impact, for example, might use-          lower than the CONUS-scale correlations. In the North At-
fully apply a flux-informed definition like SESR and would         lantic region, the PDD shows very weak correlations with
consequently focus on flash droughts in regions with land          all definitions except the HWD since they share the common
cover types associated with denser vegetation (e.g., agricul-      heat wave condition. Moving to the more arid Pacific South-
ture, grasslands, and forests). A study or forecast system pri-    west and Desert regions, we begin to see extremely low cor-
marily concerned with the rapid intensification of a flash         relations across definitions, which in part reflects low signal
drought over either a humid or semi-arid region might em-          to noise ratio for drought indicators in dry climate zones and
ploy SMVI, which explicitly controls for more gradual dry-         in part may point to implicit limitations in the useful climatic
ing in order to isolate the most rapidly intensifying portion      range of each definition. In the Pacific Southwest, SESR
of the events.                                                     stands out as having no positive correlation with any other
                                                                   definition except with QD1.0, which is small, and the USDM
                                                                   also shows very weak association with other definitions. This
3.2   Interannual variability
                                                                   is a complicated region that includes arid zones and irrigated
                                                                   agriculture, which would pose complications for an expert-
The definition-based differences in the geography and sea-         informed composite indicator like USDM and which is not
sonality of flash drought frequency described above suggest        represented in NARR or NLDAS. Large expanses of arid ar-
that definitions might also differ with respect to interannual     eas with sparse vegetation coverage might also reduce the
variability. This is a particularly relevant issue for forecast-   utility of a flash drought indicator based on the actual to po-
ing, as differences in interannual variability imply differ-       tential evapotranspiration ratio, such as SESR. Nevertheless,
ences in the prediction-relevant drivers of flash droughts. In-    it is still possible that rapid onset droughts matter in the re-
deed, if we examine interannual variability in flash drought       gion, particularly if they drive up irrigation demand or im-
extent – defined as the percent area that experiences at least     pact natural semi-arid ecosystems. Specifically, for the Pa-
one flash drought in a given year, within a specified region       cific Southwest region, all definitions show relatively lower
of interest – we see substantial differences between defini-       flash drought frequency (SMVI, SMPD, USDM, SESR, and
tions. Figure 5 shows the Pearson’s correlation coefficients       QD1.0; local minimums in Fig. 4) except for PDD.
between different definitions’ area hit by flash droughts an-
nually for four different climatic regions. At CONUS scale         3.3   Representation of major flash drought events
(Fig. 5a), the correlation between certain definitions, such as
the two soil-moisture-based definitions (SMPD and SMVI)            Though there is no single agreed-upon definition for flash
and the USDM, is relatively high (>0.7). This still leaves         droughts, a number of major events in the past decade are
substantial unexplained variability between definitions, but       widely recognized as having flash drought characteristics,
the differences between definitions are larger when compar-        to the point that these events can be thought of as canoni-
ing definitions that include other variables. SESR and PDD,        cal flash drought events. In addition, several major droughts
for example, have virtually no correlation in interannual vari-    that occurred prior to the popularization of the term “flash
ability at CONUS scale, which is consistent with the differ-       drought” have since been recognized as being consistent with

Hydrol. Earth Syst. Sci., 25, 565–581, 2021                                          https://doi.org/10.5194/hess-25-565-2021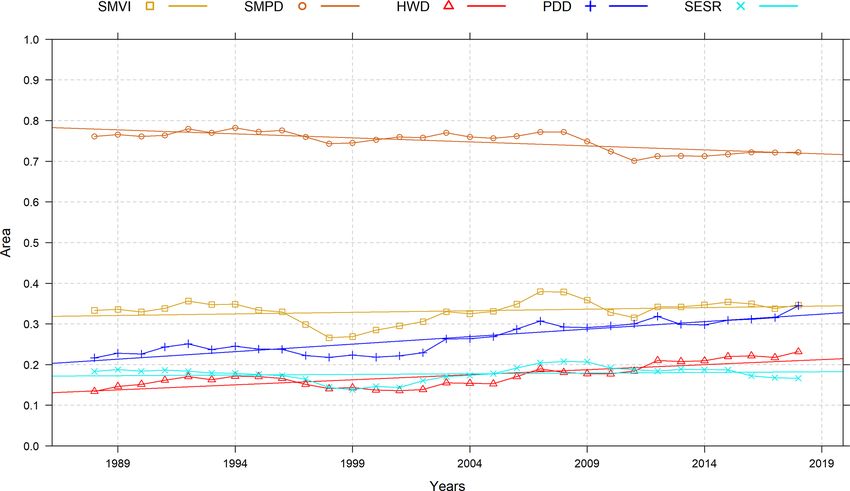
M. Osman et al.: Flash drought onset over the contiguous United States                                                                 573

Figure 5. Pearson’s correlation coefficient matrix for the different definitions’ percentage of area hit by flash droughts over the Bukovsky
regions: (a) CONUS, (b) Southern Plains, (c) Pacific Southwest, and (d) North Atlantic.

flash drought. To obtain a clearer picture of how different def-        July (Lyon and Dole, 1995). As this event predates Quick-
initions capture flash droughts, we examine several of these            DRI and the USDM, we present a simple comparison of the
canonical flash droughts in greater detail.                             other five flash drought definitions (Fig. 6). All definitions
   We begin with an event that pre-dates the term “flash                capture widespread drought, but timing and patterns differ.
drought” but has since been recognized as a member of the               For example, whereas HWD emphasizes acute drought as-
class (Basara et al., 2020; Jencso et al., 2019; Trenberth et           sociated with high temperatures in JJA in the northern tier,
al., 1988; Trenberth and Guillemot, 1996). The 1988 drought             SESR is more sensitive to evapotranspiration deficits across
in the northwest, central, and midwest United States devel-             the middle of the country, which appear as a MAM signal
oped over a period of less than 5 weeks, resulting in severe            in these seasonal maps. Similarly, SMPD is sensitive to dry-
to extreme dry conditions over more than 10 states that cost            ness that appears in MAM, particularly in the eastern United
the nation at least USD 30 billion (National Oceanic and At-            States (consistent with the general spatial pattern of this def-
mospheric Administration, 1988). There was below-average                inition; Fig. 6), while SMVI has characteristics of both the
precipitation prior to the onset of the event, which con-               dry signal in the MAM window and intensification in the JJA
tributed to its evolution. However, the most dramatic mete-             period. We note that our seasonal cutoff dates are arbitrary
orological forcings were the pronounced and extended series             and could mask differences in timing within a season (e.g.,
of heat waves that gripped the country in June, July, and Au-           March vs. May) while emphasizing relatively small timing
gust and which were in their own right responsible for thou-            differences that cross a seasonal break (e.g., May vs. June).
sands of deaths (Changnon et al., 1996; Ramlow and Kuller,              Nevertheless, the analysis captures the general character of
1990; Whitman et al., 1997). These heat waves occurred in               the seasonal timing of events.
combination with below-average precipitation in June and

https://doi.org/10.5194/hess-25-565-2021                                                 Hydrol. Earth Syst. Sci., 25, 565–581, 2021
574                                                  M. Osman et al.: Flash drought onset over the contiguous United States

Figure 6. Flash drought onset maps as captured by different definitions for the years 1988, 2011, 2012, 2016, and 2017. USDM and QD1.0
are available since 2000. The yellow star within Montana on the 2017 panels represents the selected grid point in Fig. 2.

   Jumping forward, in 2011, the Southern Plains experi-             ysis, large-scale teleconnections may have set the stage for
enced a rapid onset, geographically focused flash drought            the flash drought onset in spring and early summer (Basara
that led into an extended drought during the remainder of the        et al., 2019; Fuchs et al., 2015), with rapid intensification
year, making this one of the driest years in Texas since 1917        coming in summer as vegetation stress and heat set in. Re-
(Ejeta, 2012; Nielsen-Gammon, 2012). The different flash             sults from the definitions (Fig. 6) show different patterns for
drought definitions show signs of an early onset in spring           the spread of the drought. While an extensive drought in the
in Texas and the southeast (Fig. 6), which was the actual            middle of the country was in some form by all definitions,
scenario according to the Office of the State Climatologist          the geographic pattern differed. Both HWD and SMVI, for
in Texas (Nielsen-Gammon, 2012), that then spread to other           example, capture a rapid drying in spring in Missouri and
regions during the summer. SESR shows a more eastern pat-            surrounding regions, as abnormally warm conditions led to
tern (where it is more humid), while the QD1.0 has a broad           rapid soil moisture drawdown. The USDM-based definition,
drought signal across the southern tier of the county, but over-     in contrast, shows only limited drought in the MAM win-
all agreement across definitions is quite good. This suggests        dow, with widespread flash drought emerging in JJA. This
that the 2011 flash drought has a consistent signature in mul-       likely reflects the fact that the USDM did not make extensive
tiple meteorological and hydrological variables, which can           use of vegetation indices in 2012, such that it is not opti-
be explained due to the strong relationship between surface          mized to capture rapid droughts (Senay et al., 2008), and the
fluxes in the Southern Great Plains region (Mo and Letten-           warm spring conditions that set the stage for the catastrophic
maier, 2016).                                                        drought of summer are not identified as flash drought when
   The following year, 2012, produced one of the largest and         using the USDM as the input variable.
most well documented flash droughts to date (Basara et al.,             In 2016, the southeast was hit by an “exceptional drought”
2019; Fuchs et al., 2015; Hoerling et al., 2013, 2014; Mallya        (Svoboda et al., 2002), which sparked unusual wildfires that
et al., 2013; Otkin et al., 2016). According to post-event anal-     covered area more than had ever occurred since 1984, leading

Hydrol. Earth Syst. Sci., 25, 565–581, 2021                                             https://doi.org/10.5194/hess-25-565-2021
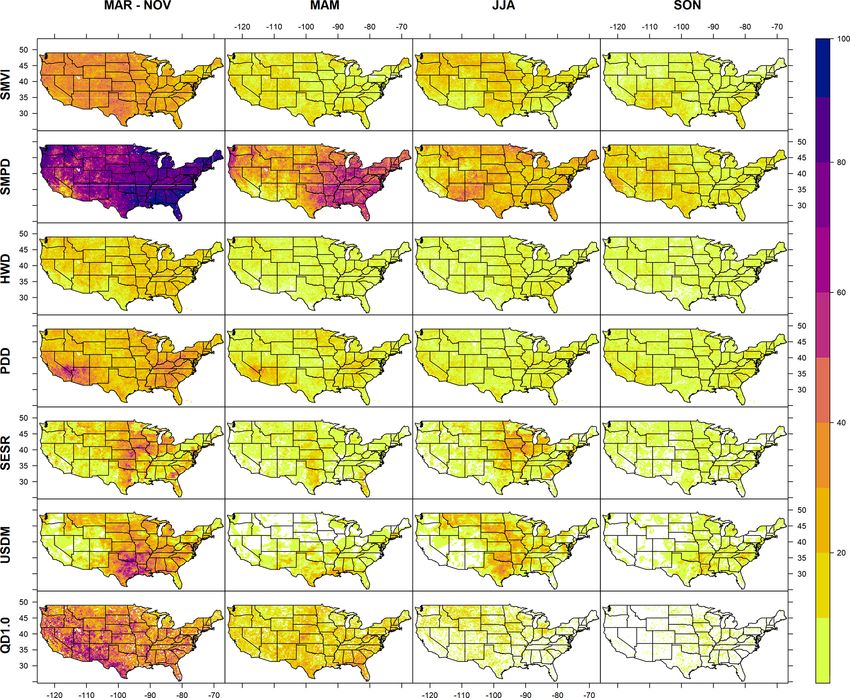
M. Osman et al.: Flash drought onset over the contiguous United States                                                        575

to the destruction of thousands of structures (Park Williams       flash drought definitions (precipitation, RZSM, temperature,
et al., 2017) and severe ecological and socioeconomic im-          and actual and potential evapotranspiration).
pacts (Konrad II and Knox, 2018). The southeast region                During the 2011 flash drought event, temperatures rapidly
has generally experienced an exceptional precipitation deficit     went extremely high and stayed that way for most of the
since 1939 beside a rapid substantial increase in maximum          spring and the whole summer, as did potential evapotranspi-
air temperature and solar radiation (Konrad II and Knox,           ration. While precipitation anomalies remained negative with
2018; Park Williams et al., 2017) which amplified the event        very few exceptions, actual evapotranspiration decreased just
and resulted in the observed severe flash drought event over       after the rapid increase in potential evapotranspiration. The
the months of the fall (Otkin et al., 2018). The 2016 flash        RZSM shows a relatively rapid decline in early summer,
drought was expected to extend eastward towards the Caroli-        which occurs on top of a negative RZSM anomaly inherited
nas, but heavy precipitation from the tropical storms and hur-     from spring (Fig. 7a). In short, all of the key variables ap-
ricanes (Hermine and Matthew) that hit the region ended the        plied in the flash drought definitions show a clear signal of
catastrophic event (Konrad II and Knox, 2018). Results from        rapid change to dry and hot conditions that were sustained
SMVI and USDM-based definitions (Fig. 6) show similar              throughout the event, while precipitation stayed consistently
spatial patterns; however, the USDM one shows an early tim-        low. For this type of event, choice of definition may not be
ing for the onset in MAM and JJA, which is similar to what         critical when attempting to characterize, monitor, or predict
is captured by the QuickDRI-based definition. The SESR             the drought.
definition underestimated the spread of the drought event,            In contrast, during the 2017 Northern High Plains drought
capturing only very few spots of onset in spring and sum-          (Fig. 7b) temperature was highly variable, and SM and ET
mer months. Despite the high temperatures and precipitation        did not fulfill the HWD conditions for drought onset, so the
deficit, HWD and PDD did not show a clear pattern for the          HWD does not capture the observed drought onset. Precipi-
onset, which may be due to the lack of the rapid intensifica-      tation was also less consistent, explaining why PDD is spotty
tion criteria in both definitions (Otkin et al., 2018).            and may have missed the onset in multiple locations. Po-
   Finally, we examine the 2017 Northern High Plains flash         tential evapotranspiration, interestingly, is fairly consistent
drought. This was a geographically focused drought event           even though temperature was noisy, so SESR captures the
that primarily affected Montana, North Dakota, and South           onset in some areas (though mostly misses Montana), and
Dakota (Jencso et al., 2019). In contrast to the geographically    RZSM gives the clearest signal, which is why SMVI and, to
focused flash drought event of 2011, which was captured in a       some extent, SMPD do well. In essence, the 2017 event is
relatively similar way by most definitions, there is little con-   a flash drought primarily from the perspective of rapid soil
sensus in the representation of the 2017 event (Fig. 6). Both      drying, likely reinforced by high evaporative demand. It is
USDM and SMVI show spotty areas of drought in the north-           not a cleanly defined heat wave flash drought, and the rainfall
ern high plains in MAM that expanded during JJA, which             signal is noisy. This suggests that efforts to understand and
is similar to the observed onset (Gerken et al., 2018; He          forecast an event like 2017 will be concerned with different
et al., 2019; Jencso et al., 2019). This pattern is almost en-     variables and different biophysical intensification processes
tirely absent in HWD (despite the likelihood of being driven       than were active in events like 2011.
by reduction in snowpack due to an early spring heat wave;
Kimball et al., 2019) and is evident only in spots in Mon-         3.5   Trends
tana for PDD and North Dakota for SESR. SMPD identifies
flash drought in this region in MAM and in some areas in           Over the past century there has been an increase in precip-
JJA, but the region does not stand out relative to the rest of     itation over much of the United States (IPCC, 2018). Stud-
the country. Similarly, QuickDRI shows widespread drought          ies over the CONUS (Andreadis and Lettenmaier, 2006) also
conditions that are not focused on the northern high plains.       show positive trends in soil moisture and runoff, which lead
These results show that the 2017 event qualified as a flash        to fewer hydrological drought events. At the same time,
drought for some but not for all methods.                          temperature has increased for much of CONUS in recent
                                                                   decades, and Mo and Lettenmaier (2016) show that there
                                                                   was a dramatic increase in HWD events in the 90s due to
3.4   Climate drivers
                                                                   this rapid warming. An increasing trend in flash drought
                                                                   frequency according to this definition may be attributed to
Building on the event analysis presented in the preceding sec-     anthropogenic climate change as the rising temperature in-
tion, we now examine meteorological fields in the region of        creases evapotranspiration in humid and densely vegetated
maximum drought intensity for the 2011 and 2017 events –           regions, which consequently causes a decrease in soil mois-
i.e., two regionally focused events, one of which presents rel-    ture (Wang et al., 2016; Yuan et al., 2019).
atively similar results across all of the definitions (2011) and      In our analysis of flash droughts trends from 1979 to 2018
one which does not (2017). To simplify the problem, we ex-         (USDM and QuickDRI definitions are not included due to
amine only the main climate variables used in creating the         the short period of data availability), we see an increase in

https://doi.org/10.5194/hess-25-565-2021                                          Hydrol. Earth Syst. Sci., 25, 565–581, 2021
576 M. Osman et al.: Flash drought onset over the contiguous United States Figure 7. Time series of standardized main climate variables formulating the different flash drought definitions averaged within regions of observed flash drought events. (a) 2011 flash drought observed over Southern Plains. (b) 2017 Northern Plains flash drought event. Gray horizontal lines represent ±0.5 standard deviation, which is roughly equivalent to the 30th percentile of each variable’s climatology. areas hit by HWD and PDD over most of the CONUS region flash-drought-impacted areas. PDD shows positive trends in in the past decade (2009–2018) compared to 1979–1988 and almost all regions, and about half of the regions show a sta- almost no difference in SM-based and evaporative-demand- tistically significant trend. HWD is also positive in almost based flash drought definitions (Figs. 8 and 9). Insomuch all regions, with the majority of these trends showing sta- as HWD and PDD indices capture acute drought anomalies tistical significance (Mann–Kendall test at p
M. Osman et al.: Flash drought onset over the contiguous United States                                                               577

Figure 8. Percentage change in areas hit by flash drought in 2009–2018 compared to 1979–1989 for CONUS and all Bukovsky regions.
Dashed black line represents the mean of all definitions per region. Significant trends (according to the Mann–Kendall test) are marked by
asterisks.

https://doi.org/10.5194/hess-25-565-2021                                                Hydrol. Earth Syst. Sci., 25, 565–581, 2021
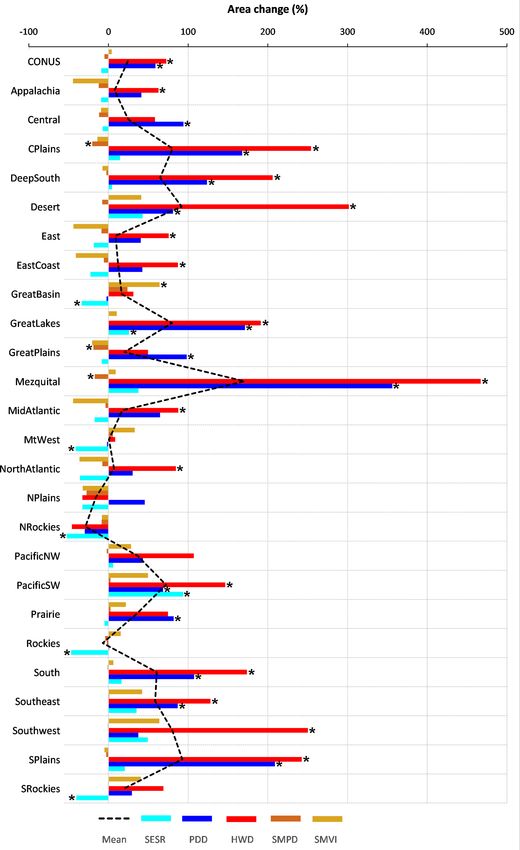
578                                                  M. Osman et al.: Flash drought onset over the contiguous United States

Figure 9. 10-year running average percentage of area hit by flash droughts in CONUS from March to November, as estimated by different
definitions from 1979 to 2018. Linear trends are represented by the straight solid lines.

only prevalent in definitions that include the meteorological        tained increase in potential evapotranspiration, soil moisture
drivers of flash drought in the definition of the event. In this     drawdown, and reduced evaporation. For other events, how-
study, those definitions are limited to PDD and HWD, which           ever, the definitions differed substantially in their assessment
are definitions that target acute drought anomalies rather than      of the extent and timing of the drought or even in whether a
rapidly intensifying flash droughts. The trends are not evi-         notable flash drought had occurred at all. This was the case
dent when a definition depends only on a drought outcome             for the Northern High Plains in 2017, for example, where
of interest, such as soil moisture or evaporative stress. We         variable temperatures and a noisy rainfall record interfered
do note that there are very few cases of direct disagreement         with some definitions, even as a rapid and highly damaging
in sign between statistically significant trends across defini-      drought struck the region. These results strongly indicate that
tions. This only occurs in the Central Plains, where SMPD            “flash drought” represents a composite class of events, with
differs in sign from HWD and PDD, and in the arid Great              several possible pathways all leading to rapidly intensifying
Basin region, where SMVI shows a significant positive trend,         drought conditions. When assessing risk patterns, develop-
while SESR is significantly negative.                                ing forecast systems, or quantifying and projecting climate
                                                                     change impacts, it is critically important to be clear in the
                                                                     choice of definition and the rationale in making that choice.
4   Conclusions                                                         The SMVI definition shows an ability to capture the on-
                                                                     set of major reported flash drought events regardless of the
The present diversity in definitions of flash drought can be         vegetation or humidity conditions of the region similar to the
thought of as a feature, rather than a bug, of research in this      observed impacts on vegetation as seen in Figs. S3 and S4.
field. This diversity supports investigations of rapidly inten-      Ongoing research will enhance the definitions’ capabilities
sifying drought hazards from perspectives of meteorologi-            to report flash droughts’ severity and intensity.
cal forcing, drought impacts, and various drought dynamics
and feedbacks. However, trends and hot spots should be cau-
tiously defined to avoid the confusion that may arise due to         Code and data availability. Data and any code that can be shared
the diversity of definitions and their ability to capture differ-    publicly are available at https://doi.org/10.5281/zenodo.4501775
ent aspects of flash drought. “Are flash droughts increasing         (Osman et al., 2021). The full code cannot be shared in the mean-
in the United States?” To answer this question, one needs to         time. It is still being used for ongoing research and unpublished
be clear on the manner in which the events are being defined         studies.
and calculated.
   In applying definitions to the historic record, we see that
the spatial coverage of some canonical flash drought events is       Supplement. The supplement related to this article is available on-
                                                                     line at: https://doi.org/10.5194/hess-25-565-2021-supplement.
well captured by most or all of the evaluated definitions. This
includes the Southern Plains event of 2011, where consistent
high temperature and rainfall deficit led to a rapid and sus-

Hydrol. Earth Syst. Sci., 25, 565–581, 2021                                             https://doi.org/10.5194/hess-25-565-2021
M. Osman et al.: Flash drought onset over the contiguous United States 579
Author contributions. MO and BFZ took the lead in writing the Chen, L. G., Gottschalck, J., Hartman, A., Miskus, D., Tin-
manuscript. BFZ and HSB supervised the formulation of the in- ker, R., and Artusa, A.: Flash Drought Characteristics Based
troduced definitions. JIC and TT provided research data and critical on U.S. Drought Monitor, Atmosphere (Basel), 10, 498,
feedback and edits. JAO and MCA aided in interpreting the results https://doi.org/10.3390/atmos10090498, 2019.
and helped shape the research and analysis. All authors discussed Christian, J. I., Basara, J. B., Otkin, J. A., Hunt, E. D., Wake-
the results and contributed to the final paper. field, R. A., Flanagan, P. X., and Xiao, X.: A Methodology for
Flash Drought Identification: Application of Flash Drought Fre-
quency Across the United States, J. Hydrometeorol., 20, 833–
Competing interests. The authors declare that they have no conflict 846, https://doi.org/10.1175/JHM-D-18-0198.1, 2019a.
of interest. Christian, J. I., Basara, J. B., Otkin, J. A., and Hunt, E. D.: Regional
characteristics of flash droughts across the United States, En-
viron. Res. Commun., 1, 125004, https://doi.org/10.1088/2515-
Acknowledgements. We also would like to thank the research 7620/ab50ca, 2019b.
project team, Trevor Keenan from UC Berkeley, Christopher Hain, Christian, J. I., Jeffrey, B. B., Hunt, E. D., Otkin, J. A., and Xiao,
and Thomas Holmes from NASA and David Lorenz from the Uni- X.: Flash drought development and cascading impacts associ-
versity of Wisconsin–Madison, for their helpful comments and dis- ated with the 2010 Russian Heatwave, Environ. Res. Lett., 15,
cussion. We sincerely thank the journal editor and the anonymous 094078, https://doi.org/10.1088/1748-9326/ab9faf, 2020.
reviewers for their constructive comments. Ejeta, M.: The 2011 Texas Drought in Hindsight, pp. 2464–2471,
World Environmental And Water Resources Congress, Albu-
querque, New Mexico, United States, 2012.
Ford, T. W. and Labosier, C. F.: Meteorological conditions
Financial support. This research has been supported by the Na-
associated with the onset of flash drought in the East-
tional Science Foundation (grant no. 1854902).
ern United States, Agric. For. Meteorol., 247, 414–423,
https://doi.org/10.1016/J.AGRFORMET.2017.08.031, 2017.
Fuchs, B., Wood, D., and Ebbeka, D.: From Too Much to Too
Review statement. This paper was edited by Xing Yuan and re- Little: How the central U.S. drought of 2012 evolved out of
viewed by two anonymous referees. one of the most devastating floods on record in 2011, Drought
Mitigation Center Faculty Publication 118, 99 pp., available at:
https://digitalcommons.unl.edu/droughtfacpub/118/ (last access:
2 February 2021), 2015.
Gerken, T., Bromley, G. T., Ruddell, B. L., Williams, S., and Stoy, P.
References C.: Convective suppression before and during the United States
Northern Great Plains flash drought of 2017, Hydrol. Earth Syst.
Anderson, M. C., Hain, C., Otkin, J., Zhan, X., Mo, K., Sci., 22, 4155–4163, https://doi.org/10.5194/hess-22-4155-2018,
Svoboda, M., Wardlow, B., and Pimstein, A.: An Inter- 2018.
comparison of Drought Indicators Based on Thermal Re- He, M., Kimball, J. S., Yi, Y., Running, S., Guan, K., Jensco, K.,
mote Sensing and NLDAS-2 Simulations with U.S. Drought Maxwell, B., and Maneta, M.: Impacts of the 2017 flash drought
Monitor Classifications, J. Hydrometeorol., 14, 1035–1056, in the US Northern plains informed by satellite-based evapotran-
https://doi.org/10.1175/jhm-d-12-0140.1, 2013. spiration and solar-induced fluorescence, Environ. Res. Lett., 14,
Andreadis, K. M. and Lettenmaier, D. P.: Trends in 20th century 074019, https://doi.org/10.1088/1748-9326/ab22c3, 2019.
drought over the continental United States, Geophys. Res. Lett., Heim Jr., R. R.: A Review of Twentieth-Century Drought Indices
33, L10403, https://doi.org/10.1029/2006GL025711, 2006. Used in the United States, B. Am. Meteorol. Soc., 83, 1149–
Basara, J. B., Christian, J. I., Wakefield, R. A., Otkin, J. A., 1166, https://doi.org/10.1175/1520-0477-83.8.1149, 2002.
Hunt, E. H., and Brown, D. P.: The evolution, propagation, and Hoerling, M., Schubert, S., and Mo, K. C.: An Interpre-
spread of flash drought in the Central United States during 2012, tation of the Origins of the 2012 Central Great Plains
Environ. Res. Lett., 14, 084025, https://doi.org/10.1088/1748- Drought Assessment Report, NOAA Drought Task Force Nar-
9326/ab2cc0, 2019. rative Team, available at: https://psl.noaa.gov/csi/factsheets/pdf/
Basara, J. B., Christian, J., Wakefield, R., Otkin, J. A., Hunt, noaa-gp-drought-assessment-report.pdf, (last access: 2 February
E. D., and Grace, T. M.: A Look Back at a Historic Flash 2021), 2013.
Drought Event – The Central United States Drought of 1988, Hoerling, M., Eischeid, J., Kumar, A., Leung, R., Mariotti, A., Mo,
in: 34th Conference on Hydrology, AMS, Boston, MA, avail- K., Schubert, S., and Seager, R.: Causes and Predictability of the
able at: https://ams.confex.com/ams/2020Annual/webprogram/ 2012 Great Plains Drought, B. Am. Meteorol. Soc., 95, 269–282,
Paper367992.html (last access: 11 July 2020), 2020. https://doi.org/10.1175/bams-d-13-00055.1, 2014.
Bukovsky, M. S.: Masks for the Bukovsky regionalization Hunt, E. D., Hubbard, K. G., Wilhite, D. A., Arkebauer, T.
of North America, available at: http://www.narccap.ucar.edu/ J., and Dutcher, A. L.: The development and evaluation
contrib/bukovsky/ (last access: 2 February 2021), 2011. of a soil moisture index, Int. J. Climatol., 29, 747–759,
Changnon, S. A., Kunkel, K. E., and Reinke, B. C.: Impacts and https://doi.org/10.1002/joc.1749, 2009.
Responses to the 1995 Heat Wave: A Call to Action, B. Am. IPCC: Summary for Policymakers, in: Global Warming of 1.5 ◦ C.
Meteorol. Soc., 77, 1497–1506, https://doi.org/10.1175/1520- An IPCC Special Report on the impacts of global warming of
0477(1996)0772.0.CO;2, 1996.
https://doi.org/10.5194/hess-25-565-2021 Hydrol. Earth Syst. Sci., 25, 565–581, 2021You can also read