Accurate dating of stalagmites from low seasonal contrast tropical Pacific climate using Sr 2D maps, fabrics and annual hydrological cycles - Nature
←
→
Page content transcription
If your browser does not render page correctly, please read the page content below
www.nature.com/scientificreports
OPEN Accurate dating of stalagmites
from low seasonal contrast tropical
Pacific climate using Sr 2D maps,
fabrics and annual hydrological
cycles
Mohammadali Faraji1*, Andrea Borsato1, Silvia Frisia1, John C. Hellstrom2, Andrew Lorrey3,
Adam Hartland4, Alan Greig2 & David P. Mattey5
Tropical Pacific stalagmites are commonly affected by dating uncertainties because of their low
U concentration and/or elevated initial 230Th content. This poses problems in establishing reliable
trends and periodicities for droughts and pluvial episodes in a region vulnerable to climate change.
Here we constrain the chronology of a Cook Islands stalagmite using synchrotron µXRF two-
dimensional mapping of Sr concentrations coupled with growth laminae optical imaging constrained
by in situ monitoring. Unidimensional LA-ICP-MS-generated Mg, Sr, Ba and Na variability series
were anchored to the 2D Sr and optical maps. The annual hydrological significance of Mg, Sr, Ba and
Na was tested by principal component analysis, which revealed that Mg and Na are related to dry-
season, wind-transported marine aerosols, similar to the host-rock derived Sr and Ba signatures.
Trace element annual banding was then used to generate a calendar-year master chronology with a
dating uncertainty maximum of ± 15 years over 336 years. Our approach demonstrates that accurate
chronologies and coupled hydroclimate proxies can be obtained from speleothems formed in tropical
settings where low seasonality and problematic U–Th dating would discourage the use of high-
resolution climate proxies datasets.
The South Pacific islands are highly vulnerable to the effects of both climate variability driven by El Niño–South-
ern Oscillation (ENSO)1 activity and climate change. However, understanding links between rainfall trends, rain
intensity, episodic drought, and deluge against a backdrop of contemporary warming remains incomplete due
to limited long, quantitative r ecords2. Reducing uncertainties about the magnitude, frequency and duration of
past droughts and pluvials is sufficient justification for obtaining well-dated palaeoproxy information from South
Pacific speleothems. Speleothems (e.g. stalagmites, stalactites and flowstones) can provide long climate records
outside the polar regions because they can be precisely dated and are relatively unaffected by post-depositional
(diagenetic) modifications3,4. They also contain physical and chemical multi-proxy data that may reflect surface
processes and impacts of climate variability and change. To date, speleothem material from South Pacific islands
is notorious for having problems with reliable radiometric dating. This is a critical geochronology issue to sur-
mount because accurately dated South Pacific speleothems could let us establish statistical relationships between
drivers of regional rainfall variability, like ENSO, and local impacts on the environment5,6 and at the same time
better define a phenomenon that affects billions of people worldwide.
Accurate U–Th dating using ion-counting multi-collector inductively coupled plasma-mass spectrometry
(ICP-MS) is by far the most common method to establish the age of speleothem layers (cf. H ellstrom7 and
references therein). Tropical island stalagmites, however, can be affected by large dating uncertainties related
to their elevated and variable initial [230Th/232Th] ratio, a commonly reported but as yet poorly understood
1
School of Environmental and Life Sciences, The University of Newcastle, Newcastle, NSW 2308, Australia. 2School
of Earth Sciences, The University of Melbourne, Melbourne, VIC 3010, Australia. 3National Institute of Water and
Atmospheric Research Ltd., Auckland 1149, New Zealand. 4Environmental Research Institute, School of Science,
Faculty of Science and Engineering, University of Waikato, Hamilton 3240, New Zealand. 5Department of Earth
Sciences, Royal Holloway University of London, Egham TW20 0EX, Surrey, UK. *email: mohammadali.faraji@
uon.edu.au
Scientific Reports | (2021) 11:2178 | https://doi.org/10.1038/s41598-021-81941-x 1
Vol.:(0123456789)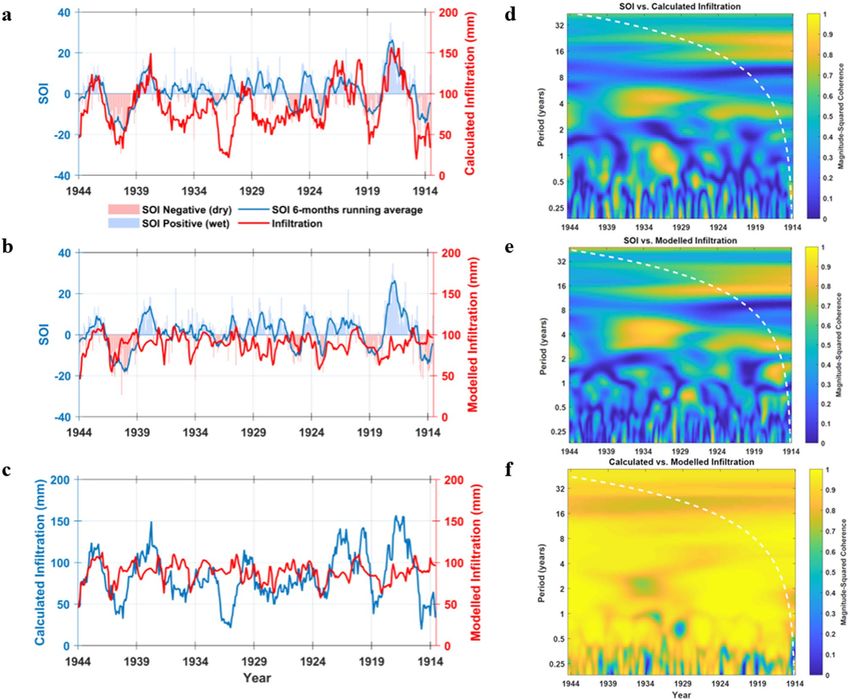
www.nature.com/scientificreports/
issue8–10. Accurate U–Th dating requires either insignificant or known Th 230 activity at the time of speleothem
crystal layers f ormation7, but incorporation of 230Th during deposition is common. An initial 230Th contamina-
tion is accompanied by a much larger amount of 232Th, and an assumed 230Th/232Th ratio is used in these cases
to estimate initial 230Th activity.
The limitations of speleothem U–Th dating in this case can be overcome via acquiring precise relative age
models by using high-frequency variations in visible growth laminae p roperties11,12, or in the cyclicity of their
13–20
geochemical properties, such as trace element concentration , or C and O isotope ratios21,22. The main assump-
tions when using physical laminae to optimize U–Th dating is that they are annual and that there are no growth
interruptions. Similarly, refinement of U–Th dating using trace elements requires seasonal cyclicity, continuous
speleothem growth and lateral homogeneity of trace element concentration. Chronologies based on stable C and
O isotope ratios are limited by instrumental resolution and sample size.
Dating stalagmites using trace element cycles has recently been exploited by Nagra et al.13 to build chronology
for annually laminated stalagmites with large U–Th ages uncertainties. Their study implied that trace element
cycles work best to test the accuracy of annual lamina counting when seasonality in temperature and/or rainfall
is transmitted to the stalagmite through variations in drip water chemistry. Seasonal chemical cycles have also
confirmed the annual nature of stalagmite fluorescent laminae from monsoon Asia and indicate trace elements
are a mechanism to improve dating in speleothems lacking visual or fluorescent lamination20. These studies
used unidimensional laser ablation ICP-MS (LA-ICP-MS) tracts along the stalagmite vertical growth direction
and assumed that the horizontal (annual) growth layers capture changes in parent-water chemistry in a laterally
continuous and homogeneous manner. Only in this case, peaks and troughs identifying high-frequency trace
element cycles along speleothem vertical growth axis transects (the time dimension) should show the same
pattern and number. Commonly, this is the exception, because crystal growth processes and the presence of
extra-lattice particulates yields trace element distribution inhomogeneities along the same seasonal/annual layer.
Chronologies built upon annual trace element cycles that can be precisely compared with the physical aspects of
layering in speleothems are the most reliable, because peaks and troughs along sampling transects at high spatial
resolution can be visually superimposed to f abrics16,17,23,24. However, annual laminae-specific heterogeneities
due to crystal fabrics and presence of nano-particulate can only be detected by two-dimensional, continuous,
high resolution trace element m apping25, which can be performed by using Synchrotron radiation-based micro
X-Ray fluorescence over entire speleothem s labs26,27.
Speleothems from regions with high seasonal contrast typically show annual cyclicity in trace element con-
centration of bedrock-derived solutes (such as Mg, Sr, Ba, U)13,14,18,28, soil-derived particles (such as P, Al, Fe,
U) and of those elements whose partitioning depends on growth rate (P, Al, Sr). The assumption in using
bedrock-derived trace element cycles for dating stalagmites is that they follow cave ventilation and/or prior
calcite precipitation (PCP: calcite precipitation from a solution before it reaches the stalagmite)29 and/or changes
in rock-water interaction (RWI) processes, which are all related to temperature and/ or rainfall contrast. In
Mediterranean and monsoon climates, it stands to reason that during the dry season the Mg/Ca and Sr/Ca
ratios in the parent water and, thus, in the speleothem carbonate are expected to i ncrease30. Yet, there are other
processes contributing to high-frequency variability in Mg and Sr concentration within speleothems, such as
enhanced wind-blown delivery of marine aerosols to cave sites proximal to the c oast31,32. Another source of Sr
could be dust-blown particulates, although this provenance for Sr seems to be linked to large-scale, secular-to-
millennial climate c hanges33–35. Thus, even Mg and Sr could be potentially incorporated into speleothem layers
as particulate and produce anomalous (outliers) peaks in their concentration. An increase in concentration of
P could be related to the development of microbial films on top of stalagmites during dry periods, as well as
soil provenance in wet periods, particularly in tropical island settings36. Thus, P may not be taken as a universal
“wet” conditions marker, as this assumption is valid for stalagmites grown under conditions associated with
soil and vegetation decay in monsoon-dominated or Mediterranean climate settings. For the tropical South
Pacific, where maritime climate conditions prevail, the interpretation of P as climate proxy is still controversial.
A nano-scale investigation of carbonate crystal growth in cave highlighted the possibility that this occurs by
particle attachment, where particles are amorphous phases whose incorporation of Sr, Mg, Al, Fe and P is still
poorly known26. It is, therefore, desirable to build a tropical South Pacific speleothem chronology by considering
seasonal variations in elements, such as Yttrium, which are known to be particulate-bound, soil-derived and
transported colloidally during high infiltration events17. Seasonal variation in Y are, likely, a most robust record
of seasonal infiltration in tropical settings.
There is a need to overcome U–Th age uncertainties with a methodology that can be applied to all tropical,
low seasonality contrast s talagmites8. Here, we propose to apply a two-dimensional (2D) approach to obtain
an optimized chronology for a tropical, low-seasonal contrast South Pacific stalagmite with high U–Th dating
uncertainties based on coupled visible and trace element concentration layers. This was achieved by coupling
high-resolution imaging of fine-scale fabric variability and their associated 2D synchrotron-radiation based
micro X-ray fluorescence (SR-µXRF) mapping of trace element concentrations. The high sensitivity and spatial
resolution of SR-µXRF make it a superior technique over conventional µXRF (e.g. benchtop µXRF37), particularly
when annual to sub-annual laminae thicknesses are less than 100 µm. We also generated one-dimensional (1D)
transects for Mg, Sr, Na, U, Ba, P and Y cycles by using the most common technique applied in palaeoclimate
research, laser ablation inductively coupled plasma-mass spectrometry (LA-ICP-MS), to highlight the differences
between a 1D and a 2D mapping approach.
Following the protocol outlined in Nagra et al.13 we employed principal component analysis (PCA) to con-
struct a robust chronology, and then we developed an aridity index to constrain inter-annual variability. The
variability of the aridity index was then synchronized with the annual record of local hydroclimate variability
and the Southern Oscillation Index (the difference between the sea level pressure at Tahiti and Darwin, which
is an atmospheric see-saw that straddles our site). This combined approach resulted in an age model with only
Scientific Reports | (2021) 11:2178 | https://doi.org/10.1038/s41598-021-81941-x 2
Vol:.(1234567890)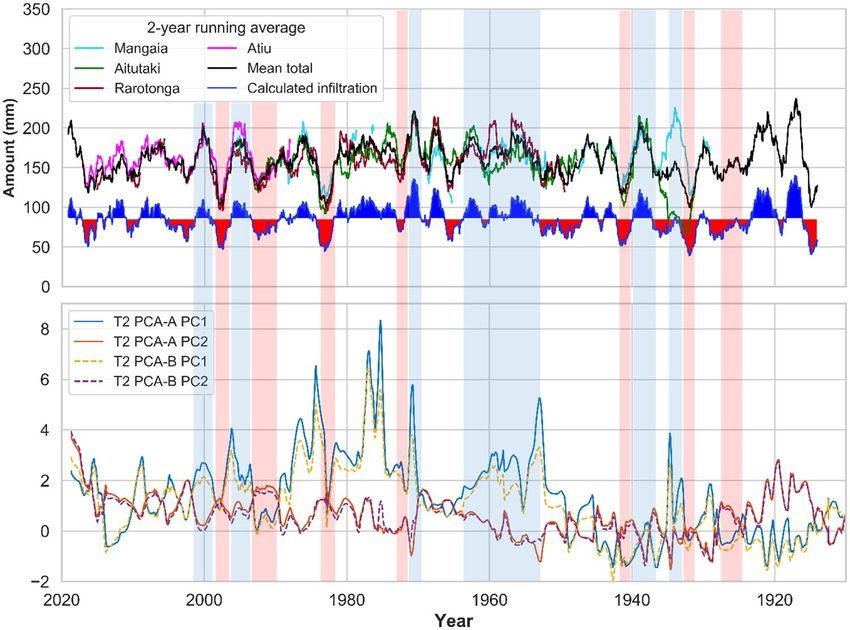
www.nature.com/scientificreports/
4% uncertainty, considerably advancing the ca. 50% uncertainty in the U–Th age model. Our findings imply that
reliable annual hydrological variability can be obtained from “problematic” tropical samples where U-Th dating
is difficult even when seasonal contrast is not strong.
Building chronology for stalagmite Pu17
Below we explicate the methodological procedure to construct an accurate chronology for stalagmites from low
seasonal contrast tropical Pacific climate using Sr 2D maps, fabrics and annual hydrological cycles.
Site description and stalagmite sample. Pouatea cave (20° 01′ 12″ S, 158° 07′ 10″ W), is located in
Atiu, the third largest island of the southern Cook Islands (SCI) archipelago (Supplementary information, Fig
S-1). Atiu is geologically characterized by a core of weathered and eroded basaltic rocks rimmed by an uplifted
Pliocene–Pleistocene reef limestone (known as “matakea”)38 (Supplementary information, Fig S-1). The makatea
hosts a maze of almost horizontal solution cave passages, with lower levels that reach the water table and dis-
charge freshwater into the ocean39. Atiu is characterized by a relatively small annual temperature range from
22 °C in winter up to 26 °C in summer. Rainfall is influenced by seasonal shifts of the South Pacific Conver-
gence Zone (SPCZ)40–42, tropical cyclones (TC)43 and, on decadal timescales, by the effects of ENSO44. Southwest
deflection of the SPCZ over Atiu results in unstable weather from beginning of November to end of April (aka
‘the wet season’) when ~ 60% of the total annual rainfall (TAR = 1930 ± 365 mm/year) occurs and when the mean
monthly rainfall varies from ~ 150 to 200 mm. The “dry” season, when mean monthly rainfall is ~ 50 to 100 mm,
occurs from May to October when the SPCZ moves northward and is less organised at the same time when pre-
vailing flow is dominated by south easterly trade w inds38,45,46. Local records of monthly precipitation available
for the SCI stations at Mangaia (Jan 1914–May 1996), Aitutaki (Jan 1930–Jun 1996), Rarotonga (Jun 1948–Feb
2016) and Atiu (Oct 1980–Mar 2019) show consistency in the precipitation data where records overlap, suggest-
ing that Atiu is representative of the mean climate conditions and variability experienced across the southern
Cook archipelago (Supplementary information Fig S-2).
Pouatea is a network cave system that has several intersecting and side galleries with a total surveyed length
of ~ 1200 m. The main entrance of the cave opens 23 m above sea level at 525 m from the shoreline and is a verti-
cal shaft with a drop of about 4 m. In addition, there are five other entrances (skylights) with diameters ranging
from 3 to 10 m formed as a result of cave roof collapse. The rock burden above the galleries is 4 to 8 m, due to
incomplete diagenesis of a relatively young reef, characterized by high porosity. This ensures rapid transmission
of surface climate conditions into the cave, which is further enhanced by a limited and patchy soil cover. Except
for some small pockets of red clay soil filling the bottom of joint-controlled karst of colluvial origin38, the surface
above the cave is a bare karst. Trees push their roots through holes and fractures in the makatea all the way to
the cavern system to source moisture. Most of the visible organic matter in the makatea consists of leaves, nuts
and bark, all of which are rapidly degraded under the warm and wet climate conditions of the island. Because
of the sparse soil cover and barren karst, the infiltration area is bound to be subject to evaporation during the
relatively dry and warm summer months (Dec, Jan, and Feb).
Stalagmite Pu17 was actively growing when removed in March 2019 at a depth of ca. 7 m beneath the surface
within a gallery leading to the southern dead-end of the cave. The feeding straw was still dripping at the time
of retrieval and a thin calcite layer formed on the stump of the removed Pu17 stalagmite between March and
October 2019, corroborating the idea that the top of Pu17 has a date of 2019 CE. Pu17 was fed by a relatively
slow and constant drip (1 drop each 15 min), which resulted in its candle-shaped morphology47. Pu17 is 53 mm
long and grew over a stalagmite stump, likely broken by humans before European colonization, according to
Atiuan lore, which highlights the importance of speleothems as ceremonial building material48. The stalagmite
then provides an opportunity to unravel a history of Polynesian land-use as well as climate variability.
Cave monitoring data are available from 2017 to 2019, although the remoteness of the site allowed four
visits, only one of which in the wetter season. Mean air temperature in the passage where Pu 17 was collected is
23.6 ± 0.5 °C with minimum values in September–October and maxima in March–April. Cave air p CO2 varied
from 500 and 650 ppm in the relatively dry and wet seasons respectively, while relative humidity was at near
saturation (98–100%) throughout the year. Continuous drip rate monitoring at two drip points compared with
daily precipitation data suggests that there is fast transmission of the rainfall signal into the cave, with time lag of
less than two days between intense rainfall events and maximum values in drip rates (Supplementary information,
Fig S-3). Drip rate monitoring is also indicative of a relatively dry period between May to October characterised
with a gradual decrease in the rate of dripping. The pH of the dripwaters in the cave is ~ 8 and the Saturation
Index for calcite (SIcc) varies from 0.9 to 1. Calcite that was formed in situ on watch glass under relatively fast
drip rates (~ 1 drop/11 s), shows organic and inorganic colloids (mostly oxihydrates of Fe, Al, and Si) adhering
to the crystal surfaces and/or settling between rhombohedra (Supplementary information, Fig S-4). This results
in a more porous fabric compared to compact fabrics developed under slow dripping feeding systems. Under
relatively slow drips (1 drop/50 s) the crystals start to coalesce and crystal boundaries interlock, leading to a
translucent and compact fabric (Supplementary information, Fig S-4). In-situ precipitation experiments suggest
that low drip rates (equivalent to a prolonged residence time of the thin film of fluid atop a stalagmite) result in an
increase of Mg in the precipitates accompanied by the formation of NaCl crystals, which suggests contamination
by marine aerosol (Supplementary information, Fig S-5).
The U content in Pu17 varies between 80 and 130 ppb, which is higher than other active and modern stalag-
mites from Pouatea cave. A most likely initial 230Th/232Th activity ratio of 6.12 ± 0.84 was determined after the
exclusion of two outliers using the stratigraphic constraint procedure49 and an age-depth model was determined
from the remaining eight analyses using the finite positive growth rate model50 and the assumption of active
growth at time of collection. The radiometric U–Th ages have large 2-s uncertainties (Supplementary information,
Scientific Reports | (2021) 11:2178 | https://doi.org/10.1038/s41598-021-81941-x 3
Vol.:(0123456789)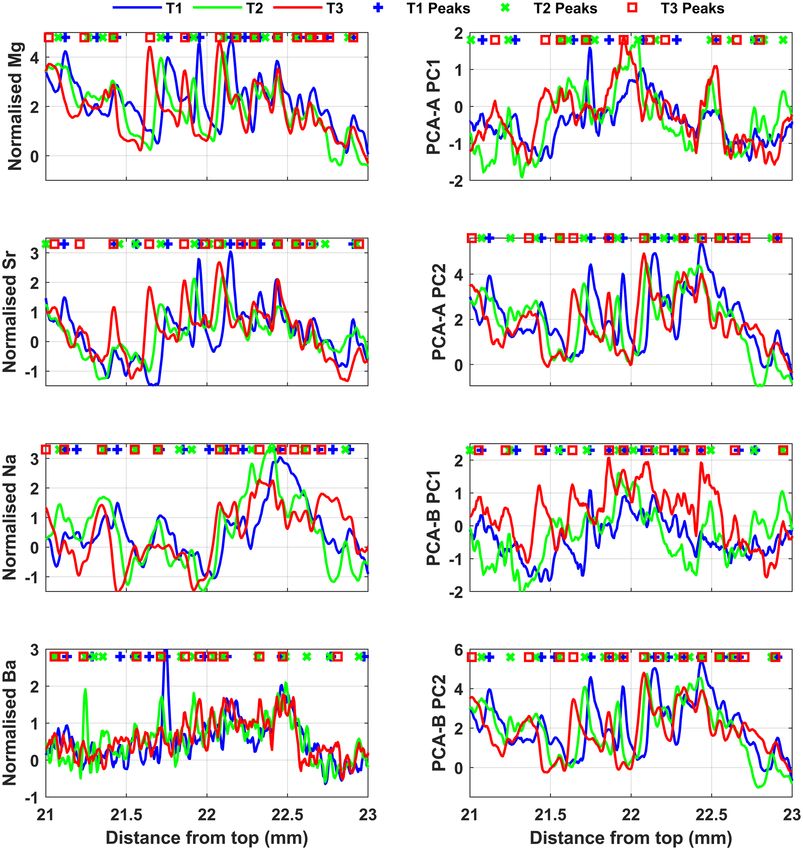
www.nature.com/scientificreports/

                                            Figure 1.  Locations of laminae on (a) the Sr synchrotron µXRF map, and (b) the high resolution scan of
                                            stalagmite, as identified by automated and non-automated counting in the topmost section of the stalagmite.

                                            Table S-1). Given that pre-instrumental annual rainfall data for Atiu would be fundamental to test the reliabil-
                                            ity of predictive climate models, building an annually resolved chronology with physical and chemical cycles
                                            modulated by a muted seasonal contrast becomes a necessity.

                                            Two‑dimensional‑based lamina counting. An annually-resolved chronology can be constructed from
                                            fabrics and chemical laminae seen in two dimensions. The physical laminae were here highlighted by using a
                                            high-resolution scanner to identify variations in compact and porous fabrics, which are related to infiltration
                                            due to the inhibiting effects of particulate on crystal growth processes during higher infiltration (see previous
                                            section). 2D trace element (geochemical) laminae were visualized by 5 μm resolution SR-μXRF maps and high-
                                            light spatial (time-equivalent) homogeneity and/or heterogeneity of trace element distributions within physi-
                                            cally visible growth laminae. Trace element peak shifts recorded by 1D parallel LA-ICP-MS were superimposed
                                            to fabric maps and shifts in TE concentration could be explained by lateral heterogeneities. These were high-
                                            lighted by the SR-μXRF 2D maps, which were thus taken as reference to anchor the chemical cycles detected
                                            by LA-ICP-MS scans and then obtain a direct comparison with physical laminae (see Fig. 1). Of all the trace
                                            elements detected by SR-μXRF (Fe, Br, and Sr), only Sr shows cycles of concentration variability that can be
                                            followed along physical growth laminae, with cycles spaced at ∼ 50 to 150 μm intervals. The increase in Sr con-
                                            centration is not unequivocally correlated to a compact or porous fabric (Fig. 1), yet the 2D map highlights that
                                            there exist sharp boundaries for Sr-concentration laminae. The position of the onset of Sr laminae (cycles) in the
                                            SR-μXRF maps was then visually determined in a non-automated approach at three levels of certainty through
                                            the ImageJ software package. The advantage of SR-μXRF 2D mapping is that it allows for both an evaluation of
                                            the lateral chemical prominence and persistence of trace elements within each lamina and the identification of
                                            outliers due to particulate inclusions.
                                                In our 2D approach, prominent and persistent Sr laminae have been given, for convenience, the code 0,
                                            which applies to Sr laminae characterized by > 95% confidence about their probability of occurrence. Code 1 was
                                            applied to persistent laminae with low prominence and more than 50% probability of occurrence. These laminae
                                            are laterally persistent but of low or very weak prominence. Examples of this group are sub-annual laminae that
                                            show feeble prominence but can be followed laterally. Code 2 is used for locally prominent laminae showing
                                            feeble lateral persistence (less than 50% probability of occurrence). This group includes laminae that cannot be
                                            followed laterally in the 2D Sr map. By accounting for the probability rating of geochemical laminae, group 0, 1
                                            and 2 were integrated in the age model with ± error of 0, 27 and 72% respectively. The error was calculated from
                                            the probability of occurrence,
                                                                             such that, as an example, code 1 with 50–95% probability would have an error
                                                           50+95
                                                    100−
                                            equal to            .
                                                             2
                                                         100
                                               The visual method may carry an inherent error due to the operator’s discretion. Thus, trace element con-
                                            centration laminae in the SR-μXRF Sr map were independently and automatically identified by using the Open
                                            Computer Vision Library in the Python programming language. A 170 pixels wide (0.85 mm) scan was extracted

          Scientific Reports |   (2021) 11:2178 |                  https://doi.org/10.1038/s41598-021-81941-x                                               4

Vol:.(1234567890)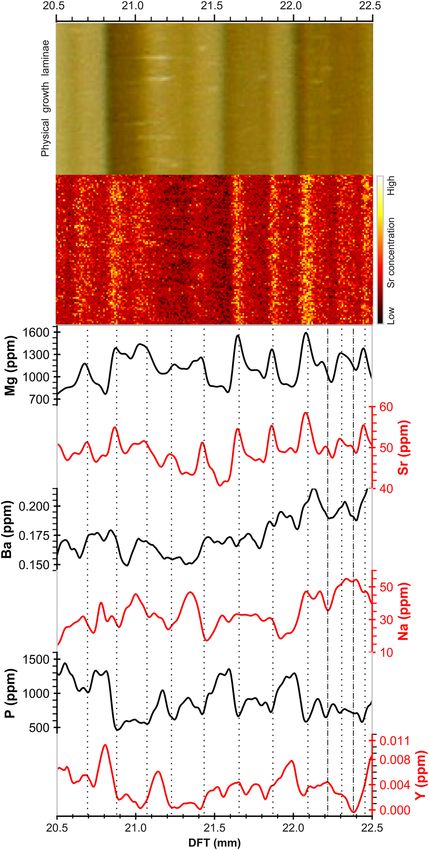
www.nature.com/scientificreports/
along the Pu17 growth axis using an Adaptive Gaussian Thresholding. This approach minimised lateral hetero-
geneity along each growth lamina and is similar to the visual evaluation by encompassing the entire width of
the map, provided that laminae are perpendicular to the vertical growth extension. Thresholding is the simplest
segmentation method that separates regions of an image corresponding to chemical laminae that are the target
of the analysis. Here, the separation was based on the variation of intensity between the pixels associated with
Sr-rich laminae and the background pixels. In order to increase the accuracy of the link between automated
and non-automated results of laminae positions with the geochemical cycles obtained in the LA-ICP-MS tran-
sects, a line scan was extracted from the SR-μXRF Sr map adjacent to a LA-ICP-MS transect (see Fig. 1). The
extracted SR-μXRF Sr line scan, was smoothed using a Savitzsky-Golay filter (order of 9 and window length of
31) and peaks corresponding to Sr-enriched layers on the SR-μXRF Sr map were then counted using the Python
find_peaks command. The find-peaks function takes the line scan as the input signal vector, and pixel index as the
location vector and returns the value, location, and prominence for each peak. Minor and/or double laminae due
to inter-annual events can thus be eliminated by applying minimum distance and minimum peak prominence
constraints. These are two optional adjustments that enable the user to control peak counting. For example, by
applying a minimum peak distance of 10 pixels (50 µm), find_peaks identifies and isolates the highest peak in
the signal and eliminates all peaks within 0.05 mm around it. The function then repeats the procedure for the
highest remaining peak and iterates until it reaches the last peak of the signal. A minimum peak prominence
of 10 ppm, for example, means that a peak is counted only if it drops 10 ppm on either side of its maximum.
The number of significant layers was determined by applying a peak distance of 50 µm (~ half of the distance
determined visually) and matching peak prominence with visual laminae.
Manual (non-automated) and automated lamina counting was also carried out on a 10 μm resolution image
of physical growth between LA-ICP-MS transects 2 and 3 (T2 and T3 in Fig. 1), and adjacent to the area imaged
by SR-μXRF (see Fig. 1). The visible physical laminae in Pu17 results from alternation (couplets) due to changes
in micro-porosity or particulate concentration of the calcite layers, which yields different optical properties typi-
cal of textural laminae as defined by (Genty and Q uinif51). Translucent, optically dark layers are compact, whilst
the opaque, optically whitish layers are porous and characterized by the presence of intercrystalline particulate,
which is more efficient in inhibiting calcite crystal growth when drip rate increases (cf.13,20,51,52). The position
and number of translucent bands (lower drip rates) were determined at three levels of certainty (similar to Sr
2D map) by using ImageJ software. Although the optical scan of Pu17 fabrics has a lower resolution (10 µm)
compared to the SR-µXRF map (5 µm), it captures growth surfaces in two dimensions and thus enables to assess
the prominence and persistency of growth bands in a broader area. The translucent layers were also counted
automatically with find_peaks by using the same peak distance applied for the SR-µXRF generated Sr concen-
tration 2D map. The automated counting of translucent bands was conducted on a line scan extracted from the
Pu17 fabrics grey-scale image. Translucent fabrics (darker bands) are characterised by higher grey values. Peak
prominence was then optimized to match the number of peaks (translucent bands) with the laminations identi-
fied with the visual counting.
Counting cycles on one‑dimensional LA‑ICP‑MS transects. For counting number of cycles on LA-
ICP-MS transects, we selected three transects in the central growth section of Pu17 (T1, T2 and T3 in Fig. 1).
Mg, Sr, Ba, Na, U, P and Y show clear cyclic signal. In order to determine the annual nature of geochemical cycles
and build an annually-resolved chronology for South Pacific speleothems, the following procedure was followed:
1. a Savitzky-Golay filter of the order of 9 and window length of 31 was applied to remove high frequency noise.
2. individual elements concentration was standardised by subtracting the mean and dividing by standard
deviation.
3. in order to improve the consistency between three transects, individual elements on each transect were
resampled at 6 μm resolution.
4. implementation of principal component analysis (PCA) on smoothed, scaled and resampled elements in
each transect in order to find the maximum correlation between different elements and provide two principal
components that account for most of the variance. PCA-A includes the six hydrologically sensitive elements
Mg, Sr, Ba, Na, P and Y, while PCA-B was restricted to four elements (Mg, Sr, Ba, Na) sensitive to bedrock-
related processes (PCP/RWI). U was excluded from PCA-A because it has a very noisy signal.
5. finding the maximum number of prominent peaks by applying find_peaks on the individual elements and
the principal components.
The master chronology was built by integrating all lamina and trace element cycle counting methods and
assigning calendar ages to the layer counts by working from the date of collection backwards. For around 80%
of the record in each lamina couplet the compact, translucent layer marking a relatively low drip-rate coincides
with higher Sr and Mg concentrations than the more porous layers13,16. By assuming that the optically dark,
compact and the optically whitish, more porous layers identify changes in drip rate, supersaturation and effi-
ciency of growth inhibitors as modulated by changes in rainfall, we tested the robustness of our assumption that
laminae are annual against instrumental rainfall record and SOI. The internal speleothem chronology was then
optimised by achieving the best match between Pu17 infiltration proxies and the SOI. This implied that we had
to transform rainfall data into effective infiltration, which modulates the drip rate. Potential evapotranspiration
(PET) was first calculated for Mangaia, Aitutaki, Rarotonga, and Atiu by using the Thornthwaite e quation53, and
then the effective infiltration amount was obtained by subtracting PET from the rainfall amount. The infiltration
values of Mangaia, Aitutaki, and Rarotonga were averaged for the portion of the record where they overlap and
tied with Atiu’s record to obtain a continuous infiltration series from January 1914 to March 2019.
Scientific Reports | (2021) 11:2178 | https://doi.org/10.1038/s41598-021-81941-x 5
Vol.:(0123456789)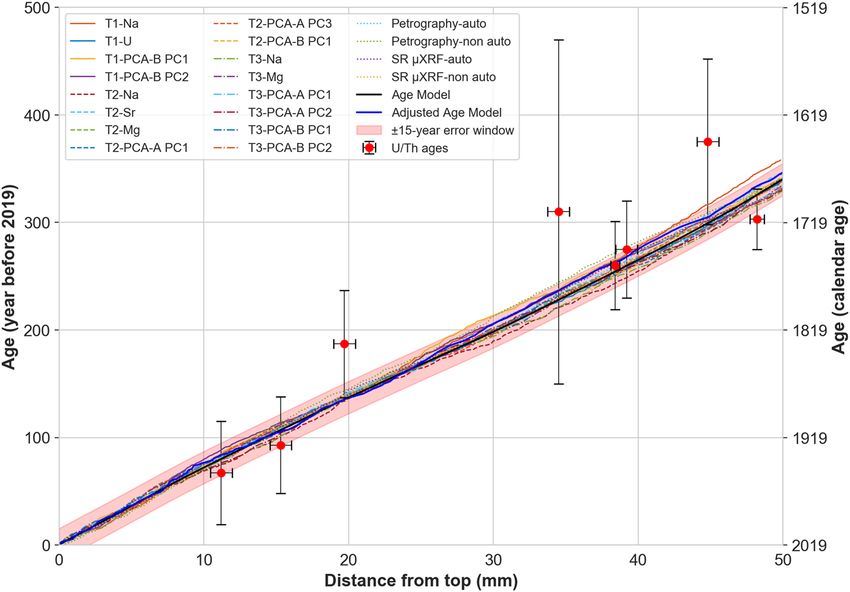
www.nature.com/scientificreports/
Validation of Pu17 chronology: regression and wavelet analysis. In order to further evaluate the
accuracy of the our age model, the infiltration record from Atiu was modelled via inputting a group of trace
elements (Mg, Sr, Ba, Na, U, P and Y) into a Gaussian Process Regression (GPR), a nonparametric kernel-
based probabilistic model54. The GPR in this study is implemented in MATLAB software by using the regression
learner module. Prior to running the GPR, concentration signals of trace elements were detrended to obtain
a fully stationary signal. Detrended signals of trace elements were achieved after identifying 10 most abrupt
changes from the root-mean-square level of the trace elements concentration, and then linearly removing these
abrupt changes from concentration values. Since detrending removes components of the trace elements signal
that are associated to the effects of decadal to multi-decadal climate drivers oscillations, this process must be
exercised with caution when trace elements are used to extract annually resolved past-climate information. By
detrending, we aimed to obtain a stationary dataset for the sole estimation of infiltration, given that the reli-
ability of the constructed chronology is based on the assumption that subtle annual hydrological changes occur.
Thereafter, the normalised and detrended time series of trace elements for the interval of 1914–2019 were split
into two training and test sets, with the latter being the 30 year-long period from 1914 to 1944. The GPR model
was applied on the training set with a tenfold cross-validation configuration. This validation protects against
overfitting by partitioning the dataset into batches (folds) and then estimating the accuracy on each batch. The
effective infiltration was estimated by applying the GP regression to the test data (final validation) and then to
the whole stalagmite. The results of the GPR model on the test data were evaluated by comparison with records
of calculated infiltration (acquired via Thornthwaite equation) and SOI. We used LA-ICP-MS transect-2 (see
Fig. 1) to develop the GPR model because, by anchoring the transects to 2D maps, it was reasonable to assume
that line scans are representative of stalagmite layering. The reliability and accuracy of our modelled infiltration
for the test data period (1914–1944) was finally evaluated through wavelet coherence analysis and the results
compared to SOI data to check for the robustness of our chronology. The coherence was computed using the
Morlet wavelet in MATLAB software and wcoherence function.
Results and discussion
The three independent counting techniques produced 37 series, 20 of which were then averaged and integrated
into an age model. The mean growth rate calculated from the U/Th age model (139 ± 39 μm/year) was found to
be similar to that calculated from lamina counting (144 ± 7 μm/year).
Building the chronology from lamina and geochemical cycles. Pu17 microstratigraphy, consisting
of high-frequency alternation of translucent compact (yellow–brownish) and opaque porous (whitish) low-Mg
calcite layers stacked along the vertical growth axis (see Fig. 1) likely results from the interplay between SIcc, pH,
particulate load, changes in Ion Activity Product due to the effects of marine aerosols, and growth mechanisms.
The complexity of these processes demands an understanding of the provenance of trace elements, which can
be obtained through PCA. We employed two principal component analyses: PCA-A on [Mg, Sr, Na, Ba, P, Y]
and PCA-B on [Mg, Sr, Na, Ba], following identification of laminae in both the SR-μXRF Sr maps and visual
scan (Fig. 1). Two main principal components for each PCA in each transect were obtained, which accounted
for much of the variance in trace element concentration distributions (Supplementary information, Table S-2).
Figure 2 shows the loading of different elements in PC1 and PC2 of PCA-A. PC1 of PCA-A explains 42 ± 1.5% of
the trace element variability in all three LA-ICP-MS transects (Table 1). The elements Sr, Ba, P and Y have posi-
tive values for PC1. Of these, Sr and Ba most likely originate from the host rock and their similar behaviour and
strong, positive correlation is well documented for speleothems28,55. By contrast, Y appears to be a soil-derived
element56, similar to P, although P has a complex behaviour36 and references therein. In Pu17, P plots on the positive
side of PC1, but bears more affinity with Y than Sr and Mg in PC2 axis. The origin of P concentrations in tropi-
cal South Pacific islands appears to be related to weathering of c orals57, which would explain its association in
PCA with both soil- and rock-derived elements. The elements Mg and Na plot on the negative side of PC1. Mg
is commonly believed to derive from the dissolution of a carbonate bedrock58, however, its separation from
bedrock-derived elements in PC1, and its plotting with Na suggests a predominant contribution from sea-spray
and/or any surface source. The sea-spray source is a reasonable hypothesis, considering that Pouatea is 0.5 km
from the coast and marine aerosols easily reach the cave site, particularly in windy and rough sea conditions as
documented for coastal caves elsewhere59. The PC1 axis then is a “provenance axis” with the positive side related
to host rock and soil sources and the negative to marine aerosols and/or products of coral reef weathering.
In the PC2 of PCA-A, which accounts for 24.8 ± 1.2% of the variance, all the elements plot positively except
for Y, which is clearly the only element whose provenance is exclusively from the soil and is carried into the cave
as adsorbed species on p articles56. Thus, Y shows negative peaks (decrease in concentration) during periods of
low infiltration and positive peaks (increase in concentration) during higher infiltration. Because P could also
be sourced from the soil (as a product of weathering of the rock), its behaviour is intermediate between that of
Y and [Sr, Ba]. We, therefore, argue that PCA identifies infiltration as the mechanism controlling the concentra-
tion of trace elements in Pu17 at a seasonal scale, regardless of the trace element provenance. Higher infiltration
(i.e. higher rainfall at a relatively constant temperature) corresponds to less RWI, less PCP and less efficiency
of marine aerosol-derived elements in influencing calcite growth processes. Thus, when drip rate is relatively
high, we would expect the formation of calcite layers with a more porous fabric and relatively low Mg, Na, Sr, Ba
concentrations. By contrast, in relatively wet periods, soil-derived elements, such as Y (and, in part, P), would
increase. The PC2 axis is the “relatively dry” axis for Atiu, where Mg, Na, Sr, Ba and P plot positively and Y plots
negatively. The more positive values of PC2 correspond to enhanced PCP/RWI as a result of lower infiltration, and
its negative values coincide with low PCP/RWI and higher infiltration. LA-ICP-MS analysis of host rock sample
above Pouatea cave corroborates the idea that Mg concentration in Pu17 has two sources. PCA of trace elements
Scientific Reports | (2021) 11:2178 | https://doi.org/10.1038/s41598-021-81941-x 6
Vol:.(1234567890)www.nature.com/scientificreports/
Figure 2. Loadings of different elements in PCA-A on stalagmite trace elements measured at three transects
(plots with red markers), and on host-rock trace elements (plot with green markers).
in the rock shows that they all plot on the positive side of PC1 and on PC2, Mg and Sr behave similarly (see
Fig. 2), which suggests that marine aerosol is a likely additional source of Mg incorporated in stalagmite calcite59.
Figure 3 shows that the elements plotting on the positive side of the “aridity axis”, i.e. Mg, Na, Sr, and Ba show
similar cyclicity and their concentration commonly (but not always) increases in compact laminae (Fig. 3), here
interpreted as formed during relatively low infiltration. It is likely that PCP and/or RWI modulate their cyclicity.
By contrast, P and Y show positive concentration peaks in porous, opaque calcite, here interpreted as a marker
of higher drip rate (wet phases), as they are preferentially transported from soil to stalagmite surface as organic/
inorganic particulates during higher infiltration c onditions17.
PCA-B was established by focusing the analysis to elements whose behaviour is similarly affected by infiltra-
tion (Mg, Na, Sr, Ba). The PC1 and PC2 of PCA-B explain 42 ± 1% and 35.5 ± 1% of the variance, respectively. In
PC1, Sr and Ba load strongly and with positive values, whereas Mg and Na load negatively. All the four elements
plot on the positive side of the PC2 (Supplementary information, Table S-2). The hydrogeologic significance of
trace elements was established through PCA, consequently, we identified that trace element cycles define subtle
annual changes in infiltration in a stalagmite grown under low seasonal contrast conditions. We then applied
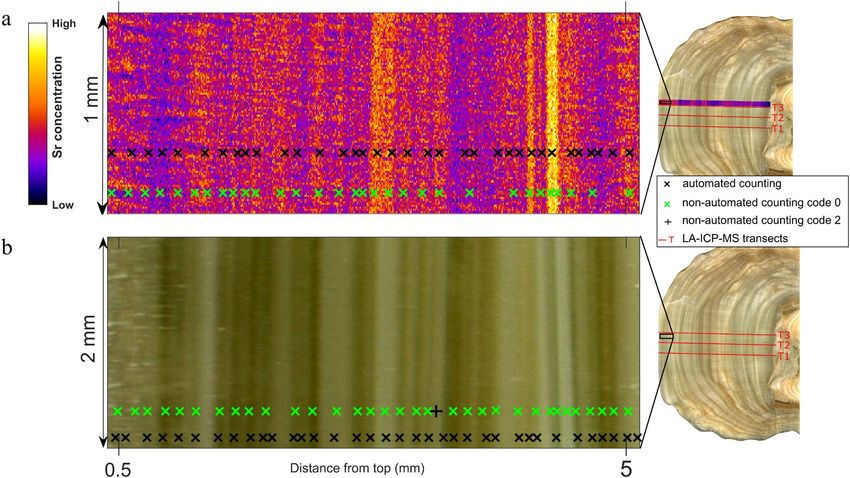
find_peaks to count calendar years by identifying annual cycles in trace element concentration. The locations of
peaks in the “relatively dry” trace elements group including Mg, Na, Sr, and Ba and the principal components
are shown in Fig. 4. PCA reinforces peak counting because it explains much of the variability observed in a
trace elements’ concentration. The chronology based on principal components of a group of elements is more
inclusive than that based on single elements and this minimises the effect of missing peaks that may occur in
single element concentration analysis. However, as shown in Figs. 3 and 4, in some parts of the record the annual
Scientific Reports | (2021) 11:2178 | https://doi.org/10.1038/s41598-021-81941-x 7
Vol.:(0123456789)www.nature.com/scientificreports/
Transect-1 Transect-2 Transect-3
Minimum peak Minimum peak Minimum peak Number of peaks/
Proxy prominence ± 5% Number of peaks prominence ± 5% Number of peaks prominence ± 5% laminations
Mg 0.19 ± 0.009 322 ± 9 0.137 ± 0.007 341 ± 3 0.145 ± 0.007 334 ± 5
Sr 0.228 ± 0.011 325 ± 11 0.22 ± 0.011 345 ± 8 0.23 ± 0.011 337 ± 9
Ba 0.58 ± 0.029 314 ± 22 0.54 ± 0.027 325 ± 20 0.58 ± 0.029 306 ± 23
Na 0.133 ± 0.006 358 ± 2 0.16 ± 0.008 341 ± 5 0.229 ± 0.011 329 ± 12
PCA-A PC1 0.28 ± 0.014 326 ± 3 0.29 ± 0.014 332 ± 12 0.296 ± 0.014 332 ± 8
PCA-A PC2 0.37 ± 0.018 331 ± 12 0.38 ± 0.019 328 ± 9 0.422 ± 0.021 330 ± 12
PCA-B PC1 0.33 ± 0.016 341 ± 10 0.32 ± 0.016 339 ± 9 0.37 ± 0.018 339 ± 10
PCA-B PC2 0.273 ± 0.013 339 ± 5 0.24 ± 0.012 349 ± 7 0.26 ± 0.013 332 ± 6
19 ± 1 330 (auto)
Synchrotron Sr map – – –
– 335 (non-auto)
51 ± 3 335 (auto)
Visual scan – – –
– 329 (non-auto)
Average – 332 ± 9 – 338 ± 9 – 335 ± 11
Table 1. The results of counting on a group of trace elements, principal components, and synchrotron and
petrography images.
variations of trace elements is ambiguous and cycles are not clear. In order to tackle this problem Sr 2D maps
were taken as a reference to anchor the chemical cycles detected by LA-ICP-MS scans. In addition to 2D maps,
the advantageous of using a group of trace elements is that if a cycle is repeated in most of the proxies, it is more
probable to be an annual hydrological cycle, even though of feeble prominence.
The minimum peak prominence adjusted for a group of elements in LA-ICP-MS T1, T2 and T3, and number
of identified peaks are listed in Table 1. A ± 5% error is incorporated in peak prominences and in the number of
counted peaks. Table 1 also includes the results of laminae counting in the SR μXRF Sr map, and in the fabric
scan of Pu17, determined by automated and non-automated methods.
Having established that trace elements follow hydrological cycles, we here infer that trace element concen-
tration variability follows annual cycles, although subdued relative to Mediterranean and Monsoonal settings.
Counted chemical and physical cycles allowed the creation of time-depth (TD) curves along each LA-ICP-MS
transect and 2D mapping for all hydrological proxies, which include individual trace elements, principal compo-
nents, fabrics, Sr concentration distribution along a growth lamina and the associated fabric. We obtained a total
of 37 curves for all transects. The number of peaks/laminations varies in different proxy-data series, however, 20
curves have a mean of 336 ± 15 laminae. These 20 curves were then averaged and integrated into a single master
chronology where the number of laminae equals 336 years. Figure 5 shows selected TD curves and a correspond-
ing average curve (solid black). Averaging further assists to exclude from the master chronology those laminae/
cycles which are not prominent and have probably appeared in one or a couple of proxies. The master chronology
was slightly adjusted by synchronising significant peaks/troughs in Mg concentration (from T2) to construct the
final age model. This was accomplished by stretching/squeezing the age model, within the ± 15 uncertainty limits,
to match similar patterns between Mg and local infiltration and SOI records. Mg was used to adjust the age model
because compared to other elements it has a better correlation with local infiltration. That is in line with our find-
ing that, although Mg has multiple sources, its concentration in speleothem is controlled by effective infiltration
via PCP/RWI processes. The chronology of the stalagmite growth was then extended by 11 years (3% change),
so that the final age model (shown in Fig. 5 by solid blue curve), indicates that Pu17 grew in the last 347 years.
The final age model has a ± 15-year error window (red band) that envelopes most of the curves selected to build
the master chronology. The discrepancy between initial and adjusted master chronologies for the top 25 mm of
the stalagmite is less than 8 years and averages 2–3 years. For the bottom 25 mm, the maximum difference is 10
years. Most of the curves are characterized by a diverging pattern at the bottom half of Pu17, probably because
the laminations are less clear (Supplementary information, Fig S-6). At this interval the adjusted curve follows
the trend of the SR-μXRF Sr maps and fabric curves. The constructed master chronology based on chemical and
physical laminae falls entirely within the U–Th uncertainties as shown in Fig. 5, and confines the uncertainty
bounds of U–Th. These uncertainties are large due to low U concentration and the elevated and variable initial
230
Th/232Th activity ratio and thus the lamina-based chronology had to be used to improve dating accuracy. The
average uncertainty of U–Th ages included in the age model is ca. 50%, whereas the initial lamina chronology
has a maximum error of 15 years (4%), thus decreasing the uncertainty by at least 45%. By tying the U–Th ages
to the annual lamina chronology a discrepancy was found, which was used to reconstruct the initial 230Th/232Th
for each sample analysed, which ranged from 4.9 to 8.1 (median of 6.4, standard deviation of 0.9). The differences
in initial 230Th/232Th are inferred to reflect variable mixing between a crustal Th component close to 0.8 derived
from the basalt core of the island and a radiogenic reef limestone component which could be as high as 20 (e.g.8).
Application of lamina chronology to reconstruct infiltration time series for Pu17. The adjusted
master chronology and the conversion of speleothem depth-from-surface values to time (staring from March
Scientific Reports | (2021) 11:2178 | https://doi.org/10.1038/s41598-021-81941-x 8
Vol:.(1234567890)www.nature.com/scientificreports/
Figure 3. Annually laminated section of Pu17 between 20.5 and 22.5 mm from the top. The dotted vertical lines
mark likely annual cycles identified by maximum Sr values on the synchrotron map. These generally correspond
to maximum values for Mg, Sr, Ba, Na, U and minima for P and Y on the LA-ICP-MS record. The dashed lines
are dubious cycles identified by peaks in only few elements (sub- or double-laminae). Translucent laminae on
the physical sample usually correspond to Sr-enriched laminae on the synchrotron map.
2019, see Fig. 5) provided the basis for an accurately dated time series of trace element variability. The time
series of trace elements and principal components were compared to local infiltration record, which suggests
covariance between the two series for the whole 1914–2019 interval (Fig. 6). The shaded blue and red areas in
Fig. 6 highlight relatively wet and dry periods, respectively. There is a negative correlation between PCA-A PC2
(aridity axis) and infiltration. Relatively dry and wet periods are characterised by higher and lower values of
PC2, respectively. These emphasize the hydrological importance of trace elements in Pu17. The PC2 of PCA-A
includes mostly bedrock/marine derived trace elements and has been interpreted as relatively low drip rate. The
negative correlation between this PC and infiltration corroborates this interpretation. On the other hand, a posi-
tive correlation between PC1 of PCA-A (which includes Y and P) and infiltration supports the association of P
and Y with relatively higher infiltration events.
The next step is the use of Gaussian Process Regression (GPR) to explore the relationship between infiltration
and trace elements time series. Our model provides a regression on the dataset with R2 equal to 0.83 and root
mean squared error (RMSE) of 10.07. The mean squared and absolute errors (MSE and MAE) are 101.5 and 7.1,
respectively. A continuous record of infiltration for the 347 years of Pu17 growth was then obtained. The records
Scientific Reports | (2021) 11:2178 | https://doi.org/10.1038/s41598-021-81941-x 9
Vol.:(0123456789)www.nature.com/scientificreports/
Figure 4. The locations of peaks identified on a group of LA-ICP-MS trace elements and the principal
components. PCA-A includes [Mg, Sr, Na, Ba, P, Y] and PCA-B contains only [Mg, Sr, Na, Ba].
of SOI, the calculated and the modelled infiltration for the time interval of 1914–1944 were compared to each
other in Fig. 7a–c. A correlation between these time series is expected because rainfall, infiltration into cave and
drip rate, are all closely related to the SOI in the Cook Islands, due to the link between sea level pressure and local
convection and precipitation60. It is apparent that the calculated infiltration follows the general trend of SOI for
most of the record (Fig. 7a), however, there are intervals (1924–1934) where infiltration does not reflect exactly
the variations in SOI. Such discrepancy could be due to how the infiltration was calculated. Figure 7b shows
the comparison between SOI and modelled infiltration. It is evident that prominent wet and dry periods in the
6-month moving average of SOI are readily discernible in the modelled infiltration. The modelled infiltration
matches SOI well over the 1924–1934 interval, for which calculated infiltration show some discrepancy. Modelled
and calculated infiltration (Fig. 7c) do not completely match and the GPR model does not perfectly estimate the
absolute values of infiltration. This could be due to the fact that the GPR model was applied without corrections
for the marine aerosol contribution of Mg, and this likely resulted in the mismatch between absolute values for
calculated and modelled infiltration. The exact quantification of the infiltration then requires an approach that
takes into account different sources of trace element provenance and speleothem incorporation mechanisms.
Scientific Reports | (2021) 11:2178 | https://doi.org/10.1038/s41598-021-81941-x 10
Vol:.(1234567890)www.nature.com/scientificreports/
Figure 5. Selected time-depth curves, calculated (solid black) and adjusted (solid blue) master curves.
The ± 15-year error window (red band) envelopes all the selected curves for most of the age interval. The red
circles and vertical capped lines demonstrate the U/Th ages and associated uncertainties.
Figure 6. Comparison of principal components of trace elements with local infiltration record (1914–2019).
Local infiltration was calculated by subtracting the potential evapotranspiration (PET) from the rainfall amounts
at each island. The infiltration values of Mangaia, Aitutaki and Rarotonga were averaged and then tied with
Atiu’s record. The blue (red) shadings of the calculated infiltration indicate positive (negative) anomalies from
mean values of the period 1914–2019. The shaded light blue and light red vertical bands highlight the relatively
wet and dry periods, respectively that are reflected in the principal components. PC1 of PCA-A correlates
positively with infiltration values, whereas PC2 correlates negatively.
Scientific Reports | (2021) 11:2178 | https://doi.org/10.1038/s41598-021-81941-x 11
Vol.:(0123456789)www.nature.com/scientificreports/
Figure 7. (a–c) Comparison of the records of SOI, calculated, and modelled infiltration for the time interval
of 1914–1944. This interval was excluded from the GPR model and was used as test data to validate the model.
As shown, the modelled infiltration follows the general trend of calculated infiltration and SOI. Over the period
where calculated infiltration shows some discrepancy with SOI, modelled data match noticeably with SOI. (d)
The coherency/correlation between SOI and calculated infiltration, (e) the coherency/correlation between SOI
and modelled infiltration. The calculated and modelled infiltration show similar correlation with SOI for the
periods of 2–8 years. (f) The wavelet coherency between calculated and modelled infiltration that highlight
coherency values greater than 0.7 for the whole interval and at all periods. Dashed white curve on the coherency
maps shows the wavelet’s cone of influence.
Given that marine aerosols contribute significantly to the concentration of trace elements in Pu17, wind (direc-
tion and speed) is another factor that would affect the incorporation of Mg. Wind provenance and speed is not
directly connected to the amount of infiltration and this can be one of the reasons of the discrepancy between
the calculated and the modelled infiltration values. Therefore, an accurate quantification of infiltration based
on trace elements alone is not feasible for Pu17, and other independent proxies, such as oxygen isotope ratios
and monitored crystal growth data should be accounted for. However, the aim of the present study is to use the
modelled infiltration for advancing accuracy of an age model based on chemical/physical laminae that have been
robustly correlated to annual hydroclimate cycles. The annual structure of infiltration is well reproduced by our
reconstruction and the estimated values can be confidently used for the purposes of this study. The coherency
between SOI and calculated infiltration is similar to the one between SOI and modelled infiltration for the periods
of 2–8 years as highlighted by wavelet coherence analysis (Fig. 7d,e). In the interval from 1929 to 1934 there is a
strong correlation (magnitude-squared coherency greater than 0.9) between the SOI and calculated infiltration
for a 3–5 years period, and similarly between SOI and modelled infiltration. Despite a small difference between
coherency maps, the modelled infiltration has captured coherent periodicity around 2–8 years and has replicated
the periodicities observed in the calculated infiltration (Fig. 7f). Thus, wavelet analysis provides robustness to
our inference that physical and chemical cycles are annual and their counting provides a robust chronology.
Scientific Reports | (2021) 11:2178 | https://doi.org/10.1038/s41598-021-81941-x 12
Vol:.(1234567890)www.nature.com/scientificreports/
Conclusions
We developed the first accurate age model for a low seasonal contrast, tropical South Pacific stalagmite affected
by elevated and variable initial [ 230Th/232Th] ratio based on a two-dimensional, high-resolution physical and
chemical mapping of laminae. This was complemented by parallel, multiple trace elements line scan PCs, which
allowed selection of the clearest and most consistent annual signal that is necessary to build a master chronology
and exclude proxy time-series that exhibit erratic behaviour.
Hydrologically-significant elements were found to be grouped in the “relatively dry” Mg, Sr, Na, Ba and
the “relatively wet” Y and P. Their PCs were also used as a proxy, because they assign an unequivocal seasonal
significance to each element within the annual hydrological cycle. It was thus possible to improve the chronol-
ogy constructed on physical and chemical laminae by synchronising the laminae dataset to the local climate for
the instrumental period record. The final synchronisation required a minimal adjustment (11 years over 336
years = 3%), thereby demonstrating the suitability of our approach to improve speleothem dating when there are
uncertainties in the U–Th dating method.
Synchrotron-radiation based 2D maps of Sr concentration distribution, which is confirmed to be an excellent
marker of relatively low drip rate (infiltration), tied to its relation to fabrics proved to be fundamental where
laminations are less prominent than in Mediterranean and monsoonal settings characterized by high seasonal
contrast. Physical and chemical mapping of laminae also allowed us to evaluate errors commonly encountered
when lamina counting is based on LA-ICP-MS one-dimensional scans in terms of probability via assessing the
prominence and lateral continuity of growth laminae.
Here, we advanced the empirical lamina counting method, into a technique that can be generally applied
even for “low seasonal contrast” settings. We here demonstrated that the annual nature of chemical and physical
laminae can be tested through their hydroclimate significance by comparing trace-element based chronology
with calculated local infiltration data and one of its drivers, i.e., the SOI.
Our study shows that annual dating is possible even for stalagmites that formed under minimal hydrological
contrast throughout the year opening up the possibility to obtain ages for many tropical speleothems affected
by large dating uncertainties.
It stands to reason that a deeper understanding of how annual physical/chemical variability is generated in
stalagmites from low-seasonal contrast settings (non-monsoonal tropics) may become a powerful method of
dating which ultimately advances the potential of speleothems as unparalleled climate archives.
Methods
Monitoring. Given the remoteness of the Cook Islands and complex subdivisions of the land amongst cus-
todians who do not dwell any more on the islands, a long-term on-site monitoring was not possible. In addition,
there was no trained local individual who could operate an on-site monitoring station. These factors led to lack
of a continuous and long-term on-site cave monitoring for Pouatea. However, cave temperature and relative
humidity were measured hourly by using TinyTag TGP-4500 data loggers which were left in the cave. Cave air
pCO2 was measured during two visits using a Vaisala MI70 Measurement Indicator equipped with GMP222
probe, with measurement accuracy of ± 3.5%. Drip rates at two drip points in another passage close by, parallel
and well-interconnected with the passage where Pu17 was collected were measured hourly by using TinyTag
TGP-4500 data loggers (2017–2018). Drip rate for Pu17 was measured manually by using a stopwatch during the
course of two field trips in March and September 2019. Calcite growth experiments were conducted in-situ on
glass slides for two years and via “instant” growth experiments for 30 min to 8 h on 3-mm in diameter Transmis-
sion Electron Microscopy grids (carbon coated) during “wet” and “dry” seasons.
Trace element analysis. Trace element analyses were carried out at the School of Earth Sciences, Univer-
sity of Melbourne, using a 193 nm ArF excimer laser-ablation system coupled to an Agilent 7700 quadrupole
ICPMS61. Element concentrations were measured from pre-ablated surface using a rectangular (200 µm × 20
µm) laser spot shape scanned parallel to the speleothem growth axis at a speed of 20 µm/s and a laser pulse
rate of 10 Hz generating data-points every ∼ 6 μm. Analyses were conducted on five parallel scans repeated at
a lateral offsets of 5 mm. The repeated tracks allowed identification of outliers caused by photomechanic abla-
tion artifacts, which were then removed from the data. Quantification was carried out using NIST610 (Mg) and
NIST612 (all other elements) glass as external standard. Raw spectrometry data were then reduced using Iolite
software and internally normalised to 43Ca.
Synchrotron radiation micro-X-ray fluorescence (SR-µXRF) microscopy was performed at the XFM beamline
at the Australian Synchrotron62 equipped with a Maia 384 detector array mounted 10 mm away from the sample
target. The beam spot size was 1.5 μm and the monochromatic incident energy was set at 18.5 keV. After the
acquisition of a 8 mm wide medium resolution (20 μm resolution) map, a 2.4 mm wide and 50 mm long 5 μm
resolution map (481 × 10,002 pixels image) was obtained parallel to the stalagmite growth direction. The dwell
time of the beam on each pixel was 10.9 ms allowing the detection of Ca, Fe, Br and Sr, with attenuation depths
of 6 µm (Ca), 27 µm (Fe), 150 µm (Br) and 240 µm (Sr). The XFM spectral data were analysed using the GeoPIXE
software suite, quantified by using single element Mn, Fe and Pt foils (Micromatter, Canada) and corrected by
using a Ca matrix f actor63.
Radiometric dating. U–Th dating was carried out on 10 powdered samples (~ 200 mg) drilled from the
stalagmite growth axis. The samples were dissolved in nitric acid, spiked using a 229Th–233U–236U tracer and U
ellstrom7 and Drysdale et al.64.
and Th were eluted in selective ion exchange resin following the procedure in H
The measurements were performed using a Nu Instruments Plasma MC-ICP-MS at the University of Melbourne
(Supplementary information, Table S-1). The U content varies between 20 and 100 ppb as is the case of active
Scientific Reports | (2021) 11:2178 | https://doi.org/10.1038/s41598-021-81941-x 13
Vol.:(0123456789)You can also read