Suitability of the Kinect Sensor and Leap Motion Controller-A Literature Review - MDPI
←
→
Page content transcription
If your browser does not render page correctly, please read the page content below
Review

Suitability of the Kinect Sensor and Leap Motion
Controller—A Literature Review
Tibor Guzsvinecz *, Veronika Szucs and Cecilia Sik‐Lanyi
 Department of Electrical Engineering and Information Systems, University of Pannonia, Veszprem 8200,
 Hungary; szucs@virt.uni‐pannon.hu (V.S.); lanyi@almos.uni‐pannon.hu (C.S.‐L.)
 * Correspondence: guzsvinecz@virt.uni‐pannon.hu; Tel.: +36‐88‐624‐000 ext. 6188

 Received: 24 January 2019; Accepted: 22 February 2019; Published: 2 March 2019

 Abstract: As the need for sensors increases with the inception of virtual reality, augmented reality
 and mixed reality, the purpose of this paper is to evaluate the suitability of the two Kinect devices
 and the Leap Motion Controller. When evaluating the suitability, the authors’ focus was on the state
 of the art, device comparison, accuracy, precision, existing gesture recognition algorithms and on
 the price of the devices. The aim of this study is to give an insight whether these devices could
 substitute more expensive sensors in the industry or on the market. While in general the answer is
 yes, it is not as easy as it seems: There are significant differences between the devices, even between
 the two Kinects, such as different measurement ranges, error distributions on each axis and
 changing depth precision relative to distance.

 Keywords: accuracy; gesture recognition; Kinect; human‐computer interaction; human motion
 tracking; Leap Motion; precision; suitability

1. Introduction
     As technology progresses, the popularity of virtual reality, augmented reality and mixed reality
increases. The uses of virtual reality [1], augmented reality [2] and mixed reality [3] are spread across
multiple fields: education, military, medical fields, entertainment, etc. Each of the three mentioned
realities have different locations on a “reality‐scale”, which can be seen in Figure 1, and they also
have different properties: virtual reality may be the simplest to use as it is a fully virtual, synthetic
environment which can be interacted with. Augmented reality is different, because it is a reality
which expands upon our reality. Mixed reality is between virtual and augmented reality and it allows
augmented objects to be interacted with.

                                Figure 1. The types of realities, from real to virtual [4].

     However, these realities need sensors to work as intended, meaning to place the user in a certain
reality, so to say. To do this, the most common method is for the user to wear a Head‐Mounted
Display (HMD). Most HMDs have inertial sensors such as gyroscope and accelerometer to track the
motion of the user’s head [5]. To fully realize the potential of these realities, tracking only the head is
not enough as interaction with the environment is required with the use of other sensors, working
together with the mentioned HMD.

Sensors 2019, 19, 1072; doi:10.3390/s19051072                                             www.mdpi.com/journal/sensors
Sensors 2019, 19, 1072 2 of 25
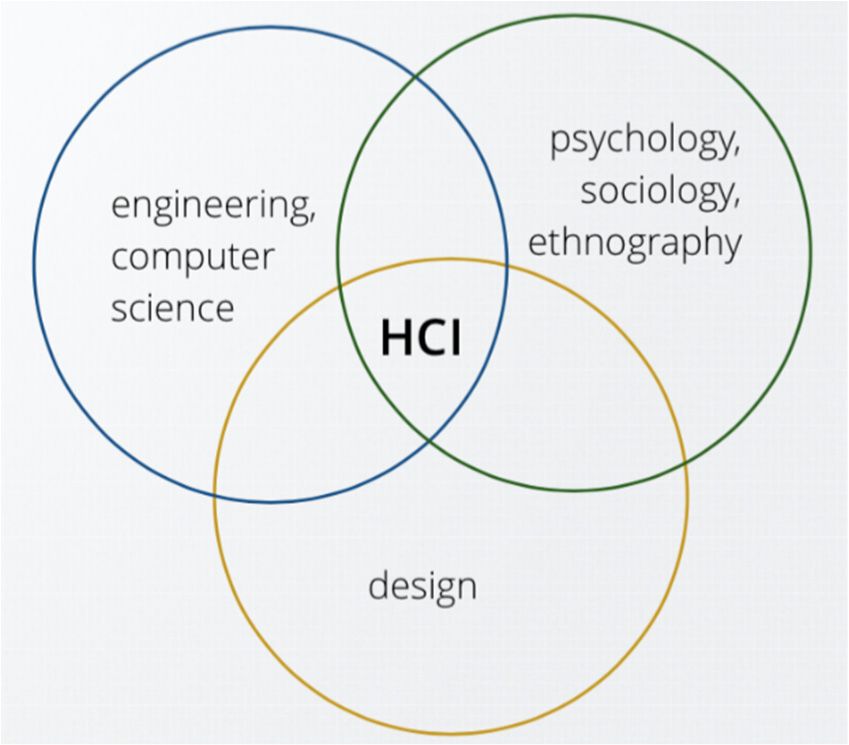
Additionally, the human—also known as the user – is an important element in the whole system
which can be seen in Figure 2. Between the human and the machine, the interaction, usability and
comfort are key factors. Human‐Computer Interaction (HCI) is a multidisciplinary field of research
which deals with these types of questions, not only on the hardware side but on the software side as
well [6]. However, the engineering and the computer science sides of HCI are focused on in this
paper, namely on the sensors in order to determine if they are viable as human motion tracking
devices.
Figure 2. Parts of Human‐Computer Interaction [7].
The problem with precise human motion tracking is that it is expensive and most people—
especially those who live in developing countries—cannot afford it. Even if they could, most motion
tracking sensors are not available commercially, possibly due to their use and price. A few of those
sensors will be mentioned in this paper.
This paper investigates the use of low‐cost sensors, such as the Kinect sensor (Microsoft,
Redmond, WA, USA)—for full body motion tracking via its depth cameras and skeleton stream [8]—
and the Leap Motion Controller (LMC, Leap Motion, San Francisco, CA, USA)—for hand motion
tracking [9]—to see if they can substitute the expensive ones. The question of the Kinects and the
LMC is interesting. This means that if they are applied in many fields due to being part of HCI studies,
it should be determined if they are considered adequate as sensors by studying their precision and
accuracy. Thus, the research question (RQ) of the authors is the following: Can these three sensors
substitute expensive sensors while taking into account their accuracy, precision and price while also
assessing existing gesture recognition algorithms?
The paper is structured as follows: Section 2 deals with the methodology used while reviewing
and Section 3 briefly presents the devices and comments on their market situation. In Section 4, the
state of the art is reviewed: the authors of this paper present existing uses of the two mentioned
sensors. In doing so, the authors establish the suitability of the devices, meaning whether the devices
are acceptable for certain tasks. In Section 5, the Kinect and the LMC are compared to similar price
range sensors and to even more expensive ones based on their use, functionality and suitability.
Section 5 also deals with the use of all sensors in existing applications. In Section 6, their accuracy
and precision are examined. Existing algorithms are also presented and their accuracy are assessed.
Finally, a proper conclusion is given in Section 7.
2. Methods
For this literature review the Web of Science, PubMed, and IEEE Xplore databases were searched
using the following keywords for the Kinect devices: “Kinect” AND “review” OR “accuracy” OR
“medical applications” OR “physical disability” OR “education” OR “gesture recognition” OR
“precision” OR “skeleton”. For the LMC the following keywords were used: “Leap Motion” AND
“review” OR “accuracy” OR “medical applications” OR “physical disability” OR “education” ORSensors 2019, 19, 1072 3 of 25
“gesture recognition” OR “precision”. The keywords “review”, “accuracy”, “precision”, “skeleton”,
“gesture recognition” were selected because they offer the possibility of retrieving depth data or
measurement information. The keywords also have the possibility of retrieving information about
both accuracy and precision, even when talking about the skeleton stream or when recognizing
gestures. While not synonyms, if a study focuses on precision, the accuracy is also always present,
but the reverse is not the case when searching for keywords with “accuracy” in them while using at
least one of the sensor names. In our case, when talking about measurement systems, accuracy means
the degree of closeness of a measured quantity to its true value. Precision means the degree to which
repeated measurements produce the same results under similar, unchanged conditions [10]. The
keywords “medical applications”, “physical disability”, “education” were chosen to evaluate the
multidisciplinary use of the sensors. Still, a low possibility exists that they present and evaluate
algorithms that were developed by their authors. These algorithms use at least one of the sensors and
usually, their accuracy is studied as well. Regarding the search, no filtering was applied: all articles
were indexed since the inception of the first version of the Kinect [11] and the LMC [12]. Every author
searched in one database. Both the search and the first part of the review were conducted from late‐
October 2018 to early–January 2019 and the second part in February 2019. The search results are
presented in Table 1.
Table 1. Search results for the literature review.
Number of Results
Keywords Web of Science PubMed IEEE Xplore
Kinect review 74 36 48
Kinect accuracy 635 200 884
Kinect precision 105 4 128
Kinect skeleton 183 99 578
Kinect gesture recognition 240 30 727
Kinect medical applications 27 19 183
Kinect physical disability 22 22 24
Kinect education 67 77 183
Leap Motion review 12 8 6
Leap Motion accuracy 66 18 83
Leap Motion precision 19 7 20
Leap Motion gesture recognition 36 9 147
Leap Motion medical applications 6 7 34
Leap Motion physical disability 3 3 3
Leap Motion education 10 12 25
According to the search results the Kinect devices are more popular than the LMC and most of
the studies regarding all the devices revolve around gesture recognition and their depth sensing
properties. The number of studies regarding the precision of the devices is adequate, though the
Kinects are more popular in this regard. However, there is a large overlap with accuracy and gesture
recognition. After searching the databases, the selection of relevant studies was done according to
the Prisma 2009 Flow Diagram [13] (see Figure 3 for details). After removing the duplicates, 425
records were screened. All three authors were part of the screening stage. The first two screening
criteria were the titles and abstracts of the records. Three hundred and seventeen (317) records were
excluded as neither their titles nor their abstracts referred to the state of the art, motion tracking,
gesture recognition, the accuracy or precision of the devices. After that, 108 full‐text articles assessed
for eligibility which consisted of a content analysis. Based on their content, 14 full‐text articles were
excluded as those articles did not give significant information about the state of the art, motion
tracking, gesture recognition, accuracy or precision. Out of these 14 articles, four were shorter
versions of extended papers. Naturally, the shorter versions were omitted from the literature review.
When doing the content analysis, each author analyzed different aspects.Sensors 2019, 19, 1072 4 of 25
5413 records identified through Web of Science, PubMed, IEEE Xplore databases
879 records after duplicates removed
425 records screened 317 records excluded (irrelevant)
108 full-text articles assessed for eligibility 14 full-text articles excluded
94 studies included in quantitative synthesis (meta-analysis)
51 studies included in qualitative synthesis
Figure 3. Selection of the relevant papers based on the Prisma 2009 Flow Diagram.
The remaining 94 studies helped constitute the bulk of this research paper as those studies talked
about the usefulness and suitability of the devices in multidisciplinary applications. Out of these, 51
studies helped with answering the authors’ RQ. The content of those papers is about human motion
tracking while assessing the precision and accuracy of the devices or the accuracy of algorithms.
3. Presenting the Sensors
Before talking about the state of the art, the devices should shortly be presented: The first Kinect
was announced in 2009 [11] and the LMC in 2012 [12]. Both devices are popular with the public:
Eight million Kinect units were sold in 60 days. In early‐2013, the number of Kinects sold was
over 24 million. During their lifetime, the almost 30 million Kinects units were sold, with 23
million being the Kinect v1 and the remaining being the Kinect v2 [14,15].
In contrast, the LMC sold over 500 000 units after its first year on the market [16]. Since then, no
new market data on the number of sold units was published. Additionally, Apple tried to
acquire Leap Motion in 2018, but the deal was never finalized [17].
Sadly, Microsoft discontinued the Kinect sensors in the fall of 2017, and on 01.02.2018 the USB
adapter for the Kinect devices was discontinued as well [15]. Without the adapter, the sensors could
not connect to a PC. One of the reasons behind this discontinuation was that there were not enough
good games for the Kinects. However, even if the entertainment industry was not satisfied with the
Kinects, it is a different story in the field of research. Section 2 provides proof of this. In contrast to
the Kinects, the LMC is still being manufactured and sold at the time of writing this review. All
devices are still used to this day and are still in circulation.
For more information regarding the hardware of both Kinects and the LMC, readers may consult
Subsections 3.1 and 3.2. The information found in this whole section on the devices should be
considered as an introduction or a summary. The information is detailed in later sections.
3.1. Kinect Devices
Both Kinect devices can track the whole human body. Both feature two depth cameras which
means that they combine two types of techniques for depth mapping: focused and stereo. Focus
means that when objects are further from the device, they become blurrier. However, the Kinects use
astigmatic lenses with different focal lengths on the x and y axes to improve the accuracy [18]. WithSensors 2019, 19, 1072 5 of 25
stereo, it calculates depth from the disparity [19]. In addition to the depth cameras, the Kinect devices
both have a microphone array which consists of four microphones. The microphones are equipped
with a multichannel echo cancellation feature and can also track sound position. The microphones
can suppress and reduce noise. Aside from these, the hardware of both Kinects are different from
each other in other aspects. The Kinect v1 has a 64 MB DDR2 SDRAM inside and uses a PrimeSense
PS1080‐A2 chip which processes data before transmitting [20]. This can be seen in Figure 4. Its
infrared emitter has a 60 mW laser diode and functions on a wavelength of 830 nm. The Kinect v2
has a Samsung K4B1G1646G 128 MB DDR3 SDRAM and features a Microsoft X871141‐001 chip
instead of the PrimeSense one [21].
Figure 4. Flow of data between parts of the Kinect v1.
The Kinects mainly function as depth sensors. In contrast to their hardware, both Kinects are
similar in the way that they use depth mapping. Their depth mapping techniques, however, are
different. The Kinect v1 uses its infrared emitter to emit infrared dots and can calculate distances
based on their distortions [22]. The Kinect v2 uses a Time‐of‐Flight (ToF) method which measures the
speed of light to calculate the distance [23]. The latter can be seen in Figure 5. More information on
both depth mapping methods can be found in Sub‐subsection 6.1.1, where their positive and negative
attributes are presented.
Figure 5. Illustration of the Time‐of‐Flight method.Sensors 2019, 19, 1072 6 of 25
There is another way for motion tracking: Microsoft released Software Development Kits (SDKs)
for both Kinects which feature a so‐called “skeleton stream”. This skeleton stream allows the
developers to track the joints of the user in real‐time. More information can be found in Sub‐
subsection 6.1.2.
3.2. The LMC
The integrated circuit (IC) of the LMC is a Macronix 25L320E which stores the USB controller’s
firmware in 32 Mbits. It allows for both USB 2.0 and USB 3.0 connections routed into different parts
of the IC. The IC of the USB controller is a CYUSB3014‐BZX by Cypress Semiconductor (San Jose, CA,
USA) and the device also features a P‐Channel MOSFET with an ID of FDD6685 made by Fairchild
(South Portland, ME, USA). The LMC itself is manufactured by Sunny Optical [24].
The device has two cameras and three infrared LEDs inside it which can detect infrared light.
Due to its two cameras it creates a grayscale stereo image from the infrared light data, but it does not
map using its depth cameras like the Kinect. Instead, the device uses algorithms to calculate the data
of the hand from the raw sensor data. This raw data is made up from infrared brightness values and
calibration data to fix lens distortions. Its motion tracking range is between 2.5–60 cm according to
the official blog of the manufacturer and Wright et al. [25], but since the Orion beta version came out
in 2016 it has been expanded to 80 cm [26]. An illustration of the LMC’s hand tracking and Field of
View (FoV) can be seen in Figure 6. The LMC can capture skeletal data of the hand as well. It is a
software method made possible by its official application programming interface (API) as of version
2 [27]. The skeletal data can be acquired in a 3D space [28] which is—in a way—similar to the Kinect
devices as their data can also be acquired in a 3D space. This means that the Kinects and the LMC can
see the depth of the image, but with different methods and all have a skeletal motion tracking feature,
where the frames of the joints can be accessed real‐time.
.
Figure 6. The different axes of the LMC.
However, the LMC suffers from latency issues. This has been evidenced by Silva et al. in 2013
[29]. The test used Digital Musical Instruments (DMIs)—pianos to be exact—written in Java language
to measure the latency of the LMC. In their study, all three performance sets of the LMC has been
tried – these are available in the LMC SDK. The approximate frame rate per second and the delay of
these performance sets can be seen in Table 2. However, in the study the delay was 71 ms instead of
5 ms in High Speed mode which raises questions: are there other factors which increase latency? In
the blog hosted by the manufacturers of the LMC, it is mentioned that there are hardware and
software factors regarding the latency [30,31]. This can be seen, for example, in the fact that by
switching from the USB 2.0 port to the USB 3.0 port the frame rate per second can by multiplied by
one and a half. Even the display monitor could be at fault when talking about latency. In that study,
they also mention that the acceptable latency should be less than 20 ms, so using DMIs should only
be advisable with a slow rhythm. Also, a tracking problem surfaced when conducting the latencySensors 2019, 19, 1072 7 of 25
tests: when the fingers are too close to each other while playing the piano, the LMC could not
differentiate between the fingers. In that case, not all or false musical notes were played depending
on the position of the fingers.
Table 2. Performance of the LMC with an USB 2.0 port.
Mode Approximate Frame Rate/Second Delay
High Precision mode 50 fps 20 ms
Balanced Tracking mode 100 fps 10 ms
High Speed mode 200 fps 5 ms
4. Motion Tracking State of the Art
Studying of the literature of motion tracking is needed to give context and to answer our RQ.
Motion tracking as a whole is however a vast field of research. The sensors used in motion tracking
can be classified into multiple categories according to Zhou and Hu [32]. According to them, the three
main tracking categories are “Non‐visual tracking”, “Visual‐tracking” and “Robot‐aided tracking”.
All three of these main categories have multiple subclasses. Also, in their classification study, they
did a survey on the use of sensors in the field of rehabilitation. They surveyed multiple sensors from
all three main classes, but came to the conclusion that these sensors are not patient‐oriented, they do
not allow home use and are expensive. In contrast, both the Kinect and LMC are low‐cost sensors and
allow home use if the therapist allows it. However, since the survey was made in 2008, it has to be
noted that the Kinect sensor and the LMC did not even exist at that time.
Based on the mentioned survey of Zhou and Hu [32], both the Kinect sensor and the LMC can
be classified into the marker‐free visual‐based category: According to the authors the sensors that are
classified in this category have high accuracy, high compactness, inefficient computation, low‐cost
and their only drawback is occlusion.
As both are marker‐free visual‐based sensors, the Kinects and the LMC can only track motions
which happen in front of them (meaning that the movements happen in their FoV). To increase this
FoV, an indoor localization study was done with Kinects [33]. In that study, the authors connected
three Kinect devices at different angles. Depending on the angle of the user, one of the three Kinect
devices started to track the user. The Kinects were selected by the Bivariate Gaussian Probability
Density Function and the Maximum Likelihood Estimation methods. They concluded that this is not
only precise, but a low‐cost substitute for more expensive sensors.
Also, because of the marker‐free visual‐based classification and—possibly—their low prices,
both sensors are used in multiple fields and were the targets of multiple literature reviews and other
assessments in the past. In 2011, while the Kinect was still young, its educational usefulness was
assessed [34], which yielded skeptical, but positive results. In 2014, Bacca et al. [35] reviewed the
trends in AR and found that the demand for educational AR games for the Kinect was increasing
while mentioning that its object tracking should be improved algorithmically.
In 2014, Hondori and Khademi [36] studied the clinical and technical impact of the Kinect sensor
while comparing it to the LMC, Asus Xtion Pro Live and Intel Creative. Also, according to them, the
number of papers indexed by PubMed assessing the Kinect increased drastically from 2011. They
concluded that the Kinect is useful in medical applications. Reis et al. [37] concluded that most studies
only include upper limb rehabilitation and most studies focus on serious games with the Kinect to
make rehabilitation and education fun and motivating. In 2015 Da Gama et al. [38] also concluded
that motor rehabilitation is possible, but the skeleton tracking of the Kinect should be improved.
There are other studies regarding the Kinects which do not cover precision and accuracy, but
rather focus on their use and suitability in multiple fields: virtual laboratories for education [39],
helping children with special educational needs [40], measuring and improving mild cognitive
impairment [41], improving motivation [42], exercise gaming [43], establishing a gesture controlled
interface for people with disabilities [44], assessing game performance of people with physical
disabilities [45], studying navigational issues of people with movement disorders in a virtual
environment [46] and other, virtual reality therapies [47,48].Sensors 2019, 19, 1072 8 of 25
Multiple reviews exist for the LMC as well. The most recent was in 2018, where Bachmann et al.
reviewed [49] 3D HCI with a focus on the LMC. Though the study mostly contain information about
3D HCI, information about the hardware side of the LMC is also contained therein. Similarly to the
Kinects, the LMC can be found in other studies regarding its use and suitability. Since it tracks hands,
multiple studies have been conducted for sign language recognition: American [50,51], Arabic [52–
54], Australian [55], Greek [56], Indian [57], Israeli [58] and Mexican [59]. It can also be found in
education [60], in studies regarding upper limb rehabilitation [61–63], wheelchair maneuvering [64],
robotic arm navigation [65,66]. Also, in [67] a phantom tumor was removed. Its conclusion is that in
some cases, surgery with the LMC could be possible and suitable. However, haptic feedback should
be included and more research may be necessary in this field.
A research on the trends of HCI was done in 2018 [68], concluding that these devices will make
the standard keyboard, mouse and other traditional input devices obsolete. When dealing with
simple gestures, mainly in the field of physical rehabilitation for people with disabilities, the Kinects
and the LMC already replaced the mouse. This can be seen in the aforementioned studies. However,
when doing more complicated gestures, the mouse is still superior. In contrast, the manufacturers of
the LMC have the aim to replace the mouse in all hand movements. At the moment, they are working
on a device called North Star [69] which is an augmented reality headset combined with the LMC. It
is possible that after release, it will make the mouse and keyboard obsolete.
It should be noted that the studies involving these devices work with their own, private datasets.
There is, however, a public example dataset for the Kinect v1 provided by Microsoft [70] which can
be used for testing purposes. For the LMC, no public example datasets exist, but example applications
are available [71].
To summarize, with the studies reviewed in this section, the authors presented different uses of
the devices. The authors believe that these studies are socially important as well, and could raise the
awareness of the readers. Also, the studies provided positive results or conclusions, making the
devices suitable in these fields of research. This gave context to our RQ.
5. Discussion: Comparisons to Other Sensors
From this section onwards, the technical side of the devices is reviewed, starting with device
comparisons found in the literature. In Subsection 5.1, the Kinects are compared to several other
devices which use markers or are marker‐free, respectively. In Subsection 5.2, the LMC is compared
to other, wearable devices. In the following subsections, devices in the same price range and more
expensive ones are compared with the Kinects and the LMC. All devices function well in their
respective fields of research, whether they are more expensive or in the same price range. However,
it is important to determine whether the cheaper sensors can achieve the same or similar results for
less price.
5.1. Kinect Sensor
Gonzalez‐Jorge et al. [72] compared the Kinect v1 to the Asus Xtion. Similarly to the Kinect v1,
the Xtion is also equipped with a depth camera [73] and works in a similar way. They project infrared
dots and use their depth camera to calculate depth based on the mentioned infrared dots. Both
sensors use the PrimeSense infrared measuring unit. In contrast to the Kinect v1, the Xtion does not
require an external power supply: It connects to the computer through the USB port and this supplies
it with power. In the study artefacts were measured at the angles of 45°, 90° and 135° but the angles
did not affect accuracy and precision in the case of both sensors. The sensors did not produce an
image at the range of 7 m. According to the study of Gonzalez‐Jorge et al., both sensors behave in a
similar way (due to their use of the same PrimeSense infrared measuring unit). The sensors could be
used for multiple applications if the required tolerance is not strict.
Breedon et al. [74] did a comparison between the two Kinect versions, the Intel RealSense SR300,
Xtion Pro Live. The latter did not offer many improvements over the Kinects, but it has a better depth
camera. Its depth camera resolution is 640 480. This is an improvement on the depth camera of the
Kinect v2 with its resolution of 512 424. The Xtion Pro Live sensor was also discontinued like theSensors 2019, 19, 1072 9 of 25
Kinects. In 2018, a new version of the Intel RealSense, called the D415 has been released. Carfagni et
al. [75] compared this device to its predecessor and to the Kinect v2. The raw data of the D415
provides less probing form errors, less probing size errors, less sphere spacing errors and less flatness
errors than the raw data of the SR300 and the Kinect v2. In the study, it was concluded that the Intel
RealSense D415 can be used as a low‐cost device. It can be used in motion tracking, in gesture
recognition and in other, 3D‐scanning applications as well. Since all mentioned devices use depth
mapping, a brief comparison is provided in Table 3.
Table 3. Brief comparison of similar price range, whole body tracking devices.
Intel RealSense Intel RealSense
Kinect v1 Kinect v2 Xtion Xtion Pro Live
SR300 D415
1920 × 1080 at 30
Color camera 1280 × 720 at 12 fps, 1920 × 1080 640 × 480 at 1280 × 1024 at 15 fps, 1920 × 1080 at
fps, 1280 × 720 at
resolution 640 × 480 at 30 fps at 30 fps 30 fps 640 × 480 at 30 fps 60 fps
60 fps
Depth camera 512 × 424 at 320 × 240 at 640 × 480 at 30 fps, 1280 × 720 at
320 × 240 at 30 fps 640 × 480 at 30 fps
resolution 30 fps 30 fps 320 × 240 at 60 fps 90 fps
Stereoscopic
Depth technology Infrared ToF Infrared Infrared Coded light
active infrared
58°H,
Field of view 1 57°H, 43°V 70°H, 60°V 58°H, 45°V 73°H, 59°V 69.4°H, 42.5°V
45°V
Specified measuring
0.4 or 0.8 m–4 m 0.5–4.5 m 0.8–3.5 m 0.8–3.5 m 0.3–2 m 0.16–10 m
distance
Connectivity USB 2.0 or 3.0 USB 3.0 USB 2.0 USB 2.0 USB 3.0 USB 3.0 Type‐C
1 H stands for horizontal, V stands for vertical FoV.
Romero et al. studied [76] if the Kinect v1 sensor could replace the Polhemus Liberty Latus
wireless system [77] while investigating the motor skills of children with Autism Spectrum Disorder
(ASD). They came to the conclusion that in some ways it can substitute the Liberty Latus and in some
ways it cannot: the Polhemus Liberty Latus gives a more accurate measurement with its
electromagnetic (EM) field position and rotation mapping and in this regard is superior to the Kinect
sensor. The Polhemus Liberty Latus is more suitable for measuring small scale, high precision tasks
than the Kinect. On a large scale, however, if multiple limbs or whole‐body tracking is used, the
Kinect gives better results and its data is easier to use.
Sun et al. [78] found out that gesture recognition with the Kinect is possible by using its color
camera along with surface electromyography (sEMG). Both sensors were used at the same time,
fusing the acquired data. On the Kinect side, they used Fourier transformation and a characteristic
line method and modeled the data on histograms. Also, because the color camera is used, the noise
had to be filtered from the video. To achieve this, polygonal approximation, then a Douglas‐Peucker
(D‐P) algorithm were used. Before the test, fifty training samples were collected and another fifty
were collected as silhouette samples. Two hand gestures, four wrist gestures, and four finger gestures
are tested, twenty of each gesture in five different groups (which means the total of 100 for each
gesture). With the sEMG averaging in 60‐65 gestures and the Kinect averaging in 80‐90 gestures, they
concluded that the Kinect is superior to sEMG.
A firearms training simulator has been developed by Bogatinov et al. [79] to replace more
expensive existing simulators on the market. The gestures inside the application has been created
with the Flexible Action and Articulated Skeleton (FAAST) toolkit [80]. They propose that their
simulator is better and cheaper than other military simulators such as MINT‐PD [81] when used with
nine calibration points and when the player is 2.5 m away from the Kinect sensor. Using MINT‐PD
is more expensive than using the Kinect. That is because it requires the set‐up of a controlled
environment with a laser and a laser‐tracker, a microphone for speech recognition and a tablet for
special input.
As a side note, not just human motion tracking is available with the Kinect sensor, but
environmental tracking as well: Rosell‐Polo et al. used the Kinect v2 for agricultural outdoor
applications [82]. Normally, in this field people use Light Detection and Ranging (LiDAR) sensors
which consist of Terrestrial Laser Scanners (TLS) or Mobile Terrestrial Laser Scanners (MTLS). They
found that the Kinect v2 sensor is similar to both TLS and MTLS due to its color and depth cameras.
However, the Kinect v2 comes with a shorter range and a narrower FoV than LiDARs. In the study,Sensors 2019, 19, 1072 10 of 25
the authors combined the Kinect v2 sensor with a real time kinematic Global Navigation Satellite
System (GNSS). The authors of the mentioned study used different FoVs with different sampling
rates: 5.15 Hz with a single‐column FoV, 0.75 Hz with partial FoV, and 0.15 Hz with full FoV.
Naturally, 5.15 Hz results in the best output, however there could be up to 1.5% of errors. In short,
they achieved a low‐cost and effective substitute for LiDAR sensors. In another study by Keightley
and Bawden [83] it can be seen that the ILRIS 3D LiDAR sensor can be used for environment tracking,
thus giving this paper a LiDAR sensor to compare the Kinect v2 with.
Table 4 presents a summary of the comparisons between the devices. In the table four columns
can be found: the name of the device, its mapping type, its sampling rate and its market or used price
at the writing of this review. As suspected, the Polhemus Liberty Latus, the sEMG and the ILRIS 3D
are extremely expensive. Regarding cost, there is no information available on the MINT‐PD as it has
been developed for the military. Also, it has to be noted that the first four devices in Table 4 were
discontinued at the time of writing this review. This means that only used ones are available on the
market, thus its price might vary from seller to seller.
Table 4. Results of the reviewed articles.
Name Mapping Sampling Rate 1 Cost
Kinect v1 Depth (IR) 30 Hz US$99.95 [84]
Kinect v2 Depth (ToF) 30 Hz US$99.99 [85]
Xtion Depth (IR) 30 Hz €50 [86]
Xtion Pro Live Depth (IR) 15 Hz US$140 [87]
Intel RealSense SR300 Depth (Coded light) 30 Hz €68.12 [88]
Intel RealSense D415 Depth (Stereo active IR) 90 Hz US$149 [89]
Polhemus Liberty Latus EM field 188 Hz or 94 Hz US$12,500–US$60,000 2
sEMG Electrodes 800 Hz–1 kHz 3 [90] US$25,000 4 [91]
MINT‐PD Laser No information. Not available.
ILRIS 3D Laser 2500 points/s €16,000 [92]
1 The sampling rate is defined on the largest possible resolution of the device. 2 Cost depends on
the number of sensors. 3 The most common use, up to 6 kHz is possible. 4 It is the cost of the BTS
FreeEMG 1000. It is possible that there are less or more expensive devices on the market.
5.2. Leap Motion Controller
Naturally, the LMC has only been compared to sensors which can track hands. The first
comparison was done with the Optotrak marker which is often used as the golden standard as it has
errors around 1 mm. The Optotrak marker strobes the user and can be used wired and wirelessly
[93]. This comparison was done in the study of Tung et al. [94]. The LMC had high degree of
correlation with the Optotrak marker, specifically 0.995 on the horizontal axis and 0.945 on the
vertical axis. Also, the finger accuracy of the LMC was 17.3 mm with a standard deviation of 9.56 to
the Optotrak. In this study, the accuracy of the LMC was also assessed with the error of 17.30 mm.
See Section 6.2 for further information on accuracy and precision.
Another comparison was done in another study to the Myo Armband which uses Bluetooth Low
Energy frequency (2.402–2.480 GHz) connectivity with a sampling rate of 200Hz. Chen et al.
compared the LMC to the Myo Armband through the use a virtual reality application made inside
the Unity game engine [95]. Though there are no precision and accuracy data was available in that
study, a comparison and analysis were done through controlling the game. They measured the
success rate of the users during playing the game with the following method: if the user falls from
the level, it is considered as a fail. With the Myo Armband, the total number of falls was 84 and with
the LMC the number during testing was 74. This leads to the conclusion that either the LMC is more
accurate and precise than the Myo Armband or it is easier to use. The latter is also concluded by that
study where 17 participants stated that the Myo Armband was the hardest “game controller” to use,
and 10 participants stated that the LMC was the hardest to use. However, they also concluded that
there is little research available on continuous movements that require high precision.Sensors 2019, 19, 1072 11 of 25
Breedon et al. [74] compared the LMC and the Creative SENZ3D. The SENZ3D has multiple
advantages over the LMC: it can be controlled by voice as it has a dual array microphone. It can also
detect head movements and features facial recognition additionally to hand tracking. This allows it
to capture images of head contours. While it has some improvements over the LMC, it has some new
limitations as well: Only one of its cameras can be used or only the voice capture function can be
active at a time. It cannot use both of these features at the same time. At the time of writing this
review, it is discontinued. Akin to the previous subsection, Table 5 presents a summary of the
compared devices. The columns are extended by one, named Connectivity, which details how the
device is connected to the computer.
Table 5. Results of the reviewed articles.
Name Mapping Sampling rate Connectivity Cost
LMC Algorithmic 50–200 Hz 1 USB 2.0 or 3.0 US$80 [96]
Optotrak marker Strobe 120 Hz Wired/Wireless Not available.
Myo Armband Electrodes 200 Hz Bluetooth US$200 [97]
Creative SENZ3D Depth 30 Hz USB 2.0 or 3.0 US$79 [98]
1 The sampling rate of the LMC is 50–150 Hz according to [94], but in [29] it is 50–200 Hz.
6. Discussion: Accuracy and Precision
After the device comparisons in the previous section, this section deals with their accuracy and
precision when sensing depth. Also, since the authors believe that gesture recognition is one of the
most important uses of these devices, existing algorithms are presented as well. The accuracy of these
algorithms are also assessed. When choosing a sensor for a task, the authors believe these are the
most defining factors.
This section is made up from three subsections: studies about the Kinects, about the LMC and
about using them together. The Kinects subsection is broken into two subsubsections, containing
studies about their depth cameras and skeleton streams, respectively. The LMC subsection is not
broken into two subsubsections like the Kinect. This is due to most research only deal with its skeletal
data as the raw data is strongly distorted due to the wide field of view. The last subsection deals with
researches which use all devices.
6.1. Kinect Sensor
When talking about the accuracy and precision of the Kinects, it has to be mentioned that two
types of data can be extracted from the Kinects. The first is simply the raw data returned by the depth
camera. Several studies have been done with raw data and multiple applications have been
developed to extract and analyze the data. These are mentioned in Sub‐subsection 6.1.1.
The other type is called the skeleton stream, but it also uses the depth camera of the Kinect. It is
basically a “software method” of returning the depth data as it is part of the SDK made by Microsoft.
With the help of the skeleton stream, the Kinect can recognize joints in the human body and return
real‐time motion tracking data. It uses the mean‐shift clustering algorithm to calculate modes of
probability distributions to classify body parts into a virtual skeleton [18]. When using the skeleton
stream, Microsoft recommends a range of 1.2–3.5 m between the Kinect and the user. It is mainly
used for gesture recognition in medical applications, a few of them were mentioned when dealing
with the state of art. In Sub‐subsection 6.1.2, the skeleton stream is reviewed.
6.1.1. Depth Sensor
Wassenmüller and Stricker [99] compared the depth camera of the Kinect v1 to the Kinect v2.
The Kinect v1 contains an infrared emitter which projects infrared dots into the environment and
calculates the depth based on the distortion of the infrared dots. The Kinect v2 has a ToF camera
which projects infrared light into the environment and calculates the depth of the scene by measuring
the speed of the infrared light back and forth. In the study, a set of 300 depth images of the sameSensors 2019, 19, 1072 12 of 25
environment was captured with a camera. Both Kinects change their depths regarding the sensor
temperature. The mean depth of Kinect v1 decreases to less than 2 mm. The seen distance of Kinect
v2 increases to 20 millimeters after using it for 16 minutes. However, when its 5 V‐ DC fan (labeled
U40R05MS1A7‐57A07A [21]) turns on, it decreases to 3 mm and then increases slightly when the fan
starts to rotate with the same speed, so it is advisable to turn on the Kinect v2 16–20 minutes before
using it. When the distance increases, the Kinect v1 has less accuracy and precision when detecting
depth, with the offset increasing exponentially: at 0.5 m away from the sensor the offset is below 10
mm, but at 1.8 m away the offset can be more than 40 mm. With the increasing distance, a stripe
pattern appears on the depth image of the Kinect v1 sensor. The number of stripes also increases with
the distance. At different distances, the precision of the Kinect v2 decreases, but the accuracy stays
the same with a –18 mm offset where the central pixels are all the same, only the corner pixels could
be incorrect. If the plane is flat, the precision is higher for the Kinect v1. However, if the plane is not
flat or if there are discontinuities then the precision is less with the Kinect v2 and flying pixels could
appear. Flying pixels are not present with the Kinect v1 as it is not a ToF camera. Environment color
also affects depth estimation with the Kinect v2: black colors have 10 mm more depth value. Also,
multipath interference is present with the Kinect v2 which means that concave geometry is
represented with bulges.
A study of accuracy and precision was made by Gonzales‐Jorge et al. [100]. They measured an
artefact at multiple angles with both Kinect sensors. The angles were 45°, 90°, 135° but the angles did
not affect accuracy and precision as previously mentioned in a study when comparing the Kinect
sensor to the Xtion sensor. These angles were measured at multiple distances where 1 m was the
closest distance and 6 m was the largest. The Kinect v1 sensor can sense up to the range of 6 m while
the Kinect v2 sensor was only capable up to 4 m. Even though the range of Kinect v1 sensor is larger
than of the Kinect v2 sensor, it is less accurate. Aside from accuracy, the precision worsens with both
sensors as the range increases, but the precision differences are always less for the v2 sensor than for
the v1 sensor. Even at the range of 1m the precision of the Kinect v2 sensor is better compared to the
Kinect v1 sensor: the precision of the Kinect v1 decreases with the second order polynomial when
increasing the range. While no mathematical behavior was found for precision values for the Kinect
v2, it is possible to give similar results with an equation. The precision values are defined in Equation
(1) for the Kinect v1 and in Equation (2) for the Kinect v2:
yKinect1 = 2.0399Z2 – 2.016Z + 2.0957 (1)
yKinect2 = 0.5417Z2 – 0.885Z + 2.7083 (2)
According to Khoshelham et al. [101], the error of depth measurements with the Kinect v1 can
increase quadratically to 4 cm at the range of 5 m while the depth resolution decreases quadratically.
The Kinect v1 sensor also has a standard deviation of approximately 15 mm in its depth accuracy.
The conclusion is that depth measurements should be done between 1–3 m.
Similarly, the Kinect v2 was studied by Yang et al. [102] with the aim to improve its depth
accuracy. According to them, the average depth accuracy error is less than 2 mm until the user is 3 m
away from the device. Between 3 m and 4 m the average depth accuracy error is between 2 mm and
4 mm. If the user stands farther away from the sensor, the average depth accuracy error is more than
4 mm. This is only true of the user stands directly in front of the Kinect 2. If the user steps sideways,
then the average depth accuracy error increases.
Interestingly, despite the “actual minimum measuring distance”, Chan et al. [103] managed to
calculate the volumes of eggs at least 70 cm away from the Kinect v2 sensor, possibly due to their
size. They placed the Kinect v2 sensor in four different positions in multiple 45° angles facing the
eggs. Regarding the distance to the eggs, they found out that the best distance from the Kinect v2 is
between approximately 70–78 cm and 74 cm gives the best results. Regarding the positions, they
concluded that without shear parameters the deviation of volume estimation is between ±1.74 mL
and ±3.62 mL; and with shear parameters it is between ±0.05 mL and ±9.54 mL. Naturally, the
differences also depend on the size of the egg. In terms of accuracy, 84.75% was the worst they could
find and 97.86% was the best. The mean accuracy is 93.3% which can be considered good.Sensors 2019, 19, 1072 13 of 25
There is more conflicting information about the range of the Kinect v1 and v2. Kadambi et al.
[104] did a study on the specifications of the Kinects. However, they concluded that the depth of the
Kinect v1 can be 0.4–3.0 m or 0.8–4.0 m and the depth of the Kinect v2 can be 0.5–4.5 m depending on
environmental conditions, though these depth ranges have not been tested in the study. The data
collected from this and the previous studies can be seen in Table 6. There are three types of distances
in the table: the specified distances which are the ones mentioned in the previous study, the
recommended distances by the manufacturer and the tested distances which have been proved and
tested in previously mentioned studies.
Table 6. Kinect v1 compared to Kinect v2 with their technical specifications.
Kinect v1 Kinect v2
Dimensions 27.94 cm × 6.35 cm × 3.81 cm [105] 24.9 cm × 6.6 cm × 6.7 cm [106]
640 × 380 at 30 fps
Color resolution and fps 1920 × 1080 at 30 fps
or 1280 × 720 at 12 fps
IR resolution and fps 640 × 480 at 30 fps 512 × 424 at 30 fps
Depth resolution and fps 320 × 240 at 30 fps 512 × 424 at 30 fps
Field of view wide‐angle lens 57° horizontal, 43° vertical 70° horizontal, 60° vertical
Specified min. distance 0.4 m or 0.8 m 0.5 m
Recommended min. distance 1.8 m 1.4 m
Tested min. distance 1m 0.7 m
Specified max. distance 4m 4.5 m
Tested max. distance 6m 4m
Active infrared Not available Available
Measurement method Infrared structured light Time of Flight
Minimum latency 102 ms 20 ms
Microphone array 4 microphones, 16 kHz 4 microphones, 48 kHz
Tilt‐motor Available, ±27° [107] Not available
Temperature Weak correlation Strong correlation
More distance Less accuracy Same accuracy
Striped depth image Increases with depth No stripes on image
Depth precision Higher Less
Flying pixels Not present Present if surface is not flat
Environment color Depth estimation unaffected Affects depth estimation
Multipath interference Not present Present
Angles affect precision No No
Precision decreasing Second order polynomial No math. behavior
Bragança et al. performed a study [108] to see how precise the Kinect sensor is. For that purpose,
they developed a 3D scanner system which was arranged with four Kinect devices. They did manual
anthropometric measurements with a simple measuring tape and compared the results to their 3D
scanner system. Out of the four Kinects, two were placed in front of the volunteers and two were
placed behind them at the height of 50 cm and 140 cm, respectively. The Kinect sensors were 125 cm
away from the participants in each direction. The study had 37 participants of different age, height
and weight. When measuring the ten body parts, they used six different evaluation parameters. The
parameters were:
Technical Error of Measurement (TEM)
Relative Technical Error of Measurement (%TEM)
Intraclass Correlation Coefficient (ICC)
Reliability Coefficient (R)
Standard Error of Measurement (SEM)
Coefficient of Variation (CV)
While there were some small deviations in centimeters when comparing both methods, they
found out that the Kinect sensors is a viable solution for lower levels of precision. It should be noted,
that not only the hardware, but the software is equally important for precision. Their results areSensors 2019, 19, 1072 14 of 25
summarized in Table 7 alongside the results of Mankoff and Russo [109] who concluded that the
actual distance to an object is less than the distance that the Kinect sees.
Table 7. Comparison of Kinect measurements and manual measurements.
Kinect Manual Measurement
Precision Less precise More precise
Measuring speed Faster Slower
No. of best measurements Eight “best” results 12 “best” results
No. of worst measurements Six “worst” results Five “worst” results
Nearest measured distance 501 mm 500 mm
Farthest measured distance 5050 mm 5000 mm
Also, gesture recognition is possible with the depth sensor. Chikkanna and Guddetti [110] used
Hidden Conditional Random Field (HCRF) which learns a set of latent local variables. The variables
are conditioned on local features. In the study they developed an algorithm for Indian sign language
recognition with the Kinect v1 where they recorded 650 gestures beforehand. With HCRF 93.2% and
95.2% of the gestures were recognized in real‐time and not real‐time, respectively.
6.1.2. Skeleton Stream
The skeleton stream is available via the SDK made by Microsoft and it is a “software method”
to access depth data in real‐time. Both Kinects feature the skeleton stream, though there are small
differences. In Table 8 a brief comparison of the two skeleton streams can be seen.
Table 8. Skeleton stream comparison of both Kinect sensors.
Kinect v1 Kinect v2
Max. number of tracked people 2 6
Available joints to track 20 25
Tested distance 0.85–4 m 0.5–4.5 m
According to Livington et al. [111], the skeleton stream can be acquired with the Kinect v1’s SDK
between 0.85–4 m in contrast with the range recommended by Microsoft. Outside of these bounds
the sensor won’t return data. They also found out that when using the Kinect v1’s SDK, this also
applies to the depth data. This contrasts with the 6 m mentioned earlier in this review where the
researchers did not use the SDK. In their study, they measured the noise of the skeleton stream. At
1.2 m away from the sensor, the noise was 1.3 mm with a standard deviation of 0.75 mm and at 3.5
m away, the noise was 6.9 mm with a standard deviation of 5.6 mm. In the Kinect v1, the average
noise also changes from dimension to dimension: x = 4.11 mm, y = 6.2 mm and z = 8.1 mm. They also
found out that the right wrist and hand gave the most noise. Accuracy of the skeleton stream has
been tested as well, averaging at 5.6 mm with a standard deviation of 8.1 mm and no difference was
found when taking the dimensions into account. Another interesting fact is that when one person
uses the Kinect v1, the error in accuracy is 1.4 mm. In contrast, when two people uses the device, the
error increases to 1.8 mm. With three people, the error becomes 2.4 mm—even though the Kinect v1
is only able to track two people. The mean latency of with one skeleton is 146 ms and with two
skeletons is 234 ms but these data largely depend on the computer’s hardware configuration, and
other, simultaneously running applications.
Otte et al. [112] discovered that the range of skeleton steam via the Kinect v2’s SDK is between
0.5–4.5 m when researching its accuracy with young healthy adults. This range slightly larger than
the range with the Kinect v1’s SDK. In the study, the data from the Kinect v2 was not smoothed. They
concluded that the Kinect v2’s skeleton stream yields adequate results, however the sensor has a
harder time differentiating between the ground and the feet of the user.
In the study of Reither et al. [113] upper extremity movements, mainly of the shoulder joint were
measured using the skeleton streams of both versions of the Kinect and compared to a Video Motion
Capture (VMC) system. The data was filtered with a fourth order Butterworth filter at 6 Hz. BothSensors 2019, 19, 1072 15 of 25
Kinects had good reliability, though the Range of Motion (ROM) was underestimated by the Kinect
v1 for reaching type of movements and overestimated for angular movements. The Kinect v2
performed well for forward reaching type of movements, however its performance for the side
movements was not as good. Angular movements were overestimated by the Kinect v2. Even though
the ROMs measured by the Kinects were different from the VMC, both Kinects measured movement
patterns very well. Transformation of the Kinect’s skeleton data could make the data similar to VMC’s
data, allowing it to be used in medical applications.
Similarly to manual measurements in the previous subsection, the Kinect v1 was compared to a
magnetic tracking system and a goniometer by Huber et al. [114] where joint angles were tested. The
study included frontal and side views. The mean difference from the goniometer was between −4.1°
and 17.8° during the gestures, and the mean difference from the 3D magnetic tracker was between
−24.2° and 20.6°.They concluded that the Kinect is reliable when the shoulder joints are not occluded.
Elgendi et al. [115] made a study with ten subjects who all did three types of gestures: slow,
medium and fast. The gestures were done with a shift of 45° to the right make sure that the body does
not interfere with the hand movements. They used a low‐pass filter which is a first order Butterworth
low‐pass filter with a cutoff frequency of 2 Hz to reduce the environmental or bodily noise from the
skeleton stream. However, even without the low‐pass filter they concluded that the hand is the most
reliable for detecting speed with the lowest error rate of 9.33%. With the low‐pass filter, the lowest
error rate is 8%.
To increase the recognition with skeletal tracking the Extended Body‐Angles Algorithm (E‐BA‐
A) [116] were used in the study of Gutiérrez‐López‐Franca et al. in 2018 [117]. During the study they
found out that the number of the used joints in the body during measurements affects the number of
errors. Their measurements included:
Global movements—where the whole body is used
Bounded movements—where the movement only use a subset of the whole body
Symmetric movements—where it is enough to measure “one half” of the body
According to them, global movements produce less error, however requires more computational
power. Bounded movements have more errors, since the position of neighboring joints can affect the
joints next to them. When using this method, it required less computational power than global
movements. The results of the study were:
With the “Specialized Body Parts Analysis” method: They used three different strategies with
tree different bounds to calculate the exact rate of correct movement prediction with four
different movements, two of which can be done with each half of the body. Using only the arms
or legs gave the worst results with a 52.45% as it could not track the legs almost every instance,
using the whole body gave better results with a 92.42% and interestingly when using only the
arms or legs with the trunk gave the best results with 97.37%.
With the “Stricker Restrictions for the Most Easily Detectable Activities” method: This method
tries to improve on the postural coincidences where movements are similar and sometimes
inferred by other joints. To improve on this, some restrictions had to be applied by introducing
a barrier value, a minimum limit of prediction which also had to be tested multiple times to see
if they are too strict. After selecting the values which are sufficient for them, they concluded that
the arm movements got good results with a 92% and 93.6% accuracy, and the leg movements
got 22.4% and 24.8% respectively which are great improvements to the first method.
With the “Combination of Body Parts and Stricter Limits” method: This method is the
combination of the two. This method gives the best results, and they can be achieved by using
only the arms or legs with the trunk. It has a 96%–100% accuracy rate for the arm movements
and 92.8%–96% for the leg movements.
6.2. Leap Motion Controller
When the LMC was in its preliminary stage, in 2013 a study by Weichert et al. [118] was made
to assess its accuracy with the aim to increase its effectiveness in HCI. To achieve the best result, theSensors 2019, 19, 1072 16 of 25
study was done with an industrial robot with a position error below 0.2 mm. They concluded that an
accuracy of less than 2.5 mm is possible, averaging around 1.2 mm. The standard deviation was below
0.7 mm per axis when moving. For example, when drawing a sine wave, the standard deviation was
below 0.7 mm on the x‐axis, below 0.5 mm on the y‐axis and below 0.3 mm on the z‐axis. Therefore,
in cases when the motion path is important, the LMC should be used as according to them, this could
not be achieved with the Kinect sensor as it is not as accurate. In another study, when comparing the
LMC to the Optotrak marker, they concluded that the position error of the accuracy was below
17.30mm which is much worse [94]. It is possible that this error is due to it being from human data in
contrast to the data from the industrial robot. However, the official specification of the LMC states
that its accuracy is ± 0.009906 mm [119].
In 2014, another study [120] was made to assess the LMC’s accuracy for static and dynamic
tracking. A plastic arm was used in the study. With static tracking, the standard deviation was always
below 0.5 mm. In some cases it even reached less than 0.01 mm. With dynamic tracking however, the
LMC has an inconsistent performance: The accuracy significantly drops by −5 mm when the user is
more than 250 mm away from the sensor on the x‐z plane. In the study they also concluded that the
inconsistent sampling frequency makes it difficult to synchronize with other devices.
The speed of the Dynamic Time Warping method was tested. Vikram et al. [121] proposed a new
method of handwriting: With the LMC, they tracked the fingers of the user to simulate writing of
text. To look for similarities, Dynamic Time Warping (DTW) method was used, after optimizing it
for real‐time and after building a dataset of letters with 26,000 recordings and words with 3000
recordings. In the study, they found a handwritten word “new” with DTW in 1.02 seconds.
In 2015, Sharma et al. [122] proposed a method for number recognition: The user moves their
hand in front of the LMC and based on the form of the gesture, a number is created by the application.
Before testing, they taught five sample gestures per number. They achieved an average classification
rate of 70.2% with the Geometric Template Matching Algorithm. Two years later, another method
was proposed by Zeng et al. [123] which uses deterministic learning with twofold and tenfold
validation cycles. Their number recognition rates were 94.2% and 95.1%, respectively, with the two
cycles.
In 2016, Jin et al. proposed a method [124] for two LMC devices with the aim manipulate objects
on a table with a robotic hand. They use two LMC devices because according to them, the LMC is
best in high precision mode when the palm of the hand rotates less than 60°. Over the said number,
the gesture is susceptible to occlusion. During the study they used three different setups for the two
LMC devices. A face‐to‐face setup, an orthogonal setup and a 120° angle setup:
Face‐to‐face: It helps when the palm does a 180° rotation. 90° is still susceptible to occlusion.
Orthogonal: It helps with a 90° rotation. In this setup, the 180° rotation is susceptible to occlusion.
120° angle: This setup was considered the best—and mainly used—in the study. If the palm is
under 180° it provides the best results, otherwise both sensors have a worse recognition
performance.
According to the study, the bottom sensors gave the worst results with every tested gesture.
When the palm faced upwards the results could be as low as 6.7%. In contrast, with the side sensor
the lowest result was 63.3% for the same gesture. When using both sensors the lowest result was
73.3%. Side movements were considered the best, 63.3%, 86.7%, 90% using the bottom, side and both
sensors respectively.
Also, in 2016, a dynamic hand gesture recognition method was developed [125]. In the study
they used two different datasets with the Hidden Conditional Neural Field (HCNF) classifier to
recognize gestures. The HCNF is the extension of the HCRF classifier with gate functions of neural
networks. During the study, one dataset produced an accuracy of 89.5% and the other 95%.
In 2017, Li et al. [126] reported a hand gesture recognition algorithm for post‐stroke
rehabilitation. This algorithm has a training phase and a test phase. It uses the Support Vector
Machine mathematical method and the K‐Nearest Neighbors classifier. With the former the
algorithm achieved an average accuracy of 97.29% and with the latter it achieved 97.71%.You can also read