SUPPLEMENTARY MATERIAL FOR - GENOMICS AND EPIDEMIOLOGY OF THE P.1 SARS-COV-2 LINEAGE IN MANAUS, BRAZIL - SCIENCE
←
→
Page content transcription
If your browser does not render page correctly, please read the page content below
science.sciencemag.org/cgi/content/full/science.abh2644/DC1

 Supplementary Material for
Genomics and epidemiology of the P.1 SARS-CoV-2 lineage in Manaus,
 Brazil

 Nuno R. Faria*, Thomas A. Mellan, Charles Whittaker, Ingra M. Claro, Darlan da S.
 Candido, Swapnil Mishra, Myuki A. E. Crispim, Flavia C. S. Sales, Iwona Hawryluk,
 John T. McCrone, Ruben J. G. Hulswit, Lucas A. M. Franco, Mariana S. Ramundo,
 Jaqueline G. de Jesus, Pamela S. Andrade, Thais M. Coletti, Giulia M. Ferreira, Camila
 A. M. Silva, Erika R. Manuli, Rafael H. M. Pereira, Pedro S. Peixoto, Moritz U. G.
 Kraemer, Nelson Gaburo Jr, Cecilia da C. Camilo, Henrique Hoeltgebaum, William M.
 Souza, Esmenia C. Rocha, Leandro M. de Souza, Mariana C. de Pinho, Leonardo J. T
Araujo, Frederico S. V. Malta, Aline B. de Lima, Joice do P. Silva, Danielle A. G. Zauli,
 Alessandro C. de S. Ferreira, Ricardo P Schnekenberg, Daniel J. Laydon, Patrick G. T.
 Walker, Hannah M. Schlüter, Ana L. P. dos Santos, Maria S. Vidal, Valentina S. Del
 Caro, Rosinaldo M. F. Filho, Helem M. dos Santos, Renato S. Aguiar, José L. Proença-
 Modena, Bruce Nelson, James A. Hay, Mélodie Monod, Xenia Miscouridou, Helen
Coupland, Raphael Sonabend, Michaela Vollmer, Axel Gandy, Carlos A. Prete Jr., Vitor
 H. Nascimento, Marc A. Suchard, Thomas A. Bowden, Sergei L. K. Pond, Chieh-Hsi
 Wu, Oliver Ratmann, Neil M. Ferguson, Christopher Dye, Nick J. Loman, Philippe
Lemey, Andrew Rambaut, Nelson A. Fraiji, Maria do P. S. S. Carvalho, Oliver G. Pybus,
 Seth Flaxman, Samir Bhatt*, Ester C. Sabino*
 *Corresponding author. Email: n.faria@imperial.ac.uk (N.R.F.); samir.bhatt@sund.ku.dk (S.B.);
 sabinoec@usp.br (E.S.C.)

 Published 14 April 2021 as Science First Release
 DOI: 10.1126/science.abh2644

This PDF file includes:

 Materials and Methods
 Supplementary Text
 Figs. S1 to S16
 Tables S1 to S10
 References

Other Supplementary Material for this manuscript includes the following:
(available at science.sciencemag.org/content/science.abh2644/DC1)

 MDAR Reproducibility Checklist
 Data Files S1 to S6 as separate .csv files
Materials and Methods
Ethics
 Residual oropharyngeal and nasal swab collections from Manaus residents testing
positive for SARS-CoV-2 RT-qPCR between 1 November 2020 and 9 January 2021 were
obtained from two private clinical laboratories in Manaus. Metadata associated with positive
SARS-CoV-2 RT-qPCR results in Manaus residents testing between 1 July 2020 and 15
January 2021 were obtained from a third private clinical laboratory in Manaus. All samples
were de-identified before receipt by the researchers. Ethical approval for this study was
confirmed by the national ethical review board (Comissão Nacional de Ética em Pesquisa),
protocol number CAAE 30127020.0.0000.0068.

Sampling and Metadata Collection
 A total of 436 SARS-CoV-2 samples RT-qPCR confirmed or suspected were collected
for genomic sequencing between 1 November 2020 and 9 January 2021. Samples were
provided for confirmatory testing and genome sequencing. For clinical laboratory A (n=37
RT-qPCR positive cases with sampling dates from 15 to 23 December 2020), SARS-CoV-2
diagnosis was performed using the Allplex 2019-nCoV Assay (Seegene, South Korea) assay
that detects the RNA-dependent RNA polymerase (RdRP), nucleocapsid (N) specific genes
for SARS-CoV-2 and the E gene for all Sarbecovirus subgenus, including SARS-CoV-2 (70,
71). For clinical laboratory B, 399 RT-qPCR positive or suspected cases [representing 73%
of all 548 samples with a RT-qPCR positive (n=545) or inconclusive (n=3) results between 2
November and 9 January 2021] were processed for genome sequencing. In this case, RT-
qPCR was determined using the Xpert Xpress SARS-CoV-2 platform (GeneXpert) that
detects the N viral target specific for SARS-CoV-2 and the E viral target of Sarbecovirus
subgenus including SARS-CoV-2 (Cepheid, USA). Samples were shipped in dry ice to the
Institute of Tropical Medicine, University of São Paulo, Brazil, for genome sequencing. RT-
qPCR cycle threshold values and associated metadata (patient age and sex, date of onset
symptom, date of RT-qPCR test, data of sample collection when available, cycle threshold,
Ct, values for E and N viral targets) were recorded for 1,084 RT-qPCR positive and 16
inconclusive results from laboratory B in Manaus between 18 May 2020 and 27 January 2021
(Data S1). Line-list metadata (patient age and sex, date sampling collection, cycle threshold
values) from a third clinical in Manaus (laboratory C) was obtained for RT-qPCR positive
samples tested using the TaqPath COVD-19 Combo kit (ThermoFisher-Applied Biosystems,
United Kingdom) that detects the N, S, and ORF1ab viral targets (Data S3).

PCR Amplification and Virus Nanopore Sequencing
 Viral RNA was isolated from 200-μl SARS-CoV-2-suspected samples using the QIAamp
Viral RNA Mini kit (QIAGEN, Hilden, Germany) according to the manufacturer’s
instructions. Virus genome sequencing was carried out on all positive samples regardless of
laboratory reported RT-qPCR cycle threshold values using a combination of targeted
multiplex-PCR amplification and portable nanopore sequencing MinION platform (Oxford
Nanopore Technologies, ONT, UK).
 cDNA synthesis was performed from the extracted RNA using random hexamers, and
the Protoscript II First Strand cDNA synthesis Kit (New England Biolabs, UK).
Subsequently, the ARTIC network SARS-CoV-2 V3 primer scheme and Q5 High-Fidelity
DNA polymerase (New England Biolabs, UK) were used for SARS-CoV-2 whole-genome
multiplex-PCR amplification (24). AmpureXP beads (Beckman Coulter, United Kingdom)
were used for PCR product purification and fluorimetry-based quantification was carried out
using the Qubit dsDNA High Sensitivity assay on the Qubit 3.0 (Life Technologies, USA).
To ensure uniform sequencing of samples, equimolar normalisation of 10 ng per sample was
performed followed by barcoding using the EXP-NBD104 (1–12) and EXP-NBD114 (13–24)
Native Barcoding Kits (Oxford Nanopore Technologies, UK). Finally, barcoded samples
were pooled followed by library preparation using the SQK-LSK109 Kit (Oxford Nanopore
Technologies, UK).
 Nanopore sequencing libraries were loaded onto an R9.4.1 flow-cell (Oxford Nanopore
Technologies, UK) and sequenced using MinKNOW version 20.10.3 (Oxford Nanopore
Technologies, UK). FAST5 files containing the raw signal data were basecalled,
demultiplexed, and trimmed using Guppy v4.4.1 (Oxford Nanopore Technologies, UK). The
process reads were aligned against the reference genome Wuhan-Hu-1 (GenBank:
MN908947.3) using minimap2 v2.17.r941 and converted to a sorted BAM file using
SAMtools (72). Length filtering, quality test and primmer trimming was performed for each
barcode using artic guppyplex and variant calling and consensus sequences using artic minion
with Nanopolish and Medaka versions from ARTIC bioinformatics pipeline (
https://github.com/artic-network/fieldbioinformatics). Genome regions with a depth of 25% virus genome coverage (37 from laboratory A
and 147 from laboratory B) and was used to estimate virus lineage frequency in Manaus over
time; dataset B included 143 near-complete genome sequences with >75% of the virus
genome coverage (31 from laboratory A, 112 from laboratory B); and dataset C included 48
sequences with >95% of the virus genome complete (n=17 from laboratory A, n=31 from
laboratory B).
 For datasets A, B and C, a reference genome sequence Wuhan-Hu-1 (GenBank:
MN908947.3) was appended before multiple sequence alignment using MAFFTv.7 (74). For
dataset A, lineage classification was conducted using manual phylogenetic analysis.
Sequences with genome coverage between 25% and 75% were appended to dataset C and
assigned to B.1.1.28, P.2 and P.1 lineages based on monophyletic clustering of each sequence
within each of these lineages (fig. S2). Manual phylogenetic subtyping and PANGO lineage
classification using the latest pangolin version (v.2.2.1, 6 February 2021) (26;
http://pangolin.cog-uk.io/) was conducted for dataset B and dataset C (figs. S3-S5). Date of
sample collection, age, sex, RT-qPCR CT values, lineage assignment and sequencing
statistics for 184 sequences generated in this study from Manaus can be found in Data S2.
We downloaded all sequences publicly available in GISAID (up to 14-01-2021) and
selected for analysis those that were published in PubMed, MedRxiv, BioRxiv or Preprint
repositories. Specifically, dataset B and dataset C from Manaus were appended to (i) B1.1.28
genome sequences with >95% virus genome coverage from the Brazilian Amazon (75),
Minas Gerais (76), Pernambuco (77), Rio de Janeiro (78,79), Rio Grande do Sul (80) and to
data from an early country-wide study of SARS-CoV-2 diversity in Brazil (19). Datasets B
and C were also appended to (ii) P.2 genome sequences with >95% virus genome coverage
from Rio de Janeiro (79), Rio Grande do Sul (80, 81). Exceptionally, written permission was
obtained from the reference laboratory in São Paulo, Institute Adolfo Lutz, to use P.1
complete genome sequences shared in GISAID (up to 19-01-2021) as part of their
surveillance activities. Duplicate sequences were removed from the alignments, 5’ and 3’
untranslated regions from each genome were discarded. Sequence CD1721
(EPI_ISL_1060918) was identified as potential mixed infection (Fig. S15) and removed from
phylogenetic analysis. A table describing GISAID IDs, authors, originating and submitting
laboratory for all publicly available data used in dataset B’ and dataset C’ (with data from
this study and publicly available data) can be found in Data S4.

Maximum Likelihood Tree Reconstruction
 Fast and efficient maximum likelihood (ML) phylogenetic trees were reconstructed using
IQTREE 2 (82) for dataset A’ (n=988) (used for lineage classification of >25 and
Local clock models allow different rates along distinct lineages of a single phylogeny (32),
which may be particularly suitable to estimate dates of emergence of P.1 and P.2 because
they can take into account higher rates of mutation accumulation over short periods of time
that could to be linked to selective pressures associated with the emergence of lineages of
concern (13). Five independent analyses were performed using a flexible non-parametric
skygrid tree prior (33) for 200 million MCMC steps using BEAST version 1.10.4 (87) with
BEAGLE library v3.1.0 for accelerated likelihood evaluation (88). Parameters and trees were
sampled every 25,000 steps and convergence of MCMC chains was inspected with Tracer
v1.7.1 (89). Posterior probability distributions for the most recent common ancestor of the
P.1 and P.2 clade are shown in fig. S9.
 We also used a nested coalescent model (90) to estimate viral growth rates for B.1.1.28,
P.1 and P.2. We fit a constant demographic model to the phylogeny excluding the P.1 and P.2
clades. Two separate logistic growth models were then fitted to P.1 and P.2 clades. For the
logistic growth coalescent models, a lognormal prior with mean 1.0 and a standard deviation
of 10.0 were used for the population size; for the growth rate, we used a Laplace prior with a
mean of 0 and a scale of 10. For the local clock model, we use a normal prior with mean -7.0
and standard deviation of 5.0 on the background rate in log space and a normal prior with
mean 0 and standard deviation of 0.5 for the log effect sizes on the branches for which the
rates are allowed to deviate from the background rate (91). All other priors used for
phylogenetic inference were kept at default settings. Posterior probability distributions for the
most recent common ancestor of the P.1 and P.2 clade according to the constant-logistic-
logistic model and corresponding growth rate and doubling time parameters are show as fig.
S9 and fig. S10.
 To quantify the support for both the rate differences in the local clock model and the
growth rates in the nested coalescent model, we conduct Bayes Factor (BF) tests. For this
purpose, we employ posterior indicator functions that allow estimating the posterior
probability that a specific substitution rate (the rate on the branch ancestral to P.1 or P.2) is
larger than another rate (the background rate for B.1.1.28) and that one growth rate (for P.1)
is larger than another growth rate (for P.2). We use these posterior probabilities to calculate
the BF as the ratio of the posterior odds over the prior odds that substitution rates or growth
rates are different, assuming that the prior probabilities for these differences are 0.5 (in line
with our prior specification on these parameters).

Adaptive Evolution of P.1 lineage
 We investigated the extent of selective forces acting on P.1 and P.2 SARS -CoV-2
lineages using HyPhy v2.5.27 (48). We analyzed a median of 5 unique P.1 haplotypes per
gene/peptide in the context of a median of 79 reference sequences, and a median of 9
unique P.2 haplotypes per gene/peptide in the context of a median of 70 reference
sequences. The summary of P.1 lineage-defining sites subject to episodic diversifying
selection (p≤0.05) identified using MEME (92) is shown in table S1. In addition to
individual sites under selection, we also recorded instances of putative convergence, i.e.,
substitutions to the same amino-acid at the same site in both lineages; there were only 2
such events (S/484K and ORF1A/318L). The evolutionary “credibility” of target
residues was estimated using the PRIME method (92) based on a bat/pangolin
Sarbecovirus alignment (93) and results can be visualized at
https://hackmd.io/7hFvRdJdSVSONv_wW40_Rg.

Structural Analysis of P.1 lineage
 Lineage defining mutations were mapped onto a previously reported cryoEM structure of
the cleaved trimeric SARS-CoV-2 S ectodomain [PDB: 6ZGI, (94)] with PyMOL v 2.4.0
(95) (fig. S14). Substituted residues are indicated as spheres and coloured by type of selection
according to MEME support table S1). Similarly, SARS-CoV-2 S RBD-hACE2 contact
residues were mapped as observed in the RBD-hACE2 complex crystal structure [PDB:
6MOJ, (11)] together with RBD-resident substitutions specific to the P.1 lineage (fig. S14).
N-linked glycans are omitted for clarity.

Air Travel and Mobile Geolocation Data
 To better contextualize the spread of P.1 lineage within Brazil, we investigate two
different mobility data sources. First, we analysed monthly air passenger travel data produced
by Brazil’s Civil Aviation Agency (ANAC) which is publicly available at
https://www.anac.gov.br/assuntos/setorregulado/empresas/envio-de-informacoes/base-de-
dados-estatisticos-do-transporte-aereo. This includes the number of passengers and
connections for international flights to and from Brazil, as well as domestic flights within the
country. Using this data, we calculated the total number of passengers who travelled from
Manaus between November and December 2020 disaggregated by state of origin and
destination (Fig. 1D, fig. S10).
 State-level mobility where the origin of the trip was the municipality of Manaus were
calculated from approximately 5 million trips aggregated from anonymized cell phone data
users in the month of November 2020 (96) (fig. S10). Data was obtained from In Loco
(mapabrasileirodacovid.inloco.com.br), a company that provides geolocation services for a
broad range of mobile applications and covers ~20% of the mobile devices in the country.
Anonymized cell-phone shows a similar pattern to air travel data but shows travel from
Manaus to other municipalities in the Amazonas states being even more important than with
flights. Numbers of recorded state-level movements from and to Amazonas state, as well as
city-level movements from and to Manaus municipality, are available as Data S5 and Data
S6, respectively.

Logistic Function Fitting to P.1 Genome Fraction
 We fitted a logistic function to the time-varying fraction of sequenced genomes
belonging to P.1 from a single laboratory (laboratory B), binned according to the week
sampling had occurred in. The form of the logistic function is as follows:

 ( ) = (1)
 1 + − ( − 2)+

where = maximum value of the logistic function, = logistic growth rate, = time since
P.1’s emergence, 2 is the (inferred) time at which half of the genomes in sequenced cases
belong to P.1 and is independently and identically distributed gaussian noise added to
account for overdispersion. Model fitting was carried out using a Bayesian framework,
written in the probabilistic programming language STAN and implemented in the statistical
software R (Version 4.0.2) using the package rStan (Version 2.19.03). Three chains of 5000
iterations each were run, with the 1st 2500 samples from each discarded as burn-in and the
remaining 2500 (for each chain, 7500 samples total) retained for inference.
 We note that the proportion of P.1 cases used for epidemiological modelling was derived
from clinical samples obtained from a single laboratory which used the same RT-PCR assay
over the course of the pandemic, as well as consistent methods of specimen collection,
handling of sample and test interpretation. We also note that sequencing was attempted in all
clinical samples regardless of cycle threshold values to ensure further minimal impact in
selection biases when assessing proportion of P.1 cases during the study period. Nevertheless,
we cannot exclude the possibility that the representativity of samples used here might have
changed through time as no random population surveillance was being attempted during the
study period under investigation.

Description of the Epidemiological Model
 We utilised a Bayesian semi-mechanistic model of SARS-CoV-2 spread and mortality
based on a renewal-process equation (40, 41, 97) and extended to include i) multiple SARS-
CoV-2 lineages introduced at different points in time; ii) the possibility for these different
lineages to possess distinct epidemiological characteristics (such as severity, transmissibility
and immune evasion); and iii) waning of natural immunity due to prior infection -
parameterised from the results of the recent Public Health England SIREN study - a
longitudinal cohort study tracking (re)infection in healthcare workers in the United Kingdom
(43).
 Here, we modeled two different SARS-CoV-2 lineages, hereafter referred to as P.1 and
non-P.1, with the timing of P.1’s emergence based on the phylogenetic analyses described
previously. A full mathematical description of the model and its associated parameters are
available in Supplementary Text. We ran a number of model scenarios in order to evaluate
support for P.1 possessing distinct epidemiological characteristics, specifically running
multiple models that varied in their assumption surrounding timing of P.1 emergence.
 Estimates of tMRCA are built from genetic sequence data that is not population
representative, but rather are estimated based on a limited subset of sequences and therefore
are expected to suffer from systematic biases. For this reason, it is important to note that
tMRCA and the date of first infection are, in general, not necessarily expected to be exactly
the same and we would expect the date of first infection to be before tMRCA. For the results
of the epidemiological modelling presented in the main text we assume the mean estimate of
tMRCA (9th November 2020) and the date of first infection are the same. We acknowledge
that this assumption is likely to change given more representative data. To address these
limitations, we have conducted a comprehensive sensitivity analysis (summarised in table
S5) where we vary tMRCA to cover the entire 95% BCI of the estimated tMRCA
distribution. This sensitivity analysis showed that our main conclusions around altered
epidemiological characteristics were robust to assumptions regarding the timing of P.1
emergence.
 We also varied our assumptions surrounding the duration of protective immunity
following infection (i.e. the rate at which natural immunity elicited by prior SARS-CoV-2
infection declines).
 The model was fitted to two sources of data. Mortality data from the SIVEP-Gripe
(Sistema de Informação de Vigilância Epidemiológica da Gripe ) SARI (severe acute
respiratory infections) hospitalisation database (67, 69), including both class 4 and 5 death
records (corresponding to confirmed and suspected COVID-19 deaths), consistent with
earlier analyses (2) and corrected for known delays in mortality reporting using a Gaussian
process nowcasting based framework (44, 45). In addition to COVID-19 mortality data, we
also integrate genomic data from the sequenced samples, fitting the model to the fraction of
sequenced genomes each week that belong to P.1 described in table S4.
 Model fitting was carried out using a Bayesian framework, written in the probabilistic
programming language STAN and implemented in the statistical software R (Version 4.0.2)
using the package rStan (Version 2.19.03). Hamiltonian Monte Carlo with 3 chains of 1000
iterations each were ran, with half the samples discarded as burnin and the remaining retained
for inference. In every instance chains mixing was satisfactory, with traditional rhat statistics
(for assessing convergence) less than 1.02. All code used for inference and plotting is
available at https://github.com/CADDE-CENTRE.
Data sharing and code availability
 Preliminary genome sequences generated from samples obtained from laboratory A were
shared on GISAID on 12 January 2021. Findings were shared with representatives from the
World Health Organization, Pan American Health Organization, Secretary of Health
Amazonas, and FioCruz Manaus on 11 January 2021. Preliminary report describing first P.1
genomes from Manaus was shared on 12 January 2021 (27). Epidemiological data and
epidemiological model code, together with BEAST XML files, tree files, log files are
archived at https://github.com/CADDE-CENTRE and Zenodo (DOI:
https://zenodo.org/record/4676853). GISAID IDs for the SARS-CoV-2 Manaus sequences
(>50% virus genome coverage) can be found in Data S1. All consensus sequences generated
by this study can be found at https://github.com/CADDE-CENTRE.
Supplementary Text
Epidemiological Model
 This work builds on a previously published mathematical model of SARS-CoV-2
transmission introduced in Flaxman et al, 2020 (41). Specifically, we extend this semi-
mechanistic Bayesian model to include multiple SARS-CoV-2 strains and the possibility for
these strains to possess distinct, strain-specific epidemiological characteristics (such as
transmissibility, ability to evade prior immunity, and severity of COVID-19 disease elicited).
 Although any number of strains are possible within a framework of this type, we
consider only two strains here, defined as ∈ {1,2}. For strain 1, the population-unadjusted
reproduction number is defined as follows:

 =1, = 0 2 ( ) (2)

where 0 is a scale parameter (3.3), is a logistic function, and is a second-order
autoregressive process with weekly time innovations, as specified in earlier work (40). The
population-unadjusted reproduction number of the second strain is modelled as:

 =2, = [ 2 ,∞) 1, (3)
 ∼ Normal (1,1) ∈ [0, ∞) (4)

where is a parameter defining the relative transmissibility of strain 2 compared to strain 1,
and [ 2 ,∞) is an indicator function taking the value of 0 prior to 2 , and 1 thereafter,
highlighting that strain 2 does not contribute to the observed evolution of the epidemic before
its emergence. Introduction of the second strain at time 2 is informed through our local
molecular clock analysis (see Fig. 2, fig. S9). We note that the reproduction number estimates
take into account the effect of population-level immunity and behavioural changes (modelled
using a latent stochastic process). For the purposes of the primary results presented in the
main text, it is assumed 2 = 9 Nov 2020, though four additional scenarios are presented
varying the assumed date of P.1 emergence (see table S5). As in earlier models (41), we
make the assumption of a homogeneously mixed population, and therefore ignore
heterogeneites in transmission. This is an important area for future research.
 Infections arise for each strain according to a discrete renewal process (98, 99):

 ,
 , = (1 − ) , ∑ , − (5)
 2, 2 ∼ Normal(1,1) ∈ [1, ∞) (8)

The susceptible depletion term for strain is modelled as:

 , = ∑ , − + (1 − , ) ∑ ∖ , − (9)
 = ∑ ifr ∑ , −
 ∈{1,2}
̃ , = ∑ , − ≤ to account for the time varying PCR positivity displayed over the natural course of a COVID- 19 infection. The distribution describes the probability of being PCR positive over time following infection, and is based on ref. (101). Serological data is not explicitly used in our modelling framework but rather is used for external validation of the model outputs. For purposes of comparison with previously published, and independent, serological data, we also calculate: ∑ , − (21) ≤ where − is the cumulative probability of an individual infected on day τ having seroconverted by time . This distribution is empirical and based on ref. (32).
Figure S1.
Number of genome sequences from Manaus grouped by sequence coverage and study (see
also Materials and Methods).
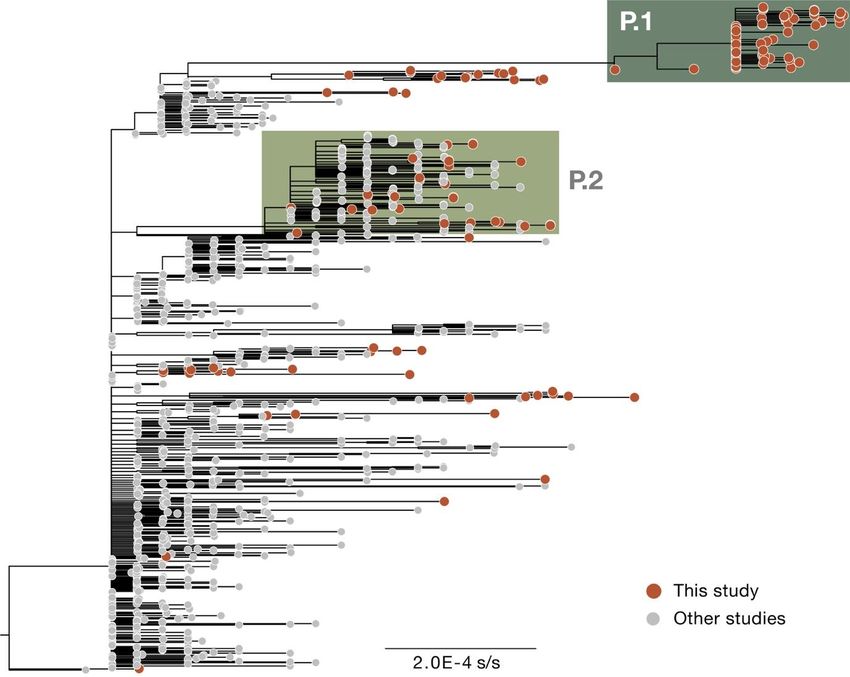
Figure S2.
Maximum likelihood tree estimated for dataset A’ (n=988). This dataset was used to confirm
lineage assignment for all sequences generated in this study regardless of genome coverage
(see also fig. S1). s/s=nucleotide substitutions per site.
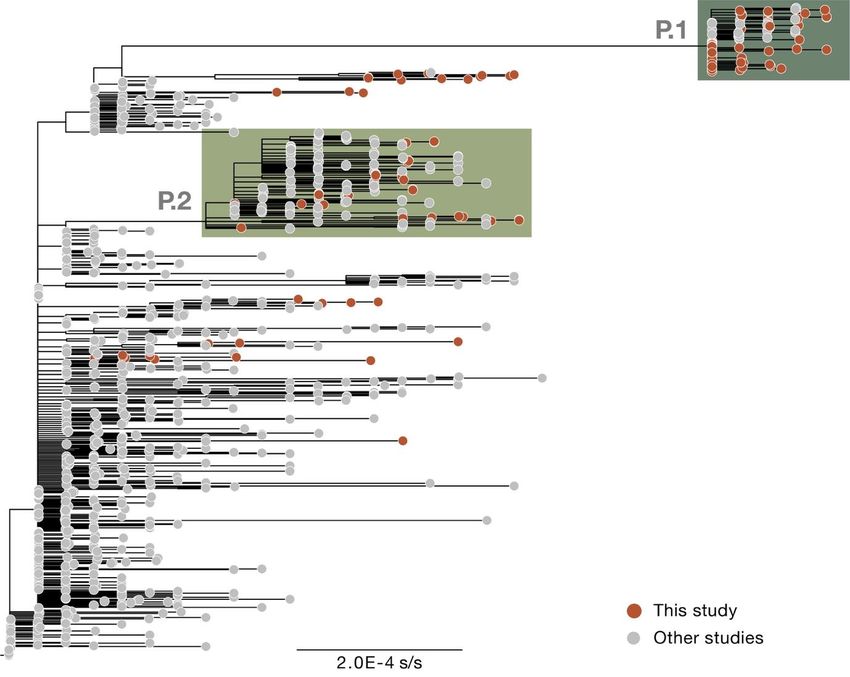
Figure S3.
Maximum likelihood tree estimated for dataset B’ (n=962). s/s=nucleotide substitutions per
site. This phylogeny includes only publicly available and published sequences classified as
B.1.1.28, P.1 and P.2 lineages.
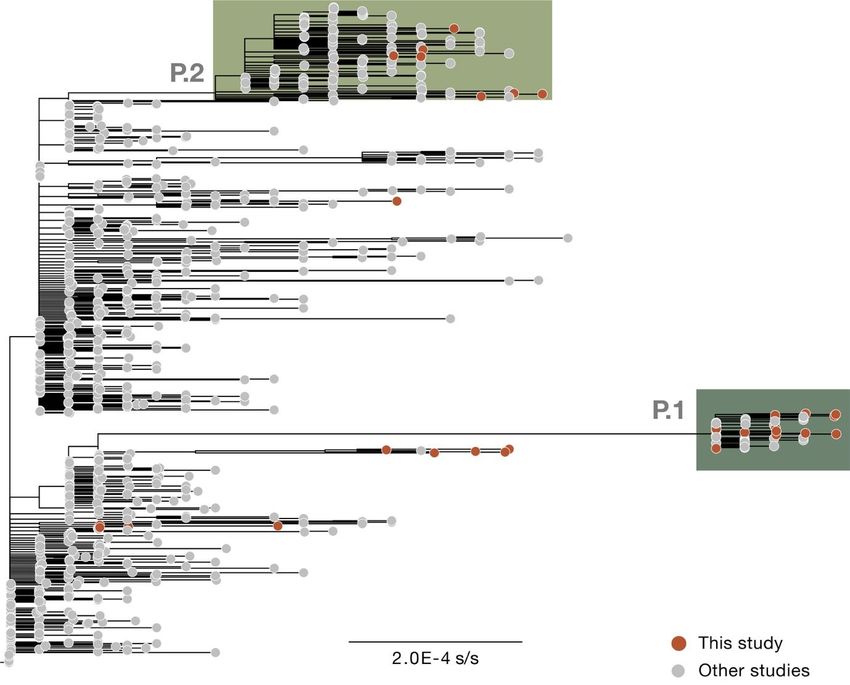
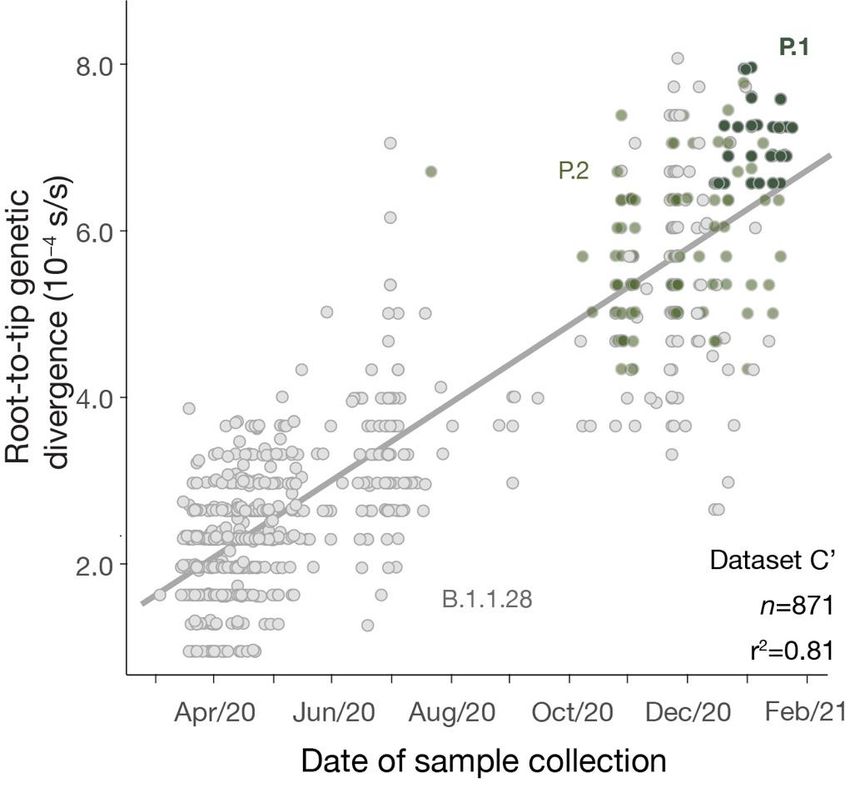
Figure S4.
Maximum likelihood tree estimated for dataset C’ (n=871). s/s=nucleotide substitutions per
site. This phylogeny includes only publicly available and published sequences classified as
B.1.1.28, P.1 and P.2 lineages.
Figure S5.
Pango lineages identified in Manaus among our 184 sequences samples and publicly
available genomes in GISAID between 24 March and 10 November 2020 (left panel) and
between 11 November and 15 January 2020 (right panel). Duplicate sequences and sequences
with no date or location of sample collection were removed. Coloured bars correspond to
lineages that represent >10% of sequenced samples during each time period.
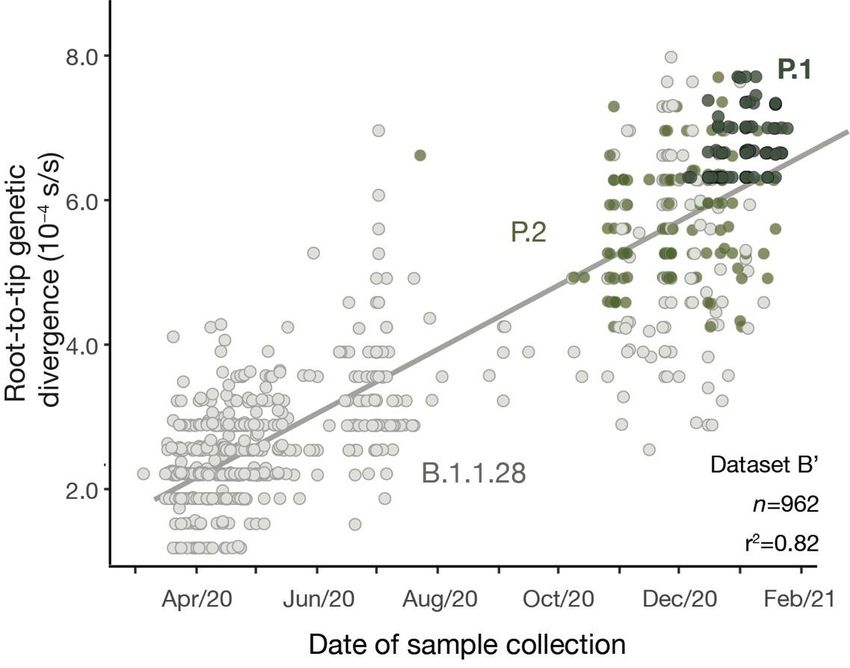
Figure S6.
Regression of root-to-tip genetic distances and sampling dates for dataset B’ estimated using
TempEst v.1.5.3 (29). Circles corresponds to the tips of the maximum likelihood
phylogenetic tree show in fig. S3.
Figure S7.
Regression of root-to-tip genetic distances and sampling dates for dataset C’ estimated using
TempEst v.1.5.3 (29). Circles corresponds to the tips of the maximum likelihood
phylogenetic tree show in fig. S4.
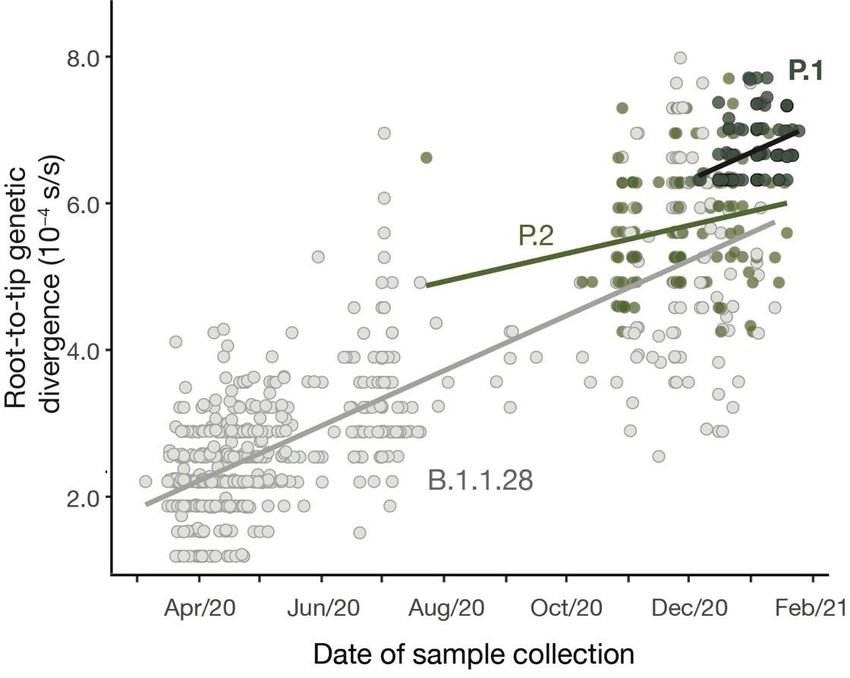
Figure S8.
Regression of root-to-tip genetic distances and sampling dates for dataset B’ estimated using
TempEst v.1.5.3 (29), with separate regression lines for B.1.1.28 and P.1 lineages computed
in R v 3.6.2 (84). Circles corresponds to the tips of the maximum likelihood phylogenetic tree
show in fig. S3.
Figure S9.
Posterior estimates of the time of the most recent common ancestor of P.1 (dark green) and
P.2 (light green) lineages estimated using a flexible non-parametric skygrid coalescent model
(33). Dashed lines show the posterior estimates for the same evolutionary parameters but
estimated using a constant-logistic-logistic model (see Materials and Methods for details).
Both coalescent models are implemented in BEAST v.1.10 (87).
Figure S10.
Number of movements from Manaus to federal units in Brazil obtained from ANAC flight
data (A and B) and from anonymized cell phone data (C and D). X-axis of panels B and D are
shown in log10 units. The ISO 3166-2:BR codes of the states AC–Acre, AL–Alagoas, AP–
Amapá, AM–Amazonas, BA–Bahia, CE–Ceará, DF–Distrito Federal, ES–Espírito Santo,
GO–Goiás, MA–Maranhão, MT–Mato Grosso, MS–Mato Grosso do Sul, MG–Minas Gerais,
PA–Pará, PB–Paraíba, PR–Paraná, PE–Pernambuco, PI–Piauí, RJ–Rio de Janeiro, RN–Rio
Grande do Norte, RS–Rio Grande do Sul, RO–Rondônia, RR–Roraima, SC–Santa Catarina,
SP–São Paulo, SE–Sergipe, TO–Tocantins.
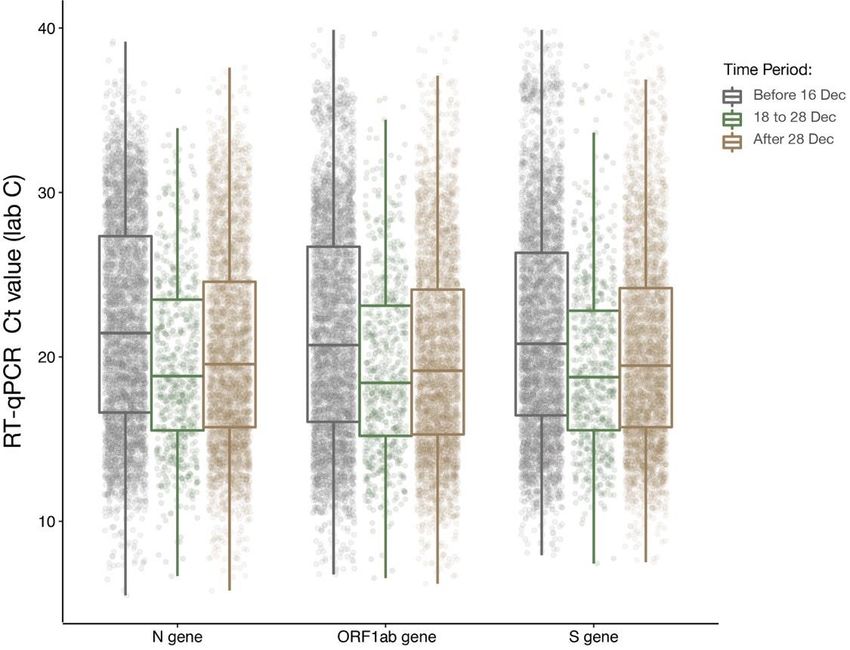
Figure S11.
Trends in RT-qPCR Ct values for COVID-19 infections in Manaus (laboratory C). Ct values
for genes N, ORF1ab, and S in a sample of symptomatic cases presenting for testing at a
healthcare facility in Manaus, stratified according to the period defined in Fig. 2 (see main
text). Line-list data can be found in Data S3.
Figure S12.
Coalescent growth rates for P.1 and P.2 lineages estimated using a constant-logistic-logistic
approach implemented in BEAST v.1.10 (87). (A) Light and dark green posterior probability
distributions show virus lineage population growth (r) for P.2 and P.1, respectively. Inset
shows posterior probability estimates for the ratio of epidemic growth rates between P.1 and
P.2 (B) Light and dark green posterior probability distributions of the estimated doubling
times for P.2 and P.1 lineage, respectively. Inset shows posterior probability estimates for the
ratio of doubling times between P.1 and P.2.
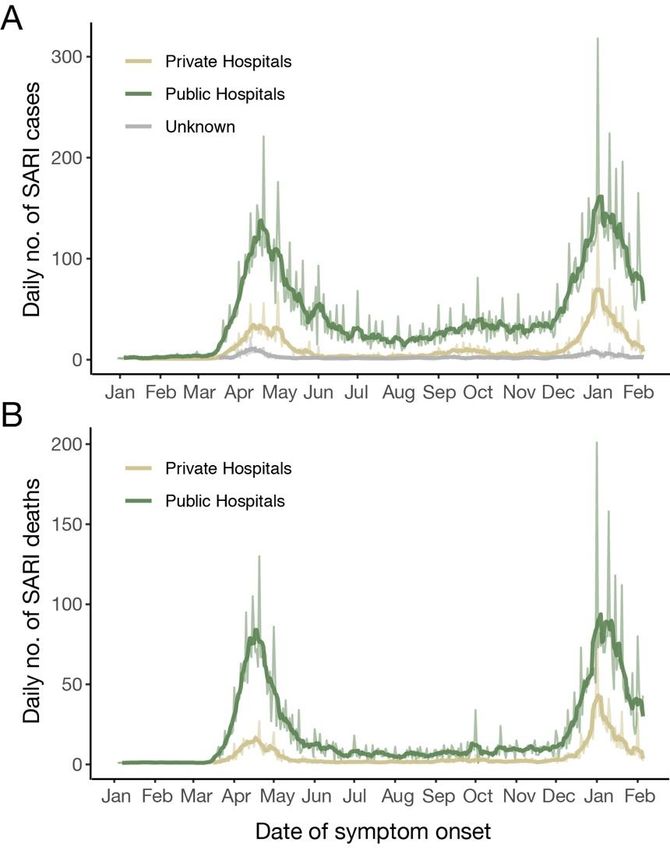
Figure S13.
Daily number of cases (A) and deaths (B) attending public or private hospitals in Manaus.
Dark solid lines show the 7-day rolling average. Data was obtained from the SIVEP-Gripe
dataset described in Materials and Methods. SARI = severe acute respiratory infections.
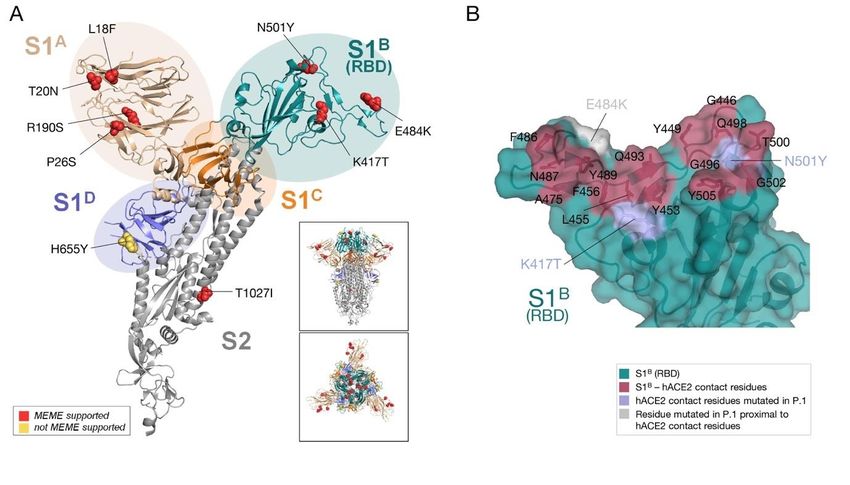
Figure S14.
Mapping of adaptive substitutions onto the structure of SARS-COV-2 S. (A) Lineage
defining mutations within the S protein of the P.1 lineage are mapped onto the spike
glycoprotein structure of SARS-CoV-2 (93) (NSMB; PDB: 6ZGI). Cartoon representation of
one protomer of the trimeric S ectodomain structure with the different domains and subunits
indicated by color: S1A (wheat), S1B (RBD, teal), S1C (orange), S1D (blue), S2 subunit (grey).
Residues under selection are shown as spheres with associated mutations indicated and
colored according to the respective type of selection as analyzed under MEME (92) and
supported for at least one branch (red) or not supported (yellow). The positively selected
residue V1176F was not resolved in the cryoEM map of the SARS-CoV-2 S ectodomain used
here. The inset panels reflect the same presentation in the trimeric context of the S protein in
a side (upper panel) and top-down view (lower panel). N-linked glycans are omitted for
clarity. (B) Surface representation of the SARS-CoV-2 S RBD-hACE2 contact interface with
residues mutated in the RBD of P.1 highlighted. Contact residues as observed in the SARS-
CoV-2 S RBD (deep teal) in complex with hACE2 (11) (PDB: 6MOJ) are colored red with
side chains shown as sticks. Residues mutated in lineage P.1 that are part of the contact
interface (K417 and N501) are colored light blue. A nearby residue that is observed to be
mutated in P.1 that is not part of the direct contact interface (E484) is colored grey with side
chains shown as sticks.
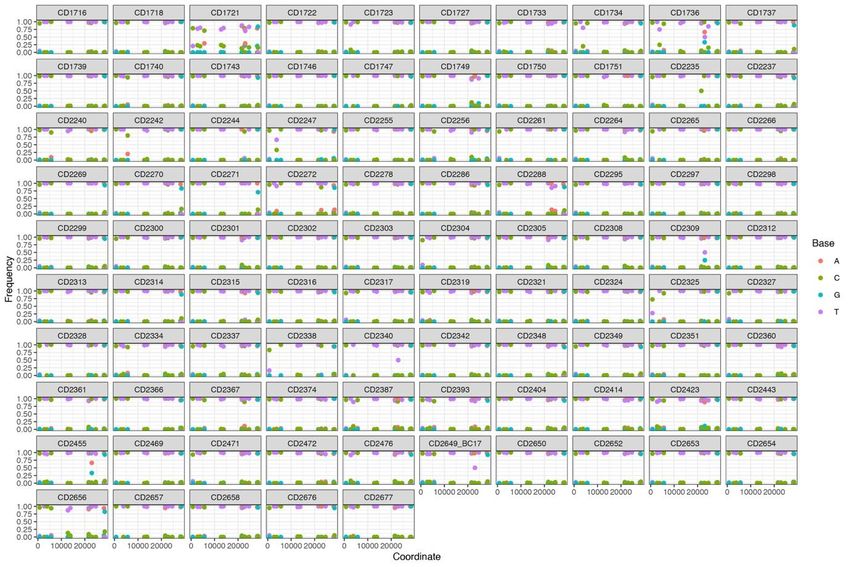
Figure S15.
Intra-host sequencing data by reference to variant allele frequency measurements at P.1
lineage-defining positions. The analysis shows that lineage-defining mutations are highly
stable across genomes taking into account the underlying sequence read error rate at Oxford
Nanopore sequencing, which limits the level of detection of mixed species to a minimum
relative abundance of 5-10%. One genome demonstrates coverage patterns suggestive of
mixed infection (CD1721) and excluded from phylodynamic analysis.
type posterior prior

 Beta(4,1)
 Cross Immunity Prior

 Beta(3,1)

 Beta(2,1)

 Beta(1,1)

 0.00 0.25 0.50 0.75 1.00
 Cross Immunity

Figure S16. Cross-immunity prior and posterior distributions for a range of Beta priors. The
red bars represent the prior, and the blue bars the resultant posterior. Contraction of the
posterior toward partial cross-immunity greater than 0.5 but less than complete cross-
immunity is consistently observed.
Table S1. P.1 lineage-defining mutations. These have been defined based on the genomic datasets analysed in this study, which included 95 P.1 isolates. None of the mutations was observed in other isolates in the lineage B.1.1.28 analysed in this study. 1One isolate (ID: CD2241) did not present the 12778C>T; 2One isolate (ID: CD2293) did not present the 21614C>T; 3One isolate (ID: CD2293) did not present the 21638C>T; 4One isolate (ID: CD1721) did not present the 22132G>T; 5Fourty-five percent of P.1 isolates sequenced here did not acquire this insertion, which is located in the intergenic region between ORF8 and N genes. The last column indicates positively selected sites in P.1 lineage-defining mutations with statistical support (MEME p 0.05). Gene Amino acid Nucleotide change dN/dS>1 ORF1ab - 733T>C - 2749C>T S1188L 3828C>T Yes K1795Q 5648A>C Yes - del11288-11296 (3675-3677) - 12778C>T1 - 13860C>T E5662D 17259G>T Spike L18F 21614C>T2 Yes T20N 21621C>A Yes P26S 21638C>T3 Yes D138Y 21974G>T R190S 22132G>T4 Yes K417T 22812A>C Yes E484K 23012G>A Yes N501Y 23063A>T Yes H655Y 23525C>T T1027I 24642C>T Yes ORF8 E92K 28167G>A - 28263insAACA5 N P80R 28512C>G Yes - 28877A>T - 28878G>C
Table S2.
Overview of the P.1 sequences used in this study. N = Number; Ct = cycle threshold (RT-
PCR); LDM = lineage defining mutations (see definition in table S1); no. = number. Line-list
information for the sequence data generated by this study can be found in Data S2.

 Genome N Primary use in Lab Ct values Mean no. P.1
 coverage this study source LDM (range)

 >25 to 75 to 95% 23 Phylodynamic and Lab A, E: 17.6 (13.6–23.4) 22
 Epi Modelling B N: 18.4 (9–30) (18–23)
Table S3.
Epidemiological information regarding P.1 sequences from GISAID used for
phylodynamics analyses. *Federal unit corresponding to municipality of sampling is São
Paulo state, except for Teresina (Piauí state). N. A. = Not available.

 Collection Municipality Municipality of Travel
 GISAI ID Age Sex
 date of residence sampling* history
 EPI_ISL_906075 2021-01-19 83 M Manaus Sao Paulo No
 EPI_ISL_906069 2021-01-15 45 M Manaus Aguas Lindonia No
 EPI_ISL_906076 2021-01-19 52 M Manaus Sao Caetano Sul No
 EPI_ISL_906077 2021-01-19 49 F Manaus Sao Caetano Sul No
 EPI_ISL_906080 2021-01-22 74 M Manaus Sao Paulo No
 EPI_ISL_906081 2021-01-22 69 M Manaus Sao Paulo No
 EPI_ISL_940614 2021-01-19 57 F Manaus Teresina (PI) No
 EPI_ISL_940615 2021-01-19 38 F Manaus Teresina (PI) No
 EPI_ISL_906071 2021-01-19 59 M Manaus Teresina (PI) No
 EPI_ISL_940617 2021-01-19 30 F Manaus Teresina (PI) No
 EPI_ISL_940618 2021-01-19 46 F Manaus Teresina (PI) No
 EPI_ISL_940620 2021-01-14 46 M Manaus Sao Paulo No
 EPI_ISL_940623 2021-01-08 64 F Manaus Sao Paulo No
 EPI_ISL_940624 2021-01-15 29 M Manaus Sao Paulo No
 EPI_ISL_940626 2021-01-21 78 M Manaus Sao Caetano Sul No
 EPI_ISL_940627 2021-01-22 64 M Manaus Sao Caetano Sul No
 EPI_ISL_833169 2020-12-23N.A. N.A. N.A. N.A. N.A.
 EPI_ISL_940630 2021-01-25 40 M Rio Janeiro Sao Paulo Roraima
 EPI_ISL_875689 2021-01-15 65 F Sao Paulo Sao Paulo Manaus
 EPI_ISL_872191 2021-01-15 51 F Sao Paulo Sao Paulo Manaus
 EPI_ISL_872192 2021-01-18 49 F Sao Paulo Sao Paulo Manaus
 EPI_ISL_940619 2021-01-15 84 F Sao Paulo Sao Paulo Manaus
 EPI_ISL_940621 2021-01-14 40 F Manaus Sao Paulo N.A.
 EPI_ISL_940622 2021-01-15 48 M Sao Paulo Sao Paulo Manaus
 EPI_ISL_940625 2021-01-19 81 F Sao Paulo Sao Paulo Manaus
 EPI_ISL_875688 2021-01-04 49 M Sao Paulo Sao Paulo Manaus
Table S4.
Proportion of P.1 cases in Manaus. Note that week commencing on 30 Nov 2020 includes the
date of the first P.1 case detected in our study (6 Dec 2020).

 Date (Week Commencing) No. Sequenced No. P.1 Proportion

 2 November 2020 9 0 0
 9 November 2020 2 0 0
 16 November 2020 4 0 0

 23 November 2020 NA NA NA
 30 November 2020 2 1 50%
 7 December 2020 7 1 14%
 14 December 2020 24 7 29%
 21 December 2020 37 20 54%
 28 December 2020 14 8 57%

 4 January 2021 46 40 87%
Table S5.
Inferred changes in epidemiological characteristics of P.1, depending on the timing of P.1
emergence assumed. The central estimate (derived from phylogenetic molecular clock
analyses) used is the 9th November. Sensitivity results are shown for this date plus or minus 1
week, as well as for the 95% Bayesian Credible Interval of the most recent common ancestor
of the P.1 lineage (6th October and 24th November). The results presented are the mean, with
the Bayesian 95% quartiles in brackets.

 Epidemiological Characteristic

 Timing of P.1 Degree of Cross- Transmissibility Relative Risk of
 Emergence Immunity Increase Mortality
 6 Oct 2020 0.71 (0.35-0.94) 1.38 (0.82-2.05) 1.88 (0.99-3.11)
 2 Nov 2020 0.69 (0.33-0.93) 1.89 (1.13-2.82) 1.72 (0.95-2.86)
 9 Nov 2020 0.65 (0.28-0.90) 2.09 (1.26-3.10) 1.59 (0.90-2.51)
 16 Nov 2020 0.57 (0.23-0.83) 2.34 (1.50-3.37) 1.34 (0.82-2.10)
 24 Nov 2020 0.42 (0.13-0.69) 2.75 (1.94-3.78) 1.12 (0.73-1.77)
Table S6.
Inferred changes in epidemiological characteristics of P.1, depending on cross-immunity
prior assumptions. Sensitivity results presented are the mean, with the Bayesian 95%
quartiles in brackets.

 Epidemiological Characteristic

 Degree of Cross- Degree of Cross- Transmissibility Relative Risk of
 Immunity prior Immunity Increase Mortality
 Beta(1,1) 0.55 (0.09–0.87) 1.90 (1.10-2.95) 1.42 (0.77-2.38)
 Beta(2,1) 0.65 (0.28-0.90) 2.09 (1.26-3.10) 1.59 (0.90-2.51)
 Beta(3,1) 0.70 (0.39-0.91) 2.19 (1.41-3.10) 1.67 (0.97-2.62)
 Beta(4,1) 0.73 (0.46-0.92) 2.31 (1.49-3.27) 1.74 (1.06-264)
 Complete immune- 0 1.07 (0.82-1.39) 0.99 (0.65-1.68)
 escape
 Complete cross- 1 3.89 (3.52-4.26) 2.72 (1.54-3.88)
 immunity
Table S7.
Inferred changes in epidemiological characteristics of P.1, depending on the rate of natural
immunity waning assumed (for an emergence date of 9 Nov 2020). Sensitivity results
presented are the mean, with the Bayesian 95% quartiles in brackets.

 Epidemiological Characteristic
 Duration of Degree of Cross- Transmissibility Relative Risk of
 Immunity Assumed Immunity Increase Mortality
 50% waning over 6-
 0.48 (0.13-0.82) 2.25 (1.60-3.16) 1.35 (0.98-1.89)
 month period
 50% waning over 8-
 0.56 (0.19-0.86) 1.92 (1.19-2.91) 1.54 (0.99-2.34)
 month period
 50% waning over 1-
 0.65 (0.28-0.90) 2.09 (1.26-3.10) 1.59 (0.90-2.51)
 year period
 50% waning over
 0.69 (0.35-0.91) 2.17 (1.36-3.11) 1.61 (0.86-2.65)
 1.5-year period
 50% waning over 2-
 0.71 (0.39-0.92) 2.24 (1.41-3.17) 1.65 (0.84-2.71)
 year period
Table S8.
Inferred changes in epidemiological characteristics of P.1, depending on non-P.1 infection
fatality ratio (IFR) prior assumptions. Sensitivity results presented are the mean, with the
Bayesian 95% quartiles in brackets.

 Epidemiological Characteristic
 Non-P.1 IFR prior Degree of Cross- Transmissibility Relative Risk of
 Immunity Increase Mortality
 Normal+(0.24,0.01) 0.65 (0.28-0.90) 2.06 (1.29-3.03) 1.61 (0.92-2.57)
 Normal+(0.32,0.01) 0.65 (0.28-0.90) 2.09 (1.26-3.10) 1.59 (0.90-2.51)
 Normal+(0.48,0.01) 0.63 (0.25-0.90) 2.11 (1.28-3.12) 1.46 (0.80-2.36)
 Gamma(3.2,10) 0.65 (0.29-0.89) 2.07 (1.25-3.08) 1.58 (0.88-2.50)
Table S9.
Inferred changes in epidemiological characteristics of P.1, depending on relatively risk of
mortality prior assumptions. Sensitivity results presented are the mean, with the Bayesian
95% quartiles in brackets.

 Epidemiological Characteristic

 Relative Risk of Degree of Cross- Transmissibility Relative Risk of
 Mortality prior Immunity Increase Mortality
 LogNormal(0,0.25) 0.54 (0.21–0.80) 1.83 (1.16-2.66) 1.23 (0.85-1.75)
 LogNormal(0,0.5) 0.65 (0.28-0.90) 2.09 (1.26-3.10) 1.59 (0.90-2.51)
 LogNormal(0,0.75) 0.69 (0.34-0.92) 2.21 (1.31-3.27) 1.74 (0.95-2.89)
Table S10.
Inferred changes in epidemiological characteristics of P.1, depending on prior assumptions
for the increase in transmissibility of P.1 compared to non-P.1. Sensitivity results presented
are the mean, with the Bayesian 95% quartiles in brackets.

 Epidemiological Characteristic

 Transmissibility Degree of Cross- Transmissibility Relative Risk of
 increase prior Immunity Increase Mortality
 Normal+(2,1) 0.75 (0.43–0.95) 2.46 (1.49-3.54) 1.77 (0.99-2.78)
 Normal+(1,1) 0.65 (0.28-0.90) 2.09 (1.26-3.10) 1.59 (0.90-2.51)
 Gamma(2.2,0.5) 0.62 (0.25-0.89) 2.01 (1.21-3.06) 1.51 (0.86-2.52)
Data S1. (separate file)
Metadata for 1084 SARS-CoV-2 samples from Manaus (laboratory B).

Data S2. (separate file)
Metadata and GISAID IDs for 184 sequenced samples from Manaus.

Data S3. (separate file)
Metadata for 8542 SARS-CoV-2 samples from Manaus (laboratory C).

Data S4. (separate file)
GISAID Acknowledgment table (used for datasets B and C).

Data S5. (separate file)
Flight mobility data from Manaus (state level).

Data S6. (separate file)
Cell-phone derived mobility data from Manaus (municipality level).
References and Notes
1. P. C. Hallal, F. P. Hartwig, B. L. Horta, M. F. Silveira, C. J. Struchiner, L. P. Vidaletti, N. A.
 Neumann, L. C. Pellanda, O. A. Dellagostin, M. N. Burattini, G. D. Victora, A. M. B.
 Menezes, F. C. Barros, A. J. D. Barros, C. G. Victora, SARS-CoV-2 antibody prevalence
 in Brazil: Results from two successive nationwide serological household surveys. Lancet
 Glob. Health 8, e1390–e1398 (2020). doi:10.1016/S2214-109X(20)30387-9 Medline
2. L. F. Buss, C. A. Prete Jr., C. M. M. Abrahim, A. Mendrone Jr., T. Salomon, C. de Almeida-
 Neto, R. F. O. França, M. C. Belotti, M. P. S. S. Carvalho, A. G. Costa, M. A. E.
 Crispim, S. C. Ferreira, N. A. Fraiji, S. Gurzenda, C. Whittaker, L. T. Kamaura, P. L.
 Takecian, P. da Silva Peixoto, M. K. Oikawa, A. S. Nishiya, V. Rocha, N. A. Salles, A.
 A. de Souza Santos, M. A. da Silva, B. Custer, K. V. Parag, M. Barral-Netto, M. U. G.
 Kraemer, R. H. M. Pereira, O. G. Pybus, M. P. Busch, M. C. Castro, C. Dye, V. H.
 Nascimento, N. R. Faria, E. C. Sabino, Three-quarters attack rate of SARS-CoV-2 in the
 Brazilian Amazon during a largely unmitigated epidemic. Science 371, 288–292 (2021).
 doi:10.1126/science.abe9728 Medline
3. C. Álvarez-Antonio, G. Meza-Sánchez, C. Calampa, W. Casanova, C. Carey, F. Alava, H.
 Rodríguez-Ferrucci, A. M. Quispe, Seroprevalence of Anti-SARS-CoV-2 Antibodies in
 Iquitos, Loreto, Peru. medRxiv 21249913 [Preprint] 20 January 2021.
 doi:10.1101/2021.01.17.21249913.
4. M. Mercado, M. Ospina, Institutoo Nacional de Salud, “Seroprevalencia de SARS-CoV-2
 durante la epidemia en Colombia: estudio país” (2020);
 www.ins.gov.co/BibliotecaDigital/Seroprevalencia-estudio-colombia.pdf.
5. Fundação de Vigilância em Saúde do Amazonas, “Perfil clínico e demográfico dos casos de
 Covid-19 no estado do Amazonas: uma análise comparativa entre 2020 e 2021,” No. 17
 (2021); www.fvs.am.gov.br/media/publicacao/boletim_covid_17.pdf.
6. A. J. Greaney, A. N. Loes, K. H. D. Crawford, T. N. Starr, K. D. Malone, H. Y. Chu, J. D.
 Bloom, Comprehensive mapping of mutations in the SARS-CoV-2 receptor-binding
 domain that affect recognition by polyclonal human plasma antibodies. Cell Host
 Microbe 29, 463–476.e6 (2021). doi:10.1016/j.chom.2021.02.003 Medline
7. T. N. Starr, A. J. Greaney, S. K. Hilton, D. Ellis, K. H. D. Crawford, A. S. Dingens, M. J.
 Navarro, J. E. Bowen, M. A. Tortorici, A. C. Walls, N. P. King, D. Veesler, J. D. Bloom,
 Deep mutational scanning of SARS-CoV-2 receptor binding domain reveals constraints
 on folding and ACE2 binding. Cell 182, 1295–1310.e20 (2020).
 doi:10.1016/j.cell.2020.08.012 Medline
8. M. A. Suchard, R. E. Weiss, J. S. Sinsheimer, Testing a molecular clock without an outgroup:
 Derivations of induced priors on branch-length restrictions in a Bayesian framework.
 Syst. Biol. 52, 48–54 (2003). doi:10.1080/10635150390132713 Medline
9. Z. Wang, F. Schmidt, Y. Weisblum, F. Muecksch, C. O. Barnes, S. Finkin, D. Schaefer-
 Babajew, M. Cipolla, C. Gaebler, J. A. Lieberman, T. Y. Oliveira, Z. Yang, M. E.
 Abernathy, K. E. Huey-Tubman, A. Hurley, M. Turroja, K. A. West, K. Gordon, K. G.
 Millard, V. Ramos, J. Da Silva, J. Xu, R. A. Colbert, R. Patel, J. Dizon, C. Unson-
 O’Brien, I. Shimeliovich, A. Gazumyan, M. Caskey, P. J. Bjorkman, R. Casellas, T.
Hatziioannou, P. D. Bieniasz, M. C. Nussenzweig, mRNA vaccine-elicited antibodies to
 SARS-CoV-2 and circulating variants. Nature (2021). doi:10.1038/s41586-021-03324-6
 Medline
10. Y. Weisblum, F. Schmidt, F. Zhang, J. DaSilva, D. Poston, J. C. C. Lorenzi, F. Muecksch,
 M. Rutkowska, H.-H. Hoffmann, E. Michailidis, C. Gaebler, M. Agudelo, A. Cho, Z.
 Wang, A. Gazumyan, M. Cipolla, L. Luchsinger, C. D. Hillyer, M. Caskey, D. F.
 Robbiani, C. M. Rice, M. C. Nussenzweig, T. Hatziioannou, P. D. Bieniasz, Escape from
 neutralizing antibodies by SARS-CoV-2 spike protein variants. eLife 9, e61312 (2020).
 doi:10.7554/eLife.61312 Medline
11. J. Lan, J. Ge, J. Yu, S. Shan, H. Zhou, S. Fan, Q. Zhang, X. Shi, Q. Wang, L. Zhang, X.
 Wang, Structure of the SARS-CoV-2 spike receptor-binding domain bound to the ACE2
 receptor. Nature 581, 215–220 (2020). doi:10.1038/s41586-020-2180-5 Medline
12. H. Tegally, E. Wilkinson, M. Giovanetti, A. Iranzadeh, V. Fonseca, J. Giandhari, D.
 Doolabh, S. Pillay, E. J. San, N. Msomi, K. Mlisana, A. von Gottberg, S. Walaza, M.
 Allam, A. Ismail, T. Mohale, A. J. Glass, S. Engelbrecht, G. Van Zyl, W. Preiser, F.
 Petruccione, A. Sigal, D. Hardie, G. Marais, N. Y. Hsiao, S. Korsman, M.-A. Davies, L.
 Tyers, I. Mudau, D. York, C. Maslo, D. Goedhals, S. Abrahams, O. Laguda-Akingba, A.
 Alisoltani-Dehkordi, A. Godzik, C. K. Wibmer, B. T. Sewell, J. Lourenço, L. C. J.
 Alcantara, S. L. Kosakovsky Pond, S. Weaver, D. Martin, R. J. Lessells, J. N. Bhiman, C.
 Williamson, T. de Oliveira, Detection of a SARS-CoV-2 variant of concern in South
 Africa. Nature (2021). doi:10.1038/s41586-021-03402-9 Medline
13. A. Rambaut, N. Loman, O. Pybus, W. Barclay, J. Barrett, Carabelli., A., Connor, T.,
 Peacock, T., Robertson, D. L., Volz, E., on behalf of COVID-19 Genomics Consortium
 UK (CCoG-UK), “Preliminary genomic characterisation of an emergent SARS-CoV-2
 lineage in the UK defined by a novel set of spike mutations” (2020);
 https://virological.org/t/preliminary-genomic-characterisation-of-an-emergent-sars-cov-2-
 lineage-in-the-uk-defined-by-a-novel-set-of-spike-mutations/563.
14. SAMRC Report on Weekly Deaths in South Africa (available at
 https://www.samrc.ac.za/reports/report-weekly-deaths-south-africa?bc=254). (2021).
15. N. L. Washington et al., Genomic epidemiology identifies emergence and rapid transmission
 of SARS-CoV-2 B.1.1.7 in the United States. medRxiv 21251159 [Preprint] 7 February
 2021). doi:10.1101/2021.02.06.21251159.
16. C. H. Hansen, D. Michlmayr, S. M. Gubbels, K. Mølbak, S. Ethelberg, Assessment of
 protection against reinfection with SARS-CoV-2 among 4 million PCR-tested individuals
 in Denmark in 2020: A population-level observational study. Lancet 397, 1204–1212
 (2021). doi:10.1016/S0140-6736(21)00575-4 Medline
17. E. Volz, S. Mishra, M. Chand, J. C. Barrett, R. Johnson, L. Geidelberg, W. R. Hinsley, D. J.
 Laydon, G. Dabrera, Á. O’Toole, R. Amato, M. Ragonnet-Cronin, I. Harrison, B.
 Jackson, C. V. Ariani, O. Boyd, N. J. Loman, J. T. McCrone, S. Gonçalves, D. Jorgensen,
 R. Myers, V. Hill, D. K. Jackson, K. Gaythorpe, N. Groves, J. Sillitoe, D. P.
 Kwiatkowski, S. Flaxman, O. Ratmann, S. Bhatt, S. Hopkins, A. Gandy, A. Rambaut, N.
 M. Ferguson; COVID-19 Genomics UK (COG-UK) consortium, Assessing
transmissibility of SARS-CoV-2 lineage B.1.1.7 in England. Nature (2021).
 doi:10.1038/s41586-021-03470-x Medline
18. D. D. S. Candido, A. Watts, L. Abade, M. U. G. Kraemer, O. G. Pybus, J. Croda, W. de
 Oliveira, K. Khan, E. C. Sabino, N. R. Faria, Routes for COVID-19 importation in Brazil.
 J. Travel Med. 27, taaa042 (2020). doi:10.1093/jtm/taaa042 Medline
19. D. S. Candido, I. M. Claro, J. G. de Jesus, W. M. Souza, F. R. R. Moreira, S. Dellicour, T. A.
 Mellan, L. du Plessis, R. H. M. Pereira, F. C. S. Sales, E. R. Manuli, J. Thézé, L.
 Almeida, M. T. Menezes, C. M. Voloch, M. J. Fumagalli, T. M. Coletti, C. A. M. da
 Silva, M. S. Ramundo, M. R. Amorim, H. H. Hoeltgebaum, S. Mishra, M. S. Gill, L. M.
 Carvalho, L. F. Buss, C. A. Prete Jr., J. Ashworth, H. I. Nakaya, P. S. Peixoto, O. J.
 Brady, S. M. Nicholls, A. Tanuri, Á. D. Rossi, C. K. V. Braga, A. L. Gerber, A. P. de C
 Guimarães, N. Gaburo Jr., C. S. Alencar, A. C. S. Ferreira, C. X. Lima, J. E. Levi, C.
 Granato, G. M. Ferreira, R. S. Francisco Jr., F. Granja, M. T. Garcia, M. L. Moretti, M.
 W. Perroud Jr., T. M. P. P. Castiñeiras, C. S. Lazari, S. C. Hill, A. A. de Souza Santos, C.
 L. Simeoni, J. Forato, A. C. Sposito, A. Z. Schreiber, M. N. N. Santos, C. Z. de Sá, R. P.
 Souza, L. C. Resende-Moreira, M. M. Teixeira, J. Hubner, P. A. F. Leme, R. G. Moreira,
 M. L. Nogueira, N. M. Ferguson, S. F. Costa, J. L. Proenca-Modena, A. T. R.
 Vasconcelos, S. Bhatt, P. Lemey, C.-H. Wu, A. Rambaut, N. J. Loman, R. S. Aguiar, O.
 G. Pybus, E. C. Sabino, N. R. Faria; Brazil-UK Centre for Arbovirus Discovery,
 Diagnosis, Genomics and Epidemiology (CADDE) Genomic Network, Evolution and
 epidemic spread of SARS-CoV-2 in Brazil. Science 369, 1255–1260 (2020).
 doi:10.1126/science.abd2161 Medline
20. W. M. de Souza, L. F. Buss, D. D. S. Candido, J.-P. Carrera, S. Li, A. E. Zarebski, R. H. M.
 Pereira, C. A. Prete Jr., A. A. de Souza-Santos, K. V. Parag, M. C. T. D. Belotti, M. F.
 Vincenti-Gonzalez, J. Messina, F. C. da Silva Sales, P. D. S. Andrade, V. H. Nascimento,
 F. Ghilardi, L. Abade, B. Gutierrez, M. U. G. Kraemer, C. K. V. Braga, R. S. Aguiar, N.
 Alexander, P. Mayaud, O. J. Brady, I. Marcilio, N. Gouveia, G. Li, A. Tami, S. B. de
 Oliveira, V. B. G. Porto, F. Ganem, W. A. F. de Almeida, F. F. S. T. Fantinato, E. M.
 Macário, W. K. de Oliveira, M. L. Nogueira, O. G. Pybus, C.-H. Wu, J. Croda, E. C.
 Sabino, N. R. Faria, Epidemiological and clinical characteristics of the COVID-19
 epidemic in Brazil. Nat. Hum. Behav. 4, 856–865 (2020). doi:10.1038/s41562-020-0928-
 4 Medline
21. J. G. Jesus, C. Sacchi, D. D. S. Candido, I. M. Claro, F. C. S. Sales, E. R. Manuli, D. B. B. D.
 Silva, T. M. Paiva, M. A. B. Pinho, K. C. O. Santos, S. C. Hill, R. S. Aguiar, F. Romero,
 F. C. P. D. Santos, C. R. Gonçalves, M. D. C. Timenetsky, J. Quick, J. H. R. Croda, W.
 Oliveira, A. Rambaut, O. G. Pybus, N. J. Loman, E. C. Sabino, N. R. Faria, Importation
 and early local transmission of COVID-19 in Brazil, 2020. Rev. Inst. Med. Trop. São
 Paulo 62, e30 (2020). doi:10.1590/s1678-9946202062030 Medline
22. I. M. Claro, F. C. da Silva Sales, M. S. Ramundo, D. S. Candido, C. A. M. Silva, J. G. de
 Jesus, E. R. Manuli, C. M. de Oliveira, L. Scarpelli, G. Campana, O. G. Pybus, E. C.
 Sabino, N. R. Faria, J. E. Levi, Local Transmission of SARS-CoV-2 Lineage B.1.1.7,
 Brazil, December 2020. Emerg. Infect. Dis. 27, 970–972 (2021).
 doi:10.3201/eid2703.210038 Medline
23. V. A. D. Nascimento, A. L. G. Corado, F. O. D. Nascimento, Á. K. A. D. Costa, D. C. G.
 Duarte, S. L. B. Luz, L. M. F. Gonçalves, M. S. Jesus, C. F. D. Costa, E. Delatorre, F. G.
 Naveca, Genomic and phylogenetic characterisation of an imported case of SARS-CoV-2
 in Amazonas State, Brazil. Mem. Inst. Oswaldo Cruz 115, e200310 (2020).
 doi:10.1590/0074-02760200310 Medline
24. J. R. Tyson, P. James, D. Stoddart, N. Sparks, A. Wickenhagen, G. Hall, J. H. Choi, H.
 Lapointe, K. Kamelian, A. D. Smith, N. Prystajecky, I. Goodfellow, S. J. Wilson, R.
 Harrigan, T. P. Snutch, N. J. Loman, J. Quick, Improvements to the ARTIC multiplex
 PCR method for SARS-CoV-2 genome sequencing using nanopore. bioRxiv
 2020.09.04.283077 doi:10.1101/2020.09.04.283077 (2020). Medline
25. World Health Organization, (2021). Genomic sequencing of SARS-CoV-2: a guide to
 implementation for maximum impact on public health, 8 January 2021. World Health
 Organization (2021); https://apps.who.int/iris/handle/10665/338480.
26. A. Rambaut, E. C. Holmes, Á. O’Toole, V. Hill, J. T. McCrone, C. Ruis, L. du Plessis, O. G.
 Pybus, A dynamic nomenclature proposal for SARS-CoV-2 lineages to assist genomic
 epidemiology. Nat. Microbiol. 5, 1403–1407 (2020). doi:10.1038/s41564-020-0770-5
 Medline
27. N. R. Faria, I. M. Claro, D. Candido, L. A. M. Franco, P. S. Andrade, T. M. Coletti, C. A. M.
 Silva, F. C. Sales, E. R. Manuli, R. S. Aguiar, N. Gaburo, C. C. Camilo, N. A. Fraiji, M.
 A. E. Crispim, M. P. S. S. Carvalho, A. Rambaut, N. Loman, O. G. Pybus, E. C. Sabino,
 on behalf of CADDE Genomic Network, “Genomic characterisation of an emergent
 SARS-CoV-2 lineage in Manaus: preliminary findings” (2021);
 https://virological.org/t/genomic-characterisation-of-an-emergent-sars-cov-2-lineage-in-
 manaus-preliminary-findings/586.
28. T. Fujino, H. Nomoto, S. Kutsuna, M. Ujiie, T. Suzuki, R. Sato, T. Fujimoto, M. Kuroda, T.
 Wakita, N. Ohmagari, Novel SARS-CoV-2 variant in travelers from Brazil to Japan.
 Emerg. Infect. Dis. 27, (2021). doi:10.3201/eid2704.210138 Medline
29. A. Rambaut, T. T. Lam, L. Max Carvalho, O. G. Pybus, Exploring the temporal structure of
 heterochronous sequences using TempEst (formerly Path-O-Gen). Virus Evol. 2, vew007
 (2016). doi:10.1093/ve/vew007 Medline
30. B. Choi, M. C. Choudhary, J. Regan, J. A. Sparks, R. F. Padera, X. Qiu, I. H. Solomon, H.-H.
 Kuo, J. Boucau, K. Bowman, U. D. Adhikari, M. L. Winkler, A. A. Mueller, T. Y.-T.
 Hsu, M. Desjardins, L. R. Baden, B. T. Chan, B. D. Walker, M. Lichterfeld, M. Brigl, D.
 S. Kwon, S. Kanjilal, E. T. Richardson, A. H. Jonsson, G. Alter, A. K. Barczak, W. P.
 Hanage, X. G. Yu, G. D. Gaiha, M. S. Seaman, M. Cernadas, J. Z. Li, Persistence and
 Evolution of SARS-CoV-2 in an Immunocompromised Host. N. Engl. J. Med. 383,
 2291–2293 (2020). doi:10.1056/NEJMc2031364 Medline
31. V. A. Avanzato, M. J. Matson, S. N. Seifert, R. Pryce, B. N. Williamson, S. L. Anzick, K.
 Barbian, S. D. Judson, E. R. Fischer, C. Martens, T. A. Bowden, E. de Wit, F. X. Riedo,
 V. J. Munster, Case study: Prolonged infectious SARS-CoV-2 shedding from an
 asymptomatic immunocompromised individual with cancer. Cell 183, 1901–1912.e9
 (2020). doi:10.1016/j.cell.2020.10.049 Medline
32. A. J. Drummond, M. A. Suchard, Bayesian random local clocks, or one rate to rule them all.
 BMC Biol. 8, 114 (2010). doi:10.1186/1741-7007-8-114 Medline
33. M. S. Gill, P. Lemey, N. R. Faria, A. Rambaut, B. Shapiro, M. A. Suchard, Improving
 Bayesian population dynamics inference: A coalescent-based model for multiple loci.
 Mol. Biol. Evol. 30, 713–724 (2013). doi:10.1093/molbev/mss265 Medline
34. F. N. Naveca et al., COVID-19 epidemic in the Brazilian state of Amazonas was driven by
 long-term persistence of endemic SARS-CoV-2 lineages and the recent emergence of the
 new Variant of Concern P.1. Nat. Portfolio 10.21203/rs.3.rs-275494/v1 (2021).
35. M. Marks, P. Millat-Martinez, D. Ouchi, C. H. Roberts, A. Alemany, M. Corbacho-Monné,
 M. Ubals, A. Tobias, C. Tebé, E. Ballana, Q. Bassat, B. Baro, M. Vall-Mayans, C. G-
 Beiras, N. Prat, J. Ara, B. Clotet, O. Mitjà, Transmission of COVID-19 in 282 clusters in
 Catalonia, Spain: A cohort study. Lancet Infect. Dis. S1473-3099(20)30985-3 (2021).
 doi:10.1016/S1473-3099(20)30985-3 Medline
36. J. A. Hay, Kennedy-Shaffer, L., Kanjilal, S., Lipsitch, M., Mina, M. J, Estimating
 epidemiologic dynamics from single cross-sectional viral load distributions. medRxiv
 20204222 [Preprint] 13 February 2021). doi:10.1101/2020.10.08.20204222.
37. M. Kidd, A. Richter, A. Best, N. Cumley, J. Mirza, B. Percival, M. Mayhew, O. Megram, F.
 Ashford, T. White, E. Moles-Garcia, L. Crawford, A. Bosworth, S. F. Atabani, T. Plant,
 A. McNally, S-variant SARS-CoV-2 lineage B1.1.7 is associated with significantly
 higher viral loads in samples tested by ThermoFisher TaqPath RT-qPCR. J. Infect. Dis.
 jiab082 (2021). doi:10.1093/infdis/jiab082 Medline
38. K. Stephen et al., Densely sampled viral trajectories suggest longer duration of acute
 infection with B.1.1.7 variant relative to non-B.1.1.7 SARS-CoV-2 (2021);
 https://nrs.harvard.edu/URN-3:HUL.INSTREPOS:37366884.
39. E. C. Sabino, L. F. Buss, M. P. S. Carvalho, C. A. Prete Jr., M. A. E. Crispim, N. A. Fraiji, R.
 H. M. Pereira, K. V. Parag, P. da Silva Peixoto, M. U. G. Kraemer, M. K. Oikawa, T.
 Salomon, Z. M. Cucunuba, M. C. Castro, A. A. de Souza Santos, V. H. Nascimento, H.
 S. Pereira, N. M. Ferguson, O. G. Pybus, A. Kucharski, M. P. Busch, C. Dye, N. R. Faria,
 Resurgence of COVID-19 in Manaus, Brazil, despite high seroprevalence. Lancet 397,
 452–455 (2021). doi:10.1016/S0140-6736(21)00183-5 Medline
40. H. J. T. Unwin, S. Mishra, V. C. Bradley, A. Gandy, T. A. Mellan, H. Coupland, J. Ish-
 Horowicz, M. A. C. Vollmer, C. Whittaker, S. L. Filippi, X. Xi, M. Monod, O. Ratmann,
 M. Hutchinson, F. Valka, H. Zhu, I. Hawryluk, P. Milton, K. E. C. Ainslie, M. Baguelin,
 A. Boonyasiri, N. F. Brazeau, L. Cattarino, Z. Cucunuba, G. Cuomo-Dannenburg, I.
 Dorigatti, O. D. Eales, J. W. Eaton, S. L. van Elsland, R. G. FitzJohn, K. A. M.
 Gaythorpe, W. Green, W. Hinsley, B. Jeffrey, E. Knock, D. J. Laydon, J. Lees, G.
 Nedjati-Gilani, P. Nouvellet, L. Okell, K. V. Parag, I. Siveroni, H. A. Thompson, P.
 Walker, C. E. Walters, O. J. Watson, L. K. Whittles, A. C. Ghani, N. M. Ferguson, S.
 Riley, C. A. Donnelly, S. Bhatt, S. Flaxman, State-level tracking of COVID-19 in the
 United States. Nat. Commun. 11, 6189 (2020). doi:10.1038/s41467-020-19652-6 Medline
41. S. Flaxman, S. Mishra, A. Gandy, H. J. T. Unwin, T. A. Mellan, H. Coupland, C. Whittaker,
 H. Zhu, T. Berah, J. W. Eaton, M. Monod, A. C. Ghani, C. A. Donnelly, S. Riley, M. A.
 C. Vollmer, N. M. Ferguson, L. C. Okell, S. Bhatt; Imperial College COVID-19
You can also read