Let's Talk about Climate Change: Mountain Region - Office of the Chief Ecosystem Scientist
←
→
Page content transcription
If your browser does not render page correctly, please read the page content below
Let’s Talk about Climate Change:
Mountain Region

Office of the Chief Ecosystem Scientist
Version 1.2 (August 28, 2017)
Let’s Talk about Climate Change: Mountain Region
Scott Parker
Parks Canada, Office of the Chief Ecosystem Scientist
248 Big Tub Road, Tobermory, Ontario N0H 2R0
e. scott.parker@pc.gc.ca

Special thanks to: Gilles Seutin, Patrick Nantel, Ryan Eagleson, Yanick Laliberté Tremblay, Liz
Nelson, Dan McKenney, Pia Papadopol, Jean-François Gobeil, Gavin Manson, Nicole Couture,
Claire LaCroix, Derek Petersen, Brenda Shepherd, Shelley Humphries, Sarah Boyle, Robert
Sissons, Jane Park, Jonathan Large, Denis Madsen, Danielle Backman and Elyse Mathieu.

 This report is one in a series that provides a regional summary of observed and projected
 climate change trends and impacts facing all of Canada’s national parks, national marine
 conservation areas and certain national historic sites. This is an internal document to Parks
 Canada and is intended to encourage and inform broader conversations and support place–
 based actions on climate change.

 The “Let’s Talk about Climate Change” series regions are defined by biogeoclimatic and
 operational similarities, and include: 1) Atlantic Region; 2) Quebec Region; 3) Great Lakes
 Region; 4) Prairie and Boreal Plains Region; 5) Mountain Region; 6) Pacific Region; 7)
 Northwest Region; and, 8) Arctic and Hudson Plains Region.

This report and others in the series are available at the Parks Canada Climate Change SharePoint
Website: http://collaboration/sites/PD010/SitePages/Home.aspx
Contents
1. Introduction ................................................................................................................................. 1
   1.1. “Natural Solution” Concept ................................................................................................. 1
2. Observed and Projected Climate Trends..................................................................................... 3
   2.1 Methods................................................................................................................................. 3
   2.2 Regional Climate Change Summaries .................................................................................. 3
       2.2.1 Physical Effects .............................................................................................................. 3
           Banff National Park .......................................................................................................... 10
           Bar U Ranch National Historic Site .................................................................................. 11
           Glacier National Park ........................................................................................................ 12
           Jasper National Park ......................................................................................................... 13
           Kootenay National Park .................................................................................................... 14
           Mount Revelstoke National Park ...................................................................................... 15
           Waterton Lakes National Park .......................................................................................... 16
           Yoho National Park........................................................................................................... 17
       2.2.2 Other Effects ................................................................................................................ 21
           Ecosystems and Biodiversity ............................................................................................ 21
           Visitor Experience ............................................................................................................ 22
           Assets and Infrastructure................................................................................................... 23
           Cultural Resources ............................................................................................................ 24
3. Climate Change Actions ........................................................................................................... 26
   3.1 Adaptation ........................................................................................................................... 26
   3.2 Mitigation ............................................................................................................................ 27
   3.3 Possible Next Steps ............................................................................................................. 28
4. References ................................................................................................................................. 29
Appendix 1. Climate Change Projections ..................................................................................... 40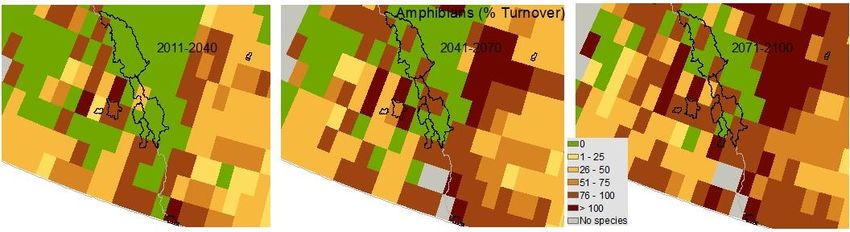
1. Introduction
The fifth and most recent report from the Intergovernmental Panel on Climate Change (IPCC,
2014) establishes with certainty that the Earth’s climate system is warming, “and since the
1950’s, many of the observed changes are unprecedented over decades to millennia”. Human
activity has increased atmospheric concentrations of greenhouse gas (GHG) to levels not
observed in at least the last 800,000 years. Worldwide, a rapidly changing climate is having
profound impact on our social-ecological systems, amplifying existing risks and creating new
ones.
Canada’s rate of warming is about double the global rate (even greater in the north) and the last
three decades have been the warmest 30-year period in at least 1,400 years. Some of the
observed changes include shifts in species distribution and abundance, glacier loss, thawing
permafrost, decreasing sea ice, earlier ice break-ups, increasing wildfires, sea level rise along
some coasts, changes to phenology, and an increase in extreme weather events such as heat
waves, droughts, heavy rainfall and more (e.g., Lemmen et al., 2016; Warren and Lemmen,
2014). The risks and impacts are felt across Parks Canada, from the ecosystems and cultural
resources we protect, to the facilities and infrastructure we build and maintain, to the visitor
experiences we offer - and most concerning, these impacts are projected to increase for decades
to come. It is an uncertain and complex context, one which will test the adaptive capacity and
effectiveness of policy, planning, and management frameworks.
To advance place-based climate response efforts, this document is one in a series of regional
reports that provides accessible summary information about climate change in Canada’s national
parks, national marine conservation areas (NMCAs) and certain national historic sites. For some
sites this will support preliminary conversations on climate change and for others the content will
be eclipsed by a need for more detailed vulnerability assessments, adaptation strategies and
decision support tools. Regardless, the intent is to encourage and equip individuals and sites to
talk about climate change, both internally and externally, and consider the challenges in their
own context.
1.1. “Natural Solution” Concept
As a lead conservation and protected area agency, and the largest federal land owner and third
largest federal asset manager in the country, Parks Canada’s response to climate change is a
matter of importance. Part of the response will involve recognizing and positioning protected
areas as a “natural solution” to climate change in regional, national and international plans and
programs (e.g., Dudley et al., 2010; Lopoukhine et al., 2012; NAWPA, 2012).
As a “natural solution”, well-designed and effectively managed protected areas:
Mitigate climate change through the sequestration and storage of carbon in forests,
coastal wetlands (“blue carbon”) and other natural ecosystems.
Protect biodiversity by providing a safe haven for species.
Enhance connectivity and species movements within and across protected area networks.
1
Provide essential ecosystem goods and services, such as clean water, erosion control,
flood/storm water protection, genetic diversity, cultural opportunities, etc…
Serve as a benchmark for climate change related research and monitoring.
Provide a context for social learning, good governance, and adaptive management.
Help people and communities cope by supporting sustainable and resilient economies in
and around protected areas and promoting social well-being (e.g., healthy parks – healthy
people).
Demonstrate environmental stewardship through “green” design and conservation
practices.
Create and facilitate meaningful experiences that help to inspire, inform, and guide
actions in response to climate change.
Jasper NP
Banff NP
Glacier NP
Yoho NP
Mount Revelstoke NP
Kootenay NP
Bar U Ranch NHS
Waterton Lakes NP
Figure 1. National Parks (NP) and the National Historic Site (NHS) included in this regional assessment.
2
2. Observed and Projected Climate Trends
This section provides site specific summaries of historic observed temperature and precipitation
trends as well as future climate projections. These are only a subset of the climate variables
available for analysis and presentation (see Appendix 1).
2.1 Methods
Historic observed mean monthly temperature and total precipitation data was accessed from the
Adjusted and Homogenized Canadian Climate Data website (http://www.ec.gc.ca/dccha-ahccd)
for the climatological stations within or closest to each protected area. Temperature and
precipitation stations were not always in the same location and preference was given to selecting
stations with the longest and most current data for a protected area. All available years were
plotted and the trend was determined using a generalized linear model (R Core Team, 2014)
including 95% confidence intervals. For the analysis, winter = December, January and February;
spring = March, April and May; summer = June, July and August; and, autumn = September,
October and November.
A table with future climate change projections was determined for the centre of each protected
area. Season by season descriptions were provided to complement the earlier park-based
assessments by Scott and Suffling (2000) and to help inform seasonal operations and activities.
The climate projections were determined following Price et al. (2011) and used the average of
four General Circulation Models (GCMs) and the lowest and highest Representative
Concentration Pathway (RCP) GHG scenarios (Vuuren et al., 2011). The RCP 2.6 (lowest)
scenario assumes that we take action and GHG emissions peak in 2010-2020 and decline
thereafter. The RCP 8.5 (highest) scenario assumes we take no action and emissions continue to
rise throughout the 21st century. Figures 2 and 3 also include a projection based on the RCP 4.5
scenario, where emissions peak around 2040 and then decline.
2.2 Regional Climate Change Summaries
2.2.1 Physical Effects
The average annual air temperature for the region has increased by 2˚C since the 1950’s,
which exceeds the global land surface average increase of 1.2˚C (DeBeer et al., 2016).
The warming has been slightly greater for the nighttime versus daytime period (Vincent
et al., 2012). Seasonally, the greatest warming has occurred in the winter (~3.9˚C) with
spring arriving as much as 5 to 20 days earlier (Vincent et al., 2015). This warming trend
is projected to continue and model results indicate a further increase of 2-8˚C by 2100,
depending on the location and RCP scenario applied.
Extreme heat events have increased in many areas, while extreme cold events have
decreased in virtually all areas (Mekis et al., 2015). This trend is expected to continue, in
particular, an increase in the frequency, intensity and duration of heat events (IPCC,
2012). For instance, the 1 in 20 year extreme heat event is projected to become a 1 in 5
year event by mid-century (Kharin et al., 2007).
3
Precipitation patterns have been variable, with a general increase in total annual
precipitation of ~14% (50 mm) being observed in many areas in the region (Chun et al.,
2013; DeBeer et al., 2016; Millett et al., 2009). In winter there is a clear distinction
between an increase in precipitation in the north and a decrease in the south (as much as
50%). Increasing temperatures have resulted in an increase in the fraction of precipitation
that falls as rain versus snow. Snowpack in the region is declining (Pederson et al., 2011).
Change in frequency and intensity of heavy rainfall events are difficult to identify at the
regional scale given the highly localized nature of such events and the low density of
climate stations in the region (Mekis et al., 2015). However, the persistence of multi-day
rainfall storms at many sites has increased and the number of single day events has
decreased (Shook and Pomeroy, 2012).
Drought conditions appear to be variable on a decadal-scale. In the future the southern
prairie region, in particular, is expected to have a higher likelihood of drought conditions
(Bonsal et al., 2013; Sushama et al., 2010).
Permafrost has an isolated distribution (affected by elevation and latitude) in the region
and there is evidence of its on-going degradation (Smith, 2010; Warren and Lemmen,
2014). In some areas the thawing permafrost is leading to decreased substrate stability,
surface subsidence, waterlogging, and thermokarst development (e.g., Baltzer et al.,
2014; Walvoord and Kurylyk, 2016; Warren et al., 2013).
Snow cover duration and extent has declined in recent decades (e.g., Derksen and Brown,
2012).
Since the mid-20th century the duration of ice cover on lakes and rivers has generally
reduced and spring breakup is occurring one to several weeks earlier (Beltaos and
Prowse, 2009; Prowse, 2012). This trend is expected to continue with breakup dates
advancing by 1 to 3½ weeks and freeze-up dates being delayed by up to 2 weeks (Dibike
et al., 2012; Warren and Lemmen, 2014).
Trends in river flow vary regionally and over
time. A general increase in autumn and winter
flows have been observed, while spring and
summer flows appear to be inconsistent.
Decreased flows are expected in the Athabasca
River, tributaries of the Saskatchewan River and
other rivers along the eastern slopes of the
Rocky Mountains (Kerkhoven and Gan, 2011;
Kienzle et al., 2012; Peters et al., 2013; St
Jacques et al., 2013; St Jacques et al., 2010).
Glacier ice melt (excluding seasonal snow
cover) contributes to river flow throughout the
region. For instance, glacial melt was found to
supply 3% of the annual flow and as much as 8-
20% of the late summer flow to the Bow River
in Calgary (Bash and Marshall, 2014; Naz et al.,
2014) and similarly, glacial melt supplied 6% of
the annual flow and as much as 25-35% of the
late summer flow to the upper Columbia River
(Jost et al., 2012). Reduction in river flow is
4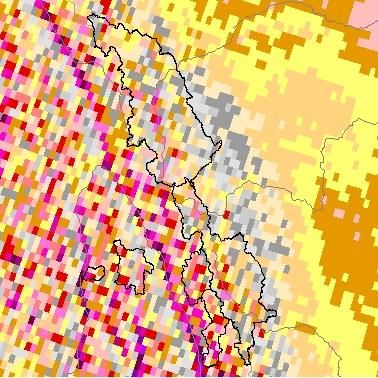
expected to be commensurate with a reduction in glacier area (e.g., Comeau et al., 2009).
The Canadian Rockies Hydrological Observatory maintains real time data for glaciers in
Banff and Jasper (http://www.usask.ca/hydrology/CRHO.php).
Adding to the complexity of climate change and river flows, positive phases of the
Pacific Decadal Oscillation (~60year cycle), positive phases of the El Niño-Southern
Oscillation and/or strong Aleutian lows increase the likelihood of a warm and dry winter
and spring in the region, and therefore decreased river flows (St Jacques et al., 2014).
Summer and autumn correlations are weaker. A cool and wet winter and spring tends to
be associated with the opposite phases (Fleming and Whitfield, 2010).
Glaciers across Canada are mostly retreating and showing a negative net mass balance
(Moore et al., 2009). Peyto Glacier (Banff NP) is perhaps the most studied glacier in the
region and has retreated 1.6 km between 1952 and 2014 and lost over 32 m of water
equivalent depth since 1965 (DeBeer et al., 2016; Demuth and Ednie, 2016; Hopkinson
and Demuth, 2006). Within the Columbia Mountains (e.g., Glacier and Mount Revelstoke
NPs) the rate of glacier mass balance decline in the last 30 years exceeds that observed
over the last 250 years (Wood and Smith, 2013). It is estimated that by 2100, “the volume
of glacier ice in western Canada will shrink by 70 +/- 10% relative to 2005” (Clarke et
al., 2015).
A study of the regional change in avalanche activity remains inconclusive (Bellaire et al.,
2016).
Areas currently prone to high wind events will continue to be vulnerable. There is some
suggestion that extreme events will increase slightly in the region, at least in the autumn
(Cheng et al., 2014; Haughian et al., 2012).
5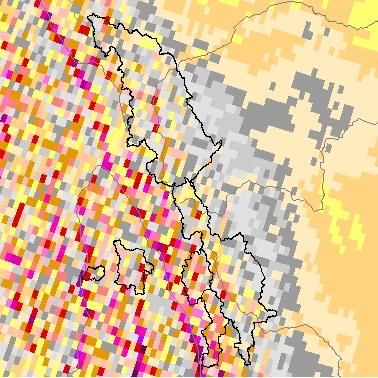
Mean Annual Temperature
                                          Change from 1980-2010 Baseline

                    RCP 2.6                           RCP 4.5                              RCP 8.5
  2011-2040
  2041-2070
  2071-2100

 Change from baseline (˚C)
              0.0   1.0      2.0    3.0       4.0      5.0      6.0       7.0      8.0

              0.5   1.5      2.5    3.5       4.5      5.5      6.5       7.5      8.5+

Figure 2a. Jasper, Banff, Kootenay, Yoho, Glacier and Mount Revelstoke NPs. Temperature projections represent a
composite (average) of four spatially interpolated downscaled Global Circulation Models: CanESM2,
CESM1CAM5, HADGEM2ES and MIROCESM, using three greenhouse gas scenarios (RCPs) for three future time
periods. Climate data provided by Natural Resources Canada, Canadian Forest Service, Sault Ste. Marie
(http://cfs.nrcan.gc.ca/projects/3).

                                                       6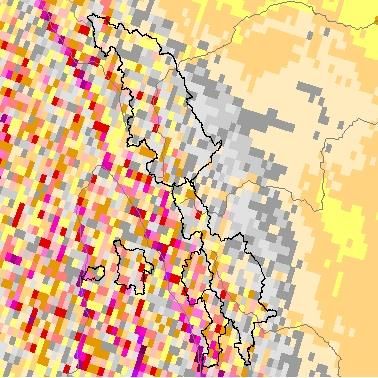
Mean Annual Temperature
                                          Change from 1980-2010 Baseline

                   RCP 2.6                          RCP 4.5                             RCP 8.5
 2011-2040
 2041-2070
 2071-2100

 Change from baseline (˚C)
             0.0   1.0       2.0    3.0       4.0    5.0      6.0       7.0      8.0

             0.5   1.5       2.5    3.5       4.5    5.5      6.5       7.5      8.5+

Figure 3b. Waterton Lakes NP and Bar U Ranch NHS (dot). Temperature projections represent a composite
(average) of four spatially interpolated downscaled Global Circulation Models: CanESM2, CESM1CAM5,
HADGEM2ES and MIROCESM, using three greenhouse gas scenarios (RCPs) for three future time periods.
Climate data provided by Natural Resources Canada, Canadian Forest Service, Sault Ste. Marie
(http://cfs.nrcan.gc.ca/projects/3).

                                                     7
Total Annual Precipitation
Change from 1980-2010 Baseline
RCP 2.6 RCP 4.5 RCP 8.5
Change from baseline (mm)
< -500 -400 - -300 -200 - -100 0 - 100 200 - 300 400 - 500
-500 - -400 -300 - -200 -100 - 0 100 - 200 300 - 400 > 500
Figure 3a. Jasper, Banff, Kootenay, Yoho, Glacier and Mount Revelstoke NPs. Precipitation projections represent a
composite (average) of four spatially interpolated downscaled Global Circulation Models: CanESM2,
CESM1CAM5, HADGEM2ES and MIROCESM, using three greenhouse gas scenarios (RCPs) for three future time
periods. Climate data provided by Natural Resources Canada, Canadian Forest Service, Sault Ste. Marie
(http://cfs.nrcan.gc.ca/projects/3).
8Total Annual Precipitation
Change from 1980-2010 Baseline
RCP 2.6 RCP 4.5 RCP 8.5
2011-2040
2041-2070
2071-2100
Change from baseline (mm)
< -500 -400 - -300 -200 - -100 0 - 100 200 - 300 400 - 500
-500 - -400 -300 - -200 -100 - 0 100 - 200 300 - 400 > 500
Figure 3b. Waterton Lakes NP and Bar U Ranch NHS (dot). Precipitation projections represent a composite
(average) of four spatially interpolated downscaled Global Circulation Models: CanESM2, CESM1CAM5,
HADGEM2ES and MIROCESM, using three greenhouse gas scenarios (RCPs) for three future time periods.
Climate data provided by Natural Resources Canada, Canadian Forest Service, Sault Ste. Marie
(http://cfs.nrcan.gc.ca/projects/3).
9Banff National Park A. Mean Temperature Seasonal mean temperature at Banff Climatological Station (3050519) from 1887 to 2015. A significant trend (P
Bar U Ranch National Historic Site
A. Mean Temperature

Seasonal mean temperature at High River Climatological Station (3033250) from 1902 to 2007. A significant trend
(P
Glacier National Park
A. Mean Temperature

Seasonal mean temperature at Glacier Climatological Station (1173191) from 1908 to 2014. A significant trend
(P
Jasper National Park
A. Mean Temperature

Seasonal mean temperature at Jasper Climatological Station (3053536) from 1926 to 2015. A significant trend
(P
Kootenay National Park
A. Mean Temperature

Seasonal mean temperature at Golden Climatological Station (1173210) from 1902 to 2015. A significant trend
(P
Mount Revelstoke National Park
A. Mean Temperature

Seasonal mean temperature at Glacier Climatological Station (1173191) from 1908 to 2014. A significant trend
(P
Waterton Lakes National Park
A. Mean Temperature

Seasonal mean temperature at Pincher Creek Climatological Station (3035198) from 1893 to 2015. A significant
trend (P
Yoho National Park
A. Mean Temperature

Seasonal mean temperature at Golden Climatological Station (1173210) from 1902 to 2015. A significant trend
(P
RCP 2.6 RCP 8.5
Figure 4. Projected increase in wildfire season length in days from baseline (1981-2010) by 2071-2100 under RCP
2.6 and 8.5 scenarios (data source: http://cfs.nrcan.gc.ca/fc-data-catalogue).
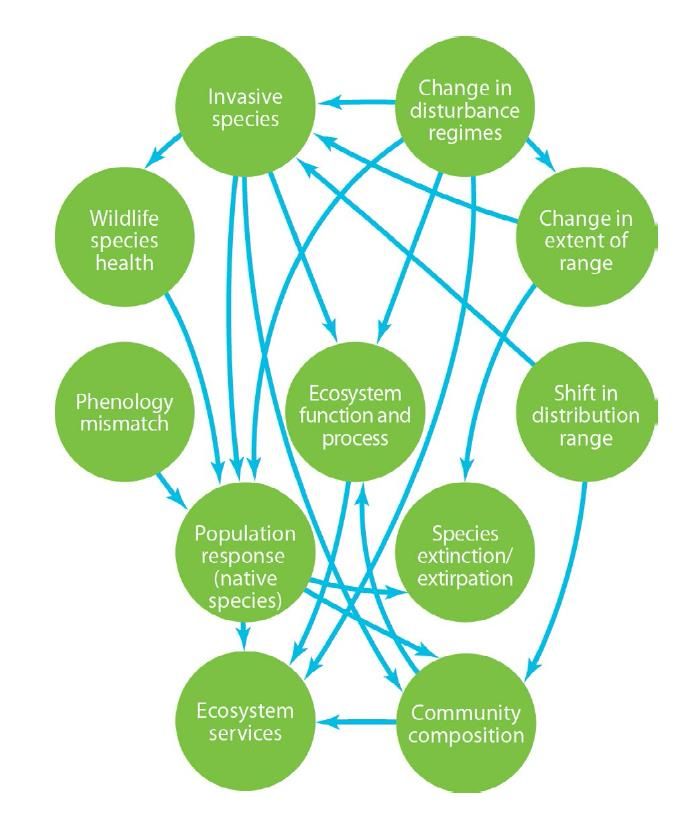
Figure 5. The complex ecosystem linkages and interactions to climate change (from Nantel et al., 2014)
1819
Figure 6. Percentage of projected species turnover (50 km x 50 km grid) relative to current species occurrence, assuming full dispersal (i.e., species can move
into new areas) using ten coupled atmosphere-ocean general circulations models (AOGCMS) as in Lawler et al. (2009) and the A2 emission scenario. Species
turnover is calculated as a composite measure of species loss (i.e., % of species currently in a cell whose projected future range does not include the cell) and
species gain (i.e., % increase in species due to range expansion). Data and analysis discussed further in Lindsay et al. (2016).

                                                                                20
2.2.2 Other Effects
Ecosystems and Biodiversity
The length of the wildfire season, annual area burned and seasonal severity rating are all
projected to increase for the region (Flannigan et al., 2013; Haughian et al., 2012; Seidl
et al., 2017; Wang et al., 2015).
Drought stress is a concern in some areas, e.g., Jasper’s aspen and low-elevation spruce
forests (Brett, 2016).
Species response to climate change will vary with abiotic (e.g., isolated by fragmented
landscape or island context, thermal conditions, etc…), biotic (e.g., competition, habitat)
and physiological stresses. Some species, or variant forms, will survive and adapt, while
others may move or face extinction (e.g., Pecl et al., 2017).
From a global perspective, vertebrate population abundances have declined by 58%
between 1970 and 2012 (WWF, 2016). Projections estimate that ~60% of plants and
~35% of animals will lose over half of their range by 2080 due to climate change
(Warren et al., 2013). The median rate of northward migration, for those species where
migration is even attainable, is ~16.9 km/decade (Chen et al., 2011).
Increasing stream and lake temperatures (e.g., less glacial inputs, warmer air temperature)
will alter habitat conditions and may exceed the thermal tolerance for some cold/cool-
water fishes (e.g., Poesch et al., 2016), insects (e.g., Treanor et al., 2013) and plankton
communities (e.g., Hobbs et al., 2011; Messner et al., 2013; Strecker et al., 2004).
Thermal tolerance extends to terrestrial species as well. For instance, American pikas
appear to lack the physiological ability to cope with high ambient temperatures (e.g.,
>28°C)(Otto et al., 2015).
Climate change will influence environmental chemistry and pollutants, including an
exacerbation of the effects of acid deposition (lower pH due to higher CO2 levels),
nutrient loading (precipitation events), and mercury toxicity (released under anoxic
conditions, warmer waters increase the rate of methylation) (e.g., Michalak, 2016; Noyes
et al., 2009).
“Temperature velocities” for forest biomes are estimated to move northward at the rate of
0.43 km/yr for the boreal forest and 0.35 km/yr for the temperate broadleaf forest
(McKenney et al., 2011; Warren et al., 2013). However, colonization success will vary
with (micro)topography, permafrost conditions, dispersal competition, soil, precipitation
patterns, disturbance regimes, pollinators and many other factors (e.g., Jacobs et al.,
2014; Lafleur et al., 2010; McKenney et al., 2007; Warren et al., 2013). Nationally, it is
suggested that vegetation distribution (biomes) will change in over half of Canada`s
national park (Scott et al., 2002).
Langdon and Lawler (2015) found that projected climate change, biome shifts and
species turnover in protected areas increased along a longitudinal gradient from low
along the Pacific Coast, to higher in the Rocky Mountains.
Increasing aridity may decrease dominance of spruce, fir, western hemlock, etc. in favour
of species such as ponderosa pine, aspen, etc. (Hogg and Bernier, 2005). In extreme
events, even drought-resistant parkland species may be replaced by scrub or grassland
(Allen et al., 2010; Michaelian et al., 2011).
21 Cerney et al. (2008) observed an increase in forest cover from 1914 to 2005 in Waterton
Lakes NP through vertical migration and infill of conifers and aspen. Similar
photographic comparison work was completed in the montane ecoregion of Jasper NP
(Rhemtulla et al., 2002).
Wildlife species will continue to experience range shifts and changes in abundance (e.g.,
National Audubon Society, 2015).
Asynchrony between life history events has been observed. Although photoperiod is not
changing, other ecological cues are, such as temperature, river flow, etc. For example,
earlier peaks in insect and plant biomass have been observed, mismatching with migrant
bird hatchling growth and development (Knudsen et al., 2011; Nituch and Bowman,
2013).
The distribution and impacts of pathogens and parasites are expected to increase with
warmer temperatures and the northward migration of species (Marcogliese, 2008; 2016;
Pickles et al., 2013).
A warmer, drier climate is expected to be more favourable for forest insect and disease
outbreaks such as mountain pine beetle, western spruce budworm, spruce beetle, forest
tent caterpillar, etc… (e.g., Gauthier et al., 2014; Haughian et al., 2012; Sturrock et al.,
2011; Weed et al., 2013). Brett (2016) provides a current update for forest insect and
disease status for the regions national parks.
A study of grizzly bear plant food presence and climate change was undertaken. Results
provided an idiosyncratic response, with some plant species persisting and/or increasing
while others declined and/or shifted their range (Roberts et al., 2014).
The extent of alpine tundra ecosystem will decrease with warming temperatures (e.g.,
shrinking permafrost, vertical encroachment of new species). This ecosystem provides
important habitat for pika, water vole, least chipmunk, ptarmigan, caribou, grizzly bear,
bighorn sheep, mountain goat and many other species.
The upward movement of the treeline can be facilitated by whitebark pine colonization
(e.g., pioneer “tree islands”), however, this process is increasing confounded by
incidences of drought and blister rust and bark beetle infestation (Tomback et al., 2014).
Wong and Daniels (2017) explain the multiple factors, including climate, that resulted in
whitebark pine decline in Waterton Lakes NP.
Visitor Experience
Due to an earlier spring and warmer summer and autumn conditions, annual visitation for
the regions national parks are projected to increase by 3-29% for 2020s and 4-56% for
2050s depending on the park and climate scenario used, with most of the increase
occurring in the spring and autumn (Scott and Jones, 2005; Scott and Jones, 2006; Scott
et al., 2007).
The potential impact of climate change on nature-based tourism at Waterton Lakes NP
was examined (Scott et al., 2007). Under some future scenarios annual visitation may be
reduced because of diminished attractiveness.
When temperatures exceeded 25-30˚C, a strong decrease in visitation has been observed
in some parks (Fisichelli et al., 2015; Hewer et al., 2016).
It may be necessary to extend the operating season to accommodate visitor safety and
demand.
22 Decreased snowpack will negatively impact recreational activities such as snowshoeing,
skiing, ice fishing, ice travel and snowmobiling. By relying on natural snow Banff’s
average ski season at low elevations (1,600 m) is projected to decrease by ~50% in the
2020s and 66-94% in the 2050s (Scott and Jones, 2005).
Snowmaking may become an important adaption for the regions ski operations,
particularly at low elevations (Scott and Jones, 2005). Naturally there are limitation if the
weather, especially in October and November, is too warm to make snow. As an
example, the November 2016 Alpine Ski World Cup at Lake Louise was cancelled due to
poor snow conditions at the base of the runs. Temperatures in the preceding weeks had
been too warm to supplement natural snow with snowmaking.
In terms of human health, there may be heat related concerns during extreme temperature
events, as well there may be concerns due to increases in disease risks. For example,
Lyme disease (bacterial disease transmitted by an infected tick) which was formerly
restricted to localized areas by temperature and relative humidity, is expected to expand
by mid-century (Eisen et al., 2016; Ogden et al., 2006). Some mosquito-borne diseases
also show a connection to climate change, including West Nile virus (note: besides
humans it can infect over 140 species including horses, crows, ravens, etc…) (Chen et
al., 2013; Kulkarni et al., 2015).
A longer and more intense fire season will affect visitor safety and experience (e.g.,
possible area closures, no campfires, or evacuations).
Visitor perceptions and consumer behaviour responses to climate change were recently
studied at Jasper NP (Groulx et al., 2017). 22.9% of visitors reported that they would not
have made trip to the Athabasca Glacier if conditions change as predicted for 2050, more
so (40.7%) if the feeling of naturalness is lost through adaptations (e.g., trail, fence,
bridge, helicopter).
Assets and Infrastructure
Flooding from extreme rainfall or rain on snow events may overwhelm stormwater
system capacities and damage or destroy infrastructure. For instance, a front country
bridge in Kootenay was destroyed by flood waters in 2012 and again in 2013. 2013 also
witnessed the evacuation of Baker Creek Chalets, closure of Waterfowl Lakes
campground, and road closures. In 2016 an ice jam (first on record) and winter floods
damages the Lake Louise campground and some pedestrian footbridges (personal comm.
Shelley Humphries).
An increase in extreme rainfall has been identified as a high risk to highway hillsides,
stabilized works, debris torrents, stream crossing, river train works and culvert
infrastructure, in similar environments (British Columbia, 2010; 2011). Moderate risks to
asphalt (hot in place) and bridge infrastructure from higher temperatures has also been
identified. An increase in freeze/thaw may be an impact in some areas.
Some facilities may be more vulnerable to the expected increase in wind gust events
(Cheng et al., 2014).
Further evaluation of high winds/downbursts and visibility/fog on highway infrastructure
may be needed (British Columbia, 2010).
There is an increasing risk to assets and infrastructure by wildfire damage in some areas.
More severe fire weather (heat and drought) may also create conditions where fire
suppression is no longer feasible or effective (Colombo, 2008; Flannigan et al., 2005).
23Cultural Resources
Increased damage or loss of cultural resources is possible during and post- flood, wildfire
and other disturbance events (Marissa et al., 2016).
Efforts to FireSmart (e.g., replace wood shake roofing) may influence the character or
cultural integrity of a facility (Marissa et al., 2016).
There is a potential for increased deterioration of facilities and collections (e.g., non-
mechanically ventilated interiors, HVACs) from increased temperature, humidity, and
precipitation, e.g., increased mold, rot and fungal decay; increased corrosion, etc…
(Brimblecombe, 2014; Brimblecombe and Brimblecombe, 2016; Horowitz et al., 2016;
Marissa et al., 2016).
Socio-economic impacts through lose or damage to cultural resources may occur.
Longer growing seasons and warmer conditions may lead to increased presence and
abundance of invasive plant species and pests (Marissa et al., 2016)
Micro-climates which allow historic gardens to flourish may be affected (e.g., Percy et
al., 2015).
24Figure 7. Example of rainfall intensity-duration-frequency curves for future climate scenarios. As illustrated, rainfall
intensity for the “1 in a 100 year” event at Pincher Creek (Waterton Lakes NP) is projected to increase from
124mm/hr to as much as 146mm/hr (5 minute duration) and at Jasper from 164mm/hr to as much as 232mm/hr (5
minute duration). The IDF_CC Tool (https://www.idf-cc-uwo.ca) permits user driven analysis of future projections
for climatological stations across the country.
253. Climate Change Actions
In general, most protected area agencies in Canada are only beginning to consider and develop
climate change policies, planning tools, and management frameworks (Lemieux et al., 2011)
(note: a draft Parks Canada climate change strategy, version 4.4, was last revised in 2008). There
are, however, examples of adaptation and mitigation actions already underway in individual sites
and within other jurisdictions that may inspire and guide actions (e.g., Gross et al., 2016;
Lemieux et al., 2010; US NPS, 2010).
3.1 Adaptation
Adaptation is an adjustment in natural or human systems in response to actual or expected
climate change impacts. Adaptation in protected areas often involves the implementation of
established ecosystem-based management practices. These actions can represent “no regrets”
since they broadly benefit the ecological and commemorative integrity at a site, regardless of the
rate of climate change. This includes working with regional partners to manage landscape level
disturbances; protecting and restoring ecosystems to build resilience; preventing the spread of
invasive species; protecting species at risk; conserving built heritage at historic sites; replacing
storm damaged resources and infrastructure with more sustainable and resilient designs; and,
responding to changing visitor interests and needs.
Other more regionally specific examples:
The Public Infrastructure Engineering Vulnerability Committee (PIEVC) has undertaken
various climate change engineering vulnerability assessments in the greater region
(outside parks), including projects on roads and associated structures, stormwater
management systems, and potable water facilities. These assessments include adaptation
recommendations (e.g., Associated Engineering Calgary, 2011; British Columbia, 2010;
2011; PIEVC, 2008).
Climate change scenario planning has been undertaken in Waterton Lakes NP by the
Crown Managers Partnership (Welling et al., 2014).
Lister et al. (2015) discuss climate change and wildlife-crossing infrastructure,
emphasizing an integrated and adaptive approach.
Hood and Bayley (2008) discuss how beaver’s may help to mitigate climate effects by
maintaining wetlands.
Design or retrofit stormwater systems and hydraulic structures to accommodate new
“normal” precipitation and temperature patterns. For example, replacing “like with like”
culverts is ineffective if they remain undersized or continue to fill with debris. Larger
structures can serve both a drainage and road “ecopassage” function, thus making
landscape more permeable to water flow and species movements.
In one study, 58% of Banff visitors indicated they would like to see interpretive programs
explaining how climate change is affecting the park (Scott and Jones, 2005). Here is an
opportunity to communicate climate change through park programs and exhibits,
including the risks to biodiversity and ecosystems, and the connection between GHG
reductions and park stewardship.
26Jasper Lake Louise, Yoho, Kootenay
4,549
5,000 3,000
4,354
Targets Targets
4,081
2,750
3,973
4,500 GHG
3,769
GHG
Tonnes of GHGs
Tonnes of GHGs
2,252
Emissions
2,186
Emissions
3,653 3,643
2,717
2,714
2,500
2,701
3,410
2,1251,715
4,000
2,610
3,433
2,506
2,250
3,577 2,929
3,500
2,239
2,000
2,147
2,169
2,177
3,540
2,102
3,502
2,135
2,080
3,464
2,057
3,426
3,404
3,615
3,361
2,035
3,389
2,013
3,000 1,750
2,500 1,500
Fiscal Year Fiscal Year
Mt. Revelstoke, Glacier Waterton / Bar U
1,000
924
Targets 2,200
886
1,867
1,812
Targets
1,804
900
1,755
GHG
1,882
2,000
783
Emissions
Tonnes of GHGs
1,664
Tonnes of GHGs
1,655
GHG
1,737 1,644
686
882
1,581
676
800 Emissions
1,556
856
1,800
782
1,755
1,361
700
757
1,719
762
1,600
1,701
754
734
1,683
726
1,665
718
1,647
710
1,629
703
750
742
600
659
1,400
500 1,200
Fiscal Year Fiscal Year
Highway Operations Banff
4,629
4,628
5,000 5,500
4,582
4,473
4,466
4,417
4,336
Targets 5,000 Targets
4,500 3,846
4,878
3,990
GHG 4,500 GHG
Tonnes of GHGs
Tonnes of GHGs
4,484
Emissions Emissions
4,438
3,385
3,511
4,345
4,000
4,299
4,253
4,206
4,000
4,160
4,091
3,500
4,392
4,043
4,019
3,997
3,955
3,903
3,886
3,832
3,467
3,714
3,500 3,000
3,674
3,635
3,595
3,556
3,203
3,793
3,753
3,606
2,500
3,000
2,000
Fiscal Year Fiscal Year
Figure 8. Greenhouse Gas Emissions per Field Unit. Emissions are calculated from energy (e.g., heating,
electricity) and fuel expenditures, excluding travel, air charters, and some other sources. GHG emissions from
energy cost are adjusted for source (e.g., coal, hydro, diesel, etc...). The targets in these figures are from 2015
reduction targets (Parks Canada, 2015). Revised, lower targets to be communicated in 2017 (Canada, 2016).
3.2 Mitigation
Mitigation refers to human interventions that reduce the source or enhance the sinks of GHG
emissions. Carbon dioxide, methane, nitrous oxide, water vapour and ozone are the primary
GHGs in the earth’s atmosphere, in addition to human-made chlorine- and bromine-containing
substances. Parks Canada’s Asset and Environmental Management team provides national
27functional leadership, expertise and support related to GHG reductions. Sites interested in
working on GHG reduction and more sustainable operations should confer with this team. As an
example, this team annually tracks all Field Unit energy expenditures and GHG emissions and
reports progress towards federal government reduction targets. The current target is 40%
reduction in GHG emissions from federal buildings and fleets below the 2005 levels by 2030
(Canada, 2016); it is clear that this will require an ambitious and concerted effort on the part of
all.
Sharma et al. (2013) analysed carbon dynamics within Yoho, Kootenay and Glacier NP’s and
determined that these parks had higher carbon stocks and greater CO2 uptakes as compared to
their surrounding areas. The results highlight a potential benefit of protected areas in carbon
sequestration and storage. As well, the report discusses the importance of ecological integrity
and the role of natural disturbance, such as fire and insect and disease, as sources of GHGes.
Mitigation examples include:
Evaluate progress towards Parks Canada / Field Unit GHG reduction targets.
Specify “green” and energy efficient designs for construction and renovation projects.
Reduce the number and/or size of park vehicles and vessels to match need and maximize
efficiency. Provide hybrid or electric where possible.
Electric utility and lawn vehicles for campground maintenance.
Anti-idling and cabin heat-recovery systems in trucks.
Use energy efficient products, promote energy efficiency and water conservation, reduce
waste and support alternative transportation.
Review Parks Canada (2015) and US NPS (2012a).
3.3 Possible Next Steps
This report is intended to be a stepping off point, from here individuals and sites are encourage to
consider how best to advance climate change actions in their own context. Here is a checklist of
ideas that others have considered that may be of particular interest or relevance.
Enhance workforce climate literacy (e.g., Peterson et al., 2011; US NPS, 2012b).
Undertake more detailed analysis of climate trends, including impact models (e.g.,
hydrology, wildfire, infrastructure at risk, coastal visualization) and extreme weather
events (e.g., Charron, 2016).
Conduct future scenario planning and explore operations under novel and equally
plausible future conditions. Use scenarios to test (“wind tunnel”) strategic decisions and
inform contingency plans (e.g., Gross et al., 2016; US NPS, 2013; Welling et al., 2014).
Conduct vulnerability assessments of species, ecosystems or governance structures.
Vulnerability is the degree to which a system is susceptible to, and unable to cope with,
the impacts of climate change (e.g., Edwards et al., 2015; Gleeson et al., 2011; Gross et
al., 2016).
28 Incorporate climate change impacts and adaptation strategies into management planning.
Recalibrate management objectives in the face of ecosystem change, system novelty and
loss of resilience (e.g., Lemieux et al., 2011).
Revise visitor management and operational plans in response to changing visitor patterns
and use (e.g., Fisichelli et al., 2015; Hewer et al., 2016). Diversify visitor experiences to
provide alternatives to weather-dependent activities.
Quantify and understand carbon stocks and dynamics (e.g., US NPS, 2012a).
Evaluate and communicate the value of ecological goods and services (e.g., clean
water/air, provision of food, maintain biodiversity, nature-based tourism, carbon storage,
etc…) and manage for the sustainability of these services (e.g., Gross et al., 2016).
Maintain a list of climate science and management actions to help inform and influence
park messaging.
Build networks and collaborate across multiple scales (e.g., Waterton Lakes NP,
crownmanagers.org).
“FireSmart” facilities and infrastructure (Hirsch et al., 2001).
Consider the Public Infrastructure Engineering Vulnerability Committee (PIEVC)
protocol (https://pievc.ca/protocol) in climate change vulnerable infrastructure projects.
“Explicitly recognize climate change as a management issue in state of the park reporting
and monitoring frameworks”. This adaption option was one of two from 165 options
deemed as necessary and “definitely implementable” by senior decision-makers for the
Ontario park system (Lemieux and Scott, 2011).
Please contact the Office of the Chief Ecosystem Scientist if you have any questions or would
like to explore any of these next steps further. In addition, PDF copies of all references and the
climate data are freely available upon request.
4. References
Allen, C. D., Macalady, A. K., Chenchouni, H., Bachelet, D., McDowell, N., Vennetier, M.,
Kitzberger, T., Rigling, A., Breshears, D. D., Hogg, E. H., Gonzalez, P., Fensham, R.,
Zhang, Z., Castro, J., Demidova, N., Lim, J.-H., Allard, G., Running, S. W., Semerci, A.,
and Cobb, N. (2010). A global overview of drought and heat-induced tree mortality
reveals emerging climate change risks for forests. Forest Ecology and Management,
259(4), 660-684. doi:10.1016/j.foreco.2009.09.001.
29Associated Engineering Calgary. (2011). City of Calgary Water Supply Infrastructure, Climate
Change Vulnerability Risk Assessment. https://pievc.ca/city-calgary-potable-water-
collection-treatment-and-distribution-system.
Baltzer, J. L., Veness, T., Chasmer, L. E., Sniderhan, A. E., and Quinton, W. L. (2014). Forests
on thawing permafrost: fragmentation, edge effects, and net forest loss. Global Change
Biology, 20(3), 824-834.
Bash, E. A. and Marshall, S. J. (2014). Estimation of glacial melt contributions to the Bow River,
Alberta, Canada, using a radiation-temperature melt model. Annals of Glaciology, 55(66),
138-152. doi:10.3189/2014AoG66A226.
Bellaire, S., Jamieson, B., Thumlert, S., Goodrich, J., and Statham, G. (2016). Analysis of long-
term weather, snow and avalanche data at Glacier National Park, BC, Canada. Cold
Regions Science and Technology, 121, 118-125. doi:10.1016/j.coldregions.2015.10.010.
Beltaos, S. and Prowse, T. (2009). River-ice hydrology in a shrinking cryosphere. Hydrological
Processes, 23(1), 122-144. doi:10.1002/hyp.7165.
Bonsal, B. R., Aider, R., Gachon, P., and Lapp, S. (2013). An assessment of Canadian prairie
drought: past, present, and future. Climate Dynamics, 41(2), 501-516.
doi:10.1007/s00382-012-1422-0.
Brett, R. (2016). 2016 Forest Health Conditions in the Rocky Mountains National Parks.
Canadian Forest Service, Norther Forestry Centre
Brimblecombe, P. (2014). Refining climate change threats to heritage. Journal of the Institute of
Conservation, 37(2), 85-93. doi:10.1080/19455224.2014.916226.
Brimblecombe, P. and Brimblecombe, C. (2016). Climate Change and Non-mechanically
Ventilated Historic Interiors. APT Bulletin, 47(1), 31-38.
http://www.jstor.org/stable/43799261
British Columbia. (2010). Climate Change Engineering Vulnerability Assessment. Coquihalla
Highway (B.C. Highway 5) Between Nicolum River and Dry Gulch. B.C. Ministry of
Transportation and Infrastructure and Nodelcorp Consulting Inc. https://pievc.ca/british-
columbia-ministry-transportation-and-infrastructure-coquihalla-highway-hope-merritt-
section.
British Columbia. (2011). Climate Change Engineering Vulnerability Assessment. B.C.
Yellowhead Highway 16 Between Vanderhoof and Priestly Hill. B.C. Ministry of
Transportation and Infrastructure and Nodelcorp Consulting Inc.
https://pievc.ca/sites/default/files/bcmoti_yellowhead_highway_-
_vulnerabuility_report_web.pdf.
Canada. (2016). A Federal Sustainable Development Strategy for Canada 2016–2019.
http://fsds-sfdd.ca/index.html#/en/intro/.
Cerney, D. L., Eyton, R. J., and Butler, D. R. (2008). Assessing landscape change in Waterton
Lakes National Park, Canada, using multitemporal composites constructed from
terrestrial repeat photographs. Geocarto International, 23(5), 347-371.
doi:10.1080/10106040801966654.
Charron, I. (2016). A Guidebook on Climate Scenarios: Using Climate Information to Guide
Adaptation Research and Decisions, 2016 Edition. Ouranos.
https://www.ouranos.ca/publication-scientifique/Guidebook-2016.pdf.
Chen, C. C., Jenkins, E., Epp, T., Waldner, C., Curry, P. S., and Soos, C. (2013). Climate
Change and West Nile Virus in a Highly Endemic Region of North America.
30International Journal of Environmental Research and Public Health, 10(7), 3052-3071.
doi:10.3390/ijerph10073052.
Chen, I. C., Hill, J. K., Ohlemuller, R., Roy, D. B., and Thomas, C. D. (2011). Rapid Range
Shifts of Species Associated with High Levels of Climate Warming. Science, 333(6045),
1024-1026. doi:10.1126/science.1206432.
Cheng, C. S., Lopes, E., Fu, C., and Huang, Z. Y. (2014). Possible Impacts of Climate Change
on Wind Gusts under Downscaled Future Climate Conditions: Updated for Canada.
Journal of Climate, 27(3), 1255-1270. doi:10.1175/jcli-d-13-00020.1.
Chun, K. P., Wheater, H. S., Nazemi, A., and Khaliq, M. N. (2013). Precipitation downscaling in
Canadian Prairie Provinces using the LARS-WG and GLM approaches. Canadian Water
Resources Journal, 38(4), 311-332. doi:10.1080/07011784.2013.830368.
Clarke, G. K. C., Jarosch, A. H., Anslow, F. S., Radic, V., and Menounos, B. (2015). Projected
deglaciation of western Canada in the twenty-first century. Nature Geoscience, 8(5), 372-
377. doi:10.1038/ngeo2407.
Colombo, S. J. (2008). Ontario’s Forests and Forestry in a Changing Climate. Ontario Ministry
of Natural Resources. https://www.ontario.ca/document/ontarios-forests-and-forestry-
changing-climate.
Comeau, L. E. L., Pietroniro, A., and Demuth, M. N. (2009). Glacier contribution to the North
and South Saskatchewan Rivers. Hydrological Processes, 23(18), 2640-2653.
doi:10.1002/hyp.7409.
DeBeer, C. M., Wheater, H. S., Carey, S. K., and Chun, K. P. (2016). Recent climatic,
cryospheric, and hydrological changes over the interior of western Canada: a review and
synthesis. Hydrology and Earth System Sciences, 20(4), 1573-1598. doi:10.5194/hess-20-
1573-2016.
Demuth, M. N. and Ednie, M. (2016). A Glacier Condition and Thresholding Rubric for Use in
Assessing Protected Area / Ecosystem Functioning. Natural Resources Canada,
Geological Survey of Canada.
http://geoscan.nrcan.gc.ca/starweb/geoscan/servlet.starweb?path=geoscan/fulle.web&sear
ch1=R=297892.
Derksen, C. and Brown, R. (2012). Spring snow cover extent reductions in the 2008-2012 period
exceeding climate model projections. Geophysical Research Letters, 39, 6.
doi:10.1029/2012gl053387.
Dibike, Y., Prowse, T., Bonsal, B., de Rham, L., and Saloranta, T. (2012). Simulation of North
American lake-ice cover characteristics under contemporary and future climate
conditions. International Journal of Climatology, 32(5), 695-709. doi:10.1002/joc.2300.
Dudley, N., Stolton, S., Belokurov, A., Krueger, L., Lopoukhine, N., MacKinnon, K., Sandwith,
T., and Sekhran, N. (2010). Natural Solutions: Protected areas helping people cope with
climate change. IUCN WCPA, TNC, UNDP, WCS, The World Bank and WWF, Gland,
Switzerland, Washington DC and New York, USA. https://www.iucn.org/content/natural-
solutions-protected-areas-helping-people-cope-climate-change.
Edwards, J. E., Pearce, C., Ogden, A. E., and Williamson, T. B. (2015). Climate Change and
Sustainable Forest Management in Canada : A Guidebook for Assessing Vulnerability
and Mainstreaming Adaptation into Decision Making. Canadian Council of Forest
Ministers. http://www.ccfm.org/english/coreproducts-cc.asp.
Eisen, R. J., Eisen, L., Ogden, N. H., and Beard, C. B. (2016). Linkages of Weather and Climate
with Ixodes scapularis and Ixodes pacificus (Acari: Ixodidae), Enzootic Transmission of
31Borrelia burgdorferi, and Lyme Disease in North America. Journal of Medical
Entomology, 53(2), 250-261. doi:10.1093/jme/tjv199.
Fisichelli, N. A., Schuurman, G. W., Monahan, W. B., and Ziesler, P. S. (2015). Protected Area
Tourism in a Changing Climate: Will Visitation at US National Parks Warm Up or
Overheat? PLoS ONE, 10(6), 13. doi:10.1371/journal.pone.0128226.
Flannigan, M., Cantin, A. S., de Groot, W. J., Wotton, M., Newbery, A., and Gowman, L. M.
(2013). Global wildland fire season severity in the 21st century. Forest Ecology and
Management. doi:10.1016/j.foreco.2012.10.022.
Flannigan, M. D., Logan, K. A., Amiro, B. D., Skinner, W. R., and Stocks, B. J. (2005). Future
Area Burned in Canada. Climatic Change, 72(1), 1-16. doi:10.1007/s10584-005-5935-y.
Fleming, S. W. and Whitfield, P. H. (2010). Spatiotemporal Mapping of ENSO and PDO Surface
Meteorological Signals in British Columbia, Yukon, and Southeast Alaska. Atmosphere-
Ocean, 48(2), 122-131. doi:10.3137/ao1107.2010.
Gauthier, S., Lorente, M., Kremsater, L., De Grandpré, L., Burton, P. J., Aubin, I., Hogg, E. H.,
Nadeau, S., Nelson, E. A., A.R., T., and Ste-Marie, C. (2014). Tracking climate change
effects: potential indicators for Canada’s forests and forest sector. Natural Resources
Canada, Canadian Forest Service (CFS), Ottawa.
https://cfs.nrcan.gc.ca/publications?id=35231.
Gleeson, J., Gray, P., Douglas, A., Lemieux, C. J., and Nielsen, G. (2011). A Practitioner’s
Guide to Climate Change Adaptation in Ontario’s Ecosystems. Ontario Centre for
Climate Impacts and Adaptation Resources, Sudbury, Ontario.
http://www.mnr.gov.on.ca/en/Business/ClimateChange/Publication/STDPROD_091282.
html.
Gross, J. E., Woodley, S., Welling, L. A., and Watson, J. E. M. (Eds.). (2016). Adapting to
Climate Change: Guidance for Protected Area Managers and Planners (Vol. No. 24).
Gland, Switzerland: IUCN. https://portals.iucn.org/library/node/46685.
Groulx, M., Lemieux, C. J., Lewis, J. L., and Brown, S. (2017). Understanding consumer
behaviour and adaptation planning responses to climate-driven environmental change in
Canada's parks and protected areas: a climate futurescapes approach. Journal of
Environmental Planning and Management, 60(6), 1016-1035.
doi:10.1080/09640568.2016.1192024.
Haughian, S. R., Burton, P. J., Taylor, S. W., and Curry, C. (2012). Expected Effects of Climate
Change on Forest Disturbance Regimes in British Columbia. Journal of Ecosystems and
Management, 12(1). http://jem.forrex.org/index.php/jem/article/view/152
Hewer, M., Scott, D., and Fenech, A. (2016). Seasonal weather sensitivity, temperature
thresholds, and climate change impacts for park visitation. Tourism Geographies, 18(3),
297-321. doi:10.1080/14616688.2016.1172662.
Hirsch, K., Kafka, V., Tymstra, C., McAlpine, R., Hawkes, B., Stegehuis, H., Quintilio, S.,
Gauthier, S., and Peck, K. (2001). Fire-smart forest management: A pragmatic approach
to sustainable forest management in fire-dominated ecosystems. Forestry Chronicle,
77(2), 357-363. doi:10.5558/tfc77357-2.
Hobbs, W. O., Vinebrooke, R. D., and Wolfe, A. P. (2011). Biogeochemical responses of two
alpine lakes to climate change and atmospheric deposition, Jasper and Banff National
parks, Canadian Rocky Mountains. Canadian Journal of Fisheries and Aquatic Sciences,
68(8), 1480-1494. doi:10.1139/f2011-058.
32Hogg, E. H. and Bernier, P. Y. (2005). Climate change impacts on drought-prone forests in
western Canada. Forestry Chronicle, 81(5), 675-682. doi:10.5558/tfc81675-5.
Hood, G. A. and Bayley, S. E. (2008). Beaver (Castor canadensis) mitigate the effects of climate
on the area of open water in boreal wetlands in western Canada. Biological Conservation,
141(2), 556-567.
Hopkinson, C. and Demuth, M. N. (2006). Using airborne lidar to assess the influence of glacier
downwasting on water resources in the Canadian Rocky Mountains. Canadian Journal of
Remote Sensing, 32(2), 212-222.
Horowitz, A. D., Lopez, M. F., Ross, S. M., and Sparenberg, J. A. (2016). Climate Change and
Cultural Heritage Conservation. A Literature Review. Association for Preservation
Technology (APT), Technical Committee on Sustainable Preservation’s Education and
Research focus group.
http://www.apti.org/clientuploads/Technical%20Committees/2015-2016/APT%20TC-
SP%20Literature%20Review%20Climate%20Change%20%20Cultural%20Heritage%20
Conservation%202016June30.pdf.
IPCC. (2012). Managing the Risks of Extreme Events and Disasters to Advance Climate Change
Adaptation. A Special Report of Working Groups I and II of the Intergovernmental Panel
on Climate Change, Cambridge University Press, Cambridge, UK, and New York, NY,
USA. https://www.ipcc.ch/pdf/special-reports/srex/SREX_Full_Report.pdf.
IPCC. (2014). Climate Change 2014: Impacts, Adaptation, and Vulnerability. Intergovernmental
Panel on Climate Change (IPCC). The Summary for Policymakers of the Working Group
II contribution to the Fifth Assessment Report. http://www.ipcc.ch/index.htm.
Jacobs, J. D., Chan, S., and Sutton, E. (2014). Climatology of the Forest-Tundra Ecotone at a
Maritime Subarctic-Alpine Site, Mealy Mountains, Labrador. Arctic, 67(1), 28-42.
Jost, G., Moore, R. D., Menounos, B., and Wheate, R. (2012). Quantifying the contribution of
glacier runoff to streamflow in the upper Columbia River Basin, Canada. Hydrology and
Earth System Sciences, 16(3), 849-860. doi:10.5194/hess-16-849-2012.
Kerkhoven, E. and Gan, T. Y. (2011). Differences and sensitivities in potential hydrologic
impact of climate change to regional-scale Athabasca and Fraser River basins of the
leeward and windward sides of the Canadian Rocky Mountains respectively. Climatic
Change, 106(4), 583-607. doi:10.1007/s10584-010-9958-7.
Kharin, V. V., Zwiers, F. W., Zhang, X. B., and Hegerl, G. C. (2007). Changes in temperature
and precipitation extremes in the IPCC ensemble of global coupled model simulations.
Journal of Climate, 20(8), 1419-1444. doi:10.1175/jcli4066.1.
Kienzle, S. W., Nemeth, M. W., Byrne, J. M., and MacDonald, R. J. (2012). Simulating the
hydrological impacts of climate change in the upper North Saskatchewan River basin,
Alberta, Canada. Journal of Hydrology, 412, 76-89. doi:10.1016/j.jhydrol.2011.01.058.
Knudsen, E., Linden, A., Both, C., Jonzen, N., Pulido, F., Saino, N., Sutherland, W. J., Bach, L.
A., Coppack, T., Ergon, T., Gienapp, P., Gill, J. A., Gordo, O., Hedenstroom, A.,
Lehikoinen, E., Marra, P. P., Moller, A. P., Nilsson, A. L. K., Peron, G., Ranta, E.,
Rubolini, D., Sparks, T. H., Spina, F., Studds, C. E., Saether, S. A., Tryjanowski, P., and
Stenseth, N. C. (2011). Challenging claims in the study of migratory birds and climate
change. Biological Reviews, 86(4), 928-946. doi:10.1111/j.1469-185X.2011.00179.x.
Kulkarni, M. A., Berrang-Ford, L., Buck, P. A., Drebot, M. A., Lindsay, L. R., and Ogden, N. H.
(2015). Major emerging vector-borne zoonotic diseases of public health importance in
Canada. Emerging Microbes & Infections, 4, 7. doi:10.1038/emi.2015.33.
33You can also read