Revised records of atmospheric trace gases CO2, CH4, N2O, and δ13C-CO2 over the last 2000 years from Law Dome, Antarctica
←
→
Page content transcription
If your browser does not render page correctly, please read the page content below
Earth Syst. Sci. Data, 11, 473–492, 2019
https://doi.org/10.5194/essd-11-473-2019
© Author(s) 2019. This work is distributed under
the Creative Commons Attribution 4.0 License.

                  Revised records of atmospheric trace gases
                  CO2, CH4, N2O, and δ13C-CO2 over the last
                    2000 years from Law Dome, Antarctica
          Mauro Rubino1,2 , David M. Etheridge2 , David P. Thornton2 , Russell Howden2 , Colin E. Allison2 ,
         Roger J. Francey2 , Ray L. Langenfelds2 , L. Paul Steele2 , Cathy M. Trudinger2 , Darren A. Spencer2 ,
                        Mark A. J. Curran3,4 , Tas D. van Ommen3,4 , and Andrew M. Smith5
               1 School of Geography, Geology and the Environment, Keele University, Keele, ST5 5BG, UK
              2 ClimateScience Centre, CSIRO Oceans and Atmosphere, Aspendale, Victoria, 3195, Australia
                  3 Australian Antarctic Division, Channel Highway, Kingston, Tasmania, 7050, Australia
                4 Antarctic Climate and Ecosystems Cooperative Research Centre, University of Tasmania,

                                      Private Bag 80, Hobart, Tasmania, 7005, Australia
                           5 Australian Nuclear Science and Technology Organisation (ANSTO),

                                      Locked Bag 2001, Kirrawee, NSW 2232, Australia
                    Correspondence: Mauro Rubino (m.rubino@keele.ac.uk) and David M. Etheridge
                                                 (david.etheridge@csiro.au)
                              Received: 28 November 2018 – Discussion started: 14 December 2018
                          Revised: 12 March 2019 – Accepted: 24 March 2019 – Published: 11 April 2019
      Abstract. Ice core records of the major atmospheric greenhouse gases (CO2 , CH4 , N2 O) and their isotopo-
      logues covering recent centuries provide evidence of biogeochemical variations during the Late Holocene and
      pre-industrial periods and over the transition to the industrial period. These records come from a number of
      ice core and firn air sites and have been measured in several laboratories around the world and show com-
      mon features but also unresolved differences. Here we present revised records, including new measurements,
      performed at the CSIRO Ice Core Extraction LABoratory (ICELAB) on air samples from ice obtained at the
      high-accumulation site of Law Dome (East Antarctica). We are motivated by the increasing use of the records by
      the scientific community and by recent data-handling developments at CSIRO ICELAB. A number of cores and
      firn air samples have been collected at Law Dome to provide high-resolution records overlapping recent, direct
      atmospheric observations. The records have been updated through a dynamic link to the calibration scales used
      in the Global Atmospheric Sampling LABoratory (GASLAB) at CSIRO, which are periodically revised with
      information from the latest calibration experiments. The gas-age scales have been revised based on new ice-age
      scales and the information derived from a new version of the CSIRO firn diffusion model. Additionally, the
      records have been revised with new, rule-based selection criteria and updated corrections for biases associated
      with the extraction procedure and the effects of gravity and diffusion in the firn. All measurements carried out in
      ICELAB–GASLAB over the last 25 years are now managed through a database (the ICElab dataBASE or ICE-
      BASE), which provides consistent data management, automatic corrections and selection of measurements, and a
      web-based user interface for data extraction. We present the new records, discuss their strengths and limitations,
      and summarise their main features. The records reveal changes in the carbon cycle and atmospheric chemistry
      over the last 2 millennia, including the major changes of the anthropogenic era and the smaller, mainly natural
      variations beforehand. They provide the historical data to calibrate and test the next inter-comparison of models
      used to predict future climate change (Coupled Model Inter-comparison Project – phase 6, CMIP6). The datasets
      described in this paper, including spline fits, are available at https://doi.org/10.25919/5bfe29ff807fb (Rubino et
      al., 2019).

Published by Copernicus Publications.
474                       M. Rubino et al.: Revised records of CO2 , CH4 , N2 O, and δ 13 C-CO2 from Law Dome, Antarctica

1   Introduction                                                  substances, including water (H2 O) in the ice itself as well
                                                                  as ionic species, organic molecules, and atmospheric gases
                                                                  sealed in bubbles (Barbante et al., 2010). They can span from
The three well-mixed (long-lived) atmospheric greenhouse          polar (Antarctica and Greenland mostly) to tropical (high al-
gases (GHGs) that contribute the most to current global           titude) sites (Thompson et al., 2013) and extend several hun-
warming are CO2 , CH4 , and N2 O. Their concentrations have       dred thousand years back in time (Higgins et al., 2015; Wolff
been increasing since the beginning of the industrial pe-         et al., 2010). Ice cores from different locations have differ-
riod, causing most of the current ∼ 1 ◦ C temperature increase    ent accumulation rates and temperatures, which translate into
above the average global temperature in the period 1861–          differences in time resolution, the age of the deepest lay-
1880 (Stocker et al., 2013). The temperature increase limit of    ers, and archive suitability. Focusing on the last 2 millennia,
2 ◦ C set by the Paris Agreement for 2100 requires substantial    multiple ice core records of GHG concentration and isotopic
reduction of GHG emissions in the next decades and, conse-        composition are available:
quently, significant reductions in the rates of GHG concen-
tration increases. Predicting how GHG concentrations will           – CO2 from EDML (EPICA Dronning Maud Land,
vary in the future requires a clear understanding of the bio-         Antarctica) and the South Pole (Siegenthaler et al.,
geochemical processes responsible for their variations. How-          2005), Law Dome, East Antarctica (Etheridge et al.;
ever, models of future long-term climate changes predict a            1996; MacFarling Meure et al., 2006; Rubino et al.,
large range in GHG concentrations for a given scenario of             2013), DML (Dronning Maud Land; Rubino et al.,
emissions (Friedlingstein et al., 2014), and one of the key           2016), and WAIS (West Antarctic Ice Sheet; Ahn et al.,
uncertainties is associated with feedbacks in the coupled             2012);
carbon–climate system (Arora et al., 2013). Climate mod-
ellers have analysed and compared results from state-of-the-        – δ 13 C-CO2 from Law Dome (Francey et al., 1999; Ru-
art climate model simulations to gain insights into the pro-          bino et al., 2013), WAIS (Bauska et al., 2015), and DML
cesses of climate variability, change, and feedbacks through          (Rubino et al., 2016);
the Coupled Model Inter-comparison Project (CMIP). In
                                                                    – CH4 from NEEM (Rhodes et al., 2013) and from
CMIP, records of GHGs can be used as either forcing or a
                                                                      GISP2 (Mitchell et al., 2013) in Greenland, Law Dome
diagnostic (Graven et al., 2017; Meinshausen et al., 2017).
                                                                      (Etheridge et al., 1998; MacFarling Meure et al., 2006)
However, real-time records of GHGs started in a period when
                                                                      and WAIS (Mitchell et al., 2011) in Antarctica;
anthropogenic forcing was already very significant, and the
atmosphere and the Earth system were in strong disequilib-          – N2 O from EUROCORE and GRIP in Greenland (Flück-
rium, and therefore do not provide a balanced state for model         iger et al., 1999), Dome C (Flückiger et al., 2002), and
spin-up. Additionally, temperature and CO2 have both in-              Law Dome (MacFarling Meure et al., 2006) in Antarc-
creased almost continuously through the 20th century, mak-            tica.
ing it difficult to separate the impacts of CO2 on carbon
sinks from the impacts of temperature increase on these           There are other records focusing on periods other than the
sinks. Furthermore, real-time records are often too short to      last centuries but also covering the whole or part of the in-
draw strong conclusions on multi-decadal variability. To pro-     dustrial and the pre-industrial periods (i.e. for N2 O: H15 by
vide a balanced system for model spin-up, and evaluate the        Machida et al., 1995; Styx glacier by Ryu et al., 2018; Ta-
ability of models to capture observed variability on multi-       los Dome by Schilt et al., 2010). We have decided not to
decadal and longer timescales, a branch of CMIP (“Historical      include them in our comparison because their temporal res-
Simulations”) starts in 1850 CE (Eyring et al., 2016), while      olution (Schilt et al., 2010) and/or coverage (Machida et al.,
another branch (the “Paleoclimate Modelling Intercompar-          1995; Ryu et al., 2018) limits their value for comparison with
ison Project”, PMIP) focuses on paleo-climate simulations         the records focusing on the last centuries.
(Schmidt et al., 2014). Yet, policymakers need short-term            There are real differences between records of the same
predictions of global warming (next decades to century), and      GHG from different sites caused by atmospheric features,
the Intergovernmental Panel on Climate Change has very            such as the inter-hemispheric gradient (north–south or
recently provided a special report on the impacts of global       Greenland vs. Antarctica). The inter-hemispheric gradient is
warming of 1.5 ◦ C above pre-industrial levels. The last mil-     different from one GHG to another, depending on the bal-
lennium is a very suitable period to support these types of       ance between, and the distribution of, sources and sinks for
investigations since the Earth system was much closer to          that specific GHG in the two hemispheres, as well as on the
its current state than previous periods of glacial–interglacial   atmospheric circulation and the atmospheric lifetimes of the
transition.                                                       gases. There are also differences which do not reflect atmo-
   Ice cores are exceptional archives of factors influencing      spheric changes, due, for example, to the characteristics of
past climate change because they contain a large range of         the sites where the ice is sampled. Ice core site characteristics

Earth Syst. Sci. Data, 11, 473–492, 2019                                           www.earth-syst-sci-data.net/11/473/2019/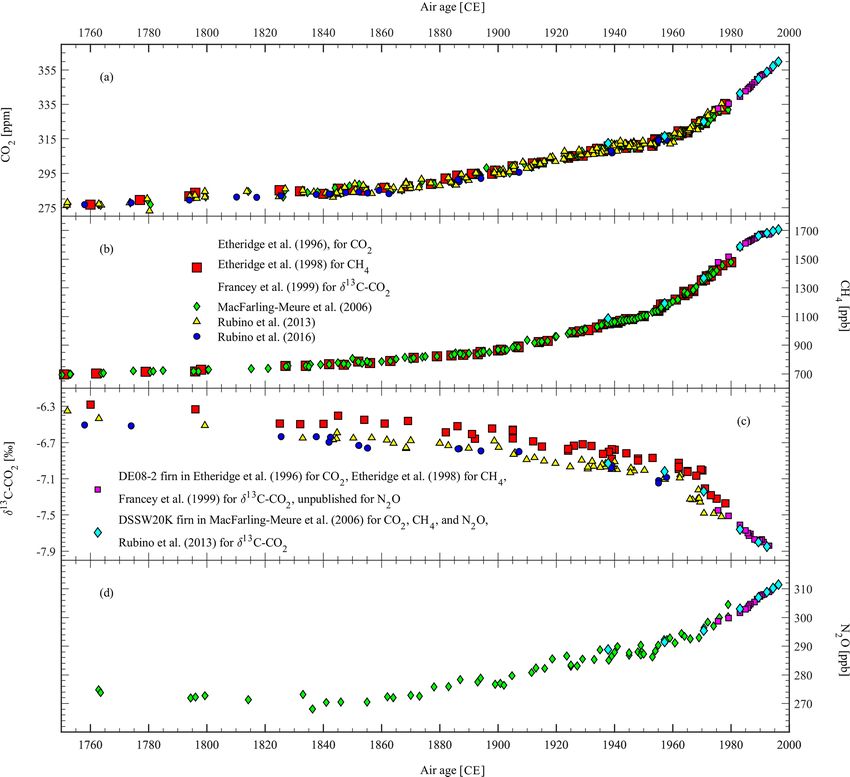
M. Rubino et al.: Revised records of CO2 , CH4 , N2 O, and δ 13 C-CO2 from Law Dome, Antarctica                                475

influence the measured gas records due to the gaseous dif-         atmospheric measurements (MacFarling Meure et al., 2006;
fusion through the uppermost layers of porous, compacting          Rubino et al., 2013). The consistency between these mea-
snow, the “firn” (Schwander et al., 1993). Together, diffusion     surements is evidence of our ability to extend current atmo-
in firn and gradual bubble close-off result in a smoothed rep-     spheric records back in time using ice and firn. However, be-
resentation of the atmospheric history in ice core gas records.    cause of the emissions during the Industrial Revolution, our
The smoothing process depends on the depth of the firn             measurements of modern and old (pre-industrial) air samples
layer and on how quickly bubbles close off and trap air dur-       lie in different concentration ranges and the calibrations used
ing firn-to-ice transition. Ice core sites in Greenland gener-     for measurements of modern air samples are, therefore, in a
ally have higher accumulation rates and temperatures than in       concentration range rather different from that used for mea-
Antarctica. Consequently, GHG records from many Antarc-            surements of old air samples. The measurements performed
tic sites are usually a more smoothed representation of the        in ICELAB–GASLAB at CSIRO have the advantage of be-
atmospheric history. Unfortunately, there is no reliable CO2       ing calibrated across the range of concentrations of old and
record available from Greenland because there is evidence          modern air sample measurements. Also, ice core gas extrac-
of in situ production of CO2 (Anklin et al., 1995; Barnola et      tions and analyses are technically challenging, and different
al., 1995). The most likely explanation for this is a high level   people at CSIRO ICELAB have produced those measure-
of impurities in Greenland ice reacting with acidity and/or        ments over almost 3 decades. Thus, it is possible that the
hydrogen peroxide (Jenk et al., 2012; Tschumi and Stauf-           extraction and analysis procedures have introduced differ-
fer, 2000). Law Dome, Antarctica, provides the best time-          ent biases over time, influencing the measurements by vari-
resolved ice core records due to the very high accumula-           able amounts. However, except for minor developments over
tion rate at this site (Etheridge et al., 1996; Goodwin, 1990),    time (Etheridge et al., 1996; Francey et al., 1999; MacFar-
even more so than Greenland. Also, records from multiple           ling Meure et al., 2006; Rubino et al., 2013, 2016) the equip-
Law Dome sites show no evidence of in situ production be-          ment used for extraction and analysis has not fundamentally
cause they agree with records from colder sites in Antarctica      changed.
(Rubino et al., 2016; Siegenthaler et al., 2005) and compare          In this study, we describe the procedure recently developed
closely with each other, with air extracted from the firn, and     at CSIRO ICELAB–GASLAB to perform calibration-scale
with modern atmospheric records (Rubino et al., 2013).             updates and data selection and correction automatically and
   However, there are unexplained differences between              in a consistent way for all measurements made over the last
records of the same GHG, particularly for CO2 . For exam-          25 years. In the Supplement, we provide a detailed explana-
ple, while the CO2 records of the South Pole and EDML              tion of the database recently created to store, process, and
over the last centuries are consistent with Law Dome when          extract the information about the samples analysed, the mea-
their broader age smoothing is taken into account (Rubino et       surements performed, and the results obtained. We present
al., 2016; Siegenthaler et al., 2005), the WAIS CO2 record         updated records of CO2 , CH4 , N2 O, and δ 13 C-CO2 measured
is on average 3 ppm higher than the Law Dome CO2 record            in ice and firn air from Law Dome (Rubino et al., 2019). Af-
(Ahn et al., 2012). The similarity between the high-frequency      ter merging them with other relevant records, they will be
variations in the CH4 records from Law Dome and WAIS               used to run models participating at CMIP6 (Graven et al.,
(Mitchell et al., 2011) suggests that the two sites (Law Dome      2017; Meinshausen et al., 2017). We discuss the strengths
and WAIS) introduce similar smoothing of the atmospheric           and limitations of the Law Dome GHG records and compare
signals. However, the Law Dome CO2 minimum measured                our records with other records from different sites to show
around 1610 CE does not have a corresponding feature at            similarities and unresolved discrepancies. Finally, we discuss
WAIS (Ahn et al., 2012). Considering that a comparison be-         the main features of those records, their implications for bio-
tween the two laboratories where Law Dome and WAIS sam-            geochemical, atmospheric, and climatic studies, and possible
ples were measured has shown no significant offset (Ahn et         future lines of research.
al., 2012), the differences between the WAIS and the Law
Dome CO2 records could be explained by a small effect of
                                                                   2     Methods
in situ production at WAIS. Additionally, there is a signifi-
cant difference in the mean pre-industrial level of δ 13 C-CO2     2.1    Law Dome
measured at WAIS and Law Dome (Bauska et al., 2015;
Rubino et al., 2016). These differences need to be resolved        The ice cores used in this study, referred to as DE08, DE08-2,
with inter-calibration campaigns between different laborato-       DSS, and DSS0506, were drilled at Law Dome, East Antarc-
ries, using ice cores from different sites (including new high-    tica (Fig. 1). Law Dome is a relatively small (∼ 150 km di-
accumulation cores) and accurate modelling of gas age (both        ameter and 1390 m high) ice sheet on the coast of Wilkes
the mean value and spread) at each site.                           Land. It receives large and regular snowfall mainly from the
   To provide the most consistent datasets possible for the        east, and the surface rarely melts in the colder central regions.
past centuries, we have previously compared the Law Dome           The ice flow is mainly independent of the flow of the main
records of CO2 , CH4 , N2 O, and δ 13 C-CO2 to firn and modern     East Antarctic ice sheet because of the drainage around Law

www.earth-syst-sci-data.net/11/473/2019/                                             Earth Syst. Sci. Data, 11, 473–492, 2019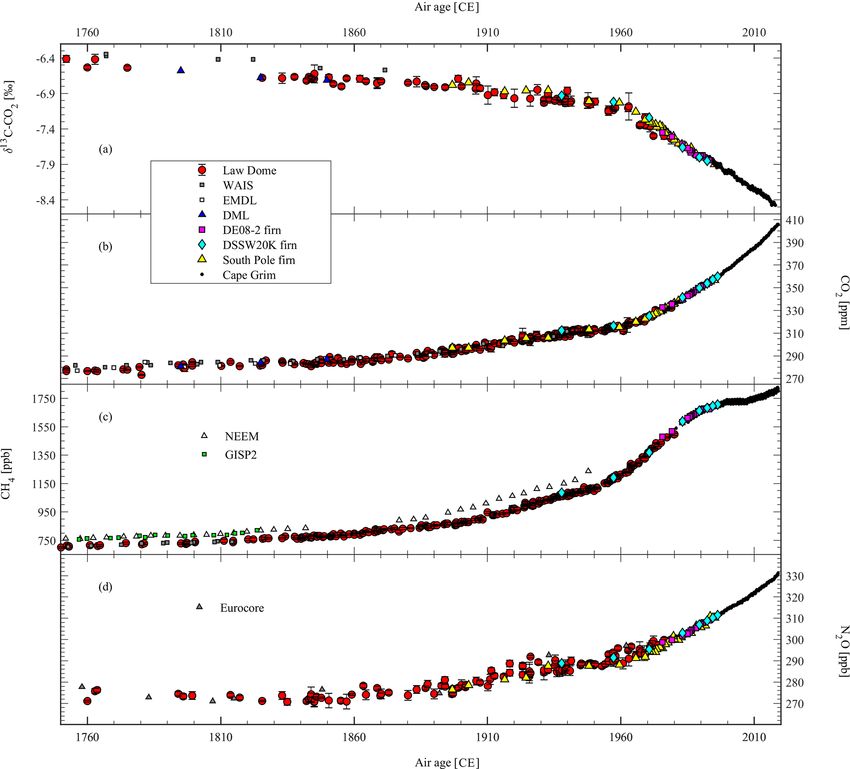
476                         M. Rubino et al.: Revised records of CO2 , CH4 , N2 O, and δ 13 C-CO2 from Law Dome, Antarctica

                                                                        2.2   ICELAB extraction

                                                                        Measurement of the composition of air in ice core bubbles re-
                                                                        quires an extraction step to release the air from ice. The dry
                                                                        extraction technique used at ICELAB has been described in
                                                                        detail in previous publications (Etheridge et al., 1996; Mac-
                                                                        Farling Meure et al., 2006), with recent minor alterations
                                                                        to optimise extraction and measurement of δ 13 C-CO2 analy-
                                                                        ses (Rubino et al., 2013). Briefly, after ice sample selection
                                                                        and preparation (removing the outer 5–20 mm with a band
                                                                        saw), typically 0.7–1.3 kg of ice is placed in a polyethylene
                                                                        bag (Layflat, USP® ) and cooled down to −80 ◦ C in a chest
                                                                        freezer for at least 24 h prior to extraction. The ice is then
                                                                        placed inside a perforated inner cylinder (“cheese grater”)
                                                                        fixed inside an internally electropolished stainless steel con-
                                                                        tainer, which is then evacuated to less than 10−2 Pa and main-
                                                                        tained at that pressure for at least 25 min. The ice is then
Figure 1. Map of the Law Dome region, slightly modified from
                                                                        grated by mechanically shaking the container for 10 min,
Smith et al. (2000), showing the location of the drilling sites DE08,
DE08-2, DSS, DSS0506, and DSSW20K discussed in the text. Dot-           which releases the trapped air. The process yields on aver-
ted lines are accumulation isopleths (kg m−2 yr−1 ) and unbroken        age 70 mL (range 50–90 mL) of air, estimated from the pres-
lines are elevation contours (m a.s.l.). The inset shows the location   sure in the extraction line (whose volume has been previ-
of the region in Antarctica.                                            ously calibrated). The air is passed through a water vapour
                                                                        trap (∼ −100 ◦ C) and then cryogenically collected in an elec-
                                                                        tropolished and preconditioned stainless steel trap at around
Dome by two glacier systems (the Totten and the Vander-                 20 K (−253 ◦ C). The sample trap is warmed in a water bath
ford). Reworking of the accumulated snow is insufficient to             at room temperature (∼ 25 ◦ C) for 5 min to vaporise and mix
erase annual layers as high wind speeds are relatively infre-           the gases before being transported into the instrument labo-
quent. The resulting annual layering is thick and regular and           ratory. Samples are analysed on gas chromatographs (GCs)
preserved for much of the ice thickness (van Ommen et al.,              for CO2 , CH4 , CO, H2 , and N2 O within 24 h after extraction,
2005).                                                                  and on the isotope ratio mass spectrometer (IRMS) for δ 13 C
   DE08 and DE08-2 were drilled in 1987 and 1993, re-                   and δ 18 O within 12 h.
spectively, only 300 m apart and 16 km east of the summit                  To estimate the uncertainty and any possible bias intro-
of Law Dome (66◦ 440 S, 112◦ 500 E, 1390 m a.m.s.l. – above             duced by the extraction procedure (called the blank correc-
mean annual sea level), and have an accumulation rate of ap-            tion), test samples are run together with the real ice sam-
proximately 1100 kg m−2 yr−1 (equivalent to 1.4 m of ice per            ples. The test samples can be either reference air samples
year). DSS (Dome Summit South) was drilled between 1988                 of known composition processed with no ice present (named
and 1993, 4.6 km south-southwest of the summit, and has                 “blanks”) or reference air samples injected over ice grown
an accumulation rate of about 600 kg m−2 yr−1 (Etheridge                with no visible bubbles in it and grated as for an actual
et al., 1996; Goodwin, 1990; van Ommen et al., 2005). In                ice core sample (the so-called bubble-free ice, or BFI). BFI
January–February 1993, air was sampled from the firn layer              is grown in ICELAB by keeping a container filled with
at DE08-2, providing air with mean ages back to 1976 CE                 deionised water in thermal equilibrium, in order to grow
(Etheridge et al., 1996). Another firn campaign was car-                ice as slowly as possible from the bottom to the top of the
ried out at DSSW20K (accumulation rate of approximately                 container. The container features Plexiglas sidewalls that are
150 kg m−2 yr−1 ), 20 km west of DSS in December 1997                   electrically heated. The water exchanges heat only through
(Sturrock et al., 2002), which provided air dating back to              the metallic base and freezes from the bottom to the top. If
about 1940 CE (Trudinger et al., 2002b). DSS0506 was ther-              the process is slow enough, the produced ice is free of visible
mally drilled in a dry hole (Burn-Nunes et al., 2011) during            bubbles. The results of the tests performed on ICELAB BFI,
the 2005/2006 austral summer near the Law Dome summit                   as well as on other externally grown BFI, have been exten-
(66◦ 460 S, 112◦ 480 E, 1370 m a.s.l.). The site has an accumu-         sively described by Rubino et al. (2013).
lation rate of about 600 kg m−2 yr−1 and a mean annual tem-
perature of −22 ◦ C.
                                                                        2.3   GASLAB analysis

                                                                        Each extracted air sample is analysed for trace gas concen-
                                                                        trations (defined as mole fractions in parts per million (ppm)
                                                                        or parts per billion (ppb) in dry air) using several GCs in

Earth Syst. Sci. Data, 11, 473–492, 2019                                                 www.earth-syst-sci-data.net/11/473/2019/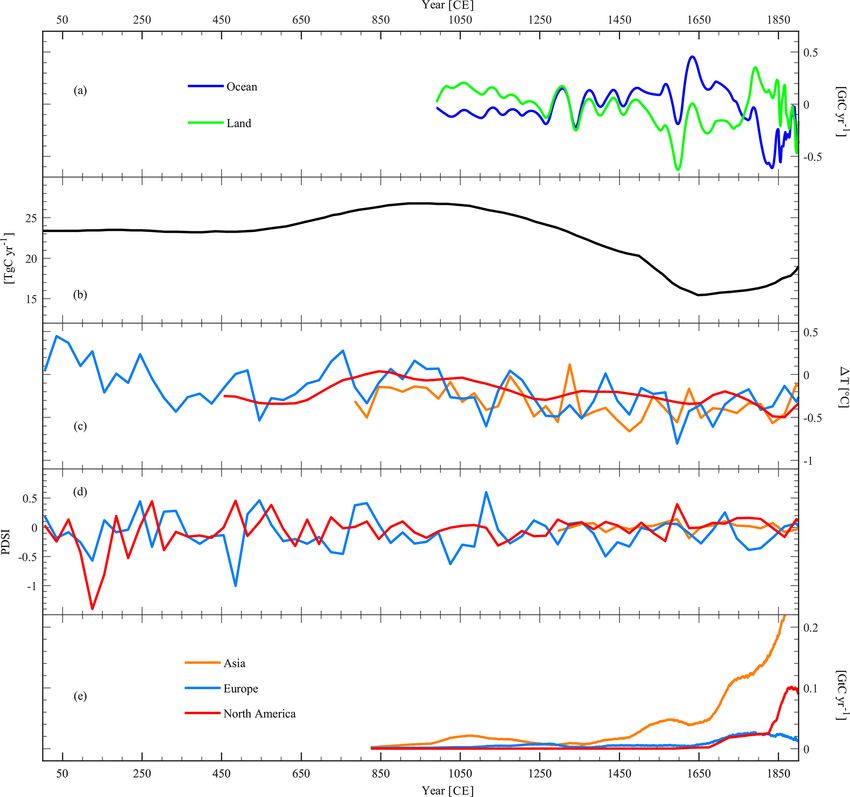
M. Rubino et al.: Revised records of CO2 , CH4 , N2 O, and δ 13 C-CO2 from Law Dome, Antarctica                              477

GASLAB. A Series 400 CARLE/EG & G (Tulsa, Oklahoma,                and Francey, 2007) analyses. The current calibration scales
USA) GC equipped with a flame ionisation detector is used          used are WMO X2004A for CH4 , WMO X2007 for CO2 ,
to measure CH4 and CO2 (the latter converted, after col-           NOAA 2006A for N2 O, and CSIRO2005 for CO2 isotopes
umn separation, to CH4 using a nickel catalyst at 400 ◦ C).        (CO2 -in-air scale, which is linked to the VPDB CO2 scale).
A Trace Analytical RGA3 (Menlo Park, California, USA)
GC, equipped with a mercuric oxide reduction gas detec-            2.4    ICELAB database
tor, is used to measure CO and H2 , which reduces HgO to
gaseous Hg for detection by UV absorption. N2 O is mea-            A new database allows storage, selection, correction, up-
sured on a Shimadzu GC-8AIE (Kyoto, Japan) equipped                dating and extraction of the data produced in ICELAB–
with an electron capture detector. In normal GASLAB opera-         GASLAB. It allows results to be dynamically updated if
tion, air samples (including those sampled from firn) in low-      changes in analytical methods or calibration scales are im-
pressure flasks and high-pressure cylinders are injected and       plemented, keeping ice, firn, and atmospheric measurements
analysed on the GCs using automated inlet systems to ensure        consistent with each other. Data are stored in tables where the
reproducibility and minimum sample consumption (Francey            information associated with each specific sample is linked
et al., 2003). Because of the limited amount of air available, a   via a Universal Analysis Number (UAN) that acts as the
semi-automated procedure is used to inject the small volume        index for combining all information. The structure of the
of ice core air into the GC inlet systems. Approximately 15–       database and its tables are described in detail in the Sup-
20 mL is used to measure CO2 , CH4 , CO, and H2 , and 12–          plement. The database includes procedures, which automat-
15 mL is used to measure N2 O. The remaining air (typically        ically perform sample selection, correct results and estimate
40 mL) is used for δ 13 C and δ 18 O measurements. The vol-        uncertainty, and provide a routine for data extraction (see
umes indicated are total volume used for flushing gas transfer     Supplement for details).
lines as well as for analysis.
   The δ 13 C and δ 18 O of the CO2 in the residual air are mea-   3     Results and discussions
sured using the MAT252 (Finnigan MAT GmbH, Bremen)
IRMS located in GASLAB. Low-pressure, large-volume                 3.1    Development of the Law Dome GHG records,
whole-air samples from flasks (atmospheric or firn air sam-               internal consistency, unexplained discrepancies,
ples) and the small-volume, high-pressure, whole-air sam-                 and limitations
ples from ICELAB are introduced into the IRMS through a
                                                                   The first pre-industrial record of CO2 from Law Dome cover-
common inlet (multiport) equipped with an all stainless steel
                                                                   ing the whole last millennium was published by Etheridge et
mass flow controller (Brooks 5850) to ensure constant mass
                                                                   al. (1996, reported here with red squares in Figs. 2a and 3a).
flow conditions for all samples. The IRMS uses two cryo-
                                                                   It was one of the first ice core records to show the over-
genic traps (MT Box C, Finnigan) to retain water vapour and
                                                                   lap with firn (Fig. 3a) and contemporary atmospheric mea-
other condensable gases and to extract CO2 (plus N2 O) from
                                                                   surements. The overlap of ice core and contemporary atmo-
air. The residual CO2 (and N2 O) is injected into the MAT252
                                                                   spheric measurements is one of the main advantages of the
ion source via a dedicated micro-volume and crimped cap-
                                                                   Law Dome ice core sites, due to their high snow accumu-
illary. Nitrous oxide (N2 O) has identical molecular masses
                                                                   lation rates and the resultant relatively quick bubble close-
to CO2 and interferes with the isotopic analyses. To remove
                                                                   off time and recently enclosed air. This feature has been de-
this interference, a correction is made to the IRMS output
                                                                   scribed extensively in previous papers (Etheridge et al., 1996;
in GASLAB using the relative ionisation efficiency of N2 O
                                                                   MacFarling Meure et al., 2006; Rubino et al., 2013) and used,
and CO2 , the isotopic composition of N2 O, and the mea-
                                                                   together with the overlap between different cores, to demon-
sured N2 O and CO2 concentrations, as described in detail
                                                                   strate our confidence in extending contemporary GHG con-
by Allison and Francey (2007). High-precision isotopic ra-
                                                                   centration measurements back in time. Based on replicate
tios are determined by alternating sample CO2 and reference
                                                                   analyses of test samples (blanks and BFI) over time peri-
CO2 injected via matched crimped capillaries. The carbon
                                                                   ods of several months, on ice samples within an annual layer,
isotopic ratio of the sample (sa) is expressed relative to the
                                                                   and the overlap mentioned above, Etheridge et al. (1996) es-
reference (ref) following Eq. (1):
                                                                   timated that the uncertainty of the CO2 measurements was
                                                                   1.2 ppm (1σ ). The major biogeochemical events discussed in
          "                   #
             13 C/12 C

  13                    sa
δ C = 13 12  − 1 × 1000.                                    (1)   Etheridge et al. (1996) were the LIA (Little Ice Age) CO2 de-
               C/ C ref                                            cline between 1550 and 1750 CE with the subsequent recov-
                                                                   ery from the LIA perturbation between 1750 and 1800 CE in
When comparing measurements performed more than
                                                                   the pre-industrial period, and the 1940s stabilisation of atmo-
20 years apart, rigorous traceability in the propagation of cal-
                                                                   spheric CO2 concentration (Fig. 3a), which ended just before
ibration scales becomes an important factor. This is obtained
                                                                   the Mauna Loa and South Pole atmospheric records began.
with a long-term, continuous comparison of standard cylin-
ders for both GC (Francey et al., 2003) and IRMS (Allison

www.earth-syst-sci-data.net/11/473/2019/                                             Earth Syst. Sci. Data, 11, 473–492, 2019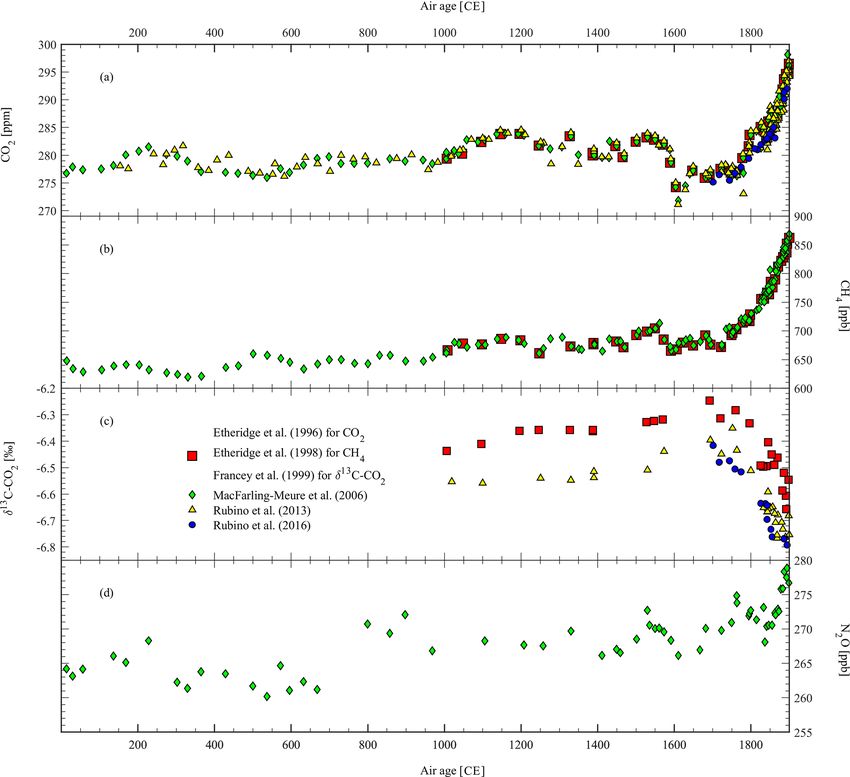
478                       M. Rubino et al.: Revised records of CO2 , CH4 , N2 O, and δ 13 C-CO2 from Law Dome, Antarctica

Figure 2. Published pre-industrial period (1–1900 CE) GHG records from Law Dome ice extracted and measured at CSIRO ICELAB–
GASLAB. (a) CO2 , (b) CH4 , (c) δ 13 C-CO2 , and (d) N2 O.

   A few years later, the same authors published the Law          industrial inter-hemispheric gradient provides a constraint to
Dome pre-industrial record of CH4 covering the last millen-       quantify variations in sources and sinks of CH4 (Mitchell et
nium (Etheridge et al., 1998, red squares in Figs. 2b and 3b).    al., 2013). The same is not possible for CO2 because of the
The tight overlap for the first time between ice, firn and        above-mentioned in situ production in Greenland ice.
contemporary atmospheric CH4 measurements that began                 To quantify variations in the sources and sinks of CO2 ,
more than 20 years later than for CO2 confirmed that the ice      Francey et al. (1999) measured its isotopic ratio (δ 13 C, red
core air record is a faithful representation of the past atmo-    squares in Figs. 2c and 3c) in Law Dome ice. This record
spheric CH4 concentration (Fig. 3b). The estimated uncer-         provided a means to quantify the relative CO2 uptake by
tainty was 5 ppb. The major features discussed in Etheridge       the land and the ocean to the total atmospheric CO2 change
et al. (1998) were the LIA CH4 decline, supporting a ter-         (Trudinger et al., 2002a), when the emissions from fossil fuel
restrial origin for the synchronous CH4 /CO2 decrease, and        and land use change were taken into account for the indus-
the rapid increase in CH4 growth rates after 1945 CE, which       trial period, and assuming that, in the pre-industrial period,
peaked in 1981 CE, just as atmospheric monitoring began.          there was no significant influence of anthropogenic activi-
It was also possible to determine the pre-industrial inter-       ties on the atmospheric δ 13 C-CO2 (Pongratz and Caldeira,
hemispheric difference in CH4 (24–58 ± 10 ppb), based on          2012; Stocker et al., 2011), and also assuming no significant
comparison with CH4 measurements from Greenland (EU-              changes in inter-hemispheric CO2 exchange times (Francey
ROCORE and GISP2), also made in ICELAB–GASLAB,                    and Frederiksen, 2016; Frederiksen and Francey, 2018). The
and supporting evidence from Blunier et al. (1993) and Chap-      δ 13 C-CO2 decrease measured by Francey et al. (1999) in
pellaz et al. (1997). The variability over time of the CH4 pre-   the last 2 centuries (Fig. 3c) is mainly due to 13 C-depleted

Earth Syst. Sci. Data, 11, 473–492, 2019                                           www.earth-syst-sci-data.net/11/473/2019/
M. Rubino et al.: Revised records of CO2 , CH4 , N2 O, and δ 13 C-CO2 from Law Dome, Antarctica                               479

Figure 3. Published and unpublished industrial period (1750–2000) GHG records from Law Dome ice and firn, extracted and measured at
CSIRO ICELAB–GASLAB. (a) CO2 , (b) CH4 , (c) δ 13 C-CO2 , and (d) N2 O.

CO2 derived from fossil fuel CO2 emissions and is im-                     diamonds in Fig. 2a and b) and increased sample den-
portant evidence of the prominent role of anthropogenic                   sity in the industrial period (green diamonds in Fig. 3a
emissions in the industrial period CO2 increase. Francey et               and b). They also confirmed the LIA CO2 /CH4 de-
al. (1999) also discussed the increase in δ 13 C-CO2 during               crease as well as the 1940s CO2 stabilisation and pro-
the LIA, supporting the interpretation of a terrestrial origin            duced a record of N2 O (green diamonds in Fig. 2d)
for the synchronous CH4 /CO2 decrease (Trudinger et al.,                  which, in turn, overlaps with firn N2 O measurements
1999), though with lower sampling resolution compared to                  (green diamonds in Fig. 3d). The authors interpreted the
the CO2 in Etheridge et al. (1996). Francey et al. (1999) es-             N2 O decrease of about 5 ppb during the LIA as addi-
timated statistical and systematic δ 13 C-CO2 biases between              tional evidence for the terrestrial origin of the LIA GHG
0.025 and 0.07 ‰ and uncertainties of up to ±0.05 ‰ but                   decrease. The measurement uncertainty remained the
found an unexplained discrepancy of up to 0.2 ‰ (Trudinger,               same for CO2 (1.2 ppm) as for Etheridge et al. (1996)
2000, Sect. 3.8) around 1900 CE from the South Pole δ 13 C-               but decreased slightly for CH4 (from 5 ppb in Etheridge
CO2 firn record measured at NOAA INSTAAR (National                        et al., 1998, to 4 ppb in MacFarling Meure et al., 2006).
Oceanic and Atmospheric Administration Institute of Arctic                The uncertainty of the N2 O measurements was 6.5 ppb.
and Alpine Research, Boulder, Colorado).                                  The authors also found an increase in N2 O concentra-
   The early Law Dome GHG records have been revised and                   tion of about 10 ppb between 675 and 800 CE, which
extended over time as follows.                                            does not seem to be related to any known climatic event.

  – MacFarling Meure et al. (2006) extended the CO2 and               – Rubino et al. (2013) revised the δ 13 C-CO2 record (see
    CH4 records back through the last 2 millennia (green                yellow triangles in Figs. 2c and 3c) by updating the cal-

www.earth-syst-sci-data.net/11/473/2019/                                              Earth Syst. Sci. Data, 11, 473–492, 2019
480 M. Rubino et al.: Revised records of CO2 , CH4 , N2 O, and δ 13 C-CO2 from Law Dome, Antarctica
ibration scale and revisiting the corrections applied in based fertilisers. These isotopic measurements are also
Francey et al. (1999) for blank, gravity, and diffusion not included in ICEBASE.
effects, using the revised CSIRO firn model (Trudinger
et al., 2013) for the gravity and diffusion corrections
(Trudinger et al., 1997). In doing so, they resolved the 3.2 The new Law Dome GHG records and comparison
0.2 ‰ discrepancy found between the Law Dome δ 13 C- with records from other sites
CO2 record and the South Pole δ 13 C-CO2 firn record
Figures 4 and 5 show the newly revised Law Dome GHG
(the South Pole firn records have been reported in Fig. 5,
records (red circles). Following the rule-based selection de-
but see Rubino et al., 2013, for more details). They
scribed in the Supplement, there are 299 ice core mea-
also increased sample density during the industrial pe-
surements for CO2 , 307 for CH4 , 147 for N2 O (compared
riod and applied the new chronology available for Law
to 212, 228, and 103, respectively, in MacFarling Meure et
Dome ice (Plummer et al., 2012), which caused a shift
al., 2006), and 86 for δ 13 C-CO2 (compared to 58 in Francey
of about 150 years for samples that are 2000 years old
et al., 1999, and 69 in Rubino et al., 2013). All of the ma-
(see difference between the ages of green diamonds and
jor features described in previous publications are retained.
yellow triangles in Fig. 2a). The age difference becomes
However, the differences mentioned above can potentially
negligible in the last millennium, as evident by compar-
influence the biogeochemical and climatic interpretation of
ing red squares and yellow triangles in Fig. 2c.
these records. Given that the Law Dome GHG records are a
– Rubino et al. (2016) carried out additional CO2 and major source of information for models used to predict the
δ 13 C-CO2 measurements (see blue circles in Figs. 2–3a future behaviour of the Earth system (Graven et al., 2017;
and c) from ice cores sampled at the Law Dome site of Köhler et al., 2017b; Meinshausen et al., 2017), in the fol-
DSS0506 (Pedro et al., 2011). The data extended back lowing paragraphs we provide an explanation of the main
to 1700 CE effective air age and provided additional ev- reasons for these differences.
idence of consistent results between different ice cores – Changes to the calibration scale result in small, mostly
and firn records where they overlapped. However, the negligible, differences.
increasing CO2 trend measured in DSS0506 between
1700 and 1850 CE does not tightly match that previ- – All records (except the δ 13 C-CO2 ) start in 154 CE (ef-
ously attributed to recovery from the LIA (Etheridge et fective age for CO2 ) rather than 0 CE. This causes
al., 1996). a revision of air ages towards more recent times for
It is also worth mentioning the results of two other stud- all events recorded in the second-to-last millennium
ies performed using Law Dome ice and firn, which were (e.g. the 10 ppb increase in N2 O between 675 and
sampled but not measured using CSIRO GASLAB in- 800 CE discussed in MacFarling Meure et al. (2006) is
struments. now dated 701–822 CE, Fig. 4d) but a less than 2-year
change in dating after about 1000 CE.
– To investigate changes in pre-industrial sources of
– Each data point has an uncertainty, which is inde-
CH4 , Ferretti et al. (2005) produced a record of δ 13 C-
pendently calculated based on the weighting and flag-
CH4 in Law Dome ice covering the last 2000 years
ging systems described in the Supplementary Material.
(not shown). They reported unexpected changes of the
The uncertainty does not include any additional un-
global CH4 budget, mainly attributed to variations in
certainty associated with inter-core variability. For ex-
biomass burning emissions during the late pre-industrial
ample, based on comparisons between samples of the
Holocene (LPIH) through an atmospheric box model
same ages, the discrepancy found between DSS0506
(Lassey et al., 2000). The δ 13 C-CH4 record from Fer-
and other Law Dome cores in the period 1700–1850 CE
retti et al. (2005) has not been included in ICEBASE
suggests that the inter-core variability can potentially
because the air samples extracted in ICELAB were mea-
add a random, extra uncertainty of up to 5 ppm for
sured on a mass spectrometer not maintained by CSIRO
CO2 . Further research is needed to precisely quantify
GASLAB. Therefore, the δ 13 C-CH4 data are not on a
the inter-core variability.
CSIRO calibration scale and have not been included in
ICEBASE. The following list compares the new Law Dome records with
records from other sites and discusses the main differences.
– Park et al. (2012) measured oxygen and intramolecular
nitrogen isotopic compositions of N2 O (not shown) cov- – There is good agreement between the revised
ering 1940 to 2005 in Law Dome firn air and archived CO2 /δ 13 C-CO2 Law Dome records and the CO2 /δ 13 C-
air samples from Cape Grim (Tasmania). In doing so, CO2 records from DML produced in ICELAB–
they confirmed that the rise in atmospheric N2 O levels GASLAB (blue triangles in Figs. 4–5a and b). Once
is largely the result of an increased reliance on nitrogen- the different gas-age distributions of the ice cores are
Earth Syst. Sci. Data, 11, 473–492, 2019 www.earth-syst-sci-data.net/11/473/2019/M. Rubino et al.: Revised records of CO2 , CH4 , N2 O, and δ 13 C-CO2 from Law Dome, Antarctica 481
Figure 4. Revised records (100–1900 CE) of (a) δ 13 C-CO2 , (b) CO2 , (c) CH4 , and (d) N2 O from Law Dome ice compared to published
records from other sites: WAIS δ 13 C-CO2 from Bauska et al. (2015), WAIS CO2 from Ahn et al. (2012), DML CO2 and δ 13 C-CO2 from
Rubino et al. (2016), EDML and South Pole CO2 from Siegenthaler et al. (2005), WAIS CH4 from Mitchell et al. (2011), NEEM CH4 from
Rhodes et al. (2013) plotted using the revised age scale as explained in the text, GISP2 CH4 from Mitchell et al. (2013), EUROCORE and
GRIP N2 O from Flückiger et al. (1999), and EDC N2 O from Flückiger et al. (2002).
taken into account, the two records are in very good – There is a systematic difference (3 ppm on average)
agreement, with a difference of less than 2 ppm for between the Law Dome CO2 record and the WAIS
CO2 and differences within error bars for δ 13 C-CO2 CO2 record in the pre-industrial (Ahn et al., 2012, see
(Rubino et al., 2016). Given that both records have grey squares in Fig. 4b). Though small, the difference
been produced at CSIRO ICELAB–GASLAB, we can is of concern because it is systematic throughout the
exclude any possible inter-laboratory offset. whole record. The two laboratories (CSIRO ICELAB–
GASLAB and Oregon State University) that produced
– There is also acceptable agreement (random differ- these records have also run a comparison experiment to
ences up to 4 ppm) between the CO2 Law Dome record quantify the contribution of a possible inter-laboratory
and the CO2 records from EDML and the South Pole offset to the total discrepancy (Ahn et al., 2012). The
(Siegenthaler et al., 2005, white and green squares good agreement (measurements from the two labora-
in Fig. 4b). Considering that the records have been tories were consistent within the 1σ analytical uncer-
produced in different laboratories (CSIRO ICELAB– tainty) found by the inter-comparison experiment sug-
GASLAB and University of Bern), it is possible that gests that the discrepancy is mostly due to an inter-core
part of the difference is explained by an inter-laboratory difference.
offset.
www.earth-syst-sci-data.net/11/473/2019/ Earth Syst. Sci. Data, 11, 473–492, 2019482 M. Rubino et al.: Revised records of CO2 , CH4 , N2 O, and δ 13 C-CO2 from Law Dome, Antarctica
Figure 5. Revised records (1750–2010 CE) of (a) δ 13 C-CO2 , (b) CO2 , (c) CH4 , and (d) N2 O from Law Dome ice and firn compared to
the South Pole firn records of δ 13 C-CO2 , CO2 , and N2 O (measured at NOAA-INSTAAR) and to published records from other sites: WAIS
δ 13 C-CO2 from Bauska et al. (2015), WAIS CO2 from Ahn et al. (2012), DML CO2 and δ 13 C-CO2 from Rubino et al. (2016), EDML and
South Pole CO2 from Siegenthaler et al. (2005), WAIS CH4 from Mitchell et al. (2011), NEEM CH4 from Rhodes et al. (2013), GISP2 CH4
from Mitchell et al. (2013), and EUROCORE N2 O from Flückiger et al. (1999).
– There is an increase in this difference to > 8 ppm be- ancy (Köhler et al., 2017b) during the Last Glacial Max-
tween the Law Dome CO2 dip around 1610 CE and the imum, last termination, and Early Holocene between the
WAIS CO2 decrease during the LIA (Ahn et al., 2012, EDC CO2 record (Monnin et al., 2001, 2004) and the
compare grey squares and red circles in Fig. 4b). WAIS WAIS CO2 record (Marcott et al., 2014).
is considered a high-accumulation site and should re-
tain the same events as those recorded at Law Dome.
– There is a difference of up to 0.15 ‰ (compare grey
The difference is even more surprising when the tight
squares and red circles in Fig. 4a) between the Law
agreement between the Law Dome CH4 record and the
Dome δ 13 C-CO2 record (Rubino et al., 2013) and the
WAIS CH4 record (Mitchell et al., 2011) around this
WAIS δ 13 C-CO2 record (Bauska et al., 2015). This dif-
time is considered (compare red circles and grey squares
ference is most likely due to an inter-laboratory off-
in Fig. 4c). The consistency between the Law Dome and
set but may also indicate a contribution from the CO2
the WAIS CH4 record rules out dating issues or large
discrepancy to its δ 13 C, or a combination of the two.
differences in smoothing of the atmospheric signals be-
It is not possible to quantify the inter-laboratory off-
tween the two sites. This suggests a chemical origin (in
set without running an inter-comparison study. How-
situ production) of the CO2 discrepancy, which is more
ever, it is possible to calculate a maximum effect of
likely to occur for CO2 than for CH4 . This interpretation
the in situ CO2 production on the δ 13 C measured at
is supported by additional evidence of 6 ppm discrep-
WAIS, assuming that the 3 ppm extra CO2 measured
Earth Syst. Sci. Data, 11, 473–492, 2019 www.earth-syst-sci-data.net/11/473/2019/M. Rubino et al.: Revised records of CO2 , CH4 , N2 O, and δ 13 C-CO2 from Law Dome, Antarctica 483
in WAIS (compared to an average pre-industrial CO2 NEEM CH4 record has not been synchronised with the
concentration of 280 ppm measured at Law Dome) is others, and there are multiple possible reasons, includ-
totally due to the in situ production and that it all ing age scale issues, different smoothing of the atmo-
comes from carbonate carbon (δ 13 C = 0 ‰) because spheric signals at the different sites, and inadequate
organic carbon with δ 13 C = −27 ‰ would make the sampling resolution, to explain the discrepancy found
WAIS δ 13 C-CO2 more negative than the Law Dome between the NEEM and the GISP2, Law Dome, and
δ 13 C-CO2 . Under this assumption, we calculate a possi- WAIS CH4 records during the LIA. A thorough investi-
ble shift of 0.07 ‰ through an isotope mass balance (= gation is out of the scope of this paper, but, in the future,
[0 − (−6.55)] · 3/283). This can only explain part of the this discrepancy should be resolved to obtain a precise
discrepancy but can go up to 0.14 ‰ if an extra amount synchronisation of all ice core records available over the
of 6 ppm is assumed (Ahn et al., 2012; Köhler et al., LIA.
2017b). The Bauska et al. (2015) record agrees within
uncertainties with the Francey et al. (1999) dataset. – The N2 O records from Greenland (Flückiger et al.,
However, Rubino et al. (2013) is the only record to 1999, EUROCORE and GRIP, grey and white squares
show consistency with all firn records and direct at- in Fig. 4d, respectively) and from EDC (Flückiger et
mospheric measurements (see Figs. 3c and 5a). This al., 2002, green squares in Fig. 4d) show higher scat-
would suggest that the Rubino et al. (2013) study is cur- ter than the Law Dome N2 O record. All records need
rently the most accurate record and should be used to higher sampling resolution to investigate changes of at-
set a pre-industrial baseline. However, no definite con- mospheric N2 O concentration over the last centuries
clusion can be drawn until a thorough inter-comparison with more confidence. A new N2 O record from a high-
study is carried out between the labs that have produced resolution site is required to explore the real variations
the WAIS and the Law Dome δ 13 C-CO2 datasets (Ore- in N2 O in the pre-industrial period (Ryu et al., 2018).
gon State University-University of Colorado-Institute of
Arctic and Alpine Research, INSTAAR and CSIRO). 3.3 The LIA and the 1610 CE CO2 minimum in DSS
It is important to resolve the difference between the (Law Dome)
Law Dome and the WAIS δ 13 C-CO2 records in order
to establish a pre-industrial baseline and, thus, a pre- In an attempt to produce δ 13 C data around the Law Dome
industrial-to-industrial δ 13 C-CO2 difference. Setting a 1610 CE CO2 minimum (sparsely sampled by Francey et al.,
pre-industrial baseline could have consequences on the 1999) and confirm the interpretation of its terrestrial origin
Last Glacial Maximum-to-pre-industrial δ 13 C-CO2 dif- (Rubino et al., 2016; Trudinger et al., 1999), in 2012 we
ference as well (Schmitt et al., 2012). These values are measured 18 samples from DSS, the only core from Law
useful for biogeochemical interpretation (Broecker and Dome covering the whole LPIH. The results both for CO2
McGee, 2013; Krakauer et al., 2006). and for δ 13 C are significantly lower than the spline fit to the
revised records from Law Dome (results not shown). Con-
– As expected, the Law Dome and WAIS CH4 concen- versely, the CH4 concentration measured is very consistent
trations are lower than the NEEM high-resolution CH4 with the spline fit to the revised CH4 record. In the past, ab-
record (Rhodes et al., 2013, the white triangles in Fig. 4c normally low CO2 concentration was interpreted as a sign of
show the median CH4 concentrations for 5-year time post coring melting (PCM), since CO2 is much more solu-
slices, after data outliers have been removed) by an ble than CH4 . With PCM, the N2 O concentration is usually
amount which is consistent with an inter-hemispheric low as well. However, in 7 of the 18 DSS samples that pro-
CH4 difference of 40–60 ppb (Mitchell et al., 2013). In- vided enough air to measure N2 O, the N2 O concentration
terestingly, the LIA CH4 decrease measured at NEEM was, on average, not significantly lower than the spline fit
appears to start before the CH4 decrease measured at to the revised Law Dome record. This argues against the hy-
Law Dome and WAIS. The age scale of the NEEM CH4 pothesis of PCM. Another possibility is the effect of clathrate
record published in Rhodes et al. (2013) (Fig. 4c) has formation, which could alter CO2 and δ 13 C, but issues due to
been revised with the updated ice-age scale published in clathrate can be ruled out because none of the ice cores in this
Sigl et al. (2015) and the new estimate of 1age provided study reached depths or temperatures sufficient for clathrate
by Buizert et al. (2014). Mitchell et al. (2013) have syn- formation, which can affect the extraction and measurement
chronised the GISP2 CH4 record with the WAIS CH4 of enclosed gases and 13 C-CO2 in particular (e.g. Schaefer
record to investigate changes of the interpolar difference et al., 2011). We do not have a definite explanation for the
in the pre-industrial based on the reasoning that “the low CO2 and δ 13 C measured, but the results suggest that
multidecadal events observed in both ice core records the DSS core may no longer be a reliable archive for CO2 .
must have occurred simultaneously since the durations This experiment was conducted while we were measuring
of the events were much larger than the atmospheric the DSS0506 CO2 samples published in Rubino et al. (2016).
mixing time (∼ 1 year)” (Mitchell et al., 2013). The During that survey, we also found a similar behaviour for 6 of
www.earth-syst-sci-data.net/11/473/2019/ Earth Syst. Sci. Data, 11, 473–492, 2019484 M. Rubino et al.: Revised records of CO2 , CH4 , N2 O, and δ 13 C-CO2 from Law Dome, Antarctica
the 34 DSS0506 samples measured. Since the two cores – olution) are best to infer budgets and hence biogeochemical
DSS0506 and DSS – were stored in the same freezer in Ho- information before direct atmospheric observations. The Law
bart (Tasmania, Australia), with DSS0506 stored for a shorter Dome records provide the highest resolution among existing
period, we suggest the low CO2 may be a recent effect of Antarctic ice cores. There have been recent studies looking
storage (see Supplement to Rubino et al., 2016). into the effects of firn microstructure (including density lay-
The LIA, and particularly the 1610 CE CO2 event, is im- ers) on bubble trapping (Burr et al., 2018; Fourteau et al.,
portant for our understanding of the carbon cycle dynamics 2017; Gregory et al., 2014; Mitchell et al., 2015). Improved
and the carbon–climate system in the past. It has been used understanding of these processes, how they affect smooth-
to derive the CO2 sensitivity to temperature (Cox and Jones, ing of atmospheric GHG signals, and their incorporation into
2008; Rubino et al., 2016), it is the most prominent biogeo- numerical models may lead to a more accurate quantification
chemical event during the LPIH, and it has even been sug- of the relationship between ice core GHG measurements at
gested as the beginning of the new geologic era called the different sites and the original atmospheric variations.
Anthropocene (Lewis and Maslin, 2015). Therefore, it is of The two major reservoirs of CO2 that can change atmo-
fundamental importance that we understand the amplitude of spheric concentrations over years to millennia are the terres-
the minimum as recorded by the ice and the timing and likely trial biosphere (land) and the oceans. Fossil fuel and land use
size of the original atmospheric decrease before smoothing emissions have added to these over recent centuries. Mea-
during firn diffusion and enclosure into bubbles. surements of δ 13 C-CO2 have been used to quantify the con-
tribution of land and ocean to the atmospheric CO2 varia-
3.4 Biogeochemical and climatic interpretation of the
tions measured (Joos et al., 1999; Joos and Bruno, 1998;
Law Dome GHG records
Trudinger et al., 2002a). For example, the interpretation of
CO2 and δ 13 C-CO2 variations through a double deconvolu-
The Law Dome GHG records have been used for biogeo- tion (Fig. 6a) has identified the terrestrial biosphere as the
chemical and climatic interpretation of changes in CO2 (Joos main contributor to the LIA CO2 decline (Rubino et al., 2013,
et al., 1999; Joos and Bruno, 1998; Rubino et al., 2013; 2016; Trudinger et al., 2002a). This agrees with the findings
Trudinger et al., 2002a), CH4 (Ferretti et al., 2005; Ghosh et of Bauska et al. (2015), who used the WAIS CO2 and δ 13 C-
al., 2015), and N2 O (Park et al., 2012) over the past decades CO2 records to suggest that changes in terrestrial organic
to millennia. They are also used as reference atmospheric carbon stores best explain the observed multi-decadal varia-
GHG records for model simulations of the carbon–climate tions in the δ 13 C-CO2 and in CO2 concentrations from 755 to
system of the LPIH (Graven et al., 2017; Köhler et al., 2017b; 1850 CE. This agreement of interpretation from the DSS and
Meinshausen et al., 2017). Here we present an overview of WAIS records shows that what matters for the biogeochem-
the insight obtained through interpretation of the Law Dome ical interpretation is the change in concentration over time,
GHG records and provide some perspective on the challenges rather than the absolute concentration measured in differ-
we will have to face to obtain a deeper understanding of the ent ice cores. The above studies assume consistency in the
carbon–climate system during the LPIH and the industrial inter-hemispheric transport of Northern Hemisphere terres-
period. trial emissions over multiple decades. Preliminary examina-
The biogeochemical interpretation of GHG variations de- tion suggests Southern Hemisphere δ 13 C-CO2 records over
pends on quantifying their sources and sinks. The concen- the last decades are more susceptible to multi-year changes
tration of GHGs in the atmosphere is the net result of the in the ratio of eddy to mean advective inter-hemispheric
processes releasing GHGs to the atmosphere (sources) and transport (Francey and Frederiksen, 2016; Frederiksen and
processes removing GHGs from the atmosphere (sinks). Francey, 2018) than is the case for CO2 concentration, as a
The atmospheric circulation then redistributes GHGs assum- result of differences in isotopic equilibration that occur for
ing consistency in the reasonably well-known patterns of the two transport modes.
air movement. Measuring the atmospheric concentration of An additional constraint for the biogeochemical interpre-
GHGs provides one constraint on the net sources vs. sinks. tation of the LIA CO2 decrease has recently come from the
However, generally, multiple sources and sinks act simul- new interpretation (Rubino et al., 2016) of the record of car-
taneously. Therefore, multiple constraints are necessary to bonyl sulfide (COS; Aydin et al., 2008) from the SPRESSO
partition the contribution of each source or sink. Measur- ice core (South Pole Remote Earth Science and Seismologi-
ing the isotopic composition of each GHG provides an ad- cal Observatory) and modelling of its increase over the LIA
ditional constraint (albeit usually with additional complex- (Rubino et al., 2016). Rubino et al. (2016) showed that the
ity), but there are also other independent constraints, such simultaneous COS increase during the LIA confirms that the
as the inter-hemispheric difference or evidence coming from LIA CO2 decline was caused by net terrestrial uptake due to
other species, that help quantify the contribution of sources cooling (heterotrophic respiration declining more than gross
and sinks. Additionally, the net GHG emission strength is re- primary production, due to its higher sensitivity to temper-
flected in the rate of change in atmospheric concentration. ature changes), though a very recent paper estimating the
Thus, ice core records that track rapid changes (i.e. high res- amount of carbon taken up by land use change following
Earth Syst. Sci. Data, 11, 473–492, 2019 www.earth-syst-sci-data.net/11/473/2019/M. Rubino et al.: Revised records of CO2 , CH4 , N2 O, and δ 13 C-CO2 from Law Dome, Antarctica 485 Figure 6. Biogeochemical and climatic interpretation of the Law Dome GHG records: (a) atmospheric CO2 fluxes from (negative values on the y axis) and to (positive values on the y axis) the terrestrial biosphere (land: green line) and the ocean (blue line), resulting from the double deconvolution of CO2 and δ 13 C-CO2 (Rubino et al., 2016). (b) Flux of atmospheric CH4 from biomass burning (Ferretti et al., 2005). (c) Temperature variations in different continents in the Northern Hemisphere (Asia: yellow line; Europe: blue line; North America: red line) from Pages2k (2013). (d) Palmer Drought Severity Index (PSDI) of different continents in the Northern Hemisphere (Asia: yellow line; Europe: blue line; North America: red line) from Cook et al. (2009, 2010, 2015). (e) Atmospheric CO2 fluxes from different continents in the Northern Hemisphere (Asia: yellow line; Europe: blue line; North America: red line) due to pre-industrial land use change from Pongratz et al. (2012). the colonisation of the Americas by the Europeans (Koch et CO2 measurements suggest that the oceans were responsible al., 2019) provides a different view. Nonetheless, the multi- for at least two-thirds of this uptake (Rubino et al., 2013; species approach used by Rubino et al. (2016, e.g. using Trudinger, 2000, Sect. 6.4; Trudinger et al., 2002a). Bastos et trends of CO2 , δ 13 C-CO2 , and COS) can provide multiple al. (2016) used the latest estimates of fossil fuel and land-use constraints to help understand the biogeochemical processes change emissions, ocean uptake reconstructions, and terres- behind atmospheric CO2 variations over the recent past. trial models but were not able to explain the plateau, although The 1940s CO2 plateau is a prominent feature in the indus- they did not consider decadal variability in the ocean carbon trial part of the Law Dome CO2 record and occurs at a time sink that may have been important. Better understanding of of continued fossil fuel emissions. Taking into consideration the 1940s feature is needed to quantify how variable ocean the smoothing effects of firn diffusion and bubble trapping on and land carbon exchange can be on multi-year to decadal the rate of change in potential atmospheric signals, an uptake timescales and how this variability relates to climate variabil- of around 2–3 GtC yr−1 between 1942 and 1949 would be re- ity. Improved understanding is expected to come from more quired to explain the observed plateau. The Law Dome δ 13 C- high-precision, high-time-resolution ice core measurements www.earth-syst-sci-data.net/11/473/2019/ Earth Syst. Sci. Data, 11, 473–492, 2019
486                        M. Rubino et al.: Revised records of CO2 , CH4 , N2 O, and δ 13 C-CO2 from Law Dome, Antarctica

to confirm δ 13 C-CO2 variation through the industrial period,      Schilt et al. (2014). As already mentioned, the pre-industrial
additional constraints such as COS, better understanding of         inter-hemispheric N2 O difference is also poorly constrained.
the smoothing effects on trapped air, and improved modelling        Thus, there is room for vast improvement to understand the N
of other influences on atmospheric δ 13 C-CO2 such as the ef-       cycle from measurements of N2 O concentration and its iso-
fect of climate on isotopic discrimination (Randerson et al.,       topes in ice cores (Schilt et al., 2014). However, there is a
2002; Scholze et al., 2003).                                        risk of in situ production of N2 O, especially in Greenland ice
    There are multiple natural sources–sinks of CH4 : geologi-      (Flückiger et al., 2002). More records, with high sampling
cal, wetlands, wildfires, termites, and ocean sediments are the     resolution, from both hemispheres are needed to confirm the
main sources, while oxidation by tropospheric species (OH),         features found in Law Dome (MacFarling Meure et al., 2006)
oxidation by stratospheric species (OH, Cl, and O(1-D)), ox-        and understand the causes of the changes in N2 O concentra-
idation in soils and reactive chlorine in the marine boundary       tion over time (Ryu et al., 2018).
layer are the main sinks. Also for CH4 , measurements of its           The climatic interpretation of the Law Dome GHG records
isotopic composition (δ 13 C-CH4 and δD-CH4 ) have helped           has generally been carried out by comparing the timing of
quantify the contribution of land vs. ocean to the measured         GHG variations and temperature changes and testing hy-
atmospheric CH4 variations (Ferretti et al., 2005; Mischler et      potheses of mechanistic relationships between the two with
al., 2009; Sapart et al., 2012). However, because there are         coupled carbon cycle–climate models.
more distinct CH4 source types than isotopic tracers, and              An important climatic event of the LPIH is the Medieval
more spatially distributed sources than can be resolved by          Climate Anomaly (MCA, roughly 950–1250 CE), which
the geographically restricted suite of ice cores (despite the       showed higher temperature in some regions (Goosse et al.,
fact that the ice cores of Antarctica and Greenland are both        2005; Mann et al., 2009). During the MCA, there are gen-
known to provide reliable CH4 records), a unique solution for       erally higher levels of GHGs, but the timings of increase
the history of CH4 sources is not possible. Nonetheless, the        vary from one gas to another, with N2 O showing a rise be-
full suite of isotopic tracers and bipolar ice core data provides   tween 701 and 822 CE (well before the start of the MCA),
important boundary conditions for testing hypothetical CH4          CO2 increasing between 950 and 1200 CE, and CH4 show-
source–sink histories, allowing elimination of large classes        ing some variability superimposed on a long-term increasing
of scenarios. By measuring δ 13 C-CH4 in Law Dome ice,              trend (Fig. 4b–d).
Ferretti et al. (2005) provided evidence of a remarkable de-           The main climatic event of the last 2 millennia is the LIA
crease in pyrogenic CH4 during the last millennium (Fig. 6b).       (roughly 1400–1700 CE; Mann et al., 2008; Neukom et al.,
This interpretation was confirmed by Mischler et al. (2009)         2014; Pages2k, 2013). There is a clear decrease in all GHGs
and Sapart et al. (2012), who measured both δ 13 C-CH4 and          during the LIA, which, together with the other evidence men-
δD-CH4 in ice cores from Antarctica and Greenland, respec-          tioned above, suggests that all processes releasing GHG from
tively. They also found an increasing agricultural source of        land slowed down during the cold phase (Fig. 4b–d). How-
CH4 throughout the last millennium, with most of the change         ever, as for the MCA, the change in concentration is not si-
occurring between the 1500s and the 1600s, supporting the           multaneous for all GHGs. While both CO2 and N2 O seem
hypothesis of a pre-industrial anthropogenic influence on at-       to decrease starting around 1550 CE (but N2 O would need
mospheric CH4 . Additional source information is provided           higher sampling resolution to confirm this), CH4 has a later
by measurements of carbon monoxide (CO) and its isotopes            decline, starting around 1580 CE. Also, the CH4 decrease
(δ 13 C-CO and δ 18 O-CO; Wang et al., 2010), through evi-          seems to last for a shorter period of time, ending around
dence of variations in biomass burning, and 14 CH4 , which          1610 CE, whereas the CO2 low is maintained longer, end-
identifies CH4 emissions from fossil sources. However, the          ing about 1750 CE. At the same time, there was a signifi-
measurement of 14 CH4 is limited so far to large air samples        cant decrease in biomass burning (Ferretti et al., 2005; Mis-
extracted from firn (Lassey et al., 2007a, b) or from large ice     chler et al., 2009; Sapart et al., 2012; Wang et al., 2010),
samples collected where glacial-age ice outcrops at the sur-        interpreted to be mostly a consequence of decreased fire
face (Petrenko et al., 2009, 2017).                                 emissions. While the relationship between CO2 and tem-
    There are also multiple natural sources and sinks of N2 O,      perature variation has been used to infer the sensitivity of
both on land and in the ocean. The main sources are micro-          CO2 to temperature (Cox and Jones, 2008; Rubino et al.,
biological processes, especially in tropical soils, while the       2016), confirming and quantifying a positive feedback of ter-
main sinks are photochemical reactions in the atmosphere.           restrial carbon with temperature (Rubino et al., 2016), it is
To the best of our knowledge, there are only two attempts to        now time to investigate the regional contribution to the to-
use δ 15 N-N2 O and δ 18 O-N2 O records to better constrain the     tal CO2 change, as attempted by Bauska et al. (2015), and
land vs. ocean sources of N2 O over the last century (Park et       the contribution from different processes within the terres-
al., 2012; Prokopiou et al., 2017), and these used the larger       trial biosphere, such as net primary production, heterotrophic
volumes of air available in firn. Only one study (Prokopiou         respiration, and biomass burning. There are regional (Mann
et al., 2018) has extended the investigation to the last millen-    et al., 2008), continental (Pages2k, 2013), and hemispheric
nia, but there is an analysis covering the last deglaciation by     (Neukom et al., 2014) temperature reconstructions that can

Earth Syst. Sci. Data, 11, 473–492, 2019                                             www.earth-syst-sci-data.net/11/473/2019/
You can also read