TONGA CLIMATE RISK COUNTRY PROFILE - World Bank Climate ...
←
→
Page content transcription
If your browser does not render page correctly, please read the page content below
CLIMATE RISK COUNTRY PROFILE

         TONGA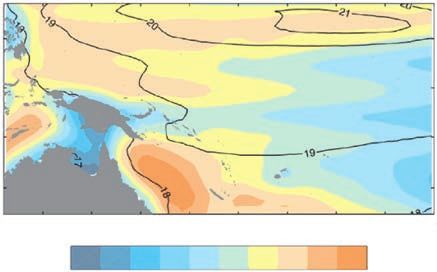
COPYRIGHT
© 2021 by the World Bank Group
1818 H Street NW, Washington, DC 20433
Telephone: 202-473-1000; Internet: www.worldbank.org

© 2021 Asian Development Bank
6 ADB Avenue, Mandaluyong City, 1550 Metro Manila, Philippines
Tel +63 2 8632 4444; Fax +63 2 8636 2444
www.adb.org

This work is a product of the staff of the World Bank Group (WBG) and the Asian Development Bank (ADB) and with external
contributions. The opinions, findings, interpretations, and conclusions expressed in this work are those of the authors’ and do not
necessarily reflect the views or the official policy or position of the WBG, its Board of Executive Directors, or the governments
it represents or of ADB, its Board of Governors, or the governments they represent.

The WBG and ADB do not guarantee the accuracy of the data included in this work and do not make any warranty, express or
implied, nor assume any liability or responsibility for any consequence of their use. This publication follows the WBG’s practice in
references to member designations, borders, and maps. The boundaries, colors, denominations, and other information shown on
any map in this work, or the use of the term “country” do not imply any judgment on the part of the WBG or ADB, their respective
Boards, or the governments they represent, concerning the legal status of any territory or geographic area or the endorsement
or acceptance of such boundaries.

The mention of any specific companies or products of manufacturers does not imply that they are endorsed or recommended
by either the WBG or ADB in preference to others of a similar nature that are not mentioned.

RIGHTS AND PERMISSIONS
The material in this work is subject to copyright. Because the WB and ADB encourage dissemination of their knowledge, this
work may be reproduced, in whole or in part, for noncommercial purposes as long as full attribution to this work is given. This
work is licensed under the Creative Commons Attribution-NonCommercial 3.0 IGO License. To view a copy of this license, visit
http://creativecommons.org/licenses/by-nc/3.0/igo/ or send a letter to Creative Commons, PO Box 1866, Mountain View,
CA 94042, USA.

This CC license does not apply to WBG or non-ADB copyright materials in this publication. If the material is attributed to another
source, please contact the copyright owner or publisher of that source for permission to reproduce it. WBG or ADB cannot be
held liable for any claims that arise as a result of your use of the material.

Please cite the work as follows: Climate Risk Country Profile: Tonga (2021): The World Bank Group and the Asian
Development Bank.

Any queries on rights and licenses, including subsidiary rights, should be addressed to World Bank Publications, The World Bank
Group, 1818 H Street NW, Washington, DC 20433, USA; fax: 202-522-2625; e-mail: pubrights@worldbank.org.

Cover Photos: © M W, “Tonga” July 31, 2015 via Flickr, Creative Commons CC BY-NC-ND 2.0. © Sarah Keleman Garber,
“Tonga/Samoa 2009” January 30, 2009 via Flickr, Creative Commons CC BY-NCND 2.0.

Graphic Design: Circle Graphics, Reisterstown, MD.

CLIMATE RISK COUNTRY PROFILE: TONGA                                                                                               ii
ACKNOWLEDGEMENTS
This profile is part of a series of Climate Risk Country Profiles that are jointly developed by the World Bank Group (WBG) and the
Asian Development Bank (ADB). These profiles synthesize the most relevant data and information on climate change, disaster
risk reduction, and adaptation actions and policies at the country level. The profile is designed as a quick reference source for
development practitioners to better integrate climate resilience in development planning and policy making. This effort is co-led
by Veronique Morin (Senior Climate Change Specialist, WBG), Ana E. Bucher (Senior Climate Change Specialist, WBG) and
Arghya Sinha Roy (Senior Climate Change Specialist, ADB).

This profile was written by Alex Chapman (Consultant, ADB), Denyse Dookie (Consultant, ADB), William Davies (Consultant,
ADB), and Ciaran Downey (Consultant). Technical review of the profiles was undertaken by Robert L. Wilby (Loughborough
University). Additional support was provided by MacKenzie Dove (Senior Climate Change Consultant, WBG), Jason Johnston
(Operations Analyst, WBG), Yunziyi Lang (Climate Change Analyst, WBG), Adele Casorla-Castillo (Consultant, ADB), and
Charles Rodgers (Consultant, ADB). This profile also benefitted from inputs of WBG and ADB regional staff and country teams.

Climate and climate-related information is largely drawn from the Climate Change Knowledge Portal (CCKP), a WBG online
platform with available global climate data and analysis based on the current Intergovernmental Panel on Climate Change (IPCC)
reports and datasets. The team is grateful for all comments and suggestions received from the sector, regional, and country
development specialists, as well as climate research scientists and institutions for their advice and guidance on use of climate
related datasets.

CLIMATE RISK COUNTRY PROFILE: TONGA                                                                                            iii
CONTENTS

FOREWORD  .  .  .  .  .  .  .  .  .  .  .  .  .  .  .  .  .  .  .  .  .  .  .  .  .  .  .  .  .  .  .  .  .  .  .  . 1

KEY MESSAGES .   .   .   .   .   .   .   .   .   .   .   .   .   .   .   .   .   .   .   .   .   .   .   .   .   .   .   .   .   .   .   .   .   .  2

COUNTRY OVERVIEW .   .   .   .   .   .   .   .   .   .   .   .   .   .   .   .   .   .   .   .   .   .   .   .   .   .   .   .   .   .   .  2

CLIMATOLOGY  .   .   .   .   .   .   .   .   .   .   .   .   .   .   .   .   .   .   .   .   .   .   .   .   .   .   .   .   .   .   .   .   .   .   5
   Climate Baseline .  .  .  .  .  .  .  .  .  .  .  .  .  .  .  .  .  .  .  .  .  .  .  .  .  .  .  .  .  .  .  .  .  .  .  .  .  .  .  .           5
      Overview  .  .  .  .  .  .  .  .  .  .  .  .  .  .  .  .  .  .  .  .  .  .  .  .  .  .  .  .  .  .  .  .  .  .  .  .  .  .  .  .  .  .         5
      Key Trends .  .  .  .  .  .  .  .  .  .  .  .  .  .  .  .  .  .  .  .  .  .  .  .  .  .  .  .  .  .  .  .  .  .  .  .  .  .  .  .  .           6
   Climate Future .  .  .  .  .  .  .  .  .  .  .  .  .  .  .  .  .  .  .  .  .  .  .  .  .  .  .  .  .  .  .  .  .  .  .  .  .  .  .  .  .          7
      Overview  .  .  .  .  .  .  .  .  .  .  .  .  .  .  .  .  .  .  .  .  .  .  .  .  .  .  .  .  .  .  .  .  .  .  .  .  .  .  .  .  .  .         7
      Model Ensemble .  .  .  .  .  .  .  .  .  .  .  .  .  .  .  .  .  .  .  .  .  .  .  .  .  .  .  .  .  .  .  .  .  .  .  .  .  .  .             8

CLIMATE RELATED NATURAL HAZARDS .   .   .   .   .   .   .   .   .   .   .   .   .   .   .   .   .   .   .   .   .   . 11
       Heatwaves .  .  .  .  .  .  .  .  .  .  .  .  .  .  .  .  .  .  .  .  .  .  .  .  .  .  .  .  .  .  .  .  .  .  .  .  .  .  .  .  . 11
       Drought  .  .  .  .  .  .  .  .  .  .  .  .  .  .  .  .  .  .  .  .  .  .  .  .  .  .  .  .  .  .  .  .  .  .  .  .  .  .  .  .  .  . 12
       Flood, Cyclones, and Storm Surge .  .  .  .  .  .  .  .  .  .  .  .  .  .  .  .  .  .  .  .  .  .  .  .  .  .  .  .  .  .  . 12

CLIMATE CHANGE IMPACTS .   .   .   .   .   .   .   .   .   .   .   .   .   .   .   .   .   .   .   .   .   .   .   .   .   .   .   . 14
   Natural Resources  .  .  .  .  .  .  .  .  .  .  .  .  .  .  .  .  .  .  .  .  .  .  .  .  .  .  .  .  .  .  .  .  .  .  .  .  .  .  . 14
     Water .  .  .  .  .  .  .  .  .  .  .  .  .  .  .  .  .  .  .  .  .  .  .  .  .  .  .  .  .  .  .  .  .  .  .  .  .  .  .  .  .  .  . 14
     The Coastal Zone  .  .  .  .  .  .  .  .  .  .  .  .  .  .  .  .  .  .  .  .  .  .  .  .  .  .  .  .  .  .  .  .  .  .  .  .  .  . 15
     Coral Reefs and Fisheries .  .  .  .  .  .  .  .  .  .  .  .  .  .  .  .  .  .  .  .  .  .  .  .  .  .  .  .  .  .  .  .  .  .  . 17
     Island Ecology .  .  .  .  .  .  .  .  .  .  .  .  .  .  .  .  .  .  .  .  .  .  .  .  .  .  .  .  .  .  .  .  .  .  .  .  .  .  .  . 18
   Economic Sectors  .  .  .  .  .  .  .  .  .  .  .  .  .  .  .  .  .  .  .  .  .  .  .  .  .  .  .  .  .  .  .  .  .  .  .  .  .  .  . 19
     Agriculture and Food .  .  .  .  .  .  .  .  .  .  .  .  .  .  .  .  .  .  .  .  .  .  .  .  .  .  .  .  .  .  .  .  .  .  .  .  . 19
     Tourism . . . . . . . . . . . . . . . . . . . . . . . . . . . . . . . . . . . . . . . . . . 19
   Communities  .  .  .  .  .  .  .  .  .  .  .  .  .  .  .  .  .  .  .  .  .  .  .  .  .  .  .  .  .  .  .  .  .  .  .  .  .  .  .  .  . 20
     Poverty, Inequality and Vulnerability to Climate-Related Disaster  .  .  .  .  .  .  .  .  .  .  .  .  .  .  .  . 20
     Human Health .  .  .  .  .  .  .  .  .  .  .  .  .  .  .  .  .  .  .  .  .  .  .  .  .  .  .  .  .  .  .  .  .  .  .  .  .  .  .  . 21

POLICIES AND PROGRAMS  .   .   .   .   .   .   .   .   .   .   .   .   .   .   .   .   .   .   .   .   .   .   .   .   .   .   .   . 23
       National Adaptation Policies and Strategies .  .  .  .  .  .  .  .  .  .  .  .  .  .  .  .  .  .  .  .  .  .  .  .  .  . 23
       Climate Change Priorities of ADB and the WBG .  .  .  .  .  .  .  .  .  .  .  .  .  .  .  .  .  .  .  .  .  .  .  . 23

CLIMATE RISK COUNTRY PROFILE: TONGA                                                                                                                  iv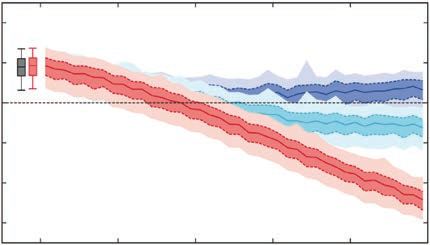
FOREWORD

Climate change is a major risk to good development outcomes, and the World Bank Group is committed to playing an important
role in helping countries integrate climate action into their core development agendas. The World Bank Group (WBG) and the
Asian Development Bank (ADB) are committed to supporting client countries to invest in and build a low-carbon, climate-
resilient future, helping them to be better prepared to adapt to current and future climate impacts.

Both institutions are investing in incorporating and systematically managing climate risks in development operations through
their individual corporate commitments.

For the World Bank Group: a key aspect of the World Bank Group’s Action Plan on Adaptation and Resilience (2019) is to help
countries shift from addressing adaptation as an incremental cost and isolated investment to systematically incorporating climate
risks and opportunities at every phase of policy planning, investment design, implementation and evaluation of development
outcomes. For all International Development Association and International Bank for Reconstruction and Development operations,
climate and disaster risk screening is one of the mandatory corporate climate commitments. This is supported by the World
Bank Group’s Climate and Disaster Risk Screening Tool which enables all Bank staff to assess short- and long-term climate
and disaster risks in operations and national or sectoral planning processes. This screening tool draws up-to-date and relevant
information from the World Bank’s Climate Change Knowledge Portal, a comprehensive online ‘one-stop shop’ for global,
regional, and country data related to climate change and development.

For the Asian Development Bank (ADB): its Strategy 2030 identified “tackling climate change, building climate and disaster
resilience, and enhancing environmental sustainability” as one of its seven operational priorities. Its Climate Change Operational
Framework 2017–2030 identified mainstreaming climate considerations into corporate strategies and policies, sector and
thematic operational plans, country programming, and project design, implementation, monitoring, and evaluation of climate
change considerations as the foremost institutional measure to deliver its commitments under Strategy 2030. ADB’s climate
risk management framework requires all projects to undergo climate risk screening at the concept stage and full climate risk
and adaptation assessments for projects with medium to high risk.

Recognizing the value of consistent, easy-to-use technical resources for our common client countries as well as to support
respective internal climate risk assessment and adaptation planning processes, the World Bank Group’s Climate Change Group
and ADB’s Sustainable Development and Climate Change Department have worked together to develop this content. Standardizing
and pooling expertise facilitates each institution in conducting initial assessments of climate risks and opportunities across sectors
within a country, within institutional portfolios across regions, and acts as a global resource for development practitioners.

For common client countries, these profiles are intended to serve as public goods to facilitate upstream country diagnostics,
policy dialogue, and strategic planning by providing comprehensive overviews of trends and projected changes in key climate
parameters, sector-specific implications, relevant policies and programs, adaptation priorities and opportunities for further actions.

We hope that this combined effort from our institutions will spur deepening of long-term risk management in our client countries
and support further cooperation at the operational level.

Bernice Van Bronkhorst                            Preety Bhandari
Global Director                                   Chief of Climate Change and Disaster Risk Management Thematic Group
Climate Change Group                              concurrently Director Climate Change and Disaster Risk Management Division
The World Bank Group                              Sustainable Development and Climate Change Department
                                                  Asian Development Bank

CLIMATE RISK COUNTRY PROFILE: TONGA                                                                                                 1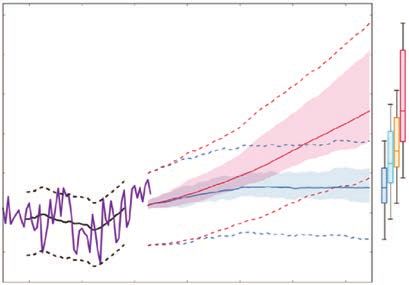
KEY MESSAGES

•     Tonga’s island groups have observed historical warming of around 0.6°C between 1979 and 2018.
•     Future trends in warming are obscured by the inability of climate models to accurately simulate trends at
      sufficiently small spatial scales. Warming is likely to take place at a rate slightly lower than the global average.
      On the highest emissions pathway (RCP8.5) warming of around 2.6°C is projected by the end of the century.
•     Tonga faces a diverse set of risks from climate change but data and reliable model projections are lacking,
      presenting challenges for decision makers.
•     Potential threats to human well-being and natural ecosystems include increased prevalence of heatwave,
      intensified cyclones, saline intrusion, wave-driven flooding, and permanent inundation.
•     Biodiversity and the natural environment of Tonga face extreme pressure, and loss of some species of fish,
      coral, bird, and terrestrial species is likely without very effective conservation measures.
•     Tonga faces a potential long-term threat from permanent inundation and wave-driven flooding, and some
      studies have suggested that significant displacement of communities could take place.
•     Research has suggested that the risk of large-scale flooding and inundation will depend on the success of
      coral conservation, and future geomorphological patterns which build and erode land.
•     Tonga’s population already lives in a dynamic ecosystem, to which it has adapted, but climate change is likely
      to increase variability, pose new threats, and place stress on livelihoods.
•     Communities are likely to need support to adapt and manage disaster risks facing their wellbeing, livelihoods,
      and infrastructure. Geographic isolation and economic vulnerabilities, including dependence on remittance and
      foreign aid, will increase the challenges faced by communities and decision makers.

COUNTRY OVERVIEW

T
       he Kingdom of Tonga is an archipelago consisting of four clusters of 172 coral and volcanic islands with
       a total area of 747 square kilometres (km2), located in the Central South Pacific Ocean.1 Tonga is situated
       at the subduction zone of the Indian-Australian and the Pacific tectonic plates and lies within the Ring of
Fire where intense seismic activities occur. The islands are formed on the tops of two parallel submarine ridges
stretching from Southwest to Northeast and enclosing a 50 km wide trough.2 Most of the islands in Tonga originate
from coral line, and some islands are of volcanic origin. The majority of these islands are comparatively flat except
for those raised by tectonic action. Several volcanoes, some of which are still active, exist along the western ridge,
while many coral islands have formed along the eastern ridge, amongst them are the Vava’u and Ha’apai island
groups. Coral islands are in two categories, the low and raised coral islands.

1
    WBG Climate Change Knowledge Portal (CCKP, 2020). Tonga. URL: https://climateknowledgeportal.worldbank.org/country/Tonga
    [accessed 10/08/2019]
2
    Ministry of Environment and Climate Change (2021). Third National Communication to UNFCCC. URL: https://unfccc.int/sites/
    default/files/resource/Final%20TNC%20Report_December%202019.pdf [accessed 10/08/2019]

CLIMATE RISK COUNTRY PROFILE: TONGA                                                                                             2
Tonga’s climate is tropical and is defined by a wet season from November to April with moderate and variable
rainfall, and a dry season from May to October.1 The mean annual temperature in Tonga varies from 23°C to 26°C.
Climate in Tonga and this portion of the Pacific in general is governed by a number of factors, which include the
trade winds and the movement of the South Pacific Convergence Zone (SPCZ), a zone of high-pressure rainfall
that migrates across the Pacific south of the equator. Year-to-year variability in climate is also strongly influenced
by the El Niño Southern Oscillation (ENSO) in the south-east Pacific, which can bring prolonged drought conditions
and contribute to a depletion of potable water, and tropical cyclones that occur during the wet season, causing
extensive damage to local infrastructure, agriculture, and major food sources.
As of 2019, Tonga’s population was estimated at nearly 104,500 people over 18,005 households – about
74% of the total population resides on the largest island of Tongatapu (at 260 km2).3 Tonga enjoys a relatively
strong position as a lower middle-income country, in part due to its high migration and remittance culture. Tonga
continues to rely on current transfers (workers’ remittances and government transfers) to support household
and government consumption.4 It is estimated that about 50% of all Tongans live overseas and their remittances
represent approximately 50–60%2 of gross national domestic income.1
The economy of Tonga is highly dependent on climate sensitive sectors such agriculture, fisheries and tourism
and a limited resource base that is sensitive to external shocks. According to Tonga’s latest available statistics,
in 2015–16 the service sector contribution to GDP (including tourism trade, and hospitality, and as measured
in current prices) was 54.5%, while agriculture contributed 14.7% to GDP in current prices. 4 Increased local
market production and export of fruit and vegetables including the main crop, squash, as well as kava, yams, and
sweet potatoes, contributed to an increasing value of agriculture in the year of estimation. The agricultural sector
supports the majority of the population for subsistence and for cash income, employing a third of the labour force
and accounting for at least 50% of the export earnings.2 The gross value-added of fishing activities increased from
7.4% of GDP in 2014–15 to 15.6% in 2015–16, largely as a result of increasing exports which includes prepared
and preserved fish and seaweed.4
Green, Inclusive and Resilient Recovery
The coronavirus disease (COVID-19) pandemic has led to unprecedented adverse social and economic impacts.
Further, the pandemic has demonstrated the compounding impacts of adding yet another shock on top of
the multiple challenges that vulnerable populations already face in day-to-day life, with the potential to create
devastating health, social, economic and environmental crises that can leave a deep, long-lasting mark. However,
as governments take urgent action and lay the foundations for their financial, economic, and social recovery, they
have a unique opportunity to create economies that are more sustainable, inclusive and resilient. Short and long-
term recovery efforts should prioritize investments that boost jobs and economic activity; have positive impacts on
human, social and natural capital; protect biodiversity and ecosystems services; boost resilience; and advance the
decarbonization of economies.
3
Tonga Department of Statistics (2019). Tonga Statistics at a Glance. URL: https://tonga.prism.spc.int/ [accessed 10/08/2019]
4
Tonga Department of Statistics (2017). National Accounts Statistics 2015–16. URL: https://tonga.prism.spc.int/component/
advlisting/?view=download&fileId=2240 [accessed 10/08/2019]
CLIMATE RISK COUNTRY PROFILE: TONGA 3Tonga submitted its Third National Communication to the UNFCCC in 2020, its Initial Nationally Determined
Contributions in 2016, its Second Nationally Determined Contributions in 2020 and ratified the Paris Agreement
in 2016. This document aims to succinctly summarize the climate risks faced by the Kingdom of Tonga. This
includes rapid onset and long- term changes in key climate parameters, as well as impacts of these changes on
communities, livelihoods and economies, many of which are already underway. This is a high-level synthesis of
existing research and analyses, focusing on the geographic domain of Tonga, therefore potentially excluding some
international influences and localized impacts. The core climate projections presented are sourced from the Pacific-
Australia Climate Change Science and Adaptation Planning Program,5,6 as well as the World Bank Group’s Climate
Change Knowledge Portal (CCKP), incorporating climate projections from the Coupled Model Inter-comparison
Project Phase 5 (CMIP5). This document is primarily meant for WBG and ADB staff to inform their climate actions.
The document also aims and to direct the reader to many useful sources of secondary data and research.
TABLE 1. Key indicators
Indicator Value Source
Population Undernourished 7 N/A FAO, 2020
National Poverty Rate 8 22.1% (2015) ADB, 2020a
Share of Wealth Held by Bottom 20% 9 6.8% (2015) World Bank, 2019
Net Annual Migration Rate10 −0.8% (2015–20) UNDESA, 2019
Infant Mortality Rate (Between Age 0 and 1) 11 1.3% (2015–20) UNDESA, 2019
Average Annual Change in Urban Population 12 0.7% (2015–20) UNDESA, 2019
Dependents per 100 Independent Adults 13 69 (2020) UNDESA, 2019
Urban Population as % of Total Population14 23.1% (2020) CIA, 2020
External Debt Ratio to GNI 15 41.3% (2018) ADB, 2020b
Government Expenditure Ratio to GDP 16 42.9% (2019) ADB, 2020b
5
Australian Bureau of Meteorology and CSIRO (2014) Climate Variability, Extremes and Change in the Western Tropical Pacific:
New Science and Updated Country Reports. Pacific-Australia Climate Change Science and Adaptation Planning Program Technical
Report, Australian Bureau of Meteorology and CSIRO, Melbourne, Australia. URL: https://www.pacificclimatechangescience.org/
wp-content/uploads/2014/07/PACCSAP_CountryReports2014_WEB_140710.pdf
6
The NextGen projections for the Pacific region under CMIP5 are expected to be available from July 2021. These will provide an
update on the PACCSAP 2014 projections referenced in this profile. The process for providing the new NextGen CMIP6 projections
for the Pacific is still in the planning phase.
7
FAO, IFAD, UNICEF, WFP, WHO (2020). The state of food security and nutrition in the world. Building Resilience for peace and food
security. FAO. Rome. URL: http://www.fao.org/documents/card/en/c/ca9692en/
8
ADB (2020a). Basic Statistics 2020. URL: https://www.adb.org/publications/basic-statistics-2020
9
World Bank (2019). Income share held by lowest 20%. URL: https://data.worldbank.org/indicator/SI.DST.FRST.20 [accessed 15/02/2021]
10
UNDESA (2019). World Population Prospects 2019. URL: https://population.un.org/wpp/Download/Standard/Population/
[accessed 15/02/2021]
11
UNDESA (2019). World Population Prospects 2019. URL: https://population.un.org/wpp/Download/Standard/Population/
[accessed 15/02/2021]
12
UNDESA (2019). World Urbanization Prospects 2019. URL: https://population.un.org/wup/Download/ [accessed 15/02/2021]
13
UNDESA (2019). World Population Prospects 2019. URL: https://population.un.org/wpp/Download/Standard/Population/
[accessed 15/02/2021]
14
CIA (2020). The World Factbook. Central Intelligence Agency. Washington DC. URL: https://www.cia.gov/the-world-factbook/
15
ADB (2020b). Key Indicators for Asia and the Pacific 2020, 51st Edition. Asian Development Bank. Manila. URL: https://www.adb.org/
sites/default/files/publication/632971/ki2020.pdf
16
ADB (2020b). Key Indicators for Asia and the Pacific 2020, 51st Edition. Asian Development Bank. Manila. URL: https://www.adb.org/
sites/default/files/publication/632971/ki2020.pdf
CLIMATE RISK COUNTRY PROFILE: TONGA 4Due to a combination of political, geographic, and
social factors, Tonga is recognized as vulnerable FIGURE 1. The ND-GAIN Index score (out of
to climate change impacts, ranked 121 out of 100) summarizes a country’s vulnerability to
181 countries in the 2020 ND-GAIN Index. 17 The climate change and other global challenges
ND-GAIN Index ranks 181 countries using a score in combination with its readiness to improve
which calculates a country’s vulnerability to climate resilience. It aims to help businesses and the
change and other global challenges as well as their public sector better prioritize investments for
readiness to improve resilience. The more vulnerable a more efficient response to the immediate
a country is the lower their score, while the more ready global challenges ahead
a country is to improve its resilience the higher it will 48
be. Norway has the highest score and is ranked 1st.
46
Figure 1 is a time-series plot of the ND-GAIN Index
showing Tonga’s progress.
44
Score
42
40
38
1995 1997 1999 2001 2003 2005 2007 2009 2011 2013
Tonga
CLIMATOLOGY
Climate Baseline
Overview
Tonga has a tropical climate throughout the year reflecting its position within the southeast trade wind zone of
the South Pacific.2 Mean annual precipitation has averaged 1,666 millimetres (mm) over the period 1901–2019,
but there is a marked seasonality in the Tongan rainfall: a dry season from May to October and a wet season from
November to April.1 Most of Tonga’s rainfall occurs from convective processes, from tropical cyclones and from rain
associated with the cloud sheets of the subtropical jet.2 While convective rainfall occurs all year round, it is most
pronounced during the wet season. Meanwhile the organized large-scale precipitation (e.g. cold fronts) usually
occurs during the cooler dry months. The spatial variation of monthly and annual rainfall over Tonga highlights that
the northern-most islands receive the most rainfall due to the influences of the South Pacific Convergence Zone
(SPCZ). Tonga’s climate pattern is very much affected by the El Niño phenomenon.2 As the warm sea surface
temperatures move east during El Niño, moisture and water vapour required for cloud formation also migrate
eastward, influencing drought conditions in Tonga. The last three major droughts that have occurred in Tonga in
1983, 1998 and 2006 have been directly linked to El Niño events around the same time.
17
University of Notre Dame (2019). Notre Dame Global Adaptation Initiative. URL: https://gain.nd.edu/our-work/country-index/
CLIMATE RISK COUNTRY PROFILE: TONGA 5The temperature in Tonga is generally tropical, with some limited seasonal and spatial variation.2 Mean annual
temperatures vary according to latitude from 27°C at Niuafo’ou and Keppel (in the north), to 24°C at Tongatapu
(in the south). Diurnal and seasonal variations can reach as high as 6°C throughout the island group, while seasonal
variation in temperature is more marked in the southern cooler islands. In general, across the island group, the
mean annual temperature ranges from 23°C–26°C, averaging 24.5°C over the period 1901–2019. During the wet
season, the average temperature ranges from 25°C–26°C, whereas during the dry season the average temperature
ranges from 21°C–24°C , for the latest climatology, 1991–2020 (Figure 2).
Annual Cycle
FIGURE 2. Average monthly temperature and rainfall in Tonga, 1991–20201
27.6 300
26.4 240
Temperature (°C)
Rainfall (mm)
25.2 180
24 120
22.8 60
21.6 0
Jan Feb Mar Apr May Jun Jul Aug Sep Oct Nov Dec
Rainfall Temperature
Key Trends
Temperature
Tonga’s 2020 Third National Communication to the UNFCCC offers evidence of general warming trends across
all of the five meteorological stations in Tonga.2 While mean annual temperatures vary according to latitude, and
are generally lower in the southern islands, climatologically, the largest average annual temperature change took
place on Tongatapu (in the south), where an increase of 1.8°C was reported using data from 1949–2007.2 This
estimate is unusually high, and is different from rise estimated by the Berkeley Earth Dataset, which puts the rise in
the region of 0.4°C–0.6°C over the same period.18 Annual and November–April mean temperatures have increased
at Nuku’alofa since 1949, with trends in Nuku’alofa annual maximum temperature and November–April maximum
and minimum temperature also positive — this is consistent with global warming.5 On average for the island groups,
mean temperatures have increased by 0.4°C–0.8°C since 1970, with warming most rapid in the warmest season
(November–April) and in the early 21st century.1 As well, the frequency of hot days and hot nights has increased
significantly across the Pacific.
18
Carbon Brief (2018). Mapped: How every part of the world has warmed – and could continue to warm. [26 September 2018].
URL: https://www.carbonbrief.org/mapped-how-every-part-of-the-world-has-warmed-and-could-continue-to-warm
[accessed 25/10/2019]
CLIMATE RISK COUNTRY PROFILE: TONGA 6Precipitation
Due to the spatial distribution of the islands of Tonga, there is a disparity in the nature of rainfall in the country.
Tonga’s Third National Communication to the UNFCCC reports the annual mean rainfall at the five meteorological
stations in Tonga between 1971–2007: Tongatapu reported an average of 1,721 mm, Vava’u an average of 2,150 mm,
Ha’apai an average of 1,619 mm, Niua Fo’ou an average of 2,453 mm and Niua Toputapu an average of 2,374 mm.2
All of the islands in the Tongan archipelago therefore receive very significant annual rainfall.
Tonga’s Third National Communication to the UNFCCC highlights that the Ha’apai island group receives the
lowest rainfall of all the island groups in Tonga and Niua Fo’ou the highest. Variation in annual rainfall averages
relate particularly to each island’s proximity to the South Pacific Convergence Zone (SPCZ) and the wet tropics.
The Third National Communication reports changes over time in the annual rainfall seen at a number of Tongan
islands, for example an increasing trend of 16 mm per year reported at Niuafo’ou and a decreasing trend of
6 mm per year at Ha’apai, but it is unclear the extent to which these trends represent a climate change influence
or natural variation. Notable interannual variability associated with the ENSO is evident in Tonga, influencing the
onset of drought conditions over the islands.2
Climate Future
Overview
The Representative Concentration Pathways (RCPs)
represent four plausible futures, based on the rate of A Precautionary Approach
emissions reduction achieved at the global level. Four
RCPs (i.e. RCP2.6, RCP4.5, RCP6.0, and RCP8.5) Studies published since the last iteration
were selected and defined by their total radiative forcing of the IPCC’s report (AR5), such as Gasser
(cumulative measure of GHG emissions from all sources) et al. (2018), have presented evidence which
pathway and level by 2100. In this analysis, RCP2.6 suggests a greater probability that earth will
and RCP8.5, the extremes of low and high emissions experience medium and high-end warming
pathways, are the primary focus; RCP2.6 represents a scenarios than previously estimated.19 Climate
very strong mitigation scenario, whereas RCP8.5 assumes change projections associated with the highest
business-as-usual scenario. For reference, Table 2 emissions pathway (RCP8.5) are presented
provides information on all four RCPs over two-time here to facilitate decision making which is
horizons. In subsequent analysis RCPs 2.6 and 8.5, robust to these risks.
the extremes of low and high emissions pathways, are
19
Gasser, T., Kechiar, M., Ciais, P., Burke, E. J., Kleinen, T., Zhu, D., . . . Obersteiner, M. (2018). Path-dependent reductions in CO2
emission budgets caused by permafrost carbon release. Nature Geoscience, 11, 830–835. URL: https://www.nature.com/articles/
s41561-018-0227-0?WT.feed_name=subjects_climate-sciences
CLIMATE RISK COUNTRY PROFILE: TONGA 7the primary focus. RCP2.6 would require rapid and systemic global action, achieving emissions reduction throughout
the 21st century enough to reach net zero global emissions by around 2080. RCP8.5 assumes annual global
emissions will continue to increase throughout the 21st century. Climate changes under each emissions pathway
are presented against a reference period of 1986–2005 for all indicators. For more information, please refer to the
RCP Database.
TABLE 2. An overview of temperature change projections (°C) in Tonga under four emissions
pathways. Projected changes over the 1986–2005 baseline are given for 20-year periods centred
on 2050 and 2090 with the 5th and 95th percentiles provided in brackets.5
Mean Surface Air Temp Max Temp Min Temp
(Annual) (1-in-20 Year Event) (1-in-20 Year Event)
Scenario 2050 2090 2050 2090 2050 2090
RCP2.6 0.6 (0.4, 1) 0.6 (0.2, 1.1) 0.7 (0.1, 1) 0.7 (−0.1, 1.1) 0.6 (0, 0.9) 0.6 (0.1, 0.9)
RCP4.5 0.9 (0.6, 1.4) 1.2 (0.8, 2.1) 0.9 (0.2, 1.2) 1.3 (0.6, 1.8) 0.9 (0.5, 1.3) 1.3 (0.7, 1.9)
RCP6.0 0.8 (0.6, 1.3) 1.6 (1.2, 2.4) NA NA NA NA
RCP8.5 1.2 (0.8, 2) 2.6 (1.8, 4.1) 1.4 (0.7, 2) 2.9 (1.7, 4.2) 1.3 (0.7, 1.9) 2.9 (2.1, 4.2)
Model Ensemble
Due to differences in the way global circulation models (GCMs) represent the key physical processes and
interactions within the climate system, projections of future climate conditions can vary widely between different
GCMs. This is particularly the case for rainfall related
variables and at sub-national scales. Exploring the
spread of climate model outputs can assist in FIGURE 3. ‘Projected average temperature
understanding uncertainties associated with climate change’ and ‘projected annual rainfall change’
models. The range of projections from 16 GCMs on in Tonga. Outputs of 16 models within the
the indicators of average temperature anomaly and ensemble simulating RCP8.5 over the period
annual precipitation anomaly for the Cook Islands 2080–2099. Models shown represent the
under RCP8.5 is shown in Figure 3. subset of models within the ensemble which
provide projections across all RCPs and
The majority of the models from which outputs are therefore are most robust for comparison.5
presented in this report are from the CMIP5 round of Three models are labelled.
standardization and quality assurance. Unfortunately, 5
Average temperature anomaly (°C)
4.5 ipsl_cm5a_mr
models of this generation operate at large spatial 4
scales and are not well equipped to simulate the future 3.5
3 miroc_esm_chem
climate of small islands. Typically, the changes projected 2.5
will relate more to the expected changes over nearby 2
1.5 giss_e2_h
ocean than the island itself. Caution should therefore
1 Median,
be applied in interpreting results. This highlights a major 0.5
10th and 90th
Percentiles
area for future development, a research opportunity, 0
–60% –40% –20% 0% 20% 40% 60% 80%
and an urgent need from the perspective of policy Average annual precipitation anomaly (%)
makers planning for climate change.
CLIMATE RISK COUNTRY PROFILE: TONGA 8Temperature
Projections of future temperature change are
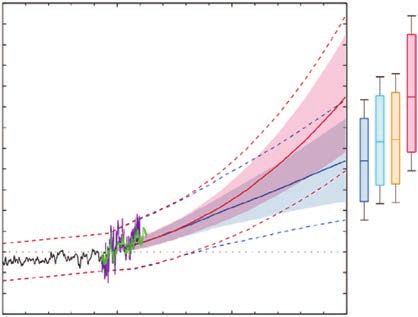
presented in three primary formats. Shown in FIGURE 4. Historical and simulated surface
Table 2 are the changes (anomalies) in maximum air temperature time series for the region
and minimum temperatures over the given time period, surrounding Tonga. The graph shows the
as well as changes in the average temperature. anomaly (from the base period 1986–2005)
Figures 3 and 4 display only the average temperature in surface air temperature from observations
projections. While similar, these three indicators can (the GISS dataset, in purple), and for the CMIP5
provide slightly different information. Monthly and models under the very high (RCP8.5, in red) and
annual average temperatures are most commonly very low (RCP2.6, in blue) emissions scenarios.
used for general estimation of climate change, but the
The solid red and blue lines show the smoothed
daily maximum and minimum can explain more about
(20-year running average) multi-model mean
anomaly in surface air temperature, while
how daily life might change in a region, affecting key
shading represents the spread of model values
variables such as the viability of ecosystems, health
(5–95th percentile). The dashed lines show the
impacts, productivity of labour, and the yield of crops,
5–95th percentile of the observed interannual
which are often disproportionately influenced by
variability for the observed period (in black)
temperature extremes.
and added to the projections as a visual guide
(in red and blue). This indicates that future
Across the Pacific, temperatures are projected to
surface air temperature could be above or
increase between 1.4°C and 3.1°C.1 As shown in
below the projected long-term averages
Figure 4, localised temperature increases are
due to interannual variability. The ranges of
expected across Tonga, with warming differences
projections for a 20-year period centred on
varying widely across RCPs, especially after 2030.
2090 are shown by the bars on the right for
For instance, as indicated in Table 2, relative to the
RCP8.5, 6.0, 4.5 and 2.6.5
1986–2005 baseline, a warming of 0.2°C–1.1°C for
RCP2.6, and 1.8°C–4.1°C for RCP8.5 is projected 5
by the 2090s. While there is very high confidence 4
Temperature anomaly relative to
that temperatures in the Tonga will rise, based on
1986–2005 (Celsius)
3
theory and observational evidence, there is medium
2
confidence in the model average temperature
changes.5 As explained in Australian BOM & CSIRO 1
(2014), this is possibly since models offer generally 0
good simulations of past temperature changes.5 It is –1
also noted that because of natural climate variability
1960 1980 2000 2020 2040 2060 2080
there will still be relatively warm and cool years
Year
and decades, although likely projections indicate a smoothed GISS RCP8.5 RCP4.5
GISS
warmer climate to influence more warm years and RCP6.0 RCP2.6
decades on average.5
Future temperature rises in Tonga may likely be below the global average – the mean annual surface air
temperature under the highest emissions pathway is projected to reach around 2.6°C by the 2090s, compared
to around 3.7°C globally. This difference may reflect the moderating effect of large amounts of nearby ocean
CLIMATE RISK COUNTRY PROFILE: TONGA 9cover, but considering that ocean cover can also distort model simulations, and the current iteration of global
models does not have the spatial accuracy to reliably capture climate processes over small island states, these
projections should be approached with caution.
In addition, it is projected that the temperature on extremely hot days is likely to increase in tandem with
average temperature increases – projected temperature increase of the 1-in-20-year hot day by the 2090s
is 0.7°C for RCP2.6 and 3°C for RCP8.5.
It is also expected that there will be an increase in
FIGURE 5. Historical and simulated annual
the frequency and intensity of extremely hot days
average rainfall time series for the region
and a decrease in the frequency and intensity of
surrounding Tonga. The graph shows the
cool days in Tonga, although the magnitude of the
anomaly (from the base period 1986–2005)
projected changes is less certain.5
in rainfall from observations (the GPCP
dataset, in purple), and for the CMIP5 models
Precipitation
under the very high (RCP8.5, in red) and very
As shown in Figure 5, while Tonga experienced an
low (RCP2.6, in blue) emissions scenarios.
increase in mean precipitation over the 1979–2006
The solid red and blue lines show the smoothed
period, rainfall projection estimates vary from an
(20-year running average) multi-model mean
increase to a decrease, with a slight increase
anomaly in rainfall, while shading represents
expected on average. It is possible, then, that the
the spread of model values (5–95th percentile).
historical increase could be due in part to natural
The dashed lines show the 5–95th percentile
variability, rather than purely driven by global
of the observed interannual variability for
warming.5 Further, the range of the future projections
the observed period (in black) and added to
vary by scenario, and the estimates under RCP8.5
the projections as a visual guide (in red and
show the largest range of uncertainty. Since there is blue). This indicates that future rainfall could
no strong agreement as to the direction of change be above or below the projected long-term
in the models, and it is uncertain how SPCZ will affect averages due to interannual variability. The
rainfall over Tonga, this lowers the confidence of the ranges of projections for a 20-year period
projected changes, and makes the likely direction centred on 2090 are shown by the bars on
of change difficult to determine. Confidence in the the right for RCP8.5, 6.0, 4.5 and 2.6.5
model average rainfall change is also challenged by
the usual complexity of simulating precipitation as 60
well as understanding the influence of the SPCZ
Precipitation anomaly relative to
40
and ENSO.5
1986–2005 (%)
20
In terms of extreme rainfall events, a warmer
0
atmosphere is likely to lead to an increase in their
frequency and intensity. However, the magnitude of –20
such changes in extreme rainfall is not as certain
–40
due to possible underestimation and difficulty to
1980 2000 2020 2040 2060 2080
capture certain process related to extreme rainfall
Year
events, the influence of the SPCZ over the islands,
smoothed GPCP RCP8.5 RCP4.5
as well as the general coarse spatial resolution of GPCP RCP6.0 RCP2.6
GCMs.5
CLIMATE RISK COUNTRY PROFILE: TONGA 10CLIMATE RELATED NATURAL HAZARDS
Heatwaves
Heatwaves are defined as a period of 3 or more days
when the daily temperature remains above the 95th FIGURE 6. Projected Change in probability
percentile. Figure 6 shows the projected change in of heat waves in Tonga under RCP8.5
heat wave probability under RCP8.5 (compared to (compared to 1986–2005)1
1986–2005), highlighting the daily probability of a 0.6
sudden heat wave in subsequent time periods. For
Tonga, this probability steadily increases in the long 0.4
Probability
term. This is held within the global context in which
the probability is expected to increase. It is noted that 0.2
the tropics are particularly where systematic warming
might lead to the largest increases in heat wave 0
2020–2039 2040–2059 2060–2079 2080–2099
probability, simply because the historic (baseline) Period
day-to-day and month-to-month variability is small. Ensemble median and range
Generally, Tonga regularly experiences high
temperatures, with a mean annual temperature
of around 24.5°C and highest temperatures in FIGURE 7. Projected change in the count of
January to March with a seasonal average of days in which Heat Index exceeds 35°C
26.38°C (see Figure 2). Ensemble-based mean (under RCP8.5)1
annual temperatures anomalies in Tonga are 200
projected to reach up to 2.6°C by 2100 (Table 2), 150
with a projected ensemble mean change in the
100
maxima of daily maximum temperature of 2.9°C,
Days
50
compared to the historical mean. When this rise
is considered in combination with local humidity, as 0
captured in the Heat Index measure, this highlights –50
2020–2039 2040–2059 2060–2079 2080–2099
a significant increase in the number of days in which Period
uncomfortable temperature conditions are reached. Ensemble median and range
From a baseline situation in which the key threshold of
Heat Index 35°C is rarely breached, Tonga can expect
multiple breaches per year under all climate change scenarios (Figure 7 shows RCP8.5). This signals the potential
for conditions which are dangerous for human health, particularly in vulnerable populations. However, it is noted that
further research is required to better understand the implications of climate change, and its interaction with the ENSO
phenomenon, for Tonga’s future regime and potential heatwaves.
An additional factor for consideration is the potential for marine heatwaves. Research has shown that “from 1925
to 2016, global average marine heatwave frequency and duration increased by 34% and 17%, respectively,
resulting in a 54% increase in annual marine heatwave days globally”. 20 While such research has not specifically
20
Oliver, E. C., Donat, M. G., Burrows, M. T., Moore, P. J., Smale, D. A., Alexander, L. V., . . . & Holbrook, N. J. (2018). Longer and more frequent marine
heatwaves over the past century. Nature communications, 9(1), 1324. URL: https://www.ncbi.nlm.nih.gov/pmc/articles/PMC5893591/
CLIMATE RISK COUNTRY PROFILE: TONGA 11identified Tonga under threat, the consequences of these trend may be serious for marine ecosystems in
the region, which are adapted to survive under very stable temperature regimes, as well as the livelihoods
dependent on them.
Drought
Drought can be expressed in many ways, from looking at simple precipitation deficits to complex estimates of
remaining soil moisture. Research done for the report on “Climate Variability, Extremes and Change in the Western
Tropical Pacific 2014”, defines projected changes in the frequency and duration of mild, moderate, severe and
extreme meteorological droughts using the Standardised Precipitation Index (SPI).5 This index is based solely
on rainfall (i.e. periods of low rainfall are classified as drought), and does not take into account factors such as
evapotranspiration or soil moisture content. (It is noted that the SPI is commonly used in many regions including the
Pacific due to the relative simplicity with which it is calculated, as well as its relevance across temporal and spatial
scales.)5 For Tonga, it is likely that the percent of time spent in drought may decrease, and this is generally shown
across emissions scenarios.5 However, it should be noted that complex processes relating to rainfall projections,
including the limited consensus of future ENSO influence for the region, hinder the confidence of these projections
of drought frequency and duration, as well as magnitude of change.5
Another lens through which to view drought risk is the standardised precipitation evapo-transpiration index
(SPEI), which is computed over 12-month periods and captures the cumulative balance between gain and loss
of water across the interannual time scale by incorporating both precipitation input variations as well as changes
in the loss of water through evapotranspiration. It is
widely used today as a global measure for drought
FIGURE 8. Projected change in Annual Mean
monitoring over various cumulative time intervals.
Drought Index for Tonga under RCP8.51
2
Figure 8 looks the projected changes in the annual
mean drought index for Tonga in subsequent time 1
periods, under RCP 8.5, compared to 1986–2005.
SPEI
0
Since positive values indicate positive water balance
(or wet) conditions and negative values indicate –1
negative water balance (or dry) conditions, this signals
that SPEI trends to 2100 in Tonga may vary widely. –2
2020–2039 2040–2059 2060–2079 2080–2099
Overall confidence is very low and as such further Period
Ensemble median and range
research is required.
Flood, Cyclones, and Storm Surge
Analysis from the World Bank’s Climate Change Knowledge Portal highlights that the most extreme rainfall episodes
generally have the danger of leading to significant floods.1 Individual daily rainfall is often linked to flash-floods
of limited spatial extent, but multi-day rainfall generally has a broader spatial footprint and thus more extensive
flooding can be explained. Rare precipitation events are often referred to as events of a certain return level, and
the 5-day cumulative rainfall indicator focuses on the maximum rainfall amount over any 5-day period that can be
expected once in an average 25-year period. Changes in this indicator may have potentially significant impacts on
CLIMATE RISK COUNTRY PROFILE: TONGA 12infrastructure and endanger life and property through
direct physical effects and perhaps through water FIGURE 9. 5-day precipitation – historical
quality issues. As such, any significant changes in and projected scenarios of 25-year return
their magnitudes would need to be understood. level in Tonga for period 2040–20591
900
The boxplot in Figure 9 shows recorded 5-Day 800
700
Cumulative Rainfall for 1986–2005 and projected
Precipitation (mm)
600
5-Day Cumulative Rainfall 25-year Return Level by
500
2050 under all RCPs of CIMP5 ensemble modelling 400
for Tonga. From this, it is noted that compared to the 300
historical value, median ensemble projections seem 200
100
to vary, and there is some difference in the range Historical RCP 2.6 RCP 4.5 RCP 6.0 RCP 8.5
of change under the different scenarios. Looking at
further future projections, Figure 10 highlights the
projected change in annual maximum 5-day rainfall
of a 25-year return level (under RCP8.5), projected FIGURE 10. Projected change in annual
ensemble median changes seem to be close to 0 maximum 5-day rainfall (25-year return level)
initially then increase closer to 2100, but the range under RCP8.5 for Tonga1
of values is quite broad and needs to be further
300
contextualised and understood.
200
Rainfall (mm)
100
Tropical cyclones have historically affected Tonga,
mainly between November and April. Historical data 0
indicates that there have been at least 85 tropical –100
cyclones developing within or crossing the Tonga EEZ –200
2020–2039 2040–2059 2060–2079 2080–2099
between the 1969/70 and 2010/11 seasons, for an Period
average of 20 cyclones per decade (albeit with high Ensemble median and range
interannual variability).5 Over the past 4 decades since
1981, there have been 55 tropical cyclones, of which
19 were considered severe events (i.e. Category 3 or higher). In Tonga, the projection is for a decrease in cyclone
genesis (formation) frequency for the south-east basin, with high confidence, consistent with a general global
projection for decreased cyclone frequency by 2100.5 However, this should be understood in the context of
ENSO, as there has been an increase in cyclone incidence during El Niño years,2 but the certainty of future
ENSO influence for the country is not well understood.
Nevertheless, according to available information compiled by the Global Facility for Disaster Reduction and
Recovery (GFDRR) ThinkHazard! web-based tool, the risk of cyclone (hurricane/typhoon) hazard is classified as
high in Tonga.21 This means that there is more than a 20% chance of potentially-damaging wind speeds for the
country in the next 10 years. While climate change is expected to interact with cyclone hazard in complex ways
which are currently poorly understood, known risks include the action of sea-level rise to enhance the damage
21
GFDRR (2016). ThinkHazard! Profile for Tonga. URL: http://thinkhazard.org/ [accessed 15/07/2019]
CLIMATE RISK COUNTRY PROFILE: TONGA 13caused by cyclone-induced storm surges, and the possibility of increased wind speed and precipitation intensity.
Modelling of climate change impacts on cyclone intensity and frequency conducted across the globe points to a
general trend of reduced cyclone frequency but increased intensity and frequency of the most extreme events.22
Further research is required to better understand potential changes in cyclone seasonality and routes, and the
potential for cyclone hazards to be experienced in unprecedented locations.
As well, such risk potential is important to consider in the historical context of cyclone impacts for the country. The
EM-DAT database highlights that there have been at least 16 tropical cyclones which have led to disasters within
the Tongan island group since 1900. Tropical storms top the list of costly disaster events in Tonga, with events
in 2001 and 2014 having an estimated economic damage tallies of US$51.3 and US$31 million respectively.23
In addition, Tongans may perceive a high threat and impact of cyclones based on past events, offering an indication
of vulnerability considerations and potential adaptation needs.24
CLIMATE CHANGE IMPACTS
Natural Resources
Water
Water resources in Tonga are mostly based on rainfall collection, and a few underground aquifers.2 Surface water
resources are not commonly present in Tonga, with the exception of the coral island of Eua and a number of
volcanic islands including Niuafo’ou and Tofua (Ha’apai Island), and a large number of small islands in Ha’apai
and Vava’u that rely entirely on rainwater tanks for their water.1 As with most other Pacific island countries
(PICs), Tonga’s dependency on rainfall increases its vulnerability to future changes and distribution of rainfall.
Low rainfall can lead to a reduction in the amount of water that can be physically harvested and a slower rate of
recharge of the freshwater lens, which can result in prolonged droughts. Since most of the islands are dependent
on surface water catchments for their water supply, it is likely that demand cannot be met during periods of low
rainfall. This is particularly of concern given the uncertainty in rainfall projections for the country, and the slight
tendency for possible precipitation declines. As well, the likelihood of increases in temperature and evaporation
adds further concern.
22
Walsh, K., McBride, J., Klotzbach, P., Balachandran, S., Camargo, S., Holland, G., Knutson, T., Kossin, J., Lee, T., Sobel, A., Sugi, M. (2015).
Tropical cyclones and climate change. WIREs Climate Change: 7: 65–89. URL: https://onlinelibrary.wiley.com/doi/abs/10.1002/wcc.371
23
EM-DAT (2019). Emergency Events Database. URL: https://www.emdat.be/ [accessed 22/08/2019]
24
Beyerl, K., Mieg, H. A., & Weber, E. (2018). Comparing perceived effects of climate-related environmental change and adaptation
strategies for the Pacific small island states of Tuvalu, Samoa, and Tonga. Island Studies Journal, 13(1). URL: https://islandstudies.ca/
sites/default/files/ISJBeyerletalEffectsClimateTongSamoaTuvalu.pdf
CLIMATE RISK COUNTRY PROFILE: TONGA 14The wet and dry cycles associated with El Nino Southern Oscillation episodes can also deliver serious impacts on
water supply in Tonga as well as the other PICs, highlighting the vulnerability of water supplies to changes in the
climate.1 For instance, the strong El Niño of 1998–2000 was responsible for acute water shortages in many islands
in the Pacific Ocean. Further vulnerabilities arise under future climate-induced droughts, as there is no centralized
reticulated sewerage system in Tonga and poorly constructed or inappropriate sanitation systems are common,
resulting in the potential for pathogens and nutrients being introduced into the surrounding environment, including
ingress to groundwater.1
As for other small island states, rising sea levels are also a threat to water resources. Tonga’s small size, minimal
amount of storage, and limited fresh water render it highly susceptible to threats to fresh water availability and
groundwater supplies are threatened by salt-water intrusion as a result of increasing sea levels.1 Associated damage
to water supplies, water treatment and hydrological research infrastructure may also prove to be significant and costly.
The Coastal Zone
Sea-level rise threatens significant physical changes to coastal zones around the world. Global mean sea-level rise
was estimated in the range of 0.44 meters (m)–0.74m by the end of the 21st century by the IPCC’s Fifth Assessment
Report,25 but some studies published more recently have highlighted the potential for greater rises (Table 3).
TABLE 3. Estimates of global mean sea-level rise by rate and total rise compared to 1986–2005
including likely range shown in brackets, data from Chapter 13 of the IPCC’s Fifth Assessment
Report with upper-end estimates based on higher levels of Antarctic ice-sheet loss from Le Bars
et al. (2017).26
Rate of Global Mean Sea-Level Global Mean Sea-Level Rise in
Scenario Rise in 2100 2100 Compared to 1986–2005
RCP2.6 4.4 mm/yr (2.0–6.8) 0.44 m (0.28–0.61)
RCP4.5 6.1 mm/yr (3.5–8.8) 0.53 m (0.36–0.71)
RCP6.0 7.4 mm/yr (4.7–10.3) 0.55 m (0.38–0.73)
RCP8.5 11.2 mm/yr (7.5–15.7) 0.74 m (0.52–0.98)
Estimate inclusive of high-end Antarctic ice-sheet loss 1.84 m (0.98–2.47)
According to its Third National Communication to the UNFCCC, Tonga already has witnessed general sea level
rise of 6.4 mm per annum, using historical records from 1993–2007.2 It is very likely that these increasing trends
may increase through 2100, with estimations of 7 centimetres (cm)–17 cm by 2030 across various RCPs (see
Figure 11).5 By the 2090s, sea level rise is estimated at around 59.5 cm increase using historical records only,2
or within the range of 40 cm–87 cm under RCP8.5.5 Uncertainty in the projections of changes in the Antarctic ice
sheet limit the certainty of knowledge of the range of this mean sea level change.
25
Church, J. a., Clark, P. U., Cazenave, A., Gregory, J. M., Jevrejeva, S., Levermann, A., . . . Unnikrishnan, A. S. (2013). Sea level change.
In Climate Change 2013: The Physical Science Basis. Contribution of Working Group I to the Fifth Assessment Report of the
Intergovernmental Panel on Climate Change (pp. 1137–1216). Cambridge, United Kingdom and New York, NY, USA: Cambridge
University Press. URL: https://www.ipcc.ch/site/assets/uploads/2018/02/WG1AR5_Chapter13_FINAL.pdf
26
Le Bars, D., Drijhout, S., de Vries, H. (2017). A high-end sea level rise probabilistic projection including rapid Antarctic ice sheet mass
loss. Environmental Research Letters: 12:4. URL: https://iopscience.iop.org/article/10.1088/1748-9326/aa6512
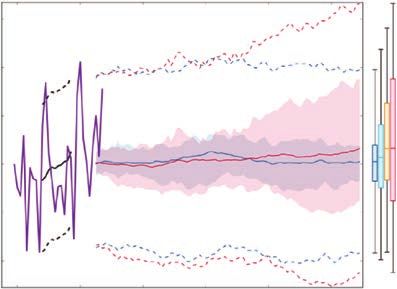
CLIMATE RISK COUNTRY PROFILE: TONGA 15FIGURE 11. (a) The observed tide-gauge records of relative sea-level (since the late 1970s) are
indicated in purple, and the satellite record (since 1993) in green. The gridded (reconstructed) sea
level data at Tonga (since 1950) is shown in black. Multi-model mean projections from 1995–2100
are given for the RCP8.5 (red solid line) and RCP2.6 emissions scenarios (blue solid line), with the
5–95% uncertainty range shown by the red and blue shaded regions. The ranges of projections
for four emission scenarios (RCPs 2.6, 4.5, 6.0, 8.5) by 2100 are also shown by the bars on the
right. The dashed lines are an estimate of interannual variability in sea level (5–95% uncertainty
range about the projections) and indicate that individual monthly averages of sea level can be
above or below longer-term averages. (b) The regional distribution of projected sea level rise under
the RCP4.5 emissions scenario for 2081–2100 relative to 1986–2005. Mean projected changes
are indicated by the shading, and the estimated uncertainty in the projections is indicated by the
contours (in cm).5
(a) (b) RCP4.5: 2090
120
110 Tonga
100 10ºN
Reconstruction
Sea level relative to 1986–2005 (cm)
90 Satellite altimeter
Tide gauges (3)
80 0º
70 Projections
60 RCP8.5
10º
50 RCP6.0
40 RCP4.5
30 RCP2.6 20ºS
20
10 130°E 140° 150° 160° 170° 180° 170° 160° 150°W
0
–10
41 42 43 44 45 46 47 48 49 50 51
–20
cm
–30
1950 2000 2050 2100
Year
The Tongan Third National Communication highlights the potential threat of sea level rise to the Tongan land and
people. Noting that the land is particularly low near the capital, at Nuku’alofa, sea level rise increases of 0.3 m
and 1 m could cause potential land losses of 3.1 km and 10.3 km, respectively, or 1.1% and 3.9% of the total
area of Tongatapu Island.2 Such land losses has the potential to affect some 2700 and 9000 people, under each
scenario, or the equivalent of 4.3% and 14.2% of the total population of Tongatapu.2 However, the scientific field
lacks consensus on the gravity of the land loss threat on raised atoll islands such as Tonga. Some studies have
shown that atoll islands have potential to sustain and even grow despite sea-level rise thanks to geomorphological
processes which build land.27 The future picture is likely one of a dynamic ecosystem which will demand adaptive
lifestyles and livelihoods from inhabitants.
27
Kench, P. S., Ford, M. R., & Owen, S. D. (2018). Patterns of island change and persistence offer alternate adaptation pathways for
atoll nations. Nature Communications, 9(1), 605. URL: https://www.nature.com/articles/s41467-018-02954-1
CLIMATE RISK COUNTRY PROFILE: TONGA 16You can also read