D3.3 Report A toolkit for holist/multiple risk and impact/damage assessment at strategic and operational level
←
→
Page content transcription
If your browser does not render page correctly, please read the page content below
D3.3 Report
A toolkit for holist/multiple risk and impact/damage
assessment at strategic and operational level

© 2017 PEARL

This project has received funding from the European Union´s Seventh Framework Programme for Research, Technological Development
and Demonstration under Grant Agreement No 603663 for the research project PEARL (Preparing for Extreme And Rare events in coastal
regions). All rights reserved. No part of this book may be reproduced, stored in a database or retrieval system, or published, in any form
or in any way, electronically, mechanically, by print, photoprint, microfilm or any other means without prior written permission from the
2

Authors:   IHE, TUD, EXETER, CetAQUA, NTUA

Document Information
Project Number                603663                      Acronym                     PEARL
Full Title                    Preparing for Extreme and Rare events in coastaL regions
Project URL                   http://www.pearl-fp7.eu/
Document URL
EU Project Officer            Denis Peter

                                                                  A toolkit for holist/multiple risk and
Deliverable                   Number         D 3.3       Title    impact/damage assessment at strategic and
                                                                  operational level

Work Package                  Number         WP3         Title    Holistic and multiple risk assessment

Date of Delivery              Contractual     12.31.2017               Actual                30.04.2018
Status                        version 1                                final X
Nature                        report X
Dissemination level           public X

Abstract               (for   This report describes the toolkit and its models developed in PEARL project to
dissemination,         100    support the holistic risk assessment framework which is described in detail
words)                        Deliverable 3.1. The application of some of the tools in the study areas was
                              presented in Deliverable 3.4. The following tools are described: 1. Long term /
                              Strategic Coupled ABM-flood modelling tool; 2. Operational / evacuation ABM
                              modelling tool; 3. Flood-traffic integration tool; 4. Direct damage assessment
                              tool; 5. Indirect damage assessment tool; and 6. ABM SAS: PEARL institutional
                              ABM modelling tool that supports policy evaluation and selection of resilience
                              strategies.
                              All of the above tools are described in terms of their methodology, code
                              implementation/development details and application instructions of how to use
                              it with a short tutorial.
Keywords                      Toolkit, risk assessment, ABM, flood impact assessment

Version Log
Issue Date         Rev. No.    Author                    Change                        Approved by
05/12/2017                     CetAqua                   Chapter 6
11/12/2017                     NTUA                      Chapter 7
17/01/2018                     IHE                       Chapter 3
17/01/2018                     EXETER                    Chapter 4 and 5
06/03/2018                     IHE                       Chapter 2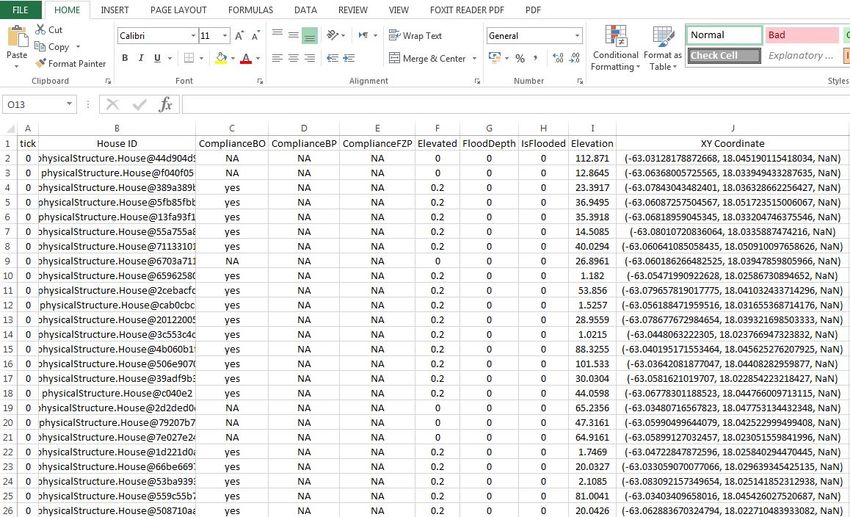
30/04/2018                 IHE                  Final editing               ZOV, ASA

Disclaimer
The research leading to these results has received funding from the European Union Seventh
Framework Programme (FP7/2007-2013) under Grant agreement n° 603663 for the research
project PEARL (Preparing for Extreme And Rare events in coastaL regions).

The deliverable 3.3 reflects only the authors' views and the European Union is not liable for any
use that may be made of the information contained herein.
Summary
This report describes the toolkit and models developed in PEARL project to support the holistic risk
assessment framework which is described in detail in Deliverable 3.1. The application of some of
the tools in the study areas was presented in Deliverable 3.4. The following tools are described in
this report:
   1. Long term / Strategic Coupled ABM-flood modelling tool
   2. Operational / evacuation ABM modelling tool
   3. Flood-traffic integration tool
   4. Direct damage assessment tool
   5. Indirect damage assessment tool
   6. ABM SAS: PEARL institutional ABM modelling tool that supports policy evaluation and
      selection of resilience strategies
Every tool is described in a chapter that includes its methodological framework, details of the code
implementation/development, application of the tool with a short tutorial. What follows is a brief
description of each tool.

   1. Long term / Strategic Coupled ABM-flood modelling tool
The aim of “long term / Strategic Coupled ABM-flood modelling tool” is to help in gaining
understanding of how vulnerabilities and exposure to flood can be created and propagated in
response to different policies, regulations and practices. The drivers include different policy and
planning alternatives that aim to reduce flood risk, their implementation and community response.
This tool is here referred to as a Coupled fLood-Agent-Institutions Modelling (CLAIM) modelling tool.
CLAIM includes five components: agents, institutions, urban environment, physical processes and
external factors. The actual analysis or model implementation is done by coupling agent-based
models (ABM) with physically-based flood models. The ABM is used to model the social system (i.e.,
agents and institutions); whereas, the flood model is used to model the physical system (i.e.,
flooding). The Coupled ABM-Flood Model is described in detail in Chapter 2.

   2. Operational / evacuation ABM modelling tool

The aim of operational / evacuation ABM modelling tool is to support evaluation of large scale
evacuation strategies and planning tool for flood disaster risk prevention or mitigation. It is focus on
disaster risk reduction to people by minimizing exposure to the hazards itself. Therefore, the tool is
focus in modelling the human behaviour before and during a major flood event. The tool can be
used to test different scenarios of flooding. After each simulation the overall performance of the
evacuation is measured by the number of people that reach safe area/shelter and the number of
people that can get in contact with flood waters. The tool can be used by city planners and/or
emergency agencies for the development of evacuation plans.

   3. Integration of an ABM Traffic-Flood model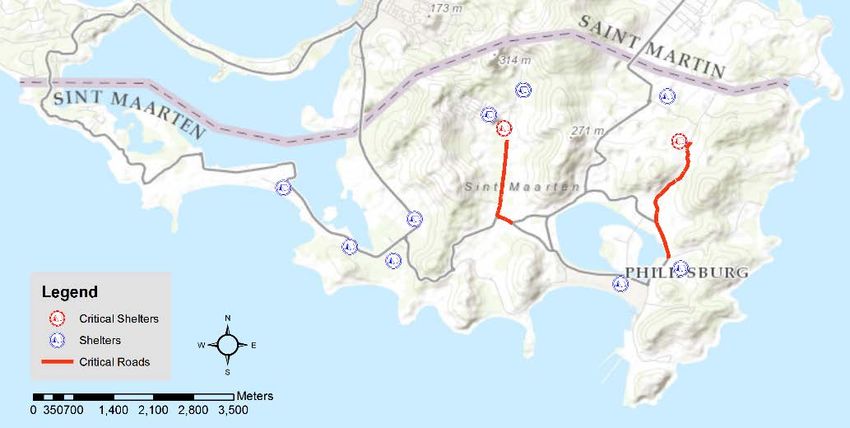
PEARL flood-traffic integration tool aims to support assessment of flood impacts on road
transportation. This tool is the first of its kind that translates flood maps into a specific input for the
traffic model SUMO. The tool integrates flood and road transportation models in Python and ArcGIS
environments. The preliminary results are promising and there is a need to advance the present tool
by integrating the two models in a dynamic way.

   4. Direct damage calculation tool
Direct damage calculation tool aims to support estimation of direct damages at different scales and
data formats and to enable linking hydraulic modelling results, assets and vulnerability information
for risk analysis. In PEARL, the previous version of this tool developed for ArcMAp during the CORFU
project, was reprogrammed to incorporate with QGIS and enhanced with more flexible functionalities.
This advancement allows stakeholders to adopt the tools in Open GIS environment that will
strengthen the research impact.
    5. Indirect damage calculation tool
The toolbox is based on a new methodology that comprises two consecutive steps; a matrix for
transforming land uses in business activities, and an econometric regression for quantifying indirect
damages. The methodology has been translated into a toolbox useful for quantifying the indirect
damages of several business activities affected by a flood event.

    6. Other Tools – ABM SAS
PEARL ABM SAS is a new Agent Based Model developed under the PEARL project. The PEARL
ABM SAS simulates how authorities prepare against flood risk and aims to support exploration of
intervention options under different socio-economic conditions and different flood event scenarios.
The developed PEARL ABM SAS has been applied to the case study of Rethymno, Crete. The LAA
of Rethymno was involved in the development of the tool and was also able to use it during training
session in October 2017. The tool is linked to an online user interface available from the PEARL
toolbox and it is integrated into the PEARL Web Learning and Planning platform. The tool is also
linked with the PEARL Knowledge Base. This tool was developed by NTUA in WP5: Task 5.4 and it
is documented in detail in Deliverable 5.4 “A toolbox of methods and tools supporting selection of
resilience strategies”.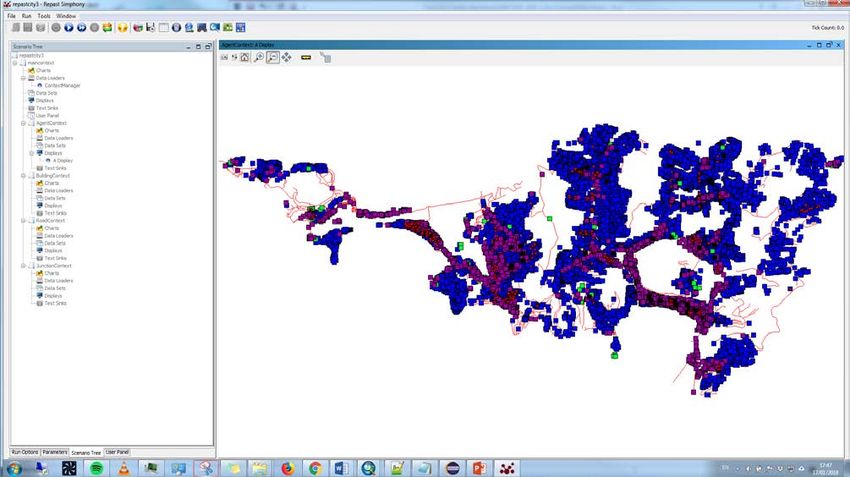
Contents

1       INTRODUCTION                                                                 11
2       LONG TERM / STRATEGIC COUPLED ABM-FLOOD MODEL TOOL
        12
    2.1 A brief description of the tool                                              12
    2.2 Introduction to the tool                                                     12
        2.2.1   Description of the components developed                              12

    2.3 Methodology                                                                  15
        2.3.1   Description of the flowchart with all the steps                      15
        2.3.2   Description of the code, repository, how to install, settings etc.   17

    2.4 Using the tool                                                               17
        2.4.1   Description of the interface steps and menus                         17
        2.4.2   Input data set                                                       22
        2.4.3   Outputs                                                              23

    2.5 Tutorial / Cases                                                             25
        2.5.1   Description of the application of the tool in a case study           25
        2.5.2   Outputs from the case study                                          25

    2.6 Concluding remarks                                                           26
    2.7 References                                                                   27
3       OPERATIONAL / EVACUATION ABM TOOL                                            28
    3.1 A brief description of the tool                                              28
    3.2 Introduction to the tool                                                     28
        3.2.1   Description of the components developed                              28

    3.3 Methodology                                                                  33
        3.3.1   Description of the flowchart with all the steps                      33
        3.3.2   Description of the code, repository, how to install, settings etc.   35

    3.4 Using the tool                                                               41
        3.4.1   Description of the interface steps and menus                         41
        3.4.2   Input data set                                                       43
        3.4.3   Outputs                                                              50

    3.5 Tutorial / Cases                                                             51
        3.5.1   Description of the application of the tool in a case study           51
        3.5.2   Outputs from the case study                                          52

    3.6 Concluding remarks                                                           53
    3.7 References                                                                   54
4       PEARL FLOOD-TRAFFIC INTEGRATION TOOL                                         55
    4.1 A brief description of the tool                                              55
    4.2 Introduction to the tool                                                     55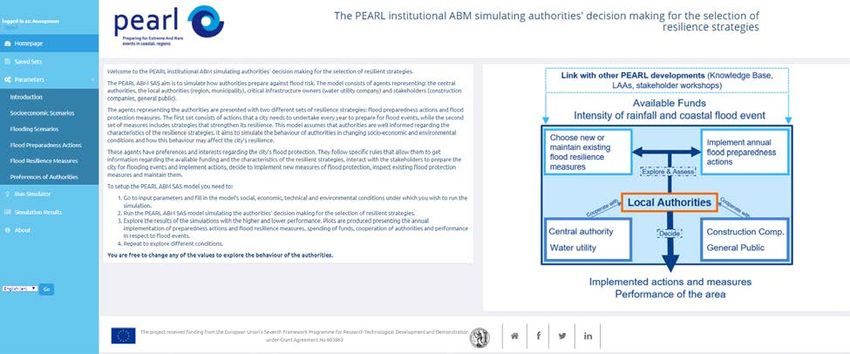
4.2.1   Description of the components developed                              55

    4.3 Methodology                                                                  56
        4.3.1   Description of the flowchart with all the steps                      56
        4.3.2   Description of the code, repository, how to install, settings etc.   59

    4.4 Using the tool                                                               59
        4.4.1   Description of the interface steps and menus                         59
        4.4.2   Input data set                                                       62
        4.4.3   Outputs                                                              62

    4.5 Tutorial / Cases                                                             62
        4.5.1   Description of the application of the tool in a case study           63
        4.5.2   Outputs from the case study                                          64

    4.6 Concluding remarks                                                           67
    4.7 References                                                                   67
5       DIRECT DAMAGE ASSESSMENT TOOL                                                68
    5.1 Brief description of the tool                                                68
    5.2 Introduction to the tool                                                     68
    5.3 Methodology                                                                  68
        5.3.1   Description of the flowchart with all the steps                      68
        5.3.2   Description of the code, repository, how to install, settings etc.   70

    5.4 Using the tool                                                               70
        5.4.1   Description of the interface steps and menus                         70
        5.4.2   Input parameters for raster version                                  71
        5.4.3   Input parameters for vector version                                  74
        5.4.4   Outputs                                                              75

    5.5 Tutorial / Cases                                                             75
    5.6 Concluding remarks                                                           76
    5.7 References                                                                   76
6       INDIRECT DAMAGE ASSESSMENT TOOL                                              77
    6.1 A brief description of the tool                                              77
    6.2 Introduction to the tool                                                     77
        6.2.1   Description of the components developed                              77

    6.3 Methodology                                                                  77
        6.3.1   Description of the flowchart with all the steps                      77
        6.3.2   Description of the code, repository, how to install, settings etc.   79

    6.4 Using the tool                                                               79
        6.4.1   Description of the interface steps and menus                         79
        6.4.2   Input data set                                                       79
        6.4.3   Outputs                                                              80

    6.5 Tutorial / Cases                                                             81
        6.5.1   Description of the application of the tool in a case study           81
        6.5.2   Outputs from the case study                                          81

    6.6 Concluding remarks                                                           82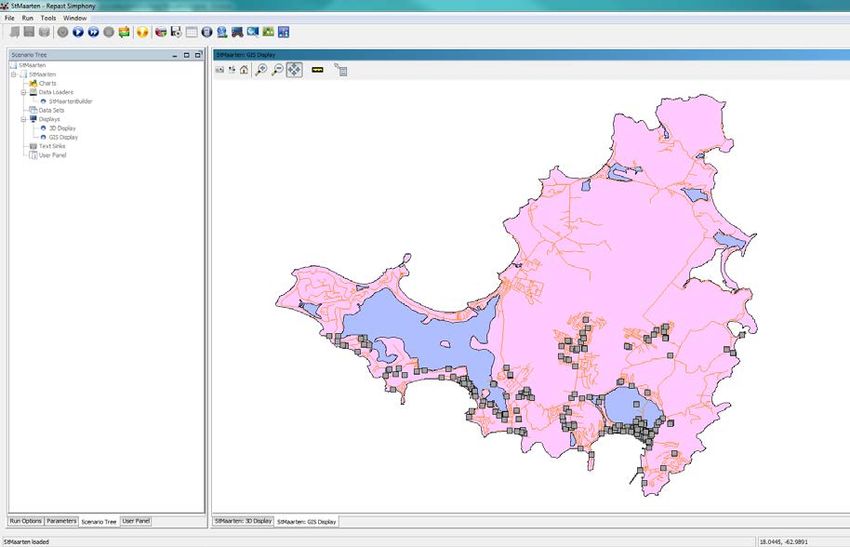
6.7 References                                                   83
7       OTHER TOOLS ()                                               84
    7.1 PEARL ABM SAS: The PEARL institutional ABM simulating authorities'
    decision making for the selection of resilience strategies      84
        7.1.1   A brief description of the tool                       84
        7.1.2   Introduction to the tool                              84
        7.1.3   Methodology                                           85
        7.1.4   Using the tool                                        87
        7.1.5   Tutorial / Cases                                      89
        7.1.6   Concluding remarks                                    90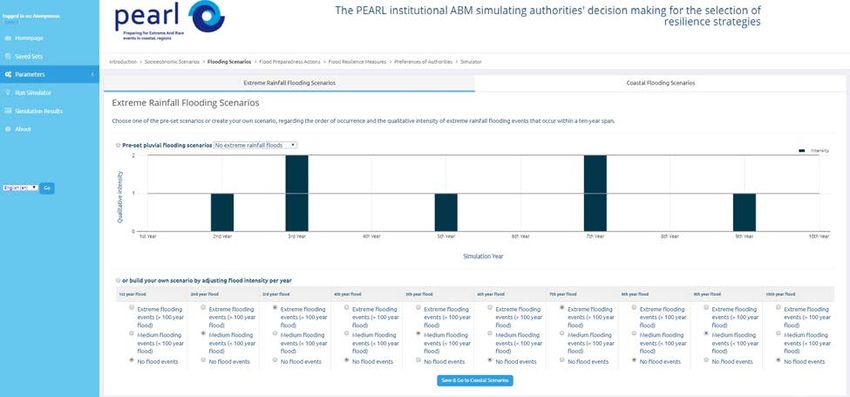
List of figures
Figure 2-1 Coupled ABM-Flood Model tool components in the Repast Simphony environment. The
    five Java packages (red rectangle) holds the main software code .......................................... 14
Figure 2-2 Coupled model implementation flowchart for long-term FRM planning. ........................ 16
Figure 2-3 Repast Simphony – Import projects from file ................................................................. 18
Figure 2-4 Repast Simphony – load the file .................................................................................... 19
Figure 2-5 Repast Simphony – launch the runtime environment .................................................... 20
Figure 2-6 Repast Simphony – set the parameters ........................................................................ 21
Figure 2-7 Repast Simphony – initialize and start run .................................................................... 22
Figure 2-8 An example of a Coupled ABM-Flood Model result in CSV format ............................... 24
Figure 2-9 An Example of Repast Simphony visualization ............................................................. 24
Figure 2-10 Number of flooded housed for different zoning scenarios. The right axis is for the rainfall
    recurrence intervals shown in black circles. The left axis is for number of flooded houses shown
    in colored bars, corresponding to the design rainfalls. The purple bars show the number of
    flooded houses without flood zoning policy while the orange and green bars show number of
    flooded houses with zoning policy but with strict and random implementations, respectively. 26
Figure 3-1. Type of agents Description ........................................................................................... 29
Figure 3-2. Phases of a disaster ..................................................................................................... 29
Figure 3-3. Environment Description .............................................................................................. 30
Figure 3-4. Model Formalization – Daily Routine for Individual Agents .......................................... 31
Figure 3-5. Internal structure of PECS reference model (Urban and Bernd, 2001). ....................... 32
Figure 3-6. Outline of the steps to build the Operational ABM. ....................................................... 34
Figure 3-7. Software Requirements ................................................................................................ 35
Figure 3-8. Folder containing the ABM for Evacuation (Operational) ............................................. 37
Figure 3-9. Start the Program ......................................................................................................... 38
Figure 3-10. Selecting the workspace – Eclipse Launcher. ............................................................ 38
Figure 3-11. Structure of the ABM code in Repast Symphony ....................................................... 39
Figure 3-12. Import Model into Repast function .............................................................................. 39
Figure 3-13 Import project into Repast. Wizard – Step 1 ................................................................ 40
Figure 3-14 Selecting the ABM folder. Wizard – Step 2 ................................................................. 40
Figure 3-15. Running the ABM for evacuation model ..................................................................... 41
Figure 3-16. Initial window of Repast Viewer .................................................................................. 41
Figure 3-17. Run Button .................................................................................................................. 42
Figure 3-18. Graphical visualization of the ABM Model after initialization ...................................... 42
Figure 3-19. Start Run Button ......................................................................................................... 42
Figure 3-20. Attribute Table look in ArcMap – ESRI© .................................................................... 43
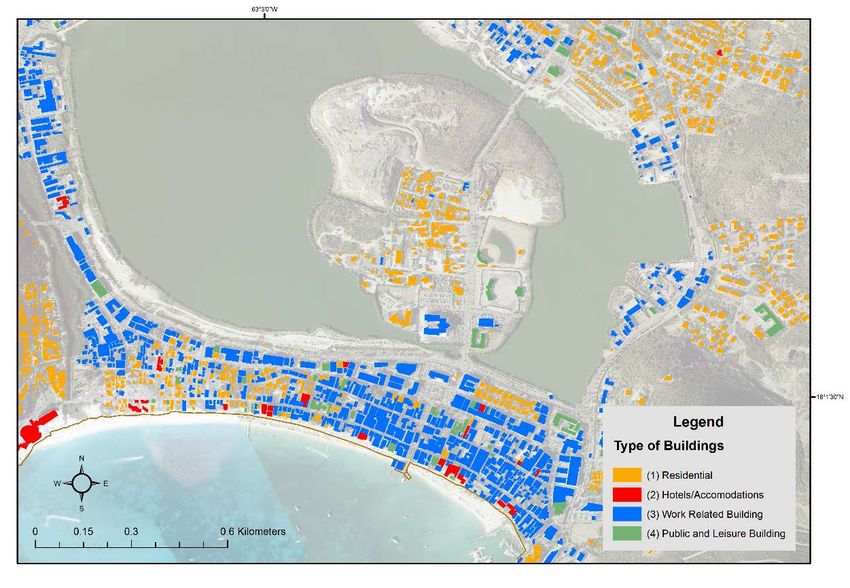
Figure 3-21. Type of Buildings for the operational ABM ................................................................. 44
Figure 3-22. Attribute Table look in ArcMap – ESRI© .................................................................... 45
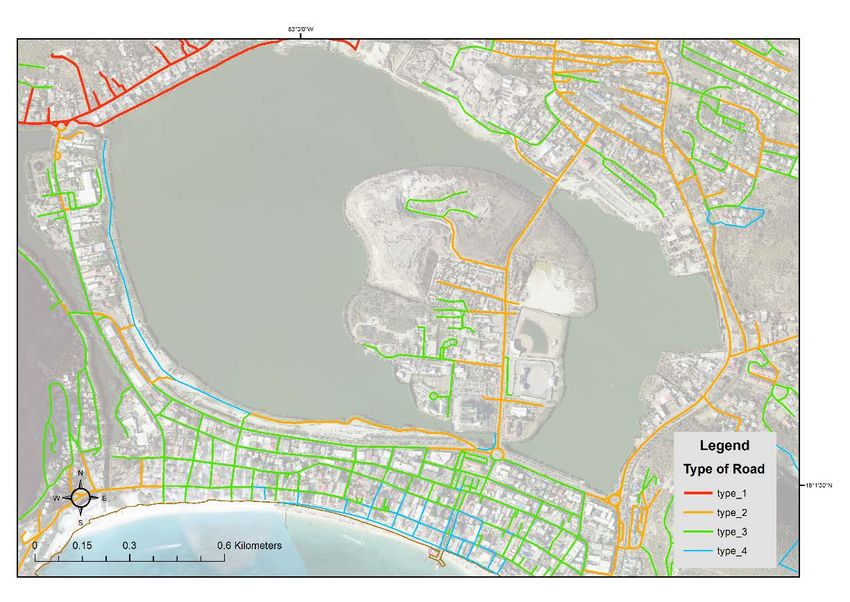
Figure 3-23. Type of Roads for the operational ABM ..................................................................... 46
Figure 3-24. Attribute Table look in ArcMap – ESRI© .................................................................... 47
Figure 3-25. individuals for the operational ABM ............................................................................ 48
Figure 3-26. Location of DefaultAgent.java ..................................................................................... 49
Figure 3-27. Step() method for individual agents in the operational ABM ...................................... 49
Figure 3-28. General view of operation ABM simulation and zoom to an area ............................... 50
Figure 3-29. Operational ABM screen shot after some steps in the simulation. ............................. 51
Figure 3-30. Operational Agent based model in the island of Sint Maarten ................................... 52
Figure 3-31. Critical Roads and Critical Shelters in Sint Maarten for this simulations .................... 53
Figure 4-1: Flowchart of the function of the flood-traffic integration tool ......................................... 56
Figure 4-2: Step by step interpretation of the first component of the tool ...................................... 57
Figure 4-3: Flowchart of the second component of the tool ........................................................... 59
Figure 4-4: How to add the PEARL toolbox .................................................................................... 60
Figure 4-5: Interface of the PEARLfinal model ............................................................................... 61
Figure 4-6: Number of vehicles in the network during normal and flooded conditions in the morning
hours ........................................................................................................................................ 64
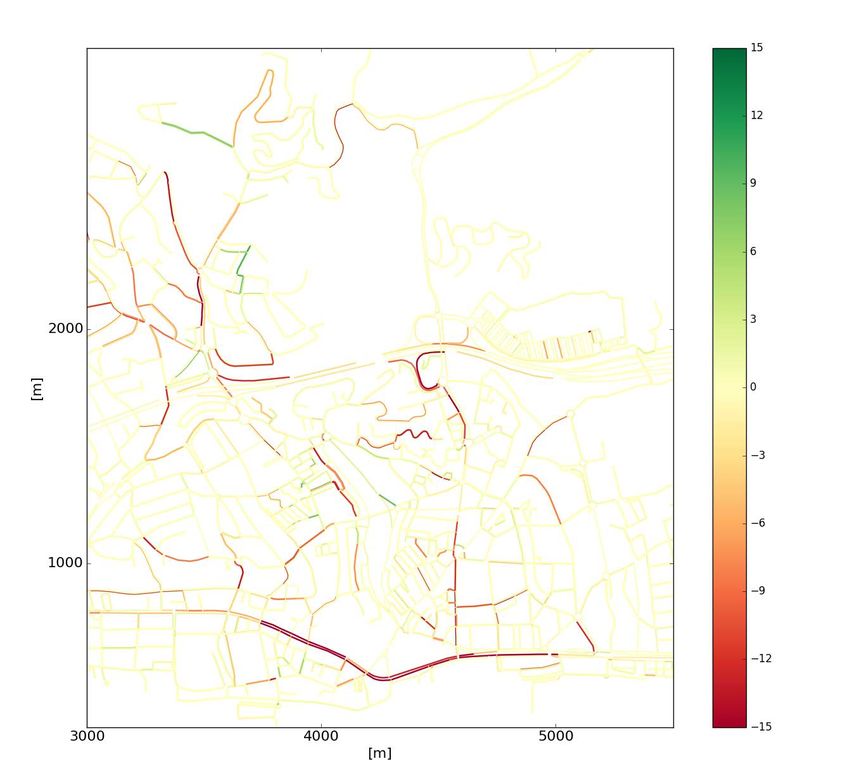
Figure 4-7: Map showing the differences in road speed (m/s) between the normal ....................... 66
Figure 5-1 The data requirement for building content damage assessment ................................... 69
Figure 5-2 The data requirement for health impact assessment .................................................... 69
Figure 5-3 (a)The ArcGIS toolbox and (b) the QGIS toolbox for PEARL damage assessment tools
................................................................................................................................................. 70
Figure 5-4 The input dialogues for the hazard impact assessment tool (a) ArcGIS raster version; (b)
ArcGIS vector version; (c) QGIS raster version; and (d) QGIS verctor version ....................... 71
Figure 6-1. Methodology for Indirect Damages assessment .......................................................... 77
Figure 6-2. Land uses and business activities classification ........................................................... 78Figure 6-3. Damages transformation matrix ................................................................................... 78
Figure 6-4. Interpretation of the model coefficients ......................................................................... 79
Figure 6-5 Toolbox direct damages transformation sheet .............................................................. 80
Figure 6-6 Toolbox indirect damage quantification sheet ............................................................... 81
Figure 6-7. Aggregated Direct Damages ........................................................................................ 81
Figure 6-8. Indirect Damages results with low unemployment rate ................................................ 82
Figure 6-9. Indirect Damages results with high unemployment rate ............................................... 82
Figure 7-1: Conceptual framework of the PEARL ABM SAS .......................................................... 85
Figure 7-2: Core procedure of the PEARL ABM SAS ..................................................................... 86
Figure 7-3: Inserting external data through the original interface (NetLogo’s interface) of the PEARL
ABM SAS ................................................................................................................................. 86
Figure 7-4: Parameters menu bar ................................................................................................... 87
Figure 7-5: Define flood scenarios .................................................................................................. 88
Figure 7-6: Run simulator ............................................................................................................... 88
Figure 7-7: Implemented actions during the 10-year simulation (implemented – green, not-
implemented – grey) ................................................................................................................ 89
Figure 7-8: PEARL Toolbox methodology ...................................................................................... 90
List of tables
Table 2-1 Data requirement for the ABM and flood model ............................................................. 22
Table 3-1 Individual Agents Classification Parameters ................................................................... 30
Table 3-2. Individual Agents Classification Actions ........................................................................ 32
Table 3-3. Structure of the Attribute Table of the Shapefile of Buildings ........................................ 43
Table 3-4. Type of Buildings used in the Operational ABM ............................................................ 44
Table 3-5. Structure of the Attribute Table of the Shapefile of Roads ............................................ 45
Table 3-6. Type of Roads used in the Operational ABM ................................................................ 45
Table 3-7. Structure of the Attribute Table of the Shapefile of Roads ............................................ 47
Table 4-1 Table of the input files for the two components of the model. ........................................ 62
Table 4-2 Differences between normal and flooded conditions in the morning traffic for 24 hours of
simulation................................................................................................................................. 641 Introduction PEARL aims to develop adaptive, sociotechnical risk management measures and strategies for coastal communities against extreme hydro-meteorological events minimising social, economic and environmental impacts and increasing the resilience of Coastal Regions in Europe. Traditionally risk is defined as a combination of vulnerability and hazard of a particular event. This approach has proved to be valuable in taking financial decisions. However, when dealing with complex dynamic systems such as urban areas, there are other visions or perspectives that need to be addressed such as social justice, poverty, risk perception and acceptance, etc. Vojinovic and Abbott (2012) argue for the need to adopt a holistic approach to flood risk management, rather than a narrow techno-centric approach. PEARL adopts a holistic approach to assessing impacts from flood events. In the assessment of impacts, the following aspects are considered: assessment of potential direct and indirect tangible damages, social and health impacts, impacts on cultural properties and other indirect effects or business interruption. To address this range of impacts a set of tools has been developed to assess the system characteristics over a long period of time (i.e., strategic planning level in relation to policies for which implementation effects may take longer period of time) and relate to emerging system characteristics relevant during disaster event (operational level). This report describes the toolkit and the models in the following way: Chapter 2 presents the Long term / Strategic Coupled ABM-flood model tool; Chapter 3 describes the operational / evacuation ABM tool; Chapter 4 describes integration of an ABM traffic model with an inundation hydro-dynamic model; Chapter 5 presents a tool for direct damage assessment; Chapter 6 describes a new methodology/tool for the estimation of indirect damages; Chapter 7 describes an ABM model that supports exploration of intervention options under different socio-economic conditions and different flood event scenarios.
2 Long term / Strategic Coupled ABM-flood model
   tool

2.1 A brief description of the tool
    One of WP3 objectives is to develop concepts and tools for holistic risk assessment. This section
    addresses the tool that can be used to study long-term drivers of flood hazards, vulnerabilities and
    exposure. The drivers include different policy and planning alternatives that aim to reduce flood risk,
    their implementations and community response. As these drivers shape individuals’ behaviour
    towards flood risk management, they can be collectively regarded as “institutions” (Crawford and
    Ostrom, 1995; North, 1990). To incorporate the human dimension (i.e., vulnerability, exposure and
    decisions related to flood hazard reduction) besides the physical phenomena (i.e., flooding) in flood
    risk management studies, a Coupled fLood-Agent-Institutions Modelling framework (CLAIM) is
    proposed. CLAIM includes five components: agents (i.e. the stakeholders related to flooding that
    ranges from individuals to municipalities and government entities), institutions (i.e., the different
    policies, strategies, rules, ordinances, etc that define the implementation of structural and non-
    structural flood risk reduction measures), the urban environment (considering that the focus of
    PEARL is coastal urban regions, the environment is an urban environment where the agents live
    and interact, and floods happen), physical processes (i.e., hydrologic and hydraulic
    processes/components that include natural and manmade drainage networks, hydraulic structures
    and parts of the hydraulic cycle) and external factors (i.e., factors that affect the system under
    investigation but are not directly affected by the local system settings - these include external political
    and economic factors and the hydro-meteorological events that are sources of flood).
    CLAIM is a means to conceptualise the system/problem as it helps to systematically define different
    components of the problem, the boundary and scope of the system, and data needed. However, the
    actual analysis or model implementation is done by coupling agent-based models (ABM) and
    physically-based flood models. The ABM is used to model the social system (i.e., agents and
    institutions); whereas, the flood model is used to model the physical system (i.e., flooding). The
    following sections describe the Coupled ABM-Flood Model.

2.2 Introduction to the tool

 2.2.1 Description of the components developed
    As already indicated, the coupled modelling tool is composed of an ABM and a hydrodynamic flood
    model. There are multiple modelling environments for both the ABM and flood model. However, in
    this tool, the MIKE FLOOD hydrodynamic model that couples one-dimensional drainage network
    flows and two-dimensional surface flows (DHI, 2016a) is used to develop the flood model; and the
    Repast Simphony environment that uses the Java programming language (North et al., 2013) is
    used for ABM coding.
    •   Flood Model
    The flood model is used to simulate fluvial, flash, pluvial, groundwater or coastal floods and their
    combinations. The physical processes that are included in flood simulations can be broadly
    categorized as hydrologic (rainfall-runoff) and hydrodynamic (routing) processes. Within MIKE
FLOOD, rainfall-runoff processes and one-dimensional (1D) flow in channels is modelled using the
MIKE11 package. The two-dimensional (2D) surface flow along the flood plains is modelled using
the MIKE21 package. A coupled MIKE11-MIKE21 model through the MIKE FLOOD environment
provides the full flood model. For setting up flood models in MIKE FLOOD the readers may refer to
DHI user manual (DHI, 2016a).
• ABM
ABM is used to model heterogeneous actors’ actions, interactions and their decision making. In
addition, ABMs are also used to model institutions that shape actors’ actions and interactions. The
initial and crucial steps in building ABMs include decomposing and conceptualizing the system and
describing it in a modelling language. For that purpose, the ABM in the coupled modelling tool is
structured using the MAIA (Modelling Agent systems using Institutional Analysis) meta-model
(Ghorbani et al., 2013). MAIA provides a comprehensive modelling language to build ABMs of social
systems, and it systematically and explicitly incorporates institutions into models. There are five
structures in MAIA: social structure defines agents and their attributes such as properties, behavior
and decision making; institutional structure defines the social context such as role of agents and
institutions that govern agents’ behavior; physical structure defines the physical aspects of the
system such as infrastructure; operational structure defines the dynamics of the system; and finally,
the evaluative structure defines the concepts that are used to validate and measure the outcomes
of the system.
• Coupled Model
In the coupled modelling tool, the ABM is considered as a “principal” model. The reason is that the
ABM runs for the entire simulation period since the human dynamics (i.e., social, economic and
political dynamics) happen all the time. However, since floods may not occur in every time step, the
flood model runs only if there is a source of flood. The components of the coupled model (based on
the ABM environment) are described below.
As shown in Figure 1, the coupled model has five Java packages: collectiveStructure,
physicalStructure, operationalStructure, contectBuilder and dataCollection.
1. collectiveStructure package – this package holds agent related java classes. For example, if
the modeller identified five agents that are important to define the problem under investigation,
there will be five Java classes. For each agent, the modeller must define the attributes that
characterise the agent.
2. physicalStructure package – this package holds java classes related to the physical aspects
of the system. The physical aspects are houses, catchments, coastlines, flood maps, roads,
drainage channels, rivers, etc. Java objects created using these class templates are based on
GIS vector data. Some objects might be used in the agent dynamics, and others can be used
solely for visualization purpose. For those classes used to create visualization objects, related
Java classes that implement the SurfaceShapeStyle interface must also be created so that
Repast Simphony uses the correct rendering for the type of vector data (i.e., point, line or
polygon).
3. operationalStructure package – this package holds Java classes related to the human and
flood dynamics. The human dynamics include urban development and flood risk management
decision making such as when, where and how to implement flood hazard, vulnerability andexposure reduction measures. The flood dynamics include running the MIKE FLOOD model
(calling the executable file), updating the MIKE FLOOD input files if the human dynamics result
in change in the surface imperviousness, hydraulic structures or drainage network.
4. contectBuilder package – this package (shown as stMaarten in Figure 1) holds the main
‘builder’ class and a GlobalVariable class. The builder class creates the ‘context’ and
‘geographic projections’ (these are Repast Simphony related terms. See the following
documentation (Collier and North, 2016)). All the agents and physical structures are initialized
and added to the context and geographic projections in this class. In the GlobalVariable class,
global variables that are used in many different classes.
5. dataCollection package – this package (shown as mainDataCollection in Figure 2.1) holds
Java classes used for ‘data collection’ (i.e., in this context, data refers to the generated result,
not the input data). In Repast Simphony, results can be recorded in a unique way by defining
‘data sources’ and ‘data sets’. In this package, classes implement AggregateDataSource
methods (Collier and North, 2016).
Figure 2-1 Coupled ABM-Flood Model tool components in the Repast Simphony environment. The five
Java packages (red rectangle) holds the main software code2.3 Methodology 2.3.1 Description of the flowchart with all steps The following steps can be followed for setting up and running the coupled modelling tool: 1. Conceptualizing the system using CLAIM The first step towards building a coupled ABM-flood model is to formulate the human-flood interaction problem that needs to be investigated, and to decompose and structure the concepts related to the two subsystems. Besides guiding the collection of primary and secondary data, this step provides different knowledge domains or expertise required to build the agent-based and flood models. Basically, this step is about deciding the model boundary and identifying the five components of the CLAIM framework in the coupled system. 2. Building the ABM Once the CLAIM elements are identified, the MAIA meta-model is used to conceptualize and structure the human subsystem and to formally describe it as a model. Agents in CLAIM, their states and behaviors, are defined in the social structure of MAIA. Agents’ physical artefacts and the urban environment in CLAIM are defined in the physical structure. Institutions and the external political and economic policies in CLAIM are defined in the institutional structure. The dynamics of the subsystem, which include agents’ actions and their interactions with other agents and the environment are defined in the operational structure. Then, the MAIA-structured descriptions of the human subsystem is converted to pseudo-codes that can be implemented in Java programming language in the Repast Simphony environment. 3. Building the flood model The third step is to build the coupled 1D-2D MIKE FLOOD model. The type of flood model is dependent on the type of the flood. For example, if the case study is impacted only by the coastal flood, the model required would be 2D MIKE21 model. However, if the source of flood in the case study is pluvial, fluvial, flash flood or combination of these floods with coastal flood, then both 1D MIKE11 and 2D MIKE21 models would need to be built. Before coupling the 1D and 2D models, each model must be able to run independently. After that they can be coupled in the MIKE FLOOD environment and calibrated. 4. Coupling ABM and flood models Based on the magnitude and extent of flood hazard and their social, economic, political and governance makeup, agents may decide to implement different flood reduction and adaptation measures. To model and evaluate these measures, the ABM and the flood models are coupled dynamically. Figure 2.2 illustrates the coupling processes.
Figure 2-2 Coupled model implementation flowchart for long-term FRM planning.

5. Model verification, experimentation, result analysis and validation
These are generic steps that can be more or less applied to any kind of modelling. Verification is
related to the ABM software code developed. It refers to checking if the formalization and
conceptualization done in Step 2 have been correctly translated into the computational model
(Nikolic et al., 2013) developed in Repast Simphony. Experimentation includes setting up scenarios
and deciding on the number of runs of simulations and the computational resources to use. After
collecting and analysing the results, a model validation is performed to check if the models, the
    experimentations and the results make sense and provide insight to the problem defined in Step 1.

 2.3.2 Description of the code, repository, how to install, settings etc.
    The        source    code       for    the     coupled    modelling   tool    is    available    at:
    (https://github.com/yaredo77/Coupled_ABM-Flood_Model). The tool is developed within the
    Windows OS. Software requirements are:
        - The ABM is developed using the open source modelling environment Repast Simphony 2.4.0
             (available at https://github.com/Repast/repast.simphony/releases/). Repast Simphony 2.4.0
             is compatible with Java 8 (the Java jdk-8 is an open source software and it is available at
             http://www.oracle.com/technetwork/java/javase/downloads/jdk8-downloads-2133151.html).
             Detailed documentation manual on how to download, install and use Repast Simphony can
             be found in https://repast.github.io/docs.html.
        - The flood model is developed using the MIKE FLOOD hydrodynamic modelling software
             (available at https://www.mikepoweredbydhi.com/download/mike-2017). MIKE FLOOD is a
             licensed, commercial software. Detailed manual on how to download, install and use the
             MIKE FLOOD software can be found in (DHI, 2016a).
    Because of the licensing issue related to the MIKE FLOOD software, the coupled model source code
    shared above does not require setting up and running the MIKE FLOOD model. Instead, flood model
    result files are provided to assess the flood impact. To be able to use the ABM tool, knowledge of
    the Java programming language is required.
    For result analysis and graphical presentation, the R computer language is used. This language
    provides a large set of packages for processing functionality and result presentation. R for Windows
    is available at https://cran.r-project.org/bin/windows/base/. An open source environment for R
    coding,    editing,   debugging      and     visualization  called   RStudio     is    available   at
    https://www.rstudio.com/products/rstudio/download/.

2.4 Using the tool

 2.4.1 Description of the interface steps and menus
    The following steps describe how to use the Coupled ABM-Flood Model tool.
    Step 1. Open the Repast Simphony environment (Figure 2.3) and load the project file that is provided
    in the above section (Figure 2.4).
1
2
Figure 2-3 Repast Simphony – Import projects from file3
4
5
6
Figure 2-4 Repast Simphony – load the file
Step 2. Start the model runtime environment (Figure 2.5)8
7
Figure 2-5 Repast Simphony – launch the runtime environment
Step 3. Set the parameters used in the model within the runtime environment (Figure 2.6)9
Figure 2-6 Repast Simphony – set the parameters
Step 4. Initialize and start simulation run (Figure 2.7)11
10
Figure 2-7 Repast Simphony – initialize and start run
2.4.2 Input data set
Setting up and running the coupled ABM-flood model requires a number of data sets. The data
required for each model is are listen in Table 2-1.
Table 2-1 Data requirement for the ABM and flood model
Model Data type format Remark
Topographic data (DTM) Raster
ABM Geographic boundary Shapefile (polygon)
Hydrologic catchments Shapefile (polygon)Building layer (number of Shapefile (point) This data may contain building
agents) attributes such as elevation,
building function and flood height
Future development Shapefile (point)
locations
Institutional data These are policies, ordinances,
strategies, plans, laws, directives,
norms, strategies, etc.
Agent data These are various attributes of the
different agents in the model.
Channel network layout Shapefile (polyline)
Channel cross-section These include depth, width, shape,
characteristics elevation and
Catchment characteristics These include catchment area,
Flood curve number (imperviousness),
model
Rainfall data Time series
Discharge data Time series
Bathymetry data Raster
Boundary data Time series Water level or discharge data
2.4.3 Outputs
The flood model outputs include a raster flood depth/level and discharge over the simulation period.
However, these outputs are processed within the ABM to directly compute the flood impact on
agents. Hence, the main output of the Coupled ABM-Flood Model tool is agents’ flood impact level
given the type of institutions and the decisions made by the agents. This output is presented in CSV
file (Figure 2.8). The file contains the time steps, the agents’ houses locations, whether agents follow
policies, and the flood depth in case a house is flooded.Figure 2-8 An example of a Coupled ABM-Flood Model result in CSV format
In addition, Repast Simphony also provides visualization with an interface (Figure 2.9)
Figure 2-9 An Example of Repast Simphony visualization: The squares represents buildings/houses2.5 Tutorial / Cases
2.5.1 Description of the application of the tool in a case study
A demonstration of the application of the CLAIM approach is presented using Sint Maarten FRM as
a case study for a complex human-flood system. The ABM is structured using MAIA. In the social
structure, two agent types are identified: household agents and the government agent. Household
agents are characterized by location and elevation, and they have houses. The government agent
is characterized by budget and level of enforcement. In the institutional structure, flood zoning policy
is considered. This policy is part of a National Development Plan, which is at the time of the
production of this report still in a draft phase. The institutional statement for the policy is written as:
Households must elevate their house if they are located in a flood zone or else they will be fined.
Since the statement has a formal sanctioning, the institution is a rule. However, the government
agent may not strictly enforce the rule. The physical components defined in the physical structure
are houses, drainage channels, hazard triggering factors (rainfall and storm surge) and flood. In the
conceptualization, households are represented by houses. Houses are characterized by location,
elevation and floor height, and are the only physical components defined in the ABM. If they follow
the policy, household agents may raise the floor of houses by 0.5m, 1m and 1.5m depending on the
flood zone they are located. In the operational structure of the ABM, agents’ actions and interactions
are defined. For example, considering urban development, household agents build new houses.
Before building, they may decide where to build it and if they would follow the institutions.
In the flood model developed, design rainfalls of 5yr, 10yr, 20yr, 50yr and 100yr average recurrence
intervals (ARI) are used. It is assumed that any rainfall magnitude below the 5yr ARI does not result
in flooding. For rainfall-runoff analysis, the unit hydrograph method with SCS runoff curve number
(DHI, 2016b) is used. The curve number values are updated based on the number of new houses
built in a given catchment to reflect increase in imperviousness due to urban development.
The ABM is set up considering three scenarios – one without zoning policy, another with zoning
policy (strict implementation), and the last one with zoning policy (random implementation). The strict
implementation can be associated with either strict enforcement of the policy or all agents follow the
policy not to get fines for violation. The random implementation is to simulate “no-so-strict” level of
enforcements which can be, for example, due to shortage of inspection officers.
The simulations were instantiated with 10000 households and each experiment run for 30 time steps
with similar design rainfall event series. One time step represents one year. It is assumed that a
maximum of one flood event happens in a given time step where a time step represents one year.
2.5.2 Outputs from the case study
The case study used for this purpose is the Sint Maarten case study. The result in Figure 2.6 shows
that, comparing the damage from a rainfall with 5 year ARI, in about 20 years (from time step 3 to
22) the number of flooded houses rises by about 60%. This is mainly attributed to the increase in the
number of new houses in exposed areas. Even if there is increase in flood depth between the
mentioned time steps, the contribution of the higher flood to the rise in the number of flooded houses
is minor as the flood extent is the same. The number of flooded houses for the three scenarios is
very close, i.e., the effect of the flood zoning policy, even with strict enforcement, is minor. This is
because there were already substantial number of houses built (or instantiated in the model) in the
flood zones before the policy is introduced. In addition, the flood zoning does not include some areaswhich are flood-prone and developments are occurring. Therefore, based on the modelling exercises carried out, for the zoning policy to have a reasonable effect on the overall flood risk reduction in Sint Maarten, the delineated flood-zones must cover all flood-prone areas and there should be other complementary measures that reduce the risk of new developments outside the zones. Figure 2-10 Number of flooded housed for different zoning scenarios. The right axis is for the rainfall recurrence intervals shown in black circles. The left axis is for number of flooded houses shown in colored bars, corresponding to the design rainfalls. The purple bars show the number of flooded houses without flood zoning policy while the orange and green bars show number of flooded houses with zoning policy but with strict and random implementations, respectively. 2.6 Concluding remarks The coupled ABM-flood modelling tool allows to incorporate and model the physical changes made by humans on the urban environment and to assess how that process changes the flood risk over time. As shown in the application, modelling human-flood interaction using coupled ABM-flood model can be beneficial in gaining understanding of the system. In addition, it can be used to investigate possible future directions in flood risk management. The coupled model can also help to examine how levels of exposure (i.e., number of assets-at-risk), flood hazard (i.e., flood magnitude and extent) and vulnerability (i.e., propensity to be affected) change with respect to the changes in human behavior (i.e., policies and their implementations). It also helps to conceptualize and model the whole system in one integrated model and to analyze feedback between the subsystems. This, in turn, gives a broader perspective for FRM decision makers in adopting policies. The outputs of the coupled model include the level of flood risk, in terms of assessed impact, as a way to measure the
effectiveness of formal and informal institutions; and types of measures favored (or not) in an urban
   area based on the social and governance factors.
   The tool provides an interdisciplinary approach by allowing knowledge contributions from
   hydrologists/hydraulic engineers and social scientists. For example, within PEARL, the qualitative
   Risk and Root cause Analysis report from the WP1 (Fraser, 2016) was helpful to conceptualize the
   model and identify the relevant actors in the Sint Maarten FRM. Vulnerability analysis report from
   WP1 was also beneficial as input data for the Coupled ABM-Flood Model.
   The CLAIM framework is a generic modelling framework that can be used to conceptualize almost
   any FRM problem. However, to use the tool provided in Section 2.3.2, the modeler must update the
   software code so that it reflects the case study situation. In terms of coupling ABM with a flood model,
   the tool is developed for coupling ABM with MIKE FLOOD. If one wants to couple the ABM with
   another flood modelling tool (e.g. HECRAS), the relevant modules of the software code should be
   improved to handle the appropriate input-output data formats. Further, the coupled model can be
   applied to a combination of flood events (pluvial, fluvial, coastal and flash). An important remark is
   that the coupled model simulation requires large data and computational resources, especially, when
   the system complexity increases and when there are multiple scenarios to examine.

2.7 References
   Collier, N.T., North, M.J, 2016. Repast Java Getting Started. Repast Development Team.
           https://repast.github.io/docs/RepastJavaGettingStarted.pdf
   Crawford, S.E.S., Ostrom, E., 1995. A Grammar of Institutions. American Political Science Review
         89, 582–600. https://doi.org/10.2307/2082975
   DHI, 2016a. MIKE FLOOD: 1D-2D User Manual. MIKE Powered by DHI, Hørsholm, Denmark.
   DHI, 2016b. MIK11: A Modelling System for Rivers and Channels - Reference Manual. MIKE
         Powered by DHI, Hørsholm, Denmark.
   Fraser, A. (2016) ‘Risk Root Cause Analysis Report St Maarten, Dutch Caribbean.’ King’s College
          London Environment, Politics and Development Working Paper Series. October 2016.
          https://www.kcl.ac.uk/sspp/departments/geography/research/Research-
          Domains/Contested-Development/Working-Papers-/KCLWorkingPaper-PEARL-Risk-and-
          Root-Cause-Analysis-St-Maarten.pdf
   Ghorbani, A., Bots, P., Dignum, V., Dijkema, G., 2013. MAIA: a Framework for Developing Agent-
         Based Social Simulations. JASSS 16, 9. https://doi.org/10.18564/jasss.2166
   Nikolic, I., van Dam, K.H., Kasmire, J., 2013. Practice, in: van Dam, K.H., Nikolic, I., Lukszo, Z.
           (Eds.), Agent-Based Modelling of Socio-Technical Systems, Agent-Based Social Systems.
           Springer, Dordrecht, pp. 73–137. https://doi.org/10.1007/978-94-007-4933-7_3
   North, D.C., 1990. Institutions, Institutional Change and Economic Performance, The Political
          Economy of Institutions and Decisions. Cambridge University Press, New York, NY, USA.
   North, M.J., Collier, N.T., Ozik, J., Tatara, E.R., Macal, C.M., Bragen, M., Sydelko, P., 2013. Complex
          adaptive systems modeling with Repast Simphony. Complex Adaptive Systems Modeling 1,
          3. https://doi.org/10.1186/2194-3206-1-3
3 Operational / Evacuation ABM modelling tool
3.1 A brief description of the tool
The operational Agent Based Model (ABM) was also implemented as a tool to support large scale
evacuation strategies for flood disaster risk prevention and mitigation. It addresses disaster risk
reduction by minimizing exposure of people to the hazards itself. Therefore, the tool is focused on
modelling the human behaviour before and during a flood event.
The model mimics daily behaviour of individuals and their interactions at a city scale and how this
collective behaviour evolves following the event of a flood disaster. The aim of this approach is to
support understanding of some critical factors that have influence on evacuation processes.
The tool can be used to test different scenarios of flooding as well as different communication
strategies and communication means. The overall performance of the evacuation is measured by
the number of people that reach safe area/shelter and the number of people that can get in contact
with the flood water.
The tool developed can be used by city planners and emergency agencies for planning their
evacuation strategies and disaster risk management plans. In addition, the tool can be also used to
identify what physical infrastructure needs further strengthening (e.g., widening of roads and
strengthening shelters, etc.).
3.2 Introduction to the tool
3.2.1 Description of the components developed
This section discusses different components or modules that were used to set up the Agent Based
Model to test multiple evacuation strategies. The first part of this section deals with the framework
developed to represent human behaviour as well as some of the main assumptions and
characteristics of the ABM. The final part describes the software and hardware used to run the
simulations.
• Human behavioural model
Two general concepts were used during the implementation of the ABM:
1. The ABM was built to represent daily behavioural pattern of a complex urban environment:
interactions between agents (humans) and agents with the environment (the city).
2. The ABM includes a module where human cognition is captured to represent the complex human
decision making process during evacuation in flood events. The process of implementing the ABM
can be summarized to the following five-step process:Step 1: Description of agents
The first step is to define types of agents that will be considered. Two different types of agents where
considered in the present work: individuals (where every agent represents one person) and
organizations (i.e., those organisations in charge of the city evacuation, e.g., civil defence, police,
fire brigade, etc.), see Figure 3-1. Also, the warning forecast and communication agencies were
modelled as organizational agents (i.e. weather forecast institutions).
Figure 3-1. Types of agents
Step 2: Classification of agents
This step deals with classification or grouping of different types of agents. The purpose of this is to
specify behaviour of agents during different phases of flood disaster. In this work three major phases
are considered (Figure 3-2): before, during and after disaster. The warning phase is a moment when
agents become aware of a possible threat. The focus of this tool is on the first and second phase of
disaster (i.e., before and during disaster). Table 3-1 presents the main parameters that were used
in the classification of individual agents. These also include subjective and objective characteristics.
Figure 3-2. Different phases of a flood disasterTable 3-1 Individual Agents Classification Parameters
Type of Parameter
Type of
Parameter Parameter
Parameter
Awareness
Age
Education Level
Gender
Flood risk perception
Employment Status
Willingness to Follow
Objective Financial Subjective
orders
Parameters Resources Parameters
Altruism/Willingness to
Mobility
help others
Language Abilities
Resilience / Adaptability
Access to Information
Step 3: Environment characterization
In the present work, environment classification refers to those elements that form the physical space
in a city (i.e. buildings, roads, water bodies, etc.). It also includes the way how agents interact with
the environment and how they interact among themselves, see Figure 1.
Figure 3-3. Environment - physical representation of space where agents interact;
Step 4: Model formalization and parametrization
This step deals with a set rules that define the agents’ behaviour in simulations. This is done by
combining narrative rules and flow charts. For each agent (WHO), the actions to perform (WHAT) atwhich specific timeframe (WHEN). Refer Figure 3-4 for a description of daily behaviour or routine for
individual agents before a flood event is anticipated/forecasted (i.e., before disaster phase).
Figure 3-4. Model formalization – daily routine for individual agents.
Probability functions were built into the ABM code for each type of individual agents to perform the
most likely activity. The probability varies according to the day (week day or weekend) and also the
time when it was taken into account.
Step 5: Cognitive module
This step deals with development of the module within the ABM code to allow individual agents to
react in a “human” like manner with respect to the warning information. For this tool the PECS
reference model was selected because it allows to specify the influence of physical, emotional,
cognitive and social factors and their interactions during emergency situations. PECS intends to
support design process of agent-based simulations in which individual human behaviour and
decision making process, the interactions between individuals as well as the interactions of
individuals with the environment are in the centre of interest. The PECS reference model provides a
frame for the construction of agents, a communication infrastructure and an environment component.
The internal structure of PECS is presented in Figure 3-5. The structure is composed from a sensor
and perception component that allows the agent to sense and perceive data from the environment
as well from other agents in the system. The central part of the PECS structure is used to describe
the state of the agent regarding its physical, emotional, cognitive and social status. The bottom part
in Figure 3-5 is intended to provide the response or behaviour of the agent given the perception and
state of the agent during the simulation.PERCEPTION SENSOR
Social Status Cognition Emotion Physis
Z F Z F Z F Z F
BEHAVIOUR ACTOR
Z: State Causal Dependencies
F: State Transition Function Information Flow
Figure 3-5. Internal structure of PECS reference model (Urban and Bernd, 2001).
Once each agent is aware (or not) of the existing or an upcoming hazard it will react according to a
probabilistic function based on the agent characteristics listed in Table 3-1. The list of possible
behaviours or reactions is presented in Table 3-2.
Table 3-2. Individual Agents Classification Actions
Action Observation
Evacuation Planned and Organized, Follow instructions.
Fight Prepare in situ
Flight Random Evacuation (not follow orders)
Sideration 1 Inability to respond
Search Relatives Wife, children, parents, etc.
Return home or work Feel safe in these places and stay there.
place
Assist Others The agent becomes an organization actor.
Antisocial Behaviour Panic, looting, etc.
In terms of the flood hazard representation, a time series raster file with water depth and velocity is
needed. For this purpose, the 2D Mike FLOOD model can be used.
1
The sideration term within this research is defined as the inability to respond from the psychological perspective.You can also read