SoilKsatDB: global database of soil saturated hydraulic conductivity measurements for geoscience applications - ESSD
←
→
Page content transcription
If your browser does not render page correctly, please read the page content below
Earth Syst. Sci. Data, 13, 1593–1612, 2021
https://doi.org/10.5194/essd-13-1593-2021
© Author(s) 2021. This work is distributed under
the Creative Commons Attribution 4.0 License.

       SoilKsatDB: global database of soil saturated hydraulic
       conductivity measurements for geoscience applications
                  Surya Gupta1 , Tomislav Hengl2,3 , Peter Lehmann1 , Sara Bonetti4,5 , and Dani Or1,6
               1 Soil and Terrestrial Environmental Physics, Department of Environmental Systems Science,
                                                   ETH, Zürich, Switzerland
                                    2 OpenGeoHub foundation, Wageningen, the Netherlands
                                         3 EnvirometriX, Wageningen, the Netherlands
               4 Institute for Sustainable Resources, Bartlett School of Environment, Energy and Resources,

                                            University College London, London, UK
            5 Soil Physics and Land Management Group, Wageningen University, Wageningen, the Netherlands
                         6 Division of Hydrologic Sciences, Desert Research Institute, Reno, NV, USA

                                Correspondence: Surya Gupta (surya.gupta@usys.ethz.ch)

                                     Received: 11 June 2020 – Discussion started: 9 July 2020
                        Revised: 8 February 2021 – Accepted: 26 February 2021 – Published: 15 April 2021

      Abstract. The saturated soil hydraulic conductivity (Ksat ) is a key parameter in many hydrological and climate
      models. Ksat values are primarily determined from basic soil properties and may vary over several orders of mag-
      nitude. Despite the availability of Ksat datasets in the literature, significant efforts are required to combine the
      data before they can be used for specific applications. In this work, a total of 13 258 Ksat measurements from 1908
      sites were assembled from the published literature and other sources, standardized (i.e., units made identical),
      and quality checked in order to obtain a global database of soil saturated hydraulic conductivity (SoilKsatDB).
      The SoilKsatDB covers most regions across the globe, with the highest number of Ksat measurements from North
      America, followed by Europe, Asia, South America, Africa, and Australia. In addition to Ksat , other soil variables
      such as soil texture (11 584 measurements), bulk density (11 262 measurements), soil organic carbon (9787 mea-
      surements), moisture content at field capacity (7382), and wilting point (7411) are also included in the dataset.
      To show an application of SoilKsatDB, we derived Ksat pedotransfer functions (PTFs) for temperate regions
      and laboratory-based soil properties (sand and clay content, bulk density). Accurate models can be fitted using
      a random forest machine learning algorithm (best concordance correlation coefficient (CCC) equal to 0.74 and
      0.72 for temperate area and laboratory measurements, respectively). However, when these Ksat PTFs are applied
      to soil samples obtained from tropical climates and field measurements, respectively, the model performance is
      significantly lower (CCC = 0.49 for tropical and CCC = 0.10 for field measurements). These results indicate that
      there are significant differences between Ksat data collected in temperate and tropical regions and Ksat measured
      in the laboratory or field. The SoilKsatDB dataset is available at https://doi.org/10.5281/zenodo.3752721 (Gupta
      et al., 2020) and the code used to extract the data from the literature and the applied random forest machine
      learning approach are publicly available under an open data license.

Published by Copernicus Publications.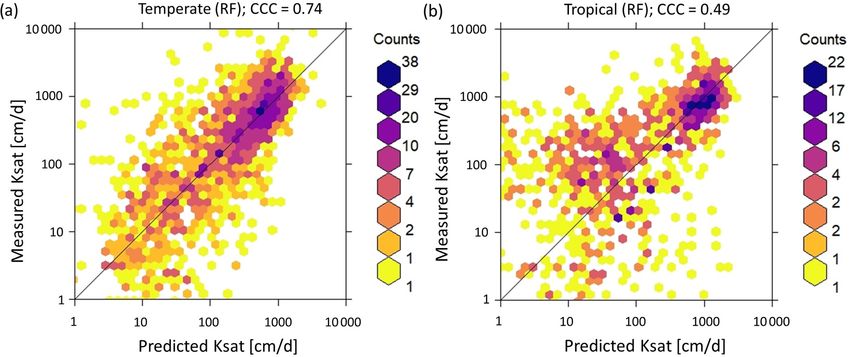
1594                                   S. Gupta et al.: A compilation of soil saturated hydraulic conductivity measurements

1   Introduction                                                  (Hydrophysical Database for Brazilian Soils) improving the
                                                                  coverage of South American tropical regions. In addition,
The soil saturated hydraulic conductivity (Ksat ) describes the   Rahmati et al. (2018) recently published the Soil Water In-
rate of water movement through saturated soils and is de-         filtration Global database (SWIG) with information on Ksat
fined as the ratio between water flux and hydraulic gradi-        for the whole globe. In the SWIG database, some Ksat val-
ent (Amoozegar and Warrick, 1986). It is a key variable in        ues were extracted from the literature and other Ksat val-
a number of hydrological, geomorphological, and climato-          ues were deduced from infiltration time series. In contrast
logical applications, such as rainfall partitioning into infil-   to laboratory measurements that determine Ksat as the ratio
tration and runoff (Vereecken et al., 2010), optimal irriga-      of flux density to gradient, infiltration-based methods deter-
tion design (Hu et al., 2015), and the prediction of natural      mine Ksat by fitting infiltration dynamics to parametric mod-
hazards including catastrophic floods and landslides (Batjes,     els of the infiltration process; for a review on analytical mod-
1996; Gliński et al., 2000; Zhang et al., 2018). Accurate mea-   els characterizing the infiltration process, see Kutílek et al.
surements of Ksat in the laboratory and field are laborious       (1988), Youngs (1991), and Vereecken et al. (2019).
and time consuming and are often scale dependent (Youngs,             The increasing demand for highly resolved descriptions
1991). Using infiltrometer measurements in the field also en-     of surface processes requires commensurate advances in the
ables the measurement of Ksat in forests and other types of       representation of Ksat in modern Earth system model (ESM)
structured soils; however, so far Ksat values have been mea-      applications. Several existing Ksat datasets are either missing
sured mainly for agricultural soils (Romano and Palladino,        coordinates or these are provided with an unknown accuracy,
2002).                                                            thus limiting their applications for spatial modeling. For ex-
   Efforts to produce reliable and spatially refined datasets     ample, the SWIG dataset is missing information on soil depth
of hydraulic properties date back to the 1970s with the pro-      and assigns entire watersheds to a single coordinate. Simi-
liferation of distributed hydrologic and climatic modeling.       larly, the UNSODA dataset does not provide coordinates and
These early notable works also provided basic databases           soil texture information for all samples. For a few locations,
(some of which are used in this study) for Australia (McKen-      HYBRAS uses a different coordinate system. Taken together,
zie et al., 2008; Forrest et al., 1985), Belgium (Vereecken       these limitations imply that to prepare spatially referenced
et al., 2017; Cornelis et al., 2001), Brazil (Tomasella et al.,   global Ksat datasets for large scale applications, it requires
2000, 2003; Ottoni et al., 2018), France (Bruand et al.,          serious effort to compile, standardize, and quality check all
2004), Germany (Horn et al., 1991; Krahmer et al., 1995),         (publicly available) literature.
Hungary (Nemes, 2002), the Netherlands (Wösten et al.,                The objective of the work here is to provide a new global
2001), Poland (Glinski et al., 1991), and the USA (Rawls          standardized Ksat database (SoilKsatDB) that can be used for
et al., 1982). A detailed discussion of the available datasets    geoscience applications. To do so, a total of 13 258 Ksat mea-
for Ksat and other hydrophysical properties is provided in        surements was compiled, standardized, and crosschecked
Nemes (2011). Collaborative efforts have resulted in the          to produce a harmonized compilation that is analysis-ready
compilation of multiple databases, including the Unsaturated      (i.e., it can directly be used to test various machine learn-
Soil Hydraulic Database (UNSODA) (Nemes et al., 2001),            ing algorithms for spatial analysis). We compiled data from
the Grenoble Catalogue of Soils (GRIZZLY) (Haverkamp              existing datasets and, to improve the spatial coverage in re-
et al., 1998), and the Mualem catalogue (Mualem, 1976).           gions with sparse data, we conducted a literature search to
These databases, however, focused on soil types and not           include Ksat measurements in geographic areas that were
on the spatial context of Ksat mapping. In an effort to pro-      not yet included in other existing databases. In this paper,
vide spatial context, Jarvis et al. (2013) and Rahmati et al.     we first describe the data compilation process and then de-
(2018) published global databases for soil hydraulic and soil     scribe methodological steps used to spatially reference, fil-
physical properties. Likewise, the European soil data cen-        ter, and standardize the existing datasets. As an illustrative
ter also started projects, such as SPADE (Hiederer et al.,        application of the dataset, we derive pedotransfer functions
2006) and HYPRES (Wösten, 2000), for generating spa-              (PTFs) for different climatic regions and measurement meth-
tially referenced soil databases for several countries. Since     ods and discuss their transferability to other regions and
HYPRES only includes western European countries, Wey-             measurement methodologies. We fully document all import-
nants et al. (2013) gathered data from 18 countries and devel-    ing, standardization, and binding steps using the R envi-
oped the European HYdropedological Data Inventory (EU-            ronment for statistical computing (R Core Team, 2013), so
HYDI) database. This dataset is, however, not publicly avail-     that we can collect feedback from other researchers and in-
able and was not included in this compilation. The datasets       crease the speed of further updates and improvements. The
mentioned above cover almost all climatic zones except trop-      newly created dataset (SoilKsatDB) can be accessed via
ical regions, where Ksat values can be significantly different    https://doi.org/10.5281/zenodo.3752721 (Gupta et al., 2020).
due to the strong local weathering processes and different
clay mineralogy (Hodnett and Tomasella, 2002). Recently,
Ottoni et al. (2018) published a dataset named HYBRAS

Earth Syst. Sci. Data, 13, 1593–1612, 2021                                        https://doi.org/10.5194/essd-13-1593-2021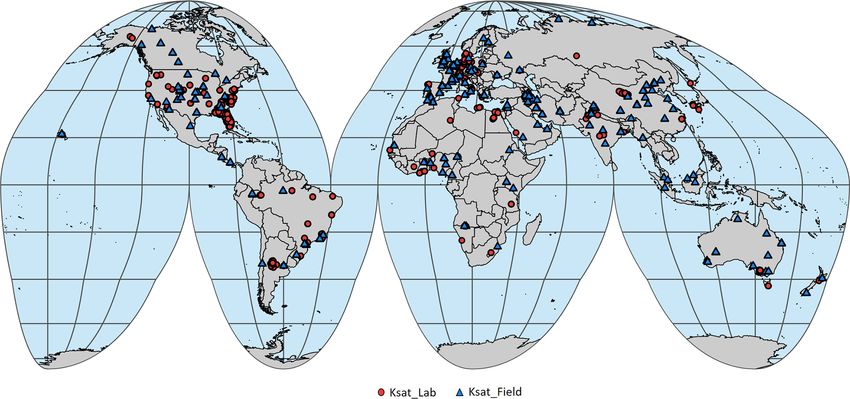
S. Gupta et al.: A compilation of soil saturated hydraulic conductivity measurements                                         1595

2     Methods and materials                                        these regions. We thus digitized Ksat values from these stud-
                                                                   ies (shown either in bar charts or line plots), georeferenced
2.1    Data sources                                                the maps where necessary, and then converted the data into
                                                                   tabular form. In some cases, we also contacted colleagues
To locate and obtain all compatible datasets, a literature         that worked in these regions to retrieve additional data.
search was conducted using different search engines, in-
cluding Science Direct (https://www.sciencedirect.com/, last       2.2   Georeferencing Ksat values and definition of spatial
access: 9 February 2021), Google Scholar (https://scholar.               accuracy
google.com/, last access: 9 February 2021), and Scopus
(https://www.scopus.com, last access: 11 January 2021). We         Georeferencing of Ksat measurements is important for using
searched soil hydraulic conductivity datasets using “satu-         the data for local, regional, or global hydrological and land
rated hydraulic conductivity database”, “Ksat”, and “hy-           surface models. Although many studies provided information
draulic conductivity curves” as keywords. The collected            on the geographical location of the measurements, studies
datasets are listed in Table 1 together with the number of Ksat    conducted particularly in the 1970s and 1980s only provided
observations for each study. They can be classified into three     the name of the locations and approximate distance from a
main categories, namely: (i) existing datasets (in the form of     reference location. A limited accuracy of the position value
tables) published and archived with a DOI in peer-reviewed         may affect the application of the Ksat value in a spatially dis-
publications, (ii) legacy datasets in paper or document format     tributed model. For example, in the case of a location with
(e.g., legacy reports, PhD theses, and scientific studies), and    contrasting hydraulic properties, it must be known to which
(iii) online materials.                                            subregion the measured value can be assigned and the user
   Existing datasets include published datasets such as HY-        must know if the given location is accurate enough. For that
BRAS (Ottoni et al., 2018), UNSODA (Nemes et al., 2001),           purpose we assigned an accuracy value (“accuracy classes”)
SWIG (Rahmati et al., 2018), and the soil hydraulic prop-          to each measurement as explained next. We assigned each
erties over the Tibetan Plateau (Zhao et al., 2018), from          Ksat value to one of seven “accuracy classes” ranging from
which we extracted the required information as described           highest (0–100 m) to lowest (more than 10 000 m or non-
in Table 2. The major challenge with making the existing           available information (NA)) accuracy. For example, Forrest
datasets compatible for binding (standardization, removing         et al. (1985), Zhao et al. (2018), and Ottoni et al. (2018) pro-
redundancy) was to obtain the locations for a particular sam-      vided exact coordinates of the locations, thus we assigned
ple as well as the corresponding measurement depths. For in-       a location accuracy of 0–100 m (i.e., highly accurate; see
stance, the UNSODA database does not provide information           Table 3 for more details). For other references, we digi-
on the geographical locations. To fill the gaps and make the       tized provided maps or sketches with locations of the points.
data suitable also for spatial analysis, we used Google Earth      We first georeferenced these maps using ESRI ArcGIS soft-
to find the coordinates based on the given location (gener-        ware (v10.3) and then digitized the coordinates from geo-
ally an address or a location name). Moreover, all datasets        referenced images. Some of the documents we digitized
were crosschecked to avoid redundancy. For example, the            (e.g., Nemes et al., 2001) provided the names of specific lo-
UNSODA data include the data of Vereecken et al. (2017)            cations and hence we used Google Earth to obtain the co-
and Richard and Lüscher (1983/87) while the SWIG database          ordinates. We estimate that the spatial location accuracy of
includes the measurements of Zhao et al. (2018). Hence we          these points is roughly between 0 and 5 km. Similarly, spatial
removed these from the UNSODA and SWIG database and                maps in jpg format (e.g., Becker et al., 2018) were georef-
used the original sources.                                         erenced with 100–500 m location accuracy. In contrast, few
   In the case of legacy datasets (non-digital tabular format,     studies (e.g., Yoon, 2009) provided the exact location of the
non-peer-reviewed data), we invested significant effort to         sampling with assumed location accuracy of 10–20 m. In the
digitize, clean, and crosscheck the data to extract Ksat val-      SWIG database, the information related to location (coordi-
ues. Two datasets were also collected directly from project        nates for each point) was missing, so we went through each
websites providing data on hydraulic and thermal con-              publication referenced in Rahmati et al. (2018) and added
ductivity (retrieved from https://daac.ornl.gov/FIFE/guides/       coordinates.
Soil_Hydraulic_Conductivity_Data.html, last access: 8 Jan-
uary 2021, and described in Kanemasu (1994)) and the               2.3   Standardization
Florida database (http://soils.ifas.ufl.edu, last access: 8 Jan-
uary 2021) from Grunwald (2020).                                   The database was cleaned to remove 716 unrealistic low Ksat
   There are many biomes and climatic regions, such as             values as outliers deduced from infiltration time series in the
desert dunes, peatlands, and frozen soils, for which very few      SWIG database. Moreover, in the SWIG database, soil depth
Ksat measurements were publicly available. We have inten-          information was not available, so we assumed that infiltra-
sively searched for additional data for these areas and found      tion experiments were conducted in the topsoil and assigned
39 studies (each with less than 5 Ksat measurements) to cover      a depth of 0–20 cm. Furthermore, we computed sand (par-

https://doi.org/10.5194/essd-13-1593-2021                                         Earth Syst. Sci. Data, 13, 1593–1612, 2021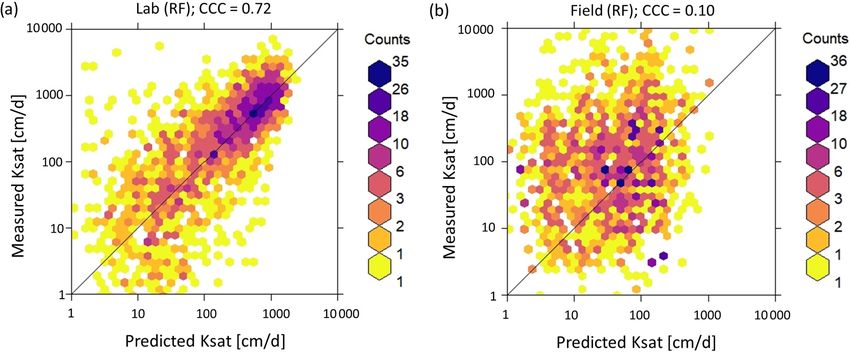
1596                                       S. Gupta et al.: A compilation of soil saturated hydraulic conductivity measurements

Table 1. List of articles, digitized Ksat datasets, and the number of points (N) per dataset used to generate the SoilKsatDB.

           Reference                        N    Reference                            N    Reference                              N
           Rycroft et al. (1975)             1   Habel (2013)                         3    Wang et al. (2008)                     19
           Waddington and Roulet (1997)      1   Nyman et al. (2011)                  3    Deshmukh et al. (2014)                 19
           Takahashi (1997)                  1   Bhattacharyya et al. (2006)          4    Price et al. (2010)                    20
           Katimon and Hassan (1997)         1   Lopes et al. (2020)                  4    Bonsu and Masopeh (1996)               24
           El-Shafei et al. (1994)           1   Yasin and Yulnafatmawita (2018)      4    Bambra (2016)                          24
           Lopez et al. (2015)               1   Daniel et al. (2017)                 6    Verburg et al. (2001)                  26
           Kramarenko et al. (2019)          1   Arend (1941)                         7    Southard and Buol (1988)               27
           Zakaria (1992)                    1   Helbig et al. (2013)                 7    Chang (2010)                           30
           Ramli (1999)                      1   Gwenzi et al. (2011)                 7    Yao et al. (2013)                      33
           Singh et al. (2011)               1   Päivänen (1973)                      9    Becker et al. (2018)                   34
           Campbell et al. (1977)            1   Mahapatra and Jha (2019)             9    Baird et al. (2017)                    50
           Chief et al. (2008)               1   Amer et al. (2009)                   9    Keisling (1974)                        56
           Conedera et al. (2003)            1   Radcliffe et al. (1990)             10    Rahimy (2011)                          56
           Ebel et al. (2012)                1   Vogeler et al. (2019)               10    Hao et al. (2019)                      57
           Ferreira et al. (2005)            1   Singh et al. (2006)                 10    Kanemasu (1994)                        60
           Imeson et al. (1992)              1   Kelly et al. (2014)                 10    Tete-Mensah (1993)                     60
           Johansen et al. (2001)            1   Elnaggar (2017)                     11    Zhao et al. (2018)                     65
           Lamara and Derriche (2008)        1   Ganiyu et al. (2018)                12    Hinton (2016)                          77
           Parks and Cundy (1989)            1   Cisneros et al. (1999)              12    Vieira and Fernandes (2004)            86
           Ravi et al. (2017)                1   Niemeyer et al. (2014)              12    Houghton (2011)                        88
           Smettem and Ross (1992)           1   Sharratt (1990)                     14    Tian et al. (2017)                     91
           Boike et al. (1998)               2   Habecker et al. (1990)              14    Li et al. (2017)                      118
           Andrade (1971)                    2   Nielsen et al. (1973)               14    Forrest et al. (1985)                 118
           Beyer et al. (2015)               2   Robbins (1977)                      15    Richard and Lüscher (1983/87)         121
           Blake et al. (2010)               2   Sonneveld et al. (2005)             15    Sanzeni et al. (2013)                 127
           Bonell and Williams (1986)        2   Quinton et al. (2008)               16    Vereecken et al. (2017)               145
           Kutiel et al. (1995)              2   Simmons (2014)                      16    Coelho (1974)                         176
           Martin and Moody (2001)           2   Ouattara (1977)                     17    Kool et al. (1986)                    240
           Mott et al. (1979)                2   Hardie et al. (2011)                17    Nemes et al. (2001)                   283
           Rab (1996)                        2   Baird (1997)                        17    Ottoni et al. (2018)                  326
           Soracco et al. (2010)             2   Kirby et al. (2001)                 17    Rahmati et al. (2018)                3637
           Varela et al. (2015)              2   Yoon (2009)                         17    Grunwald (2020)                      6532
           Sayok et al. (2007)               3   Jabro (1992)                        18
           Abagandura et al. (2017)          3   Greenwood and Buttle (2014)         18

ticles > 50 µm), silt (2–50 µm), and clay fraction (< 2 µm)              Ksat values as a function of primary soil properties. In this
for the UNSODA database based on the available particle-                 application, PTFs for Ksat were built based on bulk density
size data, assuming a log-normal distribution, as described in           and sand and clay content. The observed correlation between
Nemes et al. (2001).                                                     these primary soil properties and Ksat motivated us to use key
   After data extraction from the literature, georefer-                  variables for the estimation of PTFs. Organic carbon (OC)
encing, and standardization (conversion of all val-                      was not used to build the PTFs because (i) this information
ues to the same units), all information was collected                    was missing for 15 % of measurements and (ii) the corre-
in tabulated form in the new database SoilKsatDB                         lation between OC and Ksat was poor (i.e., 0.005; Pearson
(https://doi.org/10.5281/zenodo.3752721). The database                   correlation coefficient). We derived two PTFs for Ksat :
consists of 23 columns (various sample properties) and
13 259 rows (a header and 13 258 samples). An excerpt of                   1. PTF for temperate regions. The map of Ksat locations
the database with all 23 columns is shown in Table 2.                         were overlaid on the Köppen–Geiger climate zone map
                                                                              (Rubel and Kottek, 2010; Hamel et al., 2017) and then
                                                                              divided the measurements based on climatic regions
2.4    Statistical modeling of Ksat
                                                                              (temperate, tropical, boreal, and arid) to account for
To show a possible application of the database, we computed                   differences in climate and related weathering processes
various PTFs. The PTF models were fitted using a random                       (Hodnett and Tomasella, 2002). A total of 8296 Ksat val-
forest (RF) machine learning algorithm (Breiman, 2001) in                     ues for measurements in temperate climate that contain
the R environment for statistical computing (R Core Team,                     information on sand, clay, and bulk density, were used
2013). We fitted the RF model for log-transformed (log10 )                    to develop the PTF. The dataset was randomly divided

Earth Syst. Sci. Data, 13, 1593–1612, 2021                                                 https://doi.org/10.5194/essd-13-1593-2021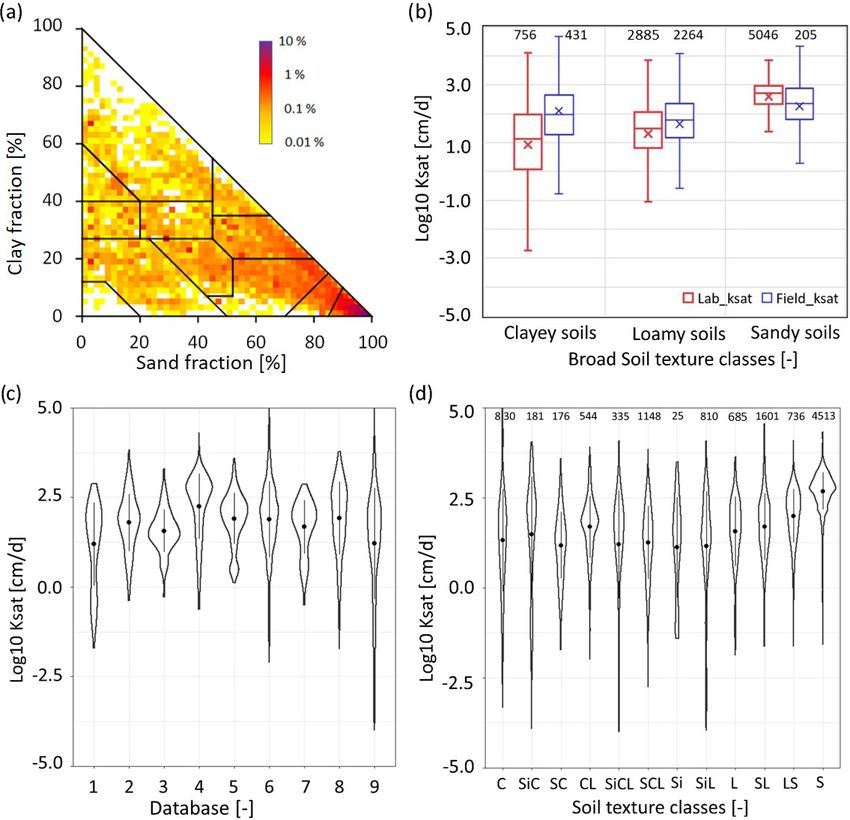
S. Gupta et al.: A compilation of soil saturated hydraulic conductivity measurements                                               1597

Figure 1. Spatial distribution of Ksat measurements based on (red) laboratory and (blue) field measurements in the SoilKsatDB. A total of
1908 locations are shown on the map.

     into a training (6637 samples, 80 %) and testing dataset          to test their ability to predict the result for the measurements
     (1659 samples, 20 %). PTFs for temperate regions in-              in the tropical climate (1111 Ksat measurements) and for field
     clude all depths of Ksat measurements (40 % Ksat val-             measurements (1998 Ksat measurements with information on
     ues from the top 0-20 cm of soil). In a validation step,          soil texture and bulk density information), respectively. The
     we applied the PTF determined for temperate regions               code for generating and testing the PTFs is provided in the
     to tropical regions. Compared to temperate regions, the           Supplement. ANOVA (analysis of variance) with post hoc
     tropics are affected by different soil formation processes        Tukey’s HSD (honestly significant difference) test (Hilton
     resulting in different clay mineral types. With such val-         and Armstrong, 2006; Abdi and Williams, 2010) was used to
     idation, we intend to discuss the transferability of PTFs         test the significant difference in Ksat between texture classes.
     across different regions.                                         The ANOVA test indicates that at least one group differs from
                                                                       the other groups but does not explain the patterns of differ-
  2. PTF for laboratory-based Ksat values. In a second ap-             ences between means. Then, the Tukey HSD test was used
     plication, the dataset (total 13 258) was divided into            to compute the significant difference between two means us-
     laboratory- and field-based Ksat values. A total of 9155          ing a statistical distribution as shown in the results in Ap-
     Ksat measurements belong to laboratory and 4131 Ksat              pendix A. This analysis was important to understand and
     measurements belong to field values. The laboratory               check whether Ksat values between soil texture classes are
     dataset (8491 Ksat measurements with information on               significantly different or not.
     soil texture and bulk density information) was used for              The relative importance of the covariates for modeling
     training (6793) and testing (1698) following the same             Ksat was assessed by the node impurity, which for RF re-
     method as used for the PTF for the temperate climate              gression problems is computed as the decrease of residual
     (i.e., 80 % for training and 20 % for testing). Lab-based         sum of squares (RSS) when a particular covariate splits the
     PTFs includes all depths of Ksat measurements (30 %               data at the nodes of a tree (Hastie et al., 2009, Sects. 10.13.1,
     Ksat values from the top 0-20 cm of soil). Similar to the         15.3.2). The variable that provides maximum decline in RSS
     application of the PTF from the temperate region for the          (and consequently increase in node purity) is considered the
     tropics, we apply the PTF deduced from laboratory data            most important variable; the variable with the second largest
     for prediction of Ksat measured in the field. We expect           RSS decrease is considered the second most important vari-
     differences because field measurements scan larger soil           able, and so on. Furthermore, the accuracy of the predictions
     volumes that may contain soil structural pores.                   was evaluated using bias, root mean square error (RMSE, in
The “ranger” package version 0.12.1 (Wright and Ziegler,               log-transformed Ksat measurement), and concordance corre-
2015) was used to build the PTFs. The PTFs developed for               lation coefficient (CCC) (Lawrence and Lin, 1989).
temperate regions and for laboratory data were then applied

https://doi.org/10.5194/essd-13-1593-2021                                              Earth Syst. Sci. Data, 13, 1593–1612, 2021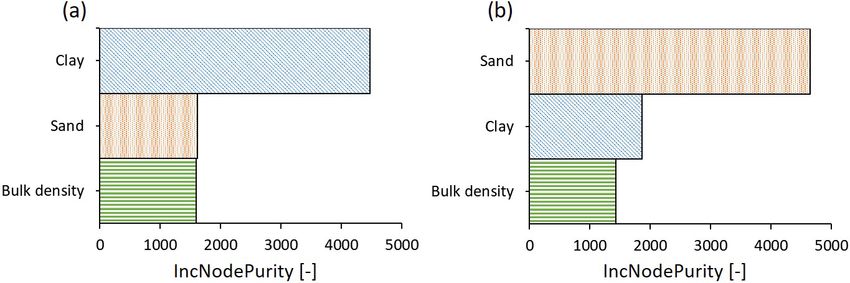
1598                                       S. Gupta et al.: A compilation of soil saturated hydraulic conductivity measurements

Table 2. (a) Description and units of some key variables listed in the database. The list can be found in the readme file (Table 1) and dataset
“sol_ksat.pnts_horizons” on Zenodo (https://doi.org.10.5281/zenodo.3752721). We used the same codes as in the National Cooperative Soil
Survey (NCSS) Soil Characterization Database (National Cooperative Soil Survey, 2016). (b) Example of Ksat database structure with key
variables (from left to right: unique ID, reference, longitude and latitude (decimal degree), minimum and maximum accuracy (m), top and
bottom of soil sample (cm), horizon designation, bulk density (g cm−3 ), moisture content at field capacity and wilting point (%), soil textural
class, clay, silt and sand content (%), soil organic carbon content (%), soil acidity, saturated hydraulic conductivity measured in lab or field
(cm d−1 ), source of the data, location id, and mean soil depth). NA is “no value”. Column names are explained in (a). The dataset file
“sol_ksat.pnts_horizons” can be found on Zenodo (https://doi.org.10.5281/zenodo.3752721).

                (a)
                Headers                                   Description                                          Units
                ID                                        Unique ID                                            –
                site_key                                  Dataset identifier                                   –
                longitude_decimal_degrees                 Ranges up to +180◦ down to −180◦                     Decimal degree
                latitude_decimal_degrees                  Ranges up to +90◦ down to −90◦                       Decimal degree
                location_accuracy_min                     Minimum value of location accuracy                   m
                location_accuracy_max                     Maximum value of location accuracy                   m
                hzn_top                                   Top of soil sample                                   cm
                hzn_bot                                   Bottom of soil sample                                cm
                hzn_desgn                                 Designation of soil horizon                          –
                db                                        Bulk density                                         g cm−3
                w3cld                                     Soil water content at 33 kPa (field capacity)        vol %
                w15l2                                     Soil water content at 1500 kPa (wilting point)       vol %
                tex_psda                                  Soil texture classes based on USDA                   –
                clay_tot_psa                              Mass of soil particles (< 0.002 mm)                  %
                silt_tot_psa                              Mass of soil particles (> 0.002 and < 0.05 mm)       %
                sand_tot_psa                              Mass of soil particle (> 0.05 and < 2 mm)            %
                oc_v                                      Soil organic carbon content                          %
                ph_h2o_v                                  Soil acidity                                         –
                Ksat_lab                                  Soil saturated hydraulic conductivity from lab       cm d−1
                Ksat_field                                Soil saturated hydraulic conductivity from field     cm d−1
                source_db                                 Source of the data                                   –
                location_id                               Combination of latitude and longitude                –
                hzn_depth                                 Mean depth of soil horizon                           –

  Bias and RMSE are defined as                                            3     Results
         n
         (ŷi − yi )
         X
bias =                                                           (1)      3.1    Data coverage of SoilKsatDB
     i=1
              n
       v
       u n
       uX (ŷi − yi )2                                                    Based on the literature search and data compilation, we have
RMSE = t               ,                                         (2)      assembled a total of 13 258 values of Ksat from 1908 loca-
           i=1
                     n                                                    tions (each location has a unique location_id). More-
                                                                          over, the database contains a total of 13 286 Ksat values be-
where y and b y are observed and predicted Ksat values, re-
                                                                          cause a few studies have reported both field and lab mea-
spectively, and n is the total number of cross-validation
                                                                          surements for the same location. Figure 1 shows the global
points.
                                                                          distribution of the sites used in this study. Most data originate
  The CCC is a measure of the agreement between observed
                                                                          from North America, followed by Europe, Asia, South Amer-
and predicted Ksat value and is computed as
                                                                          ica, Africa, and Australia. With respect to climatic regions,
              2 · ρ · σŷ · σy                                            10 093 Ksat measurements were taken in temperate regions
CCC =      2
                                  ,                              (3)      (8296 contained texture and bulk density information and
         σŷ + σy2 + (µŷ − µy )2
                                                                          were used to build PTFs) and 1443, 1106, 580, and 36 in trop-
where µŷ and µy are predicted and observed means, σŷ and                ical, arid, boreal, and polar regions, respectively, as shown
σy are predicted and observed variances, and ρ is the Pear-               in Fig. 2b. The points are often spatially clustered with the
son correlation coefficient between predicted and observed                biggest cluster of points (1103 locations with 6532 Ksat mea-
values. CCC is equal to 1 for a perfect model.                            surements) in Florida (Grunwald, 2020). The Ksat database

Earth Syst. Sci. Data, 13, 1593–1612, 2021                                                  https://doi.org/10.5194/essd-13-1593-2021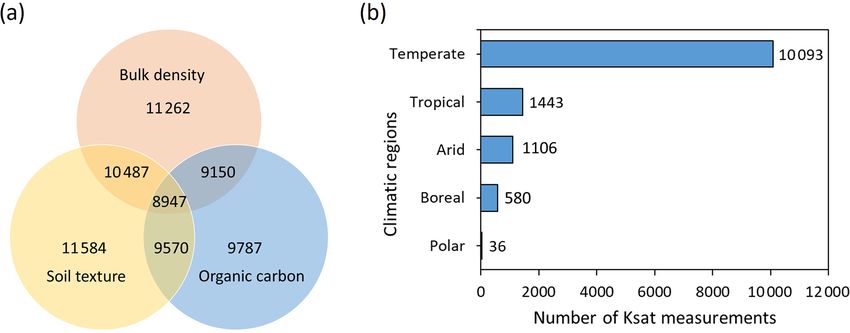
S. Gupta et al.: A compilation of soil saturated hydraulic conductivity measurements 1599
Table 3. Number of samples (N ) assigned to each spatial accuracy
depth
hzn_
7.5
7.5
7.5
7.5
7.5
7.5
7.5
7.5
7.5
7.5
class. NA are samples without information on spatial accuracy.
ID_ -109.99_31.71
ID_-110.13_31.73
ID_-110.09_31.72
ID_-110.09_31.69
ID_-110.05_31.74
ID_-110.04_31.72
ID_-110.04_31.69
ID_-110.02_31.67
ID_-110.01_31.72
ID_-110.00_31.72
location_ id
Minimum location error Maximum location error N
0m 100 m 9801
100 m 250 m 972
250 m 500 m 623
ETH_literature
ETH_literature
ETH_literature
ETH_literature
ETH_literature
ETH_literature
ETH_literature
ETH_literature
ETH_literature
ETH_literature
ksat_ ksat_ source_ db
500 m 1000 m 499
1000 m 5000 m 959
5000 m 10 000 m 263
10 000 m NA 141
field
102.96
111.36
133.44
26.40
27.84
21.60
23.76
39.12
63.36
9.84
Total 13 258
lab
NA
NA
NA
NA
NA
NA
NA
NA
NA
NA
h20_
ph_
includes 4131 values from field measurement and 9155 val-
NA
NA
NA
NA
NA
NA
NA
NA
NA
NA
v
ues from laboratory measurements. In particular, different
clay_ silt_ sand_ oc_
NA
NA
NA
NA
NA
NA
NA
NA
NA
NA
tot_ tot_ tot_ v
types of infiltrometers (e.g., Mini disc infiltrometer, Ten-
sion infiltrometer) and permeameters (e.g., Guelph perme-
psa
NA
NA
NA
NA
NA
NA
NA
NA
NA
NA
ameter, Aardvark permeameter) were used for the field mea-
surements, whereas constant or falling head methods were
psa
NA
NA
NA
NA
NA
NA
NA
NA
NA
NA
mainly used in laboratory analyses (Table 4).
Out of the 13 258 Ksat measurements, 11 584 had informa-
psa
NA
NA
NA
NA
NA
NA
NA
NA
NA
NA
tion on soil texture, 11 262 on bulk density, 9787 on organic
Sandy loam
Sandy loam
Sandy loam
Sandy loam
Sandy loam
carbon, 7382 on field capacity, and 7411 on wilting point,
w15l2 tex_
psda
Loam
Sand
Sand
Sand
Sand
while for 8994 measurements information for all basic soil
properties (bulk density, soil texture, and organic carbon) was
available (Fig. 2a).
NA
NA
NA
NA
NA
NA
NA
NA
NA
NA
The methods used to compute these soil proper-
w3cld
ties (as much as we could extract from the litera-
NA
NA
NA
NA
NA
NA
NA
NA
NA
NA
ture and existing databases) are listed in the CSV file
NA
NA
NA
NA
NA
NA
NA
NA
NA
NA
hzn_ db
sol_ksat.pnts_metadata_cl_pedo.csv available
desgn
at https://doi.org/10.5281/zenodo.3752721. Note that in ad-
NA
NA
NA
NA
NA
NA
NA
NA
NA
NA
dition to 11 584 soil texture values, 75 measurements have
soil texture information with total (sand + silt + clay) less
hzn_
bot
15
15
15
15
15
15
15
15
15
15
than 98 % or greater than 102 %. We did not use these val-
ues in the PTF development but included it in the database as
hzn_
top
0
0
0
0
0
0
0
0
0
0
“Error” class in the soil texture column.
location_
accuracy_
max
3.2 Statistical characteristics of SoilKsatDB
100
100
100
100
100
100
100
100
100
100
location_
accuracy_
The distribution of measurements based on soil texture
classes is shown on the USDA soil texture triangle in Fig. 3a.
min
The database covers all textural classes, with a high cluster-
0
0
0
0
0
0
0
0
0
0
ing in sandy soils due to the numerous samples from Florida
longitude_ latitude_
decimal_
degrees
(Grunwald, 2020), while only few measurements belong to
31.73
31.72
31.69
31.74
31.72
31.69
31.67
31.72
31.72
31.71
the silt textural class. The increase in Ksat values in clayey
and loamy soils for field methods (compared to laboratory
decimal_
methods) is likely due to the effect of soil structure. ANOVA
degrees
−110.13
−110.09
−110.09
−110.05
−110.04
−110.04
−110.02
−110.01
−110.00
−109.99
Table 2. Continued.
with post hoc Tukey’s HSD test showed that the mean val-
ues for all broad soil texture classes are significantly differ-
Becker_2018
Becker_2018
Becker_2018
Becker_2018
Becker_2018
Becker_2018
Becker_2018
Becker_2018
Becker_2018
Becker_2018
ent from each other, except for clayey soils field Ksat values
site_key
and sandy soils field Ksat values (see Table A1). The vio-
lin distribution plot in Fig. 3c shows the range of Ksat val-
ues for the different databases. Most of the datasets report
(b)
ID
10
1
2
3
4
5
6
7
8
9
https://doi.org/10.5194/essd-13-1593-2021 Earth Syst. Sci. Data, 13, 1593–1612, 20211600 S. Gupta et al.: A compilation of soil saturated hydraulic conductivity measurements
Table 4. Instruments and methods used to estimate Ksat . A key reference with further details is given for all methods. The field
methods are subdivided into different subcategories (in some cases, “ponding” in the field methods or “permeameter” in the lab
methods were listed in original studies without specification). Information on the applied method for each sample is provided in file
“sol_ksat.pnts_metadata_cl_pedo.csv” (https://doi.org/10.5281/zenodo.3752721).
Lab Ksat methods N Field Ksat methods N
Constant head method (Klute and Dirk- 8055 Single (Bagarello and Sgroi, 2004) 460
sen, 1986)
Falling head method (Klute, 1965) 765 Ring (N = 1282) Double (Bodhinayake et al., 2004) 625
Triaxial cell (ASTM D 5084) (Purdy 99 BEST (Lassabatere et al., 2006) 197
and Suryasasmita, 2006)
Pressure plate (Sharratt, 1990) 14 Mini Disc (Naik et al., 2019) 773
Oedometer test (ASTM D2435-96) 12 Tension (Reynolds et al., 2000) 720
(Sutejo et al., 2019)
Permeameter 10 Infiltrometer (N = 2207) Disc (Soracco et al., 2010) 551
Oedometer test (UNI CEN ISO/TS 9 Guelph (Gupta et al., 1993) 87
17892-5) (Terzaghi, 2004)
Hood (Schwärzel and Punzel, 2007) 41
Micro (Sepehrnia et al., 2016) 35
Guelph (Reynolds and Elrick, 1985) 153
Aardvark (Hinton, 2016) 142
Permeameter (N = 349) Disc (Mohanty et al., 1994) 27
Constant head (Amoozegar, 1989) 20
Philip–Dunne (Muñoz-Carpena et al., 2002) 7
Piezometer slug test (Baird et al., 2017) 72
Tensiometers (Nielsen et al., 1973) 70
Rainfall simulator (Gupta et al., 1993) 55
Others (N = 226) Steady infiltration (Scotter et al., 1982) 16
Ponding 8
Auger method (Mohsenipour and Shahid, 2016) 5
Unknown 191 Unknown 67
Total 9155 4131
Figure 2. Description of Ksat measurements. (a) Venn diagram illustrating the number of Ksat measurements in the SoilKsatDB for which
bulk density, soil texture, and soil organic carbon data were also available. Note that the size of the intersecting areas does not represent the
correct fractions. (b) Distribution of Ksat measurements among climatic regions.
Ksat values between 10−2 and 102.5 cm d−1 , with a wider the SWIG database (databases 9 and 6 in Fig. 3c, respec-
range of Ksat values observed in measurements from the- tively). Likewise, Fig. 3d shows the violin distribution of Ksat
ses and reports (including studies with extreme values from based on soil texture classes. The arithmetic mean of Ksat
sandy desert soils and low conductive clay soils) and from was highest for the sand and loamy sand soils (i.e., 2.68 and
Earth Syst. Sci. Data, 13, 1593–1612, 2021 https://doi.org/10.5194/essd-13-1593-2021S. Gupta et al.: A compilation of soil saturated hydraulic conductivity measurements 1601
Table 5. Mean values of soil hydrophysical properties for each soil textural class. The number of samples (N) is given in parentheses under
each soil variable for each soil texture classes. N values marked with ∗ correspond to undefined soil texture class. BD: bulk density (g cm−3 );
OC: soil organic carbon content (%); FC: moisture content at field capacity (vol %); WP: moisture content at wilting point (vol %); Ksatl and
Ksatf are laboratory and field Ksat (cm d−1 ), respectively. For Ksat , the geometric mean is reported (due to the sensitivity to a few extreme
values for the arithmetic mean). For all other properties the arithmetic mean is provided.
Texture Clay Silt Sand BD OC FC WP Ksatl Ksatf
classes (N ) (N ) (N) (N) (N ) (N) (N ) (N) (N)
56.3 23.6 20.0 1.27 2.00 43.2 30.0 8.22 110.07
Clay
(830) (830) (830) (639) (448) (447) (449) (499) (331)
45.2 45.1 9.6 1.18 3.83 49.9 30.2 3.63 196.65
Silty clay
(181) (181) (181) (175) (116) (46) (46) (85) (96)
39.3 8.1 52.5 1.52 0.23 34.7 23.4 14.16 –
Sandy clay
(176) (176) (176) (172) (140) (158) (158) (172) (4)
31.4 38.6 29.9 1.27 2.49 37.2 22.1 13.34 60.56
Clay loam
(544) (544) (544) (382) (360) (76) (76) (127) (417)
33.1 57.1 9.7 1.24 2.67 46.2 23.9 1.57 48.45
Silty clay loam
(335) (335) (335) (283) (227) (57) (56) (113) (222)
26.3 12.1 61.6 1.53 1.26 28.7 17.1 19.43 14.23
Sandy clay loam
(1148) (1148) (1148) (966) (950) (805) (759) (876) (272)
7.7 84.6 7.6 1.16 1.65 51.4 7.5 13.27 –
Silt
(25) (25) (25) (19) (11) (12) (11) (25)
15.2 66.8 17.9 1.34 3.65 35.2 15.6 5.87 44.63
Silt loam
(810) (810) (810) (618) (498) (148) (138) (447) (364)
19.0 39.1 41.7 1.29 2.16 32.07 14.2 45.62 34.21
Loam
(685) (685) (685) (593) (561) (94) (97) (219) (464)
13.5 16.8 69.7 1.49 1.33 24.2 11.0 39.71 74.57
Sandy loam
(1601) (1601) (1601) (1492) (1337) (806) (792) (1078) (523)
7.3 8.5 84.0 1.55 1.13 17.3 6.5 95.37 132.33
Loamy sand
(736) (736) (736) (711) (674) (582) (586) (637) (99)
2.2 3.1 94.6 1.51 0.62 8.2 2.5 488.46 209.55
Sand
(4513) (4513) (4513) (4437) (4179) (4063) (4062) (4409) (106)
Total 11 584 11 584 11 584 10 487 9501 7294 7229 8687 2900
(17∗ ) (0∗ ) (38∗ ) (775∗ ) (286∗ ) (88∗ ) (182∗ ) (468∗ ) (1,231∗ )
1.99, respectively, in log10 cm d−1 ), while the lowest mean texture class, much lower Ksat values were observed for
values were found for silt and silty loam (i.e., 1.12 and 1.15, laboratory (mean Ksat ≈ 8 cm d−1 ) compared to field (mean
respectively, in log10 cm d−1 ). Table A2 shows that the Ksat Ksat ≈ 110 cm d−1 ) measurements (Table 5). Figure 3b fur-
values in sand and loamy sand soil texture classes are signif- ther illustrates the higher range of Ksat values obtained for
icantly different from all other soil texture classes. However, finer texture soils (clay and loam) compared to coarser soils
silt, silty clay, and silty clay loam classes are not significantly (sand).
different from clay, sandy clay, and sandy clay loam Ksat val-
ues.
Average values of Ksat and other hydrophysical proper- 3.3 Ksat PTFs derivation
ties are shown in Table 5. Higher average organic carbon
and bulk density values were observed in clayey and loamy As a test application of SoilKsatDB, two PTFs were de-
soils compared to sandy soils. Ksat values obtained from rived for Ksat (i.e., for measurements taken in temperate re-
field measurements were on average higher than those ob- gions and based on laboratory measurements) using basic
tained from laboratory Ksat values. Particularly for the clay soil properties as covariates. General trends between Ksat and
soil properties are shown in partial correlation plots in Fig. 4.
https://doi.org/10.5194/essd-13-1593-2021 Earth Syst. Sci. Data, 13, 1593–1612, 20211602 S. Gupta et al.: A compilation of soil saturated hydraulic conductivity measurements
Figure 3. Characterization of collected Ksat values: (a) distribution of soil samples on the USDA soil texture triangle, (b) distribution of
Ksat values using broad soil texture classes (sandy soils: sand and loamy sand; loamy soils: sandy loam, loam, silt loam, silt, clay loam, and
sandy clay loam; clayey soils: sandy clay, silty clay, and clay) based on laboratory and field measurements (the number of measurements is
shown on the top of the figure). Panel (c) shows the range of Ksat values spanned by each data source. The database numbers 1–9 refer to
different sources and databases. 1: Australia (Forrest et al., 1985), 2: Belgium (Vereecken et al., 2017), 3: China (Tian et al., 2017; Li et al.,
2017), 4: Florida (Grunwald, 2020), 5: HYBRAS (Ottoni et al., 2018), 6: SWIG (Rahmati et al., 2018), 7: Tibetan Plateau (Zhao et al., 2018),
8: UNSODA (Nemes et al., 2001), 9: all other databases in Table 1. (d) Distribution of Ksat based on soil textural classes with the number
of measurements shown on the top of the figure. In the violin diagrams (c, d), the dot represents the mean value and the line represents the
standard deviation for each dataset.
The figure indicates that Ksat decreases with clay content and RMSE values were, respectively, equal to 0.49, −0.2, and
bulk density, and increases with sand content. 0.94 for tropical Ksat values, and to 0.10, −0.22, and 1.2 for
Figure A1 shows the list of relative importance of the co- field measured Ksat values.
variates to build PTFs for the measurements from temper-
ate regions and laboratory-based measurements. Clay con-
tent was found to be the most important variable followed 4 Discussion
by sand and bulk density for the temperate climate PTF. On
the other hand, sand content was the most important variable 4.1 Laboratory vs. field estimated Ksat : effect of soil
followed by clay and bulk density for the laboratory-based structure
Ksat PTF. CCC, bias, and RMSE were, respectively, equal
The Ksat values were, on average, higher for the field mea-
to 0.74, −0.006, and 0.64, for the temperate-based PTF, and
surements compared to laboratory measurements for most
0.72, −0.02, and 0.66 for laboratory-based PTF.
soil texture classes (Table 5 and Figs. 3b and 5). The dif-
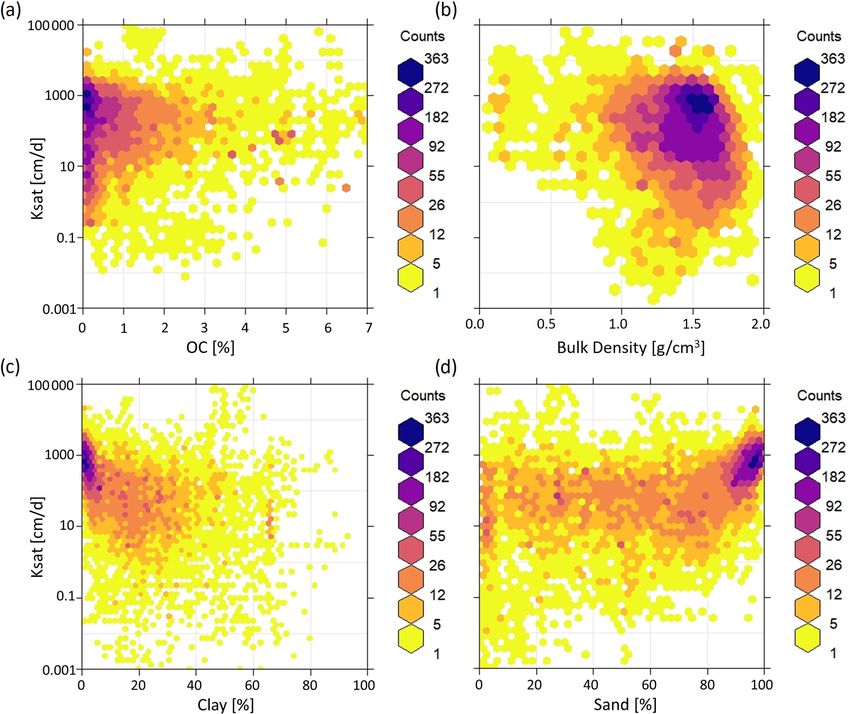
As we will discuss in more detail in the next section, PTF
ference in laboratory and field-based Ksat values and larger
models derived for temperate and laboratory-based Ksat val-
range of Ksat values for fine textured soil is probably related
ues underestimated Ksat for tropical- and field-based Ksat
to the effect of biologically induced soil structure that might
values, respectively (see Figs. 6b and 5b). CCC, bias, and
be neglected in laboratory measurements. The omission of
Earth Syst. Sci. Data, 13, 1593–1612, 2021 https://doi.org/10.5194/essd-13-1593-2021S. Gupta et al.: A compilation of soil saturated hydraulic conductivity measurements 1603 Figure 4. Partial correlation between Ksat and (a) soil organic carbon OC (%), (b) bulk density (g cm−3 ), (c) clay (%), and (d) sand content (%) as heat maps. Ksat decreases with increasing clay content and bulk density, and increases with sand content. The color of each hexagonal cell shows the number of the measurements in each cell. Figure 5. The correlation between observed and predicted Ksat values obtained from random forest (RF) models. The RF-based pedotransfer function (PTF) model was fitted using data for laboratory measurements of Ksat and tested on both laboratory (a) and field (b) measure- ments. Results showed reasonable agreement (CCC = 0.72) using RF algorithms for laboratory measurements, but low CCC (0.10) for field measurements. PTFs developed based on laboratory measurements do not provide accurate estimates of Ksat measured in the field. soil structures in many laboratory samples limits the possi- distribution and subsequently affect Ksat values (Tuller and bility to properly reproduce field observations that are likely Or, 2002). Such an effect is more likely to be neglected in to be more affected by the presence of biopores (Fatichi et al., laboratory measurements rather than in field studies due to 2020) and other soil structural characteristics, such a cracks. the small size of most laboratory samples. Presence or ab- In other words, variability in the Ksat values depends on the sence of large structural pores depends on the scale of mea- consideration (and existence) of soil structure by the mea- surements (that is usually larger in the field). Mohanty et al. surement methods. Soil structural pores change the pore size (1994), for example, compared three field methods and one https://doi.org/10.5194/essd-13-1593-2021 Earth Syst. Sci. Data, 13, 1593–1612, 2021
1604                                      S. Gupta et al.: A compilation of soil saturated hydraulic conductivity measurements

Figure 6. Correlation between observed and predicted Ksat values obtained from the random forest (RF) model. The RF-based pedotransfer
function (PTF) model was obtained by fitting 6637 training points measured in a temperate climate and tested on (a) data from temperate
climate (1659 measurements) and (b) data from tropical areas (1111 measurements). PTFs showed good performance (CCC = 0.74) for the
measurements taken in the temperate climate (including both laboratory and field measurements), but lower CCC values were obtained for
tropical soil measurements (0.49 for RF). PTFs determined for temperate regions cannot be easily transferred to tropical regions because of
the different soil forming processes.

laboratory method and found that the sample size affects                tain water within internal structures with very low hydraulic
the measurement of Ksat due to the presence and absence                 conductivity. Therefore, such a difference in clay mineral-
of open-ended pores. Similarly, Ghanbarian et al. (2017)                ogy is likely responsible for the underestimation of Ksat in
showed that the sample dimensions (e.g., internal diameter              tropical soils from PTFs based on measurements in temper-
and height) also impact Ksat . The authors further developed            ate areas. In addition, soil structure formation processes may
a sample dimension-dependent PTF, which performed better                be different in tropical and temperate regions (perennial ac-
than other PTFs available in the literature. Likewise, Braud            tivities of vegetation in the tropics), which would also lead
et al. (2017) used three field methods for Ksat measurements            to differences between measured Ksat values for the two cli-
and found significant variation between these measurement               matic regions.
methods. Davis et al. (1996) also highlighted the necessity
to choose the most appropriate scale of measurement for a
particular soil sample when undertaking conductivity mea-               4.3   Limitations of SoilKsatDB
surements. They tested small cores (73 mm wide and 63 mm
high) and large cores (223 mm wide and 300 mm high) us-                 We put an effort to combine laboratory and field data from
ing the constant head method in the laboratory and found a              across the globe. However, we acknowledge that there are
difference of 1 to 3 orders of magnitude.                               still gaps in some regions, such as Russia and higher north-
                                                                        ern latitudes in general, which may result in uncertainties in
                                                                        Ksat estimates in such regions. The SoilKsatDB could also be
4.2    Temperate vs. tropical soils: effect of soil formation           of limited use for fine-resolution applications because many
       processes                                                        data points were characterized by limited spatial accuracy
                                                                        and missing soil depth information. Specifically, the spatial
PTFs obtained for temperate soils performed poorly for                  accuracy of many points is between tens of meters and sev-
tropical soils (Fig. 6), with Ksat being underestimated by              eral kilometers (see the methodology sections regarding the
the temperate-based PTFs. This result is in agreement with              extraction of the spatial locations using Google Earth). Many
Tomasella et al. (2000) who derived PTFs using data from                of the records in the SoilKsatDB come from legacy scien-
tropical Brazilian soils, which did not properly capture obser-         tific reports and the original authors could not be traced and
vations in temperate soils. We argue that the significant dif-          contacted, hence we advise to use these data with caution.
ferences for tropical and temperate soils are due to the differ-        In addition, in the SWIG database, the soil depth and mea-
ences in the soil-forming processes that also define the clay           surement method information were not provided, and often
type and mineralogy. In fact, Oxisols (highly weathered clay            one location was used to represent an entire watershed. We
soils as a result of high rainfall and temperature in tropical re-      tried to revisit each publication and extract the most accu-
gions) are characterized by inactive (non-swelling) clay min-           rate coordinates of assumed sampling locations. In addition,
erals. In contrast to tropical soils, active (smectite) and mod-        we assumed that most of the samples were obtained from
erately active clay minerals (illite) are the dominant clay min-        field measurements as authors used different infiltrometers
erals in temperate regions. These swelling clay minerals re-            to compute Ksat , so there might be a few points in our SoilK-

Earth Syst. Sci. Data, 13, 1593–1612, 2021                                               https://doi.org/10.5194/essd-13-1593-2021
S. Gupta et al.: A compilation of soil saturated hydraulic conductivity measurements 1605
satDB that belong to laboratory measurements and that we 6 Summary and conclusions
have incorrectly assigned to field measurements. Moreover,
the field measurements in the database are a mix of many We compiled a comprehensive global dataset of Ksat mea-
Ksat measurement methods. surements (N = 13 258) by importing, quality controlling,
For each measurement, a location accuracy (0– and standardizing tabular data from existing soil profile
100 m = highly accurate, > 10 000 m = least accurate) databases and legacy reports, as well as the scientific liter-
was assigned based on the sampling location accuracy. The ature. The SoilKsatDB covers a broad range of soil types
location accuracy can be used as a weight or probability ar- and climatic regions and hence is useful in global models. A
gument in machine learning for Ksat mapping. We are aware larger variation in Ksat values was observed for fine-textured
that this was a rather subjective decision; a more objective soils compared to coarse-textured soils, indicating the effect
way to assign weights would be to use the actual spatial of soil structure on Ksat . Moreover, Ksat values obtained from
positioning errors. Because these were not available for most field measurements were generally higher than those from
of the datasets, we have opted for the definition of a location laboratory measurements, likely due to the impact of soil
accuracy estimated from the available documentation. structural pores in field measurements.
The new database was used to develop PTFs using RF al-
4.4 Further developments gorithms for Ksat values obtained for temperate climates and
for laboratory measurements. PTFs developed for a certain
The advancement in remote sensing technology opens the climatic region (temperate) or measurement method (labora-
doors to link the hydraulic properties with global environ- tory) could not be satisfactorily applied to estimate Ksat for
mental data. Satellite-based maps of environmental charac- other regions (tropical) or measurement method (field) due
teristics such as local information on vegetation, climate, and to the role of different soil forming processes (inactive clay
topography for specific areas, which are often ignored by ba- minerals in tropical soils and impact of biopores in field mea-
sic PTFs, can be incorporated. For example, Sharma et al. surements).
(2006) developed PTFs using environmental variables such There are still some gaps in the geographical representa-
as topography and vegetation and concluded that these at- tion of the data, especially in Russia and the higher northern
tributes, at fine spatial scales, were useful to capture the ob- latitudes, that could induce uncertainty in global modeling.
served variations within the soil mapping units. Likewise, Therefore, the dataset can be further improved by covering
Szabó et al. (2019) used a random forest machine learning the missing areas thus allowing better accuracy in modeling
algorithm for mapping soil hydraulic properties and incor- applications.
porated local environmental information such as vegetation, The SoilKsatDB was developed in R software and is avail-
climate, and topography. able via https://doi.org/10.5281/zenodo.3752721. We have
made the code and data publicly available to enable further
5 Data availability developments and improvements.
All collected data and related soil characteristics are
provided online for reference and are available at
https://doi.org/10.5281/zenodo.3752721 (Gupta et al., 2020).
Please note that our zenodo collection of files contains more
than is described in the paper.
https://doi.org/10.5194/essd-13-1593-2021 Earth Syst. Sci. Data, 13, 1593–1612, 20211606 S. Gupta et al.: A compilation of soil saturated hydraulic conductivity measurements
Appendix A
Table A1. Listed p values under 95 percent confidence interval for each class to show the significant difference in Ksat between texture
classes (see Fig. 3b). The significant difference was computed using ANOVA (analysis of variance) with post hoc Tukey’s HSD (honestly
significant difference). The values in bold show the significant difference in Ksat between two soil texture classes.
Broad soil texture Lab loamy Lab sandy Lab clayey Field loamy Field sandy Field clayey
classes soils soils soils soils soils soils
Lab loamy soils 1 < 0.05 < 0.05 < 0.05 < 0.05 < 0.05
Lab sandy soils < 0.05 1 < 0.05 < 0.05 < 0.05 < 0.05
Lab clayey soils < 0.05 < 0.05 1 < 0.05 < 0.05 < 0.05
Field loamy soils < 0.05 < 0.05 < 0.05 1 < 0.05 < 0.05
Field sandy soils < 0.05 < 0.05 < 0.05 < 0.05 1 0.1
Field clayey soils < 0.05 < 0.05 < 0.05 < 0.05 0.1 1
Table A2. Listed p values under 95 % confidence interval for each class to show the significant difference in Ksat between texture classes
for Fig. 3d. The significant difference was computed using ANOVA (analysis of variance) with post hoc Tukey’s HSD (honestly significant
difference) test. The values in bold show the significant difference in Ksat between two soil texture classes.
Texture classes C SiC SC CL SiCL SCL Si SiL L SL LS S
C 1 0.4 < 0.05 < 0.05 0.1 0.06 0.4 < 0.05 < 0.05 < 0.05 < 0.05 < 0.05
SiC 0.4 1 < 0.05 0.1 0.06 0.06 0.2 < 0.05 0.5 0.09 < 0.05 < 0.05
SC < 0.05 < 0.05 1 < 0.05 0.8 0.3 0.8 0.8 < 0.05 < 0.05 < 0.05 < 0.05
CL < 0.05 0.1 < 0.05 1 < 0.05 < 0.05 0.051 < 0.05 < 0.05 0.9 < 0.05 < 0.05
SiCL 0.1 0.06 0.8 < 0.05 1 0.6 0.7 0.6 < 0.05 < 0.05 < 0.05 < 0.05
SCL 0.06 0.06 0.3 < 0.05 0.6 1 0.6 0.1 < 0.05 < 0.05 < 0.05 < 0.05
Si 0.4 0.2 0.8 0.051 0.8 0.6 1 0.9 0.1 0.051 < 0.05 < 0.05
SiL < 0.05 < 0.05 0.8 < 0.05 0.6 0.1 0.9 1 < 0.05 < 0.05 < 0.05 < 0.05
L < 0.05 0.5 < 0.05 < 0.05 < 0.05 < 0.05 0.1 < 0.05 1 < 0.05 < 0.05 < 0.05
SL < 0.05 0.09 < 0.05 0.9 < 0.05 < 0.05 0.051 < 0.05 < 0.05 1 < 0.05 < 0.05
LS < 0.05 < 0.05 < 0.05 < 0.05 < 0.05 < 0.05 < 0.05 < 0.05 < 0.05 < 0.05 1 < 0.05
S < 0.05 < 0.05 < 0.05 < 0.05 < 0.05 < 0.05 < 0.05 < 0.05 < 0.05 < 0.05 < 0.05 1
Figure A1. Importance of the variables for developing the PTFs for Ksat using the random forest algorithm. The x axis displays the average
increase in node purity (the larger the value, the more important a covariate). (a) Clay content was the most important variable followed by
sand and bulk density for the random forest model built on data from temperate regions. (b) Sand content was the most important variable
followed by clay and bulk density for the random forest model based on laboratory measurements.
Earth Syst. Sci. Data, 13, 1593–1612, 2021 https://doi.org/10.5194/essd-13-1593-2021S. Gupta et al.: A compilation of soil saturated hydraulic conductivity measurements 1607
Supplement. The supplement related to this article is available Andrade, R. B.: The influence of bulk density on the hydraulic con-
online at: https://doi.org/10.5194/essd-13-1593-2021-supplement. ductivity and water content-matric suction relation of two soils,
PhD thesis, Utah State University, 1971.
Arend, J. L.: Infiltration rates of forest soils in the Missouri Ozarks
Author contributions. SG processed the data and assembled the as affected by woods burning and litter removal, J. For., 39, 726–
database. SG and TH performed the data analyses. SG wrote the first 728, 1941.
draft of the manuscript. TH, PL, SB, and DO edited the manuscript. Bagarello, V. and Sgroi, A.: Using the single-ring infiltrometer
SG revised the manuscript and PL, SB, and DO made significant method to detect temporal changes in surface soil field-saturated
contributions to the data interpretation. TH, PL, SB, and DO read hydraulic conductivity, Soil Till. Res., 76, 13–24, 2004.
and approved the final version of the manuscript. DO supervised the Baird, A. J.: Field estimation of macropore functioning and surface
study. hydraulic conductivity in a fen peat, Hydrol. Process., 11, 287–
295, 1997.
Baird, A. J., Low, R., Young, D., Swindles, G. T., Lopez, O. R.,
Competing interests. The authors declare that they have no con- and Page, S.: High permeability explains the vulnerability of the
flict of interest. carbon store in drained tropical peatlands, Geophys. Res. Lett.,
44, 1333–1339, 2017.
Bambra, A.: Soil loss estimation in experimental orchard at Nauni
in Solan district of Himachal Pradesh, PhD thesis, Yashwant
Acknowledgements. The SoilKsatDB is a compilation of numer-
Singh Parmar, University of horticulture and forestry, Solan
ous existing datasets from which the most significant are: SWIG
(Nauni) HP, 2016.
dataset (Rahmati et al., 2018), UNSODA (Leij et al., 1996; Nemes
Batjes, N. H.: Total carbon and nitrogen in the soils of the world,
et al., 2001), and HYBRAS (Ottoni et al., 2018). The study was sup-
Eur. J. Soil Sci., 47, 151–163, 1996.
ported by ETH Zurich (Grant ETH-18 18-1). OpenGeoHub main-
Becker, R., Gebremichael, M., and Märker, M.: Impact of soil sur-
tains a global repository of Earth System Science datasets at http:
face and subsurface properties on soil saturated hydraulic con-
//www.openlandmap.org (last access: 25 March 2021). We thank
ductivity in the semi-arid Walnut Gulch Experimental Water-
Zhongwang Wei for helping us collect the datasets and for insight-
shed, Arizona, USA, Geoderma, 322, 112–120, 2018.
ful discussions. We acknowledge Samuel Bickel (ETH Zurich) for
Beyer, M., Gaj, M., Hamutoko, J. T., Koeniger, P., Wanke, H., and
the help with high performance computing. We would also like to
Himmelsbach, T.: Estimation of groundwater recharge via deu-
thank two anonymous reviewers, Attila Nemes, and Sibylle K. Has-
terium labelling in the semi-arid Cuvelai-Etosha Basin, Namibia,
sler (topical editor) for their constructive feedback to improve the
Isot. Environ. Healt. S., 51, 533–552, 2015.
manuscript.
Bhattacharyya, R., Prakash, V., Kundu, S., and Gupta, H.: Effect
of tillage and crop rotations on pore size distribution and soil
hydraulic conductivity in sandy clay loam soil of the Indian Hi-
Financial support. This research has been supported by the ETH malayas, Soil Till. Res., 86, 129–140, 2006.
Zurich (grant no. ETH-18 18-1). Blake, W. H., Theocharopoulos, S. P., Skoulikidis, N., Clark, P.,
Tountas, P., Hartley, R., and Amaxidis, Y.: Wildfire impacts on
hillslope sediment and phosphorus yields, J. Soils Sed., 10, 671–
Review statement. This paper was edited by Sibylle K. Hassler 682, 2010.
and reviewed by two anonymous referees. Bodhinayake, W., Si, B. C., and Noborio, K.: Determination of hy-
draulic properties in sloping landscapes from tension and double-
ring infiltrometers, Vadose Zone J., 3, 964–970, 2004.
Boike, J., Roth, K., and Overduin, P. P.: Thermal and hydrologic
dynamics of the active layer at a continuous permafrost site
References (Taymyr Peninsula, Siberia), Water Resour. Res., 34, 355–363,
1998.
Abagandura, G. O., Nasr, G. E.-D. M., and Moumen, N. M.: Influ- Bonell, M. and Williams, J.: The two parameters of the Philip in-
ence of tillage practices on soil physical properties and growth filtration equation: their properties and spatial and temporal het-
and yield of maize in jabal al akhdar, Libya, Open Journal of erogeneity in a red earth of tropical semi-arid Queensland, J. Hy-
Soil Science, 7, 118–132, 2017. drol., 87, 9–31, 1986.
Abdi, H. and Williams, L. J.: Tukey’s honestly significant difference Bonsu, M. and Masopeh, B.: Saturated hydraulic conductivity val-
(HSD) test, Encyclopedia of research design, 3, 583–585, 2010. ues of some forest soils of Ghana determined by a simple
Amer, A.-M. M., Logsdon, S. D., and Davis, D.: Prediction of hy- method, Ghana Journal of Agricultural Science, 29, 75–80, 1996.
draulic conductivity as related to pore size distribution in unsat- Braud, I., Desprats, J.-F., Ayral, P.-A., Bouvier, C., and Vander-
urated soils, Soil Sci., 174, 508–515, 2009. vaere, J.-P.: Mapping topsoil field-saturated hydraulic conductiv-
Amoozegar, A.: A compact constant-head permeameter for measur- ity from point measurements using different methods, J. Hydrol.
ing saturated hydraulic conductivity of the vadose zone, Soil Sci. Hydromech., 65, 264–275, 2017.
Soc. Am. J., 53, 1356–1361, 1989. Breiman, L.: Random forests, Machine Learn., 45, 5–32, 2001.
Amoozegar, A. and Warrick, A.: Hydraulic conductivity of satu- Bruand, A., Duval, O., and Cousin, I.: Estimation des propriétés de
rated soils: field methods, Methods of Soil Analysis: Part 1, 5, rétention en eau des sols à partir de la base de données SOLHY-
735–770, 1986.
https://doi.org/10.5194/essd-13-1593-2021 Earth Syst. Sci. Data, 13, 1593–1612, 2021You can also read