Harmonization and Annotation of Single-cell Transcriptomics data with Deep Generative Models - bioRxiv
←
→
Page content transcription
If your browser does not render page correctly, please read the page content below
bioRxiv preprint first posted online Jan. 29, 2019; doi: http://dx.doi.org/10.1101/532895. The copyright holder for this preprint
 (which was not peer-reviewed) is the author/funder, who has granted bioRxiv a license to display the preprint in perpetuity.
                              It is made available under a CC-BY-NC-ND 4.0 International license.

                      Harmonization and Annotation of Single-cell
                   Transcriptomics data with Deep Generative Models
                              Chenling Xu∗1 , Romain Lopez∗2 , Edouard Mehlman∗2,3 ,
                              Jeffrey Regier2 , Michael I. Jordan2,4 & Nir Yosef†,1,2,5,6
                                                1
                                                    Center for Computational Biology
                                                    University of California, Berkeley
                        2
                            Department of Electrical Engineering and Computer Sciences
                                        University of California, Berkeley
                                            3
                                                Centre de Mathématiques Appliquées
                                                  Ecole polytechnique, Palaiseau
                                                        4
                                                        Department of Statistics
                                                    University of California, Berkeley
                                      5
                                          Ragon Institute of MGH, MIT and Harvard
                                            6
                                                Chan-Zuckerberg Biohub Investigator
                                  ∗
                                      These authors contributed equally to this work.

                        † Corresponding author. Email: niryosef@berkeley.edu (N.Y.).

                                                                 Abstract
                     As single-cell transcriptomics becomes a mainstream technology, the natural next step is
                 to integrate the accumulating data in order to achieve a common ontology of cell types and
                 states. However, owing to various nuisance factors of variation, it is not straightforward how
                 to compare gene expression levels across data sets and how to automatically assign cell type
                 labels in a new data set based on existing annotations. In this manuscript, we demonstrate
                 that our previously developed method, scVI, provides an effective and fully probabilistic
                 approach for joint representation and analysis of cohorts of single-cell RNA-seq data sets,
                 while accounting for uncertainty caused by biological and measurement noise. We also
                 introduce single-cell ANnotation using Variational Inference (scANVI), a semi-supervised
                 variant of scVI designed to leverage any available cell state annotations — for instance
                 when only one data set in a cohort is annotated, or when only a few cells in a single data
                 set can be labeled using marker genes. We demonstrate that scVI and scANVI compare
                 favorably to the existing methods for data integration and cell state annotation in terms of
                 accuracy, scalability, and adaptability to challenging settings such as a hierarchical structure
                 of cell state labels. We further show that different from existing methods, scVI and scANVI
                 represent the integrated datasets with a single generative model that can be directly used
                 for any probabilistic decision making task, using differential expression as our case study.
                 scVI and scANVI are available as open source software and can be readily used to facilitate
                 cell state annotation and help ensure consistency and reproducibility across studies.

                                                                       1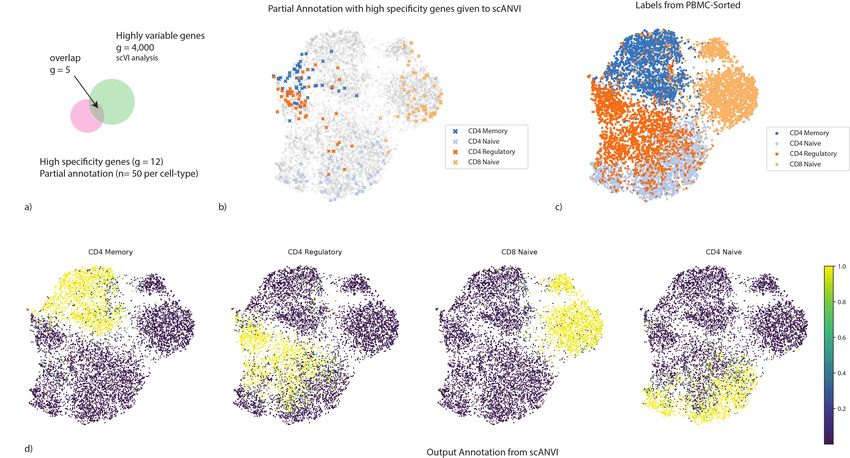
bioRxiv preprint first posted online Jan. 29, 2019; doi: http://dx.doi.org/10.1101/532895. The copyright holder for this preprint
 (which was not peer-reviewed) is the author/funder, who has granted bioRxiv a license to display the preprint in perpetuity.
                              It is made available under a CC-BY-NC-ND 4.0 International license.

          Introduction
          Recent technological improvements in microfluidics and low volume sample handling [1] have en-
          abled the emergence of single-cell transcriptomics [2, 3] as a popular tool for analyzing biological
          systems [4, 5, 6]. This growing popularity along with a continued increase in the scale of the re-
          spective assays [7] has resulted in massive amounts of publicly available data and motivated large
          scale community efforts such as the Human Cell Atlas [8], Tabula Muris [9] and the BRAIN Ini-
          tiative Cell Census Network [10]. The next natural step in the evolution of this field is therefore
          to integrate many available datasets from related tissues or disease models in order to increase
          statistical robustness [11], achieve consistency and reproducibility among studies [12, 13], and
          ultimately converge to a common ontology of cell states and types [8, 14].
              A fundamental step toward the ideal of a common ontology is data harmonization, namely in-
          tegration of two or more transcriptomics datasets into a single dataset on which any downstream
          analysis can be applied. We use the term harmonization rather than batch effect correction in
          order to emphasize that the input datasets may come from very different sources (e.g., tech-
          nology, laboratory), and from samples with a different composition of cell types. A wide range
          of methods have already been developed for this fundamental problem, initially for Microarrays
          and later on for bulk RNA sequencing, such as ComBat [15] and limma [16] which rely on gen-
          eralized linear models with empirical Bayes shrinkage to avoid over-correction. More recently,
          similar methods have been proposed specifically for single-cell RNA sequencing (scRNA-seq),
          such as ZINB-WaVE [17], which explicitly accounts for the overabundance of zero entries in the
          data. However, because of their linear assumptions, these approaches may not be appropriate
          when provided with a heterogeneous sample that includes different cell states, each of which
          may be associated with a different sample-to-sample bias [12]. With these limitations in mind,
          the next generation of methods turned to non-linear strategies. Broadly speaking, each of these
          methods includes a combination of two components: (i) joint factorization of the input matrices
          (each corresponding to a different dataset) to learn a joint low-dimensional latent representation.
          This is usually done with well established numerical methods, such as integrative non-negative
          matrix factorization (LIGER [18]), singular value decomposition (Scanorama [19]), or canonical
          correlation analysis (Seurat Alignment [13]); (ii) additional non-linear transformation of the re-
          sulting latent representations so as to optimally “align” them onto each other. This is usually
          done using heuristics, such as alignment of mutual nearest neighbors (MNN [12], Scanorama [19]
          and Seurat Anchors [20]), dynamic time warping (Seurat Alignment [13]) or quantile normaliza-
          tion (LIGER [18]). While this family of methods has been shown to effectively overlay different
          datasets, it suffers from two important limitations. First, an explicit alignment procedure may be
          difficult to tune in a principled manner and consequently result in over-normalization, especially
          in challenging cases where the cell type composition is different between datasets and when tech-
          nical differences between samples are confounded with biological differences of interest. Second,
          the alignment is done in an ad hoc manner and lacks probabilistic interpretability. Consequently,
          the resulting harmonized dataset is of limited use and cannot be directly applied for differential
          expression and other probabilistic decision-making tasks.
              Another recent line of work makes use of neural networks to learn a joint representation of
          multiple datasets (SAUCIE [21]) or project one dataset into another (maximum mean discrepancy
          [MMD] ResNet [22]). These methods rely on an explicit non-parametric measure of discrepancy
          between probability distributions (MMD) to match either the latent spaces or directly the gene
          expression values from pairs of datasets. However, using the MMD with a universal kernel
          explicitly assumes that the cell type proportion is similar in all the datasets, which may be less
          suitable in the general case of data harmonization.
              Besides harmonization, another important and highly related problem is that of automated
          annotation of cell state. In principle, there are two ways to approach this problem. The first
          is ab initio labeling of cells based on marker genes or gene signatures [13, 23, 24]. While this
          approach is intuitive and straightforward, its performance may be affected in the plausible case
          where marker genes are absent due to limitations in sensitivity. The second approach is to
          “transfer” annotations between datasets. In the simplest scenario, we have access to one dataset
          where states have been annotated either ab initio, or using additional experimental measurements
          (e.g., protein expression [3, 25] or lineage tracing [26]) and another, unannotated dataset from
          a similar condition or tissue. The goal is to use the labeled data to derive similar annotations
          for the second dataset, whenever applicable. This task is often complicated by factors such as

                                                                       2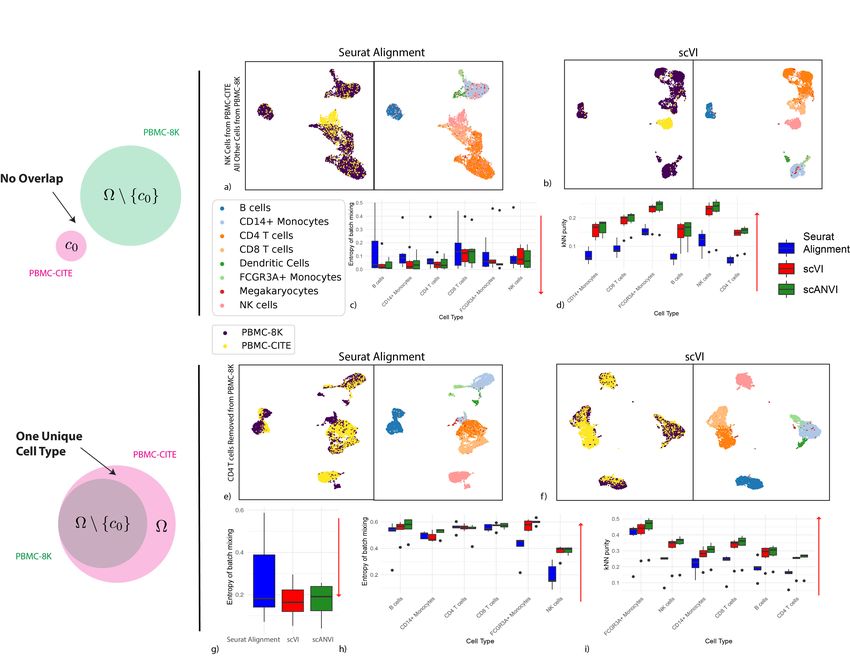
bioRxiv preprint first posted online Jan. 29, 2019; doi: http://dx.doi.org/10.1101/532895. The copyright holder for this preprint
 (which was not peer-reviewed) is the author/funder, who has granted bioRxiv a license to display the preprint in perpetuity.
                              It is made available under a CC-BY-NC-ND 4.0 International license.

          differences in technology (e.g., using Smart-Seq2 data to annotate 10x Chromium data), partial
          overlap in cell type composition (i.e., not all labels should be transferred and not all unannotated
          cells should be assigned a label), complex organization of the labels (e.g., hierarchy of cell types
          and sub-types [27], continuum along phenotypic or temporal gradients), partial labeling (i.e.,
          only a subset of cells from the “annotated” dataset can be assigned a label confidently), and the
          need to handle multiple (more than 2) datasets in a principled and scalable manner. One way
          to address the annotation problem with this approach is learning a classifier [27, 28] in order to
          predict a fixed stratification of cells. Another, more flexible approach is to transfer annotations
          by first harmonizing the annotated and unannotated datasets, thus also gaining from the benefits
          of having a single dataset that can be subject to additional, joint, downstream analysis.
              In this paper, we propose a strategy to address several of the outstanding hurdles in both
          of the harmonization and annotation problems. We first demonstrate that single-cell Varia-
          tional Inference (scVI) [29] a deep generative model we previously developed for probabilistic
          representation of scRNA-seq data — performs well in both harmonization and harmonization-
          based annotation, going beyond its previously demonstrated capacity to correct batch effects.
          We then introduce single-cell ANnotation using Variational Inference (scANVI), a new method
          that extends scVI and provides a principled way to address the annotation problem probabilisti-
          cally while leveraging any available label information. scANVI uses a semi-supervised generative
          model, which can be utilized for both approaches to the annotation problem. In the first sce-
          nario, we are concerned with a single dataset in which only a subset of cells can be confidently
          labeled (e.g., based on expression of marker genes) and annotations should then be transferred
          to other cells, when applicable. In the second scenario, annotated datasets are harmonized with
          unannotated datasets and then used to assign labels to the unannotated cells.
              The inference procedure for both of the scVI and scANVI models relies on neural networks,
          stochastic optimization and variational inference [30, 31] and scales to large numbers of cells
          and datasets. Furthermore, both methods provide a complete probabilistic representation of the
          data, which non-linearly controls not only for sample-to-sample bias but also for other technical
          factors of variation such as over-dispersion, library size discrepancies and zero-inflation. As such,
          each method provides a single probabilistic model that underlies the harmonized gene expression
          values (and the cell annotations, for scANVI), and can be used for any type of downstream
          hypotheses testing. We demonstrate the latter point through a differential expression analysis
          on harmonized data. Furthermore, through a comprehensive analysis of performance in various
          aspects of the harmonization and annotation problems and in various scenarios, we demonstrate
          that scVI and scANVI compare favorably to current state-of-the-art methods.

          Results
          In the following we demonstrate that our framework compares favorably to the existing state
          of the art in the harmonization and annotation problems in terms of accuracy, scalability, and
          adaptability to various settings. The first part of the paper focuses on the harmonization prob-
          lem and covers a range of scenarios, including harmonization of datasets with varying levels of
          biological overlap, handling cases where the data is governed by a continuous (e.g., pseudotime)
          rather than discrete (cell types) form of variation, and processing multiple (> 20) datasets. While
          we demonstrate that scVI performs well in these scenarios, we also demonstrate that the latent
          space leaned by scANVI provides a proper harmonized representation of the input datasets —
          a property necessary for guaranteeing its performance in the annotation problem. In the sec-
          ond part of this manuscript we turn to the annotation problem and study its two main settings,
          namely transferring labels between datasets and ab-inito labeling. In the first setting we consider
          the cases of datasets with a complete or partial biological overlap and use both experimentally-
          and computationally- derived labels to evaluate our performance. In the second settings, we
          demonstrate how scANVI can be used effectively to annotate a single dataset by propagating
          high confidence seed labels (based on marker genes) and by leveraging a hierarchical structure of
          cell state annotations. Finally, we demonstrate that the generative models inferred by scANVI
          and scVI can be directly applied for hypotheses testing, using differential expression as a case
          study.

                                                                       3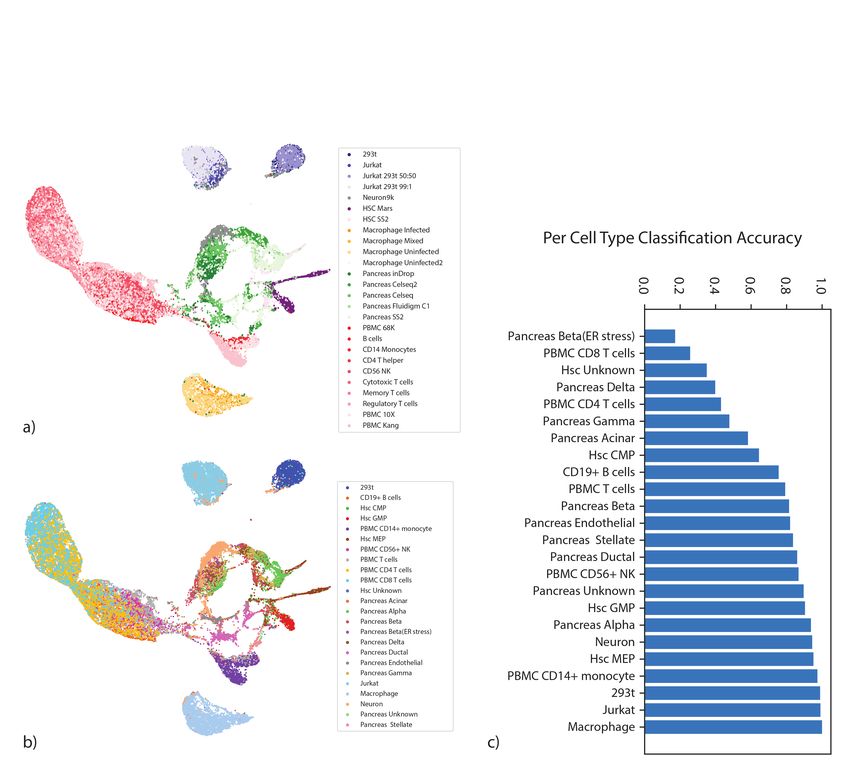
bioRxiv preprint first posted online Jan. 29, 2019; doi: http://dx.doi.org/10.1101/532895. The copyright holder for this preprint
 (which was not peer-reviewed) is the author/funder, who has granted bioRxiv a license to display the preprint in perpetuity.
                              It is made available under a CC-BY-NC-ND 4.0 International license.

          Joint modeling of scRNA-seq datasets
          We consider K different scRNA-seq datasets (Figure 1a). A dataset indexed by k ∈ {1, · · · , K}
          consists of a Nk × Gk matrix where each entry records the number of transcripts observed for
          each of Gk genes in each of Nk cells. In this work, we use a standard heuristic to filter the
          genes and generate a common (possibly
                                            P          large) gene set of size G (Online Methods), and thus
          format our data as a unique ( k Nk ) × G matrix whose individual entries are noted xng —
          namely the expression of gene g in cell n. We use sn ∈ {1, · · · , K} to represent the dataset from
          which each cell n was generated. Furthermore, a subset of the cells may be associated with a
          cell state annotation cn , which can describe either discrete cell types or hierarchical cell types.
          More complex structures over labels such as gradients are left as a future research direction.
              Since the problem of data harmonization of single-cell transcriptomics is difficult and can
          potentially lead to over-correction (Figure 1b) [32], we propose a fully-generative method as
          a robust and principled approach to address it. In our previous work [29], we built single-cell
          Variational Inference (scVI), a deep generative model where the expression level xng is zero-
          inflated negative binomial (ZINB) when conditioned on the dataset identifier (sn ), and two
          additional latent random variables. The first, which we denote by ln , is a one-dimensional
          Gaussian accounting for the variation in capture efficiency and sequencing depth. The second is
          zn is a low dimensional Gaussian vector that represents the remaining variability (Figure 1c).
          This vector is expected to reflect biological differences between cells, and can be effectively
          used for visualization, clustering, pseudotime inference and other tasks. Since the scVI model
          explicitly conditions on the dataset identifier, it provides an effective way of controlling for
          technical sample-to-sample variability. However, scVI is unsupervised and does not make use
          of the available annotations cn , which can further guide the inference of an informative latent
          representation zn . To this end, we present a more refined hierarchical structure for zn . We draw
          zn as a mixture conditioned on the cell annotation cn and another latent variable un , accounting
          for further biological variability within a cell type (Figure 1d, Online Methods). We name
          the resulting approach single-cell ANnotation using Variational Inference (scANVI).
              The variables zn , inferred either with scVI or scANVI, provide an embedding of all cells in a
          single, joint latent space. Since this latent space is inferred while controlling for the dataset of
          origin (sn ), it inherently provides a way to address the harmonization problem. The annotation
          of unlabeled cells can therefore be conducted with scVI using their proximity to annotated cells in
          the joint latent space (e.g., using majority vote over the k-nearest neighbors). The scANVI model
          provides a more principled way to annotate cells, namely through a Bayesian semi-supervised
          approach. Once fitted, the model is able to provide posterior estimates for the unobserved cell
          state cn , which can be particularly useful when labels cannot be entirely trusted. Because the
          marginal distribution p(xng , cn | sn ) if cn observed (resp. p(xng | sn ) otherwise) is not amenable
          to exact Bayesian computation, we use variational inference parameterized by neural networks
          to approximate it [30] (Online Methods).
              Notably, scANVI and scVI both have a certain number of hyperparameters. In the following
          evaluations, conducted on different datasets and different scenarios, we use the exact same set
          of hyperparameters in order to demonstrate that our methods can be applied with a minimal
          requirement of hyperparameter tuning (Online Methods). We provide a robustness study for
          hyperparameters in the context of harmonization in Supplementary Figure 1. We further
          discuss the underlying assumptions of our framework in the context of competing harmonization
          methods in Supplementary Note 1.

                                                                       4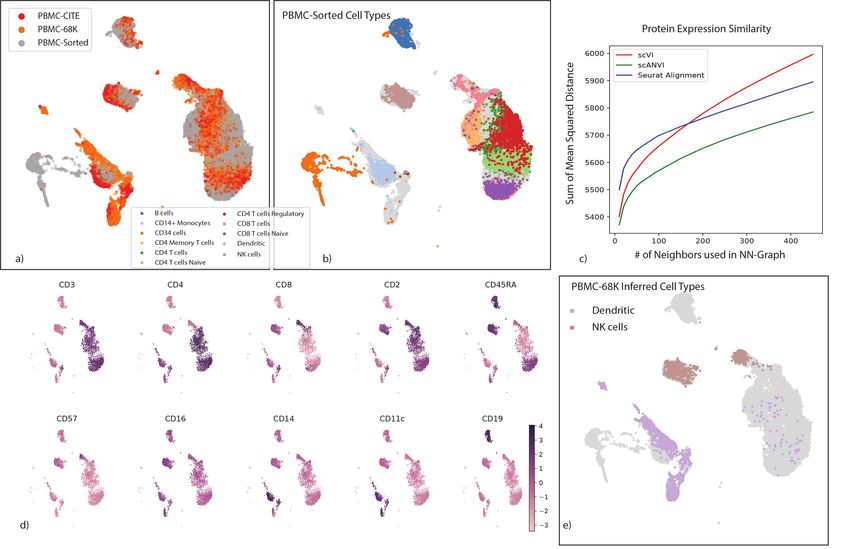
bioRxiv preprint first posted online Jan. 29, 2019; doi: http://dx.doi.org/10.1101/532895. The copyright holder for this preprint
                                                                                                                                                                     (which was not peer-reviewed) is the author/funder, who has granted bioRxiv a license to display the preprint in perpetuity.
                                                                                                                                                                                                  It is made available under a CC-BY-NC-ND 4.0 International license.
5

    Figure 1: Harmonization of scRNA-seq datasets with generative models. (a) Schematic diagram of the variational inference procedure in both of the scVI and
    scANVI models. We show the order in which random variables in the generative model are sampled and how these variables can be used to derive biological
    insights. (b) The graphical models of scVI and scANVI. Vertices with black edges represent variables in both scVI and scANVI, and vertices with red edges are
    unique to scANVI. Shaded vertices represent observed random variables. Semi-shaded vertices represent variables that can be either observed or random. Empty
    vertices represent latent random variables. Edges signify conditional dependency. Rectangles (“plates”) represent independent replication. The complete model
    specification and definition of internal variables is provided in the Online Methods
                                                                                    .
bioRxiv preprint first posted online Jan. 29, 2019; doi: http://dx.doi.org/10.1101/532895. The copyright holder for this preprint
 (which was not peer-reviewed) is the author/funder, who has granted bioRxiv a license to display the preprint in perpetuity.
                              It is made available under a CC-BY-NC-ND 4.0 International license.

          Datasets
          We apply our method on datasets generated by a range of technologies (10x Chromium [3, 33],
          plate-based Smart-Seq2 [34], Fluidigm C1 [35], MARS-Seq [36], inDrop [37] and CEL-Seq2 [38]),
          spanning different numbers of cells (from a few thousand to over a hundred thousand cells), and
          originating from various tissues (mouse bone marrow, human peripheral mononuclear blood cells
          [PBMCs], human pancreas, mouse brain). Datasets are listed and referenced in Supplementary
          Table 1.

          Harmonizing pairs of datasets with a discrete population structure
          We conducted a comparative study of harmonization algorithms on four different instances, each
          consisting of a pair of datasets. The first pair (PBMC-CITE [25], PBMC-8K [33]) represents
          the simplest case, in which the two datasets come from very similar biological settings (i.e.,
          PBMCs) and are generated by the same technology (i.e., 10x) but in different labs (i.e., akin to
          batch correction). A second scenario is that of similar tissue but different technologies, which
          we expect to be more challenging as each technology comes with its own characteristics and
          biases [39]. For instance, some methods (10x, CEL-Seq2) profile the end of the transcript and
          use Unique Molecular Identifier (UMI) to mitigate inflation in counting, whereas others (e.g.,
          most applications of Smart-Seq2) consider the full length of the transcript without controlling for
          this potential bias. Additionally, some protocols (e.g., Smart-Seq2) tend to have higher sensitivity
          and capture more genes per cell compared to others. Finally, studies using droplet based protocols
          tend to produce much larger numbers of cells compared to plate-based methods. We explore three
          such cases, including a bone marrow 10x and Smart-Seq2 pair from the Tabula Muris project
          (MarrowTM-10x, MarrowTM-ss2 [9]), a pancreas inDrop and CEL-Seq2 pair (Pancreas-InDrop,
          Pancreas-CEL-Seq2 [40]), and a dentate gyrus 10x and Fluidigm C1 pair (DentateGyrus-10x,
          DentateGyrus-C1 [41]).
              Successful harmonization should satisfy two somewhat opposing criteria (Supplementary
          Figure 2). On the one hand, cells from the different datasets should be well mixed; namely,
          the set of k-nearest neighbors (kNN) around any given cell (computed e.g., using euclidean
          distance in the harmonized latent space) should be balanced across the different datasets. For
          a fixed value of k, this property can be evaluated using the entropy of batch mixing [12], which
          is akin to evaluating a simple k-nearest neighbors classifier for the batch identifier (Online
          Methods). While this property is important, it is not sufficient, since it can be achieved by
          simply randomizing the data. Therefore, in our evaluations we also consider the extent to which
          the harmonized data retains the original structure observed at each dataset in isolation. Here,
          we expect that the set of k-nearest neighbors of any given cell in its original dataset should
          remain sufficiently close to that cell after harmonization. This property can be evaluated using
          a measure we call k-nearest neighbors purity (Online Methods). Clearly, this criterion can be
          simply optimized by not changing the input datasets, which will result in poor performance with
          respect to our first measure. Our evaluation therefore relies on both of these measures.
              Since our results depend on the neighborhood size k, we consider a range of values - from a
          high resolution (k = 10) to a coarse (k = 500) view of the data. We compare scVI to several
          methods, including MNN [12], Seurat Alignment [13], ComBat [15] and principal component
          analysis (PCA). For each algorithm and pair of datasets, we report embeddings computed via a
          Uniform Manifold Approximation and Projection (UMAP) [42] (Figure 2a, Supplementary
          Figure 3 - 6) as well as the two evaluation metrics (Figure 2b-c). Overall, we observed that
          scVI performs well in terms of mixing, while comparing favorably to the other methods in terms
          of retainment of the original structure, for a wide range of neighborhood sizes and across all
          dataset pairs. As an example, consider the results of applying scVI and Seurat Alignment to the
          Tabula Muris bone marrow datasets (Figure 2a). As can be observed from both the entropy of
          batch mixing values and the visualization of the harmonized data, both methods perform well
          when it comes to mixing the input datasets. However, we observe that scVI performs better in
          retaining the original, continuous, structure of the data. Indeed, using cell type labels provided by
          the original publication [9], we observe that scVI captures the continuous process of myeloid cell
          development (from hematopoietic precursors to erythrocytes and monocytes) well, while Seurat
          Alignment groups the two trajectories (erythrocytes and monocytes) into separate clusters.
              While scANVI was designed for the problem of cell state annotation, we also wanted to
          evaluate its ability to harmonize datasets, which can be seen as a prerequisite. To evaluate this,

                                                                       6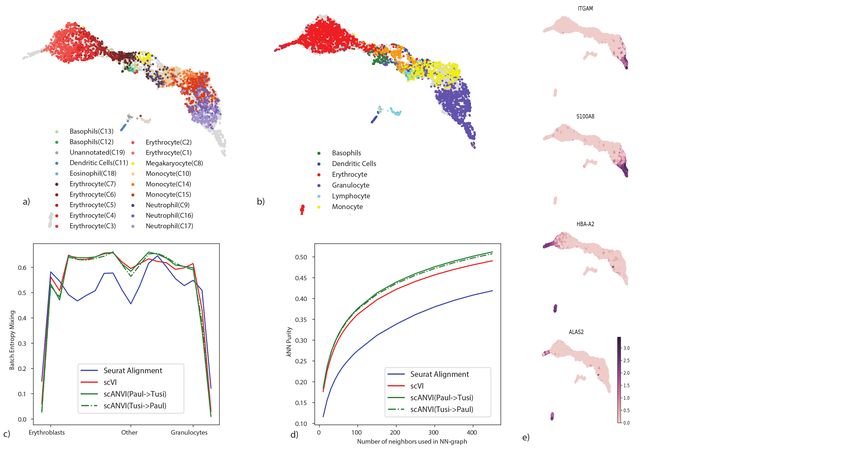
bioRxiv preprint first posted online Jan. 29, 2019; doi: http://dx.doi.org/10.1101/532895. The copyright holder for this preprint
 (which was not peer-reviewed) is the author/funder, who has granted bioRxiv a license to display the preprint in perpetuity.
                              It is made available under a CC-BY-NC-ND 4.0 International license.

          we consider each dataset pair twice, each time using labels from one of the datasets (exploiting
          the semi-supervision framework of scANVI). Reassuringly, we found that scANVI is capable of
          effectively harmonizing the datasets, with a similar performance to that of scVI in terms of
          entropy of batch mixing and k-nearest neighbors purity (Figure 2b-c). We further explore the
          performance of scANVI in the annotation problem in the subsequent sections.

                                                                       7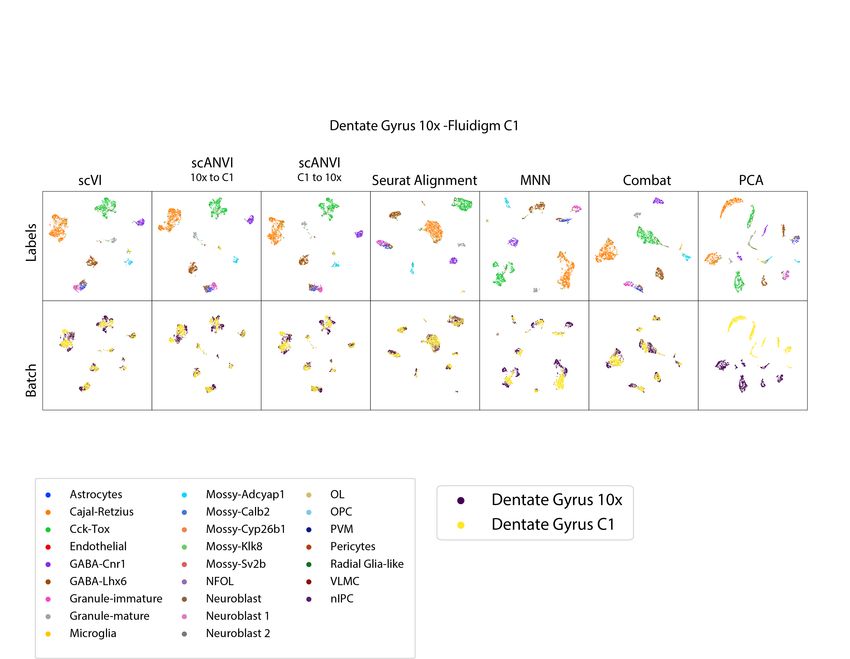
bioRxiv preprint first posted online Jan. 29, 2019; doi: http://dx.doi.org/10.1101/532895. The copyright holder for this preprint
                                                                                                                                                                           (which was not peer-reviewed) is the author/funder, who has granted bioRxiv a license to display the preprint in perpetuity.
                                                                                                                                                                                                        It is made available under a CC-BY-NC-ND 4.0 International license.
8

    Figure 2: Benchmarking of scRNA-seq harmonization algorithms (a)Visualization of the latent space of scVI using Uniform Manifold Approximation and Projection
    (UMAP [42]) for the bone marrow dataset pair [9], colored by cell type and batches. (b) Visualization of the Seurat Alignment latent space of the same dataset. (c)
    Quantitative comparison of the performance of scVI and Seurat Alignment by two measures. One the left retainment of structure for the benchmark algorithms
    on the four pairs of dataset evaluated via the k-nearest neighbors purity, defined as a jaccard index of neighbor sets (Online Methods). On the right dataset
    mixing for the benchmark algorithms on the four pairs of datasets evaluated by entropy of batch mixing.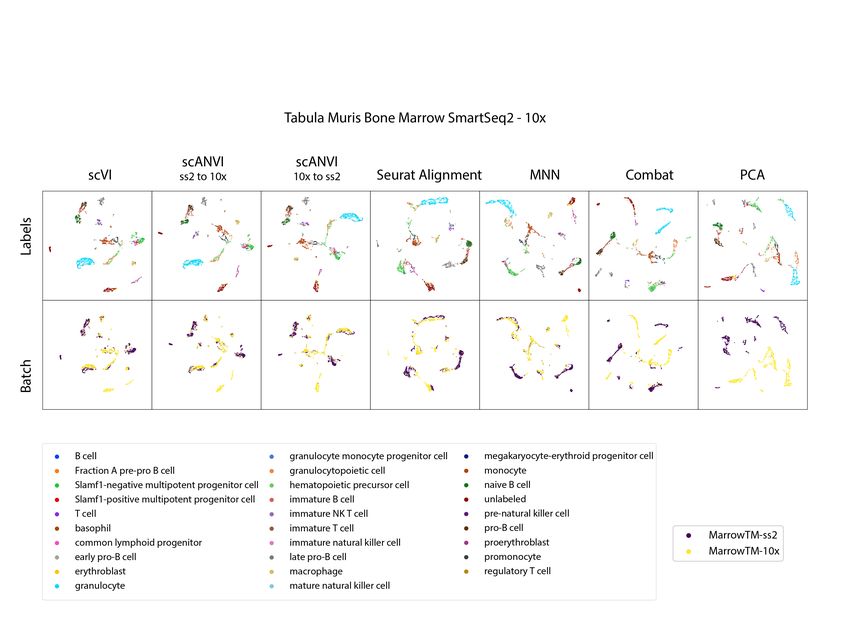
bioRxiv preprint first posted online Jan. 29, 2019; doi: http://dx.doi.org/10.1101/532895. The copyright holder for this preprint
 (which was not peer-reviewed) is the author/funder, who has granted bioRxiv a license to display the preprint in perpetuity.
                              It is made available under a CC-BY-NC-ND 4.0 International license.

          Harmonizing datasets with a different composition of cell types
          One of the primary challenges of the harmonization problem is handling cases in which the
          cell types present in the input datasets only partially overlap or do no overlap at all. Since
          this is a plausible scenario in many applications, it is important to account for it and avoid
          over-normalizing or “forcing” distinct cell populations onto each other. To evaluate this, we
          performed several stress tests in which we artificially manipulated the composition of cell types in
          the input datasets prior to harmonization. As our benchmark method we use Seurat Alignment,
          which performed better than the remaining benchmark methods in our first round of evaluation
          (Figure 2).
               As a case study, we used a pair of PBMC datasets (PBMC-CITE [25], PBMC-8K [33]) that
          initially contained a similar composition of immune cell types (Supplementary Table 2). We
          were first interested in the case of no biological overlap (Figure 3a-d). To test this, for a given
          cell type c0 (e.g., natural killer cells), we only keep cells of this type in the PBMC-CITE dataset
          and remove all cells of this type from the PBMC-8K dataset. In Figure 3a-b, we show an
          example of UMAP visualization of the harmonized data, with natural killer cells as the left out
          cell type c0 . Evidently, when harmonizing the two perturbed datasets with scVI, the natural
          killer cells appear as a separate cluster and are not wrongly mixed with cells of different types
          from the other dataset. Conversely, we see a larger extent of mixing in the latent space inferred
          by Seurat Alignment. A more formal evaluation is provided in Figure 3c-d, which presents
          our two harmonization performance metrics for each cell type averaged across all perturbations
          (in each perturbation, c0 is set to a different cell type). We also included scANVI with the true
          number of cell types (C = 6) in this analysis, using the cell labels from the PBMC-CITE dataset.
               Under the ideal scenario of a successful harmonization, we expect both a low entropy of
          batch mixing (since the datasets do not overlap), and retainment of the original structure. Evi-
          dently, both scVI and scANVI exhibit a consistently low level of batch mixing that is better or
          comparable to that of Seurat Alignment, while retaining the original structure more accurately.
               As an additional scenario, we investigated the case where the input datasets contain a similar
          set of cell types, with the exception of one cell type that appears in only one of the datasets. To
          simulate this, for a given cell type c0 , we removed cells of this type from the PBMC-8K dataset,
          and then harmonize the remaining cells with the unaltered PBMC-CITE (which still contains
          c0 ). We show an example of UMAP visualization in Figure 3e-f, removing CD4+ T cells from
          the PBMC-8K dataset. Evidently, in the scVI latent space, the PBMC-CITE “unique” CD4+ T
          cell population is not wrongly mixed with cells from the perturbed PBMC-8K dataset, but rather
          appears as a distinct cluster. For a more formal analysis, Figure 3g-i shows the harmonization
          statistics for perturbing the six major cell types present in the PBMC datasets. As above, we
          also evaluated scANVI in this context, using the labels from the unperturbed (PBMC-CITE)
          dataset.
               Figure 3g shows that the entropy of batch mixing from the “unique” populations (averaging
          over all six perturbations) is low in all three methods (scVI, scANVI and Seurat Alignment),
          with a slight advantage for scVI and scANVI. Figure 3h-i shows the harmonization statistics
          for each population, averaging over all shared cell types between the two datasets. Evidently,
          for the populations that are indeed common to the two datasets, scVI and scANVI are capable
          of mixing them properly, while preserving the original structure, comparing favorably to Seurat
          Alignment on both measures. Overall, the results of this analysis demonstrate that scVI and
          scANVI are capable of harmonizing datasets with very different compositions, while not forcing
          erroneous mixing. These results are consistent with the design of scVI and scANVI, which aim
          to maximize the likelihood of a joint generative model, without making a priori assumptions
          about the similarity in the composition of the input datasets.

                                                                       9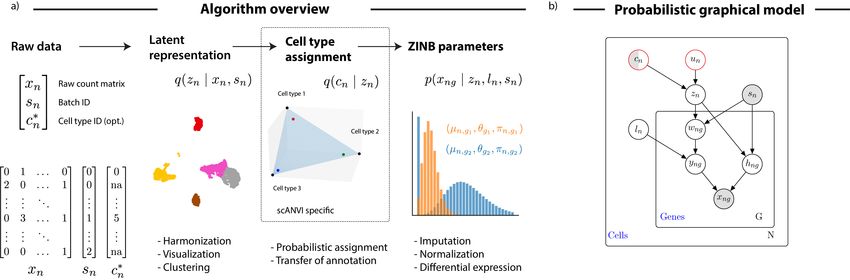
bioRxiv preprint first posted online Jan. 29, 2019; doi: http://dx.doi.org/10.1101/532895. The copyright holder for this preprint
                                                                                                                                                                                (which was not peer-reviewed) is the author/funder, who has granted bioRxiv a license to display the preprint in perpetuity.
                                                                                                                                                                                                             It is made available under a CC-BY-NC-ND 4.0 International license.
10

     Figure 3: Harmonizing datasets with different cellular composition. (a − d) show the case when no cell type is shared, where PBMC-8K contains all cells other
     than cell type c0 and PBMC-CITE contains only cell type c0 . (a − b) UMAP visualization for the case where c0 corresponds to natural killer cells. (c − d)
     Harmonization statistics, aggregating the six experiments (setting c0 to a different cell type in each experiment). (e − i) show the results of cell type c0 is removed
     from the PBMC-8K dataset, while the PBMC-CITE dataset remains the same. (e − f ) UMAP visualization for the case where c0 corresponds to CD4+ T cells.
     (g) batch entropy mixing for the cell type that was removed. (h) batch entropy mixing for each cell type in the 5 experiments where they were not removed.
     (i) Retainment of the original structure, aggregating all 6 experiments. Red arrows indicate the desired direction for each performance measure (e.g., low batch
     entropy is desirable in (d)). The boxplots are standard Tukey boxplots where the box is delineated by the first and third quartile and the whisker lines are the
     first and third quartile plus minus 1.5 times the box height. The dots are outliers that fall above or below the whisker lines.
bioRxiv preprint first posted online Jan. 29, 2019; doi: http://dx.doi.org/10.1101/532895. The copyright holder for this preprint
(which was not peer-reviewed) is the author/funder, who has granted bioRxiv a license to display the preprint in perpetuity.
It is made available under a CC-BY-NC-ND 4.0 International license.
Harmonizing continuous trajectories
While so far we considered datasets that have a clear stratification of cells into discrete sub-
populations, a conceptually more challenging case is harmonizing datasets in which the major
source of variation forms a continuum, which inherently calls for accuracy at a higher level of
resolution.
To explore this, we use a pair of datasets that provide a snapshot of hematopoiesis in mice
(HEMATO-Tusi [43], HEMATO-Paul [44]; Figure 4). These datasets consist of cells along the
transition from common myeloid progenitor cells (Figure 4a-b; middle) through two primary
differentiation trajectories myeloblast (top) and erythroblast-megakaryocyte (bottom). Notably,
the HEMATO-Tusi dataset contains cells that appear to be more terminally differentiated, which
are located at the extremes of the two primary branches. This can be discerned by the ex-
pression of marker genes (Figure 4e). For instance the HEMATO-Tusi unique erythroid cell
population expresses Hba-a2 (hemoglobin subunit) and Alas2 (erythroid-specific mitochondrial
5-aminolevulinate synthase) that are known to be present in reticulocytes [45, 46]. At the other
end, the granulocyte subset that is captured only by HEMATO-Tusi expresses Itgam and S100a8.
S100a8 is a neutrophil specific gene predicted by Nano-dissection [47] and is associated with GO
processes such as leukocyte migration associated with inflammation and neutrophil aggregation.
Itgam is not expressed in granulocyte-monocyte progenitor cells but is highly expressed in mature
monocytes, mature eosinophils and macrophages [48]. We therefore do not expect mixing to take
place along the entire trajectory. To account for this, we evaluated the extent of batch entropy
mixing at different points along the harmonized developmental trajectory. As expected, we find
that in most areas of the trajectory the two datasets are well mixed, while at the extremes, the
entropy reduces significantly, using either scVI or Seurat Alignment (Figure 4c). Overall, we
observe that scVI compares well in terms of both mixing the differentiation trajectories in each
dataset and preserving their original, continuous, structure (Figure 4a-d).
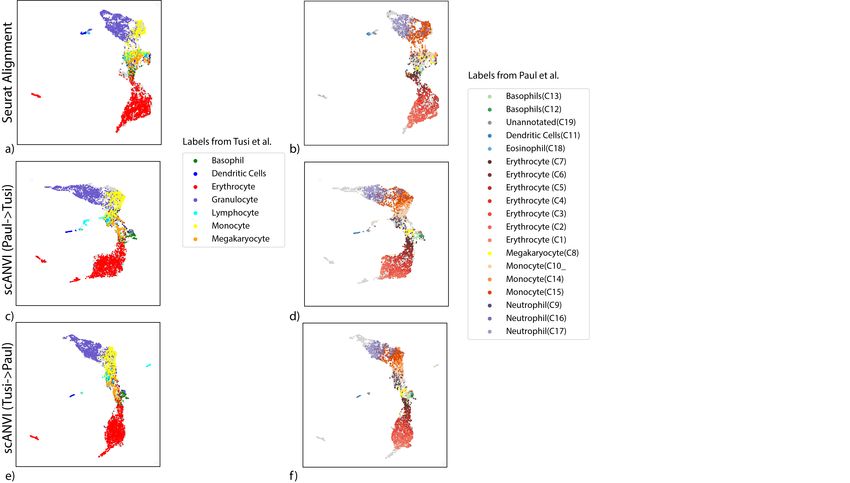
To validate scANVI in this context as well, we provided it with the categorical labels of
cells along the two developmental trajectories, indicating their cell state (Figure 4c-d and
Supplementary Figure 7). Even though this labeling scheme does not explicitly account for
the ordering between states, we observe that scANVI is capable of mixing the two datasets, while
retaining their original structure, achieving a level of accuracy comparable to that of scVI and
better than that of Seurat Alignment.
11bioRxiv preprint first posted online Jan. 29, 2019; doi: http://dx.doi.org/10.1101/532895. The copyright holder for this preprint
(which was not peer-reviewed) is the author/funder, who has granted bioRxiv a license to display the preprint in perpetuity.
It is made available under a CC-BY-NC-ND 4.0 International license.
12
Figure 4: Harmonizing developmental trajectories. (a − b) UMAP visualization of the scVI latent space, with cells colored by the original labels from either the
HEMATO-Paul (a) or HEMATO-Tusi (b) studies. The cells from the other dataset are colored in gray. (c) Batch entropy mixing of 20 of bins HEMATO-Tusi
cells ordered by the potential of each cell derived from the PBA algorithm used in the original publication. Potential is a pseudotime measure that describes how
differentiated a cell is. (center: common myeloid progenitors; moving left: erythrocyte branch; moving right: granulocyte branch). (d) k-nearest neighbors purity
for scVI, Seurat, and scANVI. (e) Expression of marker genes that help determine the identity of batch-unique cells.bioRxiv preprint first posted online Jan. 29, 2019; doi: http://dx.doi.org/10.1101/532895. The copyright holder for this preprint
(which was not peer-reviewed) is the author/funder, who has granted bioRxiv a license to display the preprint in perpetuity.
It is made available under a CC-BY-NC-ND 4.0 International license.
Rapid integration of multiple datasets
To demonstrate the scalability of our framework in the context of harmonizing multiple (and
possibly large) dataset, we ran scVI to integrate a cohort of 26 datasets spanning 105,476 cells
from multiple tissues and technologies, which was made available by the authors of Scanorama
(a scalable variant of MNN [19]). Using the hardware specified in the original paper [19] (Intel
Xeon E5-2650v3 CPU limited to 10 cores with 384 GB of RAM), Seurat Alignment and MNN
required over 24 hours, while Scanorama completed its run in 20 minutes. Using a simpler config-
uration (eight-core Intel i7-6820HQ CPU with 32 GB RAM) along with one NVIDIA Tesla K80
GPU (GK210GL; addressing 24 GB RAM), we found that scVI integrates all datasets and learns
a common embedding in less than 50 minutes. Notably, this running time is competitive con-
sidering the reduced memory availability and the increased complexity of our model (compared
to truncated singular value decomposition followed by the nearest neighbor matching algorithm
in Scanorama). Notably, the latent space of scVI recapitulates well the major tissues and cell
types (Supplementary Figure 8), and the position of cells in the latent space provides an
effective predictor for the cell type label (Supplementary Figure 8 and Online Methods).
Transferring cell type annotations between datasets
We next turned to evaluate scVI and scANVI in the context of harmonization-based annotation.
Here, we test the extent to which annotations from a previously annotated dataset can be used to
automatically derive annotations in a new unannotated dataset. For scVI and Seurat Alignment,
we derive the annotations by first harmonizing the input datasets and then running a k-nearest
neighbors classifier (setting k to 10) on the joint latent space, using the annotated cells to assign
labels to the unannotated ones. Conversely, scANVI harmonizes the input datasets while using
any amount of available labels. The prediction of unobserved labels is then conducted using
the approximate posterior assignments qΦ (c | z) of cell types (Online Methods), which can
be derived directly from the model. An alternative approach, which we also include in our
benchmark was taken by scmap-cluster [28], which instead of harmonizing, directly builds a
classifier based on the labeled cells and then applies this classifier to the unlabeled cells.
We start by exploring the four dataset pairs in Figure 2, which have been annotated in their
respective studies. In each experiment, we “hide” the cell type annotations from one dataset
and transfer the second dataset labels to the first one. As a measure of performance, we report
the weighted accuracy, which is the percent of cells that were correctly assigned to their correct
(hidden) label, averaging over all labels (Online Methods). Importantly, the annotations in
this first set of case studies were derived computationally. For example, by first clustering the
cells, looking for marker genes expressed by each cluster and then assigning labels to the clusters
accordingly. This level of annotation therefore makes the prediction problem relatively easy,
and indeed, while we find that overall scANVI predicts unobserved labels more accurately, the
differences between the methods are mild (Supplementary Figures 9 and 10).
To evaluate the accuracy of annotations without the need for computationally- derived labels,
we turned to the PBMC-CITE dataset which includes measurements of ten key marker proteins
in addition to mRNA [25], and the PBMC-sorted dataset [3], where cells were collected from bead
purifications for eleven cell types (Supplementary Table 3). We applied scVI and scANVI
to harmonize and annotate these two datasets along with a third dataset of PBMC (PBMC-
68K [3]). Our analysis contains a combined set of n = 169, 850 cells from the three datasets
altogether. To generate a realistic scenario of cell type annotation, we only provide access to the
experimentally-based labels from the PBMC-sorted dataset (Figure 5a-c). As an additional
benchmark, we also evaluate Seurat Alignment, which was tested after removal of a randomly
selected subset (40%) of the two large datasets (PBMC-68K and PBMC-sorted) due to scalability
issues. Considering our harmonization performance measures (i.e., retainment of the original
structure and batch mixing), we observe as before that scVI and scANVI perform similarly and
compare favorably to Seurat Alignment. We then evaluated the accuracy of assigning unobserved
labels, focusing on the PBMC-CITE dataset. Instead of using the labels from the original PBMC-
CITE study as ground truth (which were computationally derived), we used the protein data,
which provides an experimentally-derived proxy for cell state. To this end, we quantified the
extent to which the similarity between cells in the harmonized mRNA-based latent space is
consistent with their similarity at the protein level (Online Methods). We first computed
the average discrepancy (sum of squared differences) between the protein measurements in each
13bioRxiv preprint first posted online Jan. 29, 2019; doi: http://dx.doi.org/10.1101/532895. The copyright holder for this preprint
(which was not peer-reviewed) is the author/funder, who has granted bioRxiv a license to display the preprint in perpetuity.
It is made available under a CC-BY-NC-ND 4.0 International license.
cell and the average over its k-nearest neighbors. As a second measure we computed for each
PBMC-CITE cell the overlap between its k-nearest PBMC-CITE neighbors in the harmonized
mRNA-based space and in the protein space. We then report the average across all cells in
Supplementary Figure 11. Evidently, scANVI outperformed both scVI and Seurat Alignment
for a wide range of neighborhood sizes, providing a representation for the mRNA data that is
more consistent with the protein data (Figure 5c).
As further support for the validity of these results, we confirmed that the labels inferred
by scANVI in the PBMC-CITE dataset are consistent with the protein expression values (e.g.,
observing a uniquely high level of CD19 expression in cells assigned with the “B cell” label;
Figure 5d and Supplementary Figure 11). Interestingly, when considering the latent space
learned by scANVI, we observed a certain amount of possible mislabeling in the original study
of the PBMC-68K dataset (Figure 5e). In that study, the PBMC-68K cells were assigned with
labels by taking the maximum correlation with cell subsets from the experimentally-annotated
PBMC-sorted data. However this approach might be error prone, most likely due to low sen-
sitivity and the influence of genes that are less relevant to cell type classification. Specifically,
we observe a substantual amount of cells that are labeled by scANVI as T cells, but originally
labeled as dendritic cells or natural killer cells. This re-annotation as T cells is supported by the
expression of marker genes [49] of the respective cell subsets (Supplementary Figure 11).
14bioRxiv preprint first posted online Jan. 29, 2019; doi: http://dx.doi.org/10.1101/532895. The copyright holder for this preprint
(which was not peer-reviewed) is the author/funder, who has granted bioRxiv a license to display the preprint in perpetuity.
It is made available under a CC-BY-NC-ND 4.0 International license.
15
Figure 5: Validation of cell type annotations using additional metadata. (a-b) UMAP plot of the scANVI latent space inferred for three harmonized datasets:
PBMC-CITE [25], PBMC-sorted [3], and PBMC-68K [3]. Cells are colored by the batch they come from (a) and the PBMC-sorted labels(b). Cells from the
PBMC-Cite and PBMC-68K are colored gray in (b). (c) The consistency of the harmonized PBMC-CITE mRNA data with the respective protein measurements,
evaluated by mean squared error and for different neighborhood size. Lower values indicate higher consistency. (d) UMAP plot of the scANVI latent space, where
cells are colored by normalized protein measurement. Only PBMC-CITE cells are displayed. (e) UMAP plot of the scANVI latent space, with cells from the
PBMC-68k dataset colored according to their original label. For clarity of presentation, only cells originally labeled as dendritic cells or natural killer cells are
colored. Evidently, a large number of these cells are mapped to a cluster of T-cells (right side of the plot).bioRxiv preprint first posted online Jan. 29, 2019; doi: http://dx.doi.org/10.1101/532895. The copyright holder for this preprint
(which was not peer-reviewed) is the author/funder, who has granted bioRxiv a license to display the preprint in perpetuity.
It is made available under a CC-BY-NC-ND 4.0 International license.
Cell type annotation in a single dataset based on “seed” labels
An important variant of the annotation problem lies within the context of an ab initio labeling
of a single dataset where only a subset of the cells can be confidently annotated based on the raw
data. This increasingly prevalent scenario may result from limited sensitivity of the scRNA-seq
assay, where marker genes may only be confidently observed in a small subset of cells. One
common way to address this problem is to compute some form of a distance metric between cells
(e.g., after embedding with scVI or using Seurat PCA) and then assign labels based on proximity
to annotated cells [3]. To benchmark our methods, we consider two such predictors: the first is
clustering the cells and taking a majority vote inside each cluster, and the second is taking the
majority vote of the k-nearest neighbors around each unannotated cell (k = 10). While these
approaches are quite straightforward, their accuracy might suffer when the data does not form
clear clusters [43], or when differences between labels are too subtle to be captured clearly by
a transcriptome-wide similarity measure. To address these issues, scANVI takes an alternative
approach, namely learning a latent embedding that is guided by the available labels, and then
producing posterior probabilities for assigning labels to each cell.
As a case study, we compiled a dataset consisting of several experimentally sorted and labeled
subsets of T cells from the PBMC-sorted dataset, including CD4 memory, CD4 naive, CD4
regulatory and CD8 naive. To make our analysis more realistic, we assume that the labels are
completely unknown to us and therefore begin by trying to assign each T cell to its respective
subset using marker genes (12 altogether; see Online Methods). Notably, several important
biomarkers (CD4, CTLA4, and GITR) are detected in less than 5% of the cells, which renders
their use for annotation not straightforward. Notably, many of these biomarkers are sparsely
expressed to the extent that they are likely to be filtered out in the gene selection step of most
harmonization procedures (Figure 6a).
To analyze this dataset, we first computed a signature score for each cell and for each label
(i.e., T cell subset) using the scaled raw expression values of the respective marker genes (Online
Methods). We then designated the top 50 scoring cells in each subset as the seed set of cells that
are confidently annotated for that subset (Figure 6b). Reassuringly, this partial annotation is in
agreement with the experimentally derived cell type labels available for this dataset (Figure 6c).
However, this dataset does not form clear clusters, and in particular the seed sets of cells are
not well separated. Such an observation makes clustering-based approaches potentially less
precise. Indeed, using k-means clustering on the scVI and Seurat Alignment latent space, we
find that 74% and 72% of the cells were assigned with their correct label. Similar analysis
with two additional popular clustering algorithms (DBSCAN [50] and PhenoGraph [51]) further
emphasizes the challenge of a cluster-based approach on this data. Specifically, DBSCAN does
not partition the data into more than one cluster (scanning through a large number of parameter
values; Online Methods), and PhenoGraph predicts 9 clusters and achieves an accuracy of 41%
(Supplementary Figure 12).
Consistent with these results, the application of a k-nearest neighbors classifier resulted in
a similar level of accuracy in the Seurat PCA latent space (71%), which is slightly improved
when replacing it with the scVI latent space (73%; Supplementary Figure 12). Conversely,
after fitting the scANVI model based on this partial labeling, the annotation posterior qΦ (c | z)
(Figure 6d) provides a substantially more accurate cell type assignment, with 84% of cells
annotated correctly. The scANVI latent space also has more distinct cell type clusters than both
scVI and Seurat Alignment (Supplementary Figure 12).
16bioRxiv preprint first posted online Jan. 29, 2019; doi: http://dx.doi.org/10.1101/532895. The copyright holder for this preprint
(which was not peer-reviewed) is the author/funder, who has granted bioRxiv a license to display the preprint in perpetuity.
It is made available under a CC-BY-NC-ND 4.0 International license.
17
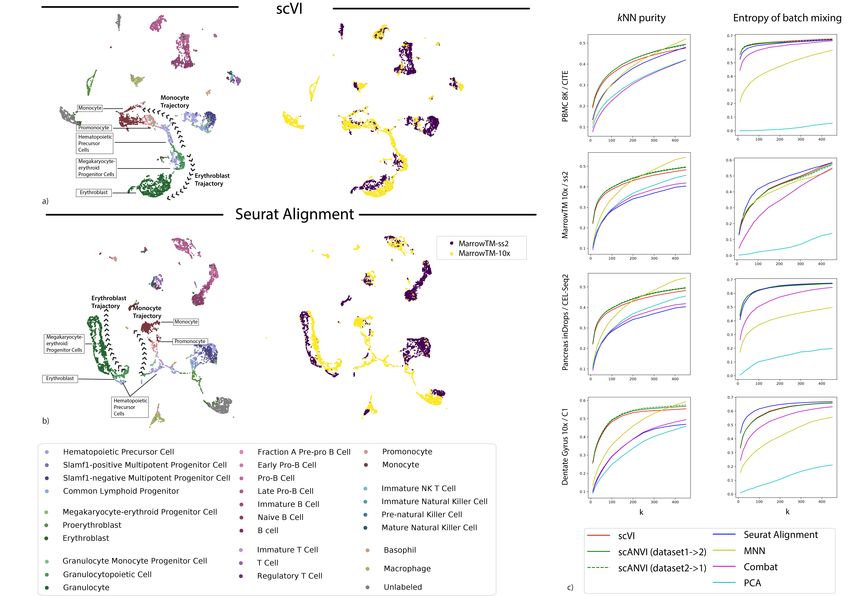
Figure 6: Cell type annotation in a single dataset using “seed” labeling. (a) discrepancies between marker genes that can be used to confidently label cells and
highly variable genes in scRNA-seq analysis. (b − d) UMAP plot of the scVI latent space. (b) Seed cells are colored by their annotation (using known marker
genes). (c) PBMC-sorted cell type labels from the original study based on marker-based sorting (d) The posterior probability of each cell being one of the four T
cell subtypes obtained with scANVI.bioRxiv preprint first posted online Jan. 29, 2019; doi: http://dx.doi.org/10.1101/532895. The copyright holder for this preprint
(which was not peer-reviewed) is the author/funder, who has granted bioRxiv a license to display the preprint in perpetuity.
It is made available under a CC-BY-NC-ND 4.0 International license.
Cell type taxonomy and hierarchical classification with scANVI
Another subtle yet important variation of the annotation problem is when the labels are not
mutually exclusive but rather form a taxonomy of cell types or states. To effectively annotate
cells in this setting, we extended scANVI to perform hierarchical classification, which as before we
carry out from first principles, relying on probabilistic graphical models (Supplementary Note
4). To demonstrate this extended version, we use a dataset of the mouse nervous system [52]
that was annotated using a cell type taxonomy with several levels of granularity. At the lowest
(most granular) level, the cells are stratified into 265 sub-types. At the second lowest level of
granularity these 265 sub-types are grouped into 39 subsets, each corresponding to a coarser cell
type definition.
We evaluate the ability of scANVI as well as competing methods at inferring these granular
labels when provided with partial “seed” annotation — namely label information for 5 randomly
selected cells per label (which accounts for an overall of 0.8% of the cells). We first observe
that Seurat PCA followed by a k-nearest neighbors classifier provides a weighted accuracy of
23% (averaging over all cell types). scVI provides a substantially better, yet still lower level
of accuracy at 32%. Interestingly, when scANVI is used without accounting for hierarchy, its
performance is similar to the unsupervised scVI (at 32%), which might result from very large
number of labels that may require hyperparameter tuning (e.g., increasing the number of classifier
training epochs; see Supplementary Note 3). However, when we take the hierarchy of the
labels into account, the performance of scANVI increases to 37%, thus outperforming the other
methods. Notably, while we tested the extrapolation of seed labeling and the hierarchical mode
only in the context of a single dataset, this variation of the scANVI model can also be directly
applied in the context of multiple datasets (i.e., transferring hierarchical annotations between
datasets).
Hypotheses testing in harmonized datasets: the case of differential ex-
pression
With their probabilistic representation of the data, scVI and scANVI each provide a natural way
of performing various types of hypotheses testing (Online Methods). This is different from
other approaches [12, 13, 18, 19, 20] where the dataset alignment procedures do not carry direct
probabilistic interpretation, and the resulting harmonized data can thus not be directly used for
these purposes.
To demonstrate this, we focus on the problem of differential expression. As a case study,
we use two PBMC datasets (PBMC-8K and PBMC-68K) where we assume that only one of
the datasets (PBMC-8K) comes with prior annotation of cell types. We looked for differentially
expressed genes in two settings: comparing the subpopulation of B cells to that of dendritic cells,
and similarly for the CD4+ versus the CD8+ T cell subsets. For evaluation, we used reference
sets of differentially expressed genes that were obtained from published bulk-level analysis of
similar cell subsets [53, 54], as in [29].
To conduct a post-harmonization differential expression analysis with scVI, we first harmo-
nized the two PBMC datasets and transferred labels from the PBMC-8K to the PBMC-68K
using a k-nearest neighbors classifier on the joint latent space (k = 10). We then consider these
annotations (predicted and pre-labeled) as fixed and sample 100 cell pairs, each pair consisting of
one cell from each population. For each cell pair we sample gene expression values from the vari-
ational posterior, while marginalizing over the different datasets, to compute the probability for
differential expression in a dataset-agnostic manner. Aggregating across all selected pairs results
in Bayes factors that reflect the evaluated extent of differential expression (Online Methods).
Since scANVI assigns posterior probability for associating any cell to any label, it enables a more
refined scheme. Specifically, instead of sampling pairs of cells we are sampling pairs of points in
the latent space, while conditioning on the respective label. This approach therefore does not
assume a fixed label for each cell (or point in latent space) as in the scVI scheme, but rather
a distribution of possible labelsthus making it potentially more robust to mis-annotation. As
an additional benchmark method, we included edgeR [55], which was shown to perform well
on scRNA-seq data [56] and uses a log-linear model to control for technical sample-to-sample
variation.
For evaluation, we first defined genes as true positives if their adjusted p-values in the reference
bulk data were under 5% and then calculated the area under the ROC curve (AUROC) based
18bioRxiv preprint first posted online Jan. 29, 2019; doi: http://dx.doi.org/10.1101/532895. The copyright holder for this preprint
(which was not peer-reviewed) is the author/funder, who has granted bioRxiv a license to display the preprint in perpetuity.
It is made available under a CC-BY-NC-ND 4.0 International license.
on the Bayes factors (for scVI and scANVI) or the p-values (for edgeR). Since defining true
positives requires a somewhat arbitrary threshold, we also used a second score that evaluates
the reproducibility of gene ranking (bulk reference vs. single-cell; considering all genes), using
the Kendall rank correlation coefficient (Supplementary Figure 13). As a reference, we look
at the accuracy of differential expression analysis in each PBMC dataset separately (using their
prior annotations to define the sets of cells we are comparing), computed with scVI (as in [29])
and edgeR. Reassuringly, we find that the performance of scVI on the joint data is not lower
than it is in either dataset in isolation. We also find that in both case studies, scVI performs
moderately better than scANVI, which is to be expected as scANVI has a more complex model,
yet in our case studies this added complexity is not critical since the unobserved labels are
relatively easy to predict (Supplementary Figure 9). Importantly however, we observe that
both scANVI and scVI compare favorably to edgeR in their accuracy and are thus capable of
conducting differential expression effectively in the context of multiple datasets.
Discussion
In this study, we demonstrated that scVI provides a principled approach to scRNA-seq data
harmonization through joint probabilistic representation of multiple dataset, while accounting
for technical hurdles such as over-dispersion, variable library size and limited sensitivity. We have
demonstrated that scVI compares favorably to other methods in its accuracy and that it scales
well, not only in terms of the number of cells (as in [29]) but also the number of input datasets
(as opposed to other methods that work in a pairwise fashion and therefore scale quadratically
with dataset size [19]). We have also shown that the harmonization step of scVI provides an
effective baseline for automated transfer of cell type labels, from annotated datasets to new ones.
While the performance of scVI in the annotation problem compares favorably to other algo-
rithms, it does not make use of any existing cell state annotations during model training, but
rather after the latent space has been learned. To make better use of these annotations (which
may be available for only some of the input datasets or only some cells within a dataset), we
developed scANVI, a semi-supervised variant of scVI. While the latent space of scVI is defined
by a Gaussian vector with diagonal unit variance, scANVI uses a mixture model, which enables
it to directly represent the different cell states (each corresponding to a mixture component;
see Online Methods) and provide a posterior probability of associating each cell with each
label. We have demonstrated that similar to scVI, scANVI is capable of harmonizing datasets
effectively. In addition, scANVI provides a way to address a number of variants of the annota-
tion problem. Here, we have shown that it performs well in the most prevalent application of
transferring labels from a reference dataset to an unannotated one, and that spurious annota-
tions (when datasets do not overlap) are associated with low probability. We then demonstrated
that scANVI can be used in the context of a single unannotated dataset, where high confidence
(“seed”) labels are first inferred for a few cells (using marker genes) and then propagated to the
remaining cells. Finally, we showed that scANVI is especially useful in the challenging case where
the differences between cell states are too subtle to be captured clearly by a transcriptome-wide
similarity measure, as well as in the case where the labels are organized in a hierarchy.
One concern in applying methods based on neural networks [21, 57, 58, 59, 60] in single-cell
genomics and other domains is the robustness to hyperparameters choices [61]. This concern
has been addressed to some extent by recent progress in the field, proposing search algorithms
based on held-out log-likelihood maximization [59]. In this manuscript, we used an alternative
approach that is more conducive for direct and easy application of our methods - namely we fix
the hyperparameters and achieve state-of-the-art results on a substantial number of datasets and
case studies.
Another important consideration while designing statistical models is the trade-off between
goodness of fit and interpretability, which is still an open topic in machine learning research.
Simple models such as the latent Dirichlet allocation [62] might not be particularly suited for
scRNA-seq noise but are yet of interest, e.g., due to the immediate interpretation of word-level
(i.e., gene-level) contributions to topics (i.e., cell types) [63]. Further effort in the use of deep gen-
erative models for applications in computational biology should come with attempts to perform
model interpretation. For instance, SAUCIE [21] experimentally proposes to add an entropy
regularization to a hidden layer of its denoising auto-encoder in order to infer clustering. Fu-
ture principled efforts may focus on putting a suitable prior such as sparsity on neural networks
19You can also read