Operational and emerging capabilities for surface water flood forecasting - CentAUR
←
→
Page content transcription
If your browser does not render page correctly, please read the page content below
Operational and emerging capabilities for
surface water flood forecasting
Article

Published Version

Creative Commons: Attribution 4.0 (CC-BY)

Open Access

Speight, L. J., Cranston, M. D., White, C. J. and Kelly, L.
(2021) Operational and emerging capabilities for surface water
flood forecasting. WIREs Water, 8 (3). e1517. ISSN 2049-
1948 doi: https://doi.org/10.1002/wat2.1517 Available at
http://centaur.reading.ac.uk/96038/

It is advisable to refer to the publisher’s version if you intend to cite from the
work. See Guidance on citing .

To link to this article DOI: http://dx.doi.org/10.1002/wat2.1517

Publisher: Wiley

All outputs in CentAUR are protected by Intellectual Property Rights law,
including copyright law. Copyright and IPR is retained by the creators or other
copyright holders. Terms and conditions for use of this material are defined in
the End User Agreement .

www.reading.ac.uk/centaur
CentAUR

Central Archive at the University of Reading
Reading’s research outputs online
Received: 30 April 2020     Revised: 9 November 2020       Accepted: 26 January 2021
DOI: 10.1002/wat2.1517

OVERVIEW

Operational and emerging capabilities for surface water
flood forecasting

Linda J. Speight1                     | Michael D. Cranston2 | Christopher J. White3 |                                                       Laura Kelly3

1
Geography and Earth Sciences,
University of Reading, Reading, UK
                                                      Abstract
2
 Flood Forecasting and Warning, Scottish              Surface water (or pluvial) flooding is caused by intense rainfall before it enters
Environment Protection Agency,                        rivers or drainage systems. As the climate changes and urban populations
Perth, UK
                                                      grow, the number of people around the world at risk of surface water flooding
3
 Department of Civil and Environmental
Engineering, University of Strathclyde,
                                                      is increasing. Although it may not be possible to prevent such flooding, reliable
Glasgow, UK                                           and timely flood forecasts can help improve preparedness and recovery. Unlike
                                                      riverine and coastal flooding where forecasting methods are well established,
Correspondence
Linda J. Speight, Geography and Earth                 surface water flood forecasting presents a unique challenge due to the high
Sciences, University of Reading, Reading,             uncertainties around predicting the location, timing, and impact of what are
UK.
                                                      typically localized events. Over the past 5 years, there has been rapid develop-
Email: l.j.speight@reading.ac.uk
                                                      ment of convection-permitting numerical weather prediction models, ensem-
Funding information                                   ble forecasting, and computational ability. It is now theoretically feasible to
Natural Environment Research Council,
                                                      develop operational surface water forecasting systems. This paper identifies
Grant/Award Number: NE/K00896X/1;
Scottish Environment Protection Agency                three approaches to surface water forecasting utilizing state-of-the-art meteoro-
                                                      logical forecasts: empirical-based scenarios, hydrological forecasts linked to
                                                      presimulated impact scenarios, and real-time hydrodynamic simulation.
Edited by Stuart Lane, Editor-in-Chief.
                                                      Reviewing operational examples of each approach provides an opportunity to
                                                      learn from international best practice to develop targeted, impact-based, sur-
                                                      face water forecasts to support informed decision-making. Although the emer-
                                                      gence of new meteorological and hydrological forecasting capabilities is
                                                      promising, there remains a scientific limit to the predictability of convective
                                                      rainfall. To overcome this challenge, we suggest that a rethink of the
                                                      established role of flood forecasting is needed, alongside the development of
                                                      interdisciplinary solutions for communicating uncertainty and making the best
                                                      use of all available data to increase preparedness.

                                                      This article is categorized under:
                                                         Engineering Water > Engineering Water

                                                      KEYWORDS
                                                      decision making, flood forecasting, operational, pluvial, surface water

This is an open access article under the terms of the Creative Commons Attribution License, which permits use, distribution and reproduction in any medium, provided
the original work is properly cited.
© 2021 The Authors. WIREs Water published by Wiley Periodicals LLC.

WIREs Water. 2021;8:e1517.                                                                                                        wires.wiley.com/water        1 of 24
https://doi.org/10.1002/wat2.1517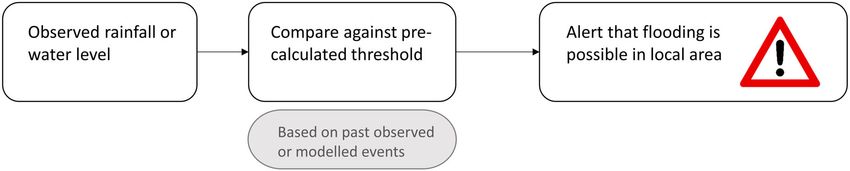
2 of 24                                                                                                           SPEIGHT ET AL.

1 | INTRODUCTION

Surface water flooding, or pluvial flooding, is defined as “flooding as a result of rainfall when water ponds or flows over
the ground before it enters a natural or man-made drainage system or watercourse, or when it cannot enter because the
system is already full to capacity” (SEPA, 2009). Surface water flooding in this context is usually the result of convective
weather systems that cause intense rainfall over short periods of time. In the United Kingdom, this type of rainfall typi-
cally occurs in the summer months but can occur at any time of the year (Blenkinsop, Lewis, Chan, & Fowler, 2016;
Flack et al., 2019; Hand, Fox, & Collier, 2004). Flash floods resulting from rapidly developing convection systems or
alignment of storm cells can be particularly dangerous (Pilling, Dodds, Cranston, Price, & How, 2016) and affect large
numbers of people if they occur over urban areas. For example, in England, there are more properties at risk of surface
water flooding than river and coastal flooding combined (Environment Agency, 2009). The United Kingdom as a whole
is relatively unique in its flood risk management approach as they consider surface water flooding separately to flash
flooding in steep small catchments; other countries forecast these events on a continuous scale using the same system.
Although the main focus of this paper is on surface water flood forecasting, the content is largely applicable to forecast-
ing flooding from any short-duration rainfall event.
    Surface water flooding presents unique challenges to decision-makers due to high uncertainties around predicting
the location, timing, and impact of what are typically localized events. Increasing urban populations and aging drainage
systems, combined with an increase in intense rainfall events as the climate changes, will result in increasing risk of
surface water flooding in the future. Although it may not be possible to prevent flooding from intense rainfall, reliable
real-time forecasts are crucial to support improved preparedness and response (Flood Forecasting Centre, 2018). A real-
time surface water flooding forecasting system requires a combination of hydrological and meteorological modeling.
For example, hydrological models are required to represent surface runoff, inundation, and water movement and show
how water travels via surface, subsurface, urban sewerage, and drainage networks. High-resolution probabilistic rainfall
forecast models are required to quantify the uncertainty in forecasting the rainfall, which causes surface water flooding.
    In this paper, we review the recent UK and international developments in hydrometeorological forecasting and con-
sider how they support decision-making by first responders and emergency managers. This includes the emergence of
operational surface water flood forecasting systems and the increased use of crowdsourced data to support such sys-
tems. This review is part of a project funded by the Scottish Environment Protection Agency (SEPA) to inform their
decision-making around the development of future surface water flood forecasting tools in Scotland (Speight, Cranston,
Kelly, & White, 2019). It is based on a literature review of international examples of operational surface water flood
forecasting tools with a strong focus on examples from the United Kingdom. The analysis was supported by discussions
with industry experts and leading academics (as listed in the acknowledgments) to incorporate emerging capabilities
and recent applications on new operational systems.
    The structure of this paper is as follows. First, we discuss the importance of effective surface water flood forecasting
to support decision-making (Section 2). Section 3 details the step change in convection-permitting numerical weather
prediction (NWP), which has enabled the development of surface water flood forecasting. Section 4 provides examples
of operational and near operational surface water flood forecasting tools. This is followed by a comparison of the differ-
ent approaches and a review of their suitability in different operational scenarios. Section 5 considers the benefits of
including “nontraditional” sources of observation data in forecasting systems. Finally in Section 6, based on the findings
of this review, we identify five grand challenges for operational surface water flood forecasting.

2 | THE CH ALLE N G E OF SU RF A C E W A T E R F L O O D F O R E C A ST I NG

Given the potentially high impact of surface water flooding, there is a growing need to make the best use of available and
emerging science to develop surface water forecasting tools. Effective forecasts at national and local scales are crucial to
saving lives and livelihoods during flood events. Surface water flooding presents a challenge for forecasters because the
events are often very localized, develop quickly and only last for short periods of time. This results in uncertainties around
predicting the location and timing of convective events (Flack, Skinner, et al., 2019). The introduction of convection-
permitting NWP and ensemble forecasts (Golding et al., 2014; Golding, Roberts, Leoncini, Mylne, & Swinbank, 2016)
resulted in a step change in rainfall forecasting capabilities (Clark, Roberts, Lean, Ballard, & Charlton-Perez, 2016). It is
now theoretically possible to forecast surface water flooding in urban areas. However, the probability of occurrence for
any given location is likely to remain low at lead times beyond a few hours (Speight et al., 2018).
SPEIGHT ET AL. 3 of 24
2.1 | A universal framework for surface water forecasting systems
In this review, surface water forecasting systems are considered as an end-to-end framework (see Flack, Skinner,
et al., 2019). They incorporate
1. meteorological observation and forecasting;
2. a form of hydrological or hydrodynamic modeling to calculate flood hazard, which may also include an assess-
ment of potential impact; and
3. postprocessing of the model output and visualizations used to inform the hydrometeorological assessment. This is
then communicated to decision-makers who take action based on the forecast.
This process is illustrated in Figure 1. Previously the main challenge of completing this chain was computational ability
(which still remains significant and should not be taken lightly). Today, however, the main challenges are representing
the uncertainties around the location and timing of the heavy rainfall forecasts, understanding how this uncertainty
propagates through the forecasting chain and impacts decision-making, and communication of the risk to first
responders and the public, particularly when probabilities of impact may remain low until very close to the event.
Beyond the forecasting timeframe presented in Figure 1, validation and verification of forecast models is an essential
component of any forecasting system. The validation and verification of risk-based forecasts is an emerging research
topic in its own right particularly due to the complication that such systems are designed to promote actions to mitigate
the forecasted impacts and challenge of collecting observation data on impacts (Harrowsmith et al., 2020; Robbins &
Titley, 2018). The topic of verification is not explicitly covered in this paper beyond consideration of the potential of
alternative data sources to be used for this purpose.
Before developing a surface water forecasting system, it is important to establish realistic aims for the system that
balance the end-user requirements and the scientific and practicality feasibility (Flack, Skinner, et al., 2019). There are
two recent developments that have been fundamental to making these discussions possible. First, the growth of impact-
based forecasting (e.g., Dale et al., 2014; Harrowsmith et al., 2020; Hemingway & Robbins, 2020; Neal, Boyle, Grahame,
Mylne, & Sharpe, 2014; Potter et al., 2018; World Meteorological Organisation, 2015) has helped focus the attention of
decision-makers on areas with the highest expected impacts. This enables efficient resource management decisions to
be made despite potential high uncertainties in the spatial location of rainfall. Second, there has been a growing accep-
tance of the need for probabilistic forecasts for surface water flood forecasting (Clark et al., 2016; Golding et al., 2014)
and a growing familiarity among decision-makers of using probabilistic forecasts (Arnal et al., 2019; Rabb, Boeing, Shel-
ton, & Birch, 2019). Combined this has resulted in decision-makers improving their skills and confidences in making
decisions under uncertainty.
2.2 | What type of information is needed from a surface water flood forecasting system
to support decision-making?
Fluvial and coastal flood warning systems offer long lead times and bespoke local information for individual at-risk
areas (for details of the UK system see Cranston & Tavendale, 2012; Dale, Davies, & Harrison, 2012, Price et al., 2012;
FIGURE 1 Typical structure of an end-to-end surface water flood forecasting system4 of 24 SPEIGHT ET AL.
Werner, Cranston, Harrison, Whitfield, & Schellekens, 2009). Due to the challenges of forecasting surface water
flooding, the same level of information is not available for pluvial events.
For the purpose of this review, decision-makers are considered to be people who take proactive action based
on the flood forecast. For surface water flooding, action may include clearing trash screens in urban areas, call-
ing in additional staff to respond to incidents, activating community response mechanisms, and installing
property-level protection. Once flooding occurs, reactive actions dominate such as rescuing people and vehicles
from inundated areas or activating pumps (see Dale et al., 2013; Ochoa-Rodríguez, et al., 2018; Rabb et al., 2019
for other examples). Different decision-makers have different requirements from a flood forecasting system.
The actions they take may require different lead times to activate (Kox, Kempf, Lüder, Hagedorn, &
Gerhold, 2018), and they may be willing to act at different levels of probability based on their acceptance of
“acting in vain” (Coughlan de Perez et al., 2016) should an event not occur following the forecast. There is not a
one-size-fits-all solution (Kox et al., 2018; Priest, Parker, Hurford, Walker, & Evans, 2011; Rothfusz
et al., 2018), yet there is a growing need to provide targeted surface water forecasts to support informed
decision-making (DEFRA, 2018; Halcrow, 2011; Ochoa-Rodríguez et al., 2018; Pitt, 2008; Priest et al., 2011;
Rabb et al., 2019; Speight et al., 2018).
The development of impact-based forecasting has shifted the focus away from providing details of “what the
weather will be,” which can be meaningless without further context, to warning of “what the weather will do”
(Harrowsmith et al., 2020); for example, saying there will be fast flowing water, damage to property, or risk to life. Two
recent studies have sought to identify the specific needs of decision-makers at the city and local scale for surface water
flood forecasting in the United Kingdom. Speight et al. (2018) established a steering group of key responders in Glas-
gow, including SEPA, the City Council, Scottish Water, and Transport Scotland. Rabb et al. (2019) surveyed a similar
group of responders in Yorkshire, which included the Environment Agency, multiple city and local councils, Yorkshire
Ambulance Service, and Yorkshire Water. Both groups identified similar end-user requirements from a surface water
flood forecasting system, which were as follows:
1. To focus on the 6–24-hr lead time to enable proactive preparations; with 12 hr seen as a critical forecast horizon
although some organizations such as the emergency services were happy with a 1–2-hr lead time.
2. To provide guidance on event timings, specific locations that might be affected, and possible impacts and
severity.
3. To include relatively low-likelihood but high-impact events to enable proactive low-regret actions to be taken
4. To communicate a stand-down message when the event is over or the risk level reduced.
These priorities are reflected in other European studies and international reviews (Harrowsmith et al., 2020; Zhang
et al., 2019). For example, during workshops with emergency responders about the usefulness of weather warnings
from the German Weather Service (DWD), Kox et al. (2018) identified requirements for details of expected impacts
over relevant temporal and spatial domains; “intensification of warning” messages as an event develops and
expected end time of the event. German emergency responders responsible for proactive preparations required lead
times of over 12 hr, while those such as the fire service who were involved in event response were happy with lead
times of 6 hr or less. In France, the ongoing PICS project (Prévision immédiate intégrée des impacts des crues
soudaines, https://pics.ifsttar.fr/en/), which aims to integrate flash flood models and impact assessment, held a
workshop with end users to identify user priorities for the new model. Again, the priorities were for detailed fore-
casts at a 6-hr lead time with frequent updates and real-time inundation maps showing the expected impact area at
a detailed spatial resolution (PICS, 2018). The findings of the above reviews are of significant value as they highlight
areas for forecasts to focus on and so improve the overall usefulness of surface water flood forecasts within decision-
making.
3 | ADVANCES IN METEOROLOGICAL M ONITORING A ND FORECASTING
Accurate and reliable rainfall observations and forecasts are crucial for effective forecasting of surface water flooding.
Surface water flooding is often caused by small-scale thunderstorms whose magnitude and distribution are difficult to
monitor and predict. As such, rainfall observations and forecasts are thus required at high spatial and temporal
scales.SPEIGHT ET AL. 5 of 24
3.1 | Rainfall monitoring
Rainfall observations can be used either directly in the surface water forecasting system or to provide initial conditions
to improve precipitation forecasts. In the context of surface water flood forecasting, a major challenge for the use of rain
gauge data is maintaining a dense enough spatial coverage of gauges to observe localized intense rainfall. The literature
suggests a density of one gauge per 1 km2 is needed to support accurate urban hydrological modeling and forecasting
(Liguori, Rico-Ramirez, Schellart, & Saul, 2012; Schilling, 1991). In the United Kingdom, the rain gauge network is not
sufficient for this purpose. For example, on 18th July 2017, Coverack (in southwestern England) experienced what is
understood to be one of the most extreme short-duration rainfall events ever seen in the United Kingdom. However,
while 44 properties were flooded and fast flowing water and debris presented a significant risk to life, the nearest Envi-
ronment Agency rain gauge located 8 km away showed no recorded rainfall (JBA Consulting, 2018; Flack, Skinner,
et al., 2019).
Unlike rainfall gauges, rainfall radars can survey large areas and capture the spatial variability of the rainfall.
Radars also provide real-time data and can calculate the motion, intensity, and type of precipitation falling. Modern
dual polarization radars (see Darlington et al., 2016) enable more information about the size and composition of precip-
itation to be captured and processed (Dance et al., 2019; Darlington et al., 2016; Flack, Skinner, et al., 2019). This has
led to improvements in radar-observed rainfall rates either for use directly in rainfall monitoring or as input to forecast-
ing and nowcasting systems. This has enabled more accurate and timely warnings, particularly in very intense rainfall
events.
Despite these improvements, rainfall radar cannot guarantee to capture high intensities and local conditions accu-
rately. There are known issues with radars poorly representing intense rainfall from convective precipitation when hail
forms a part of the precipitation, and this continues to be an active research area for meteorologists. There are also
regions that are not well covered by the existing radar network, for example, the central belt in Scotland (Worsfold,
Norman, & Harrison, 2014). The use of high-resolution X-band radars is starting to be used to improve rainfall detec-
tion in urban flood environments, for example, in Japan (Kimura, Kido, & Nakakita, 2012), Europe (Reinoso-Rondinel,
Bruni, ten Veldhuis, & Russchenberg, 2013), and the United Kingdom (Neely III et al., 2018). In regions of the world
where the radar network is limited or poorly maintained, satellite-observed rainfall products such as EUMETSAT H-
SAF in Europe (Mugnai et al., 2013) or NASA's Global Precipitation Modeling (GPM) mission (Mazzoglio, Laio, Balbo,
Boccardo, & Disabato, 2019) can provide an alternative source of rainfall observations. Satellite data have been used to
develop extreme-rainfall-alerting products, although these are at a coarse temporal and spatial resolution. The potential
of satellite data for improving km-scale model forecasts (as needed for surface water forecasting) is an active research
topic in the World Meteorological Organizations HiWeather program (Zhang et al., 2019).
Another emerging alternative is the use of crowdsourced weather data (Zhang et al., 2019) including from personal
weather stations, vehicles, and smart phones (Hintz et al., 2019). For example, the FloodCitiSense research project
(which can be accessed via https://jpi-rbaneurope.eu/project/floodcitisense/) aims to develop urban pluvial flood early
warning services for, and by, citizens and city authorities in Brussels, Rotterdam, and Birmingham through a network
of low-cost, self-built rain gauges and a new pluvial flooding app.
3.2 | Numerical weather prediction
NWP uses mathematical models of the atmosphere to predict future precipitation based on current weather conditions.
Current weather observations are input to the models through a process known as data assimilation, which is a tech-
nique where observational data from different sources are processed and adjusted. The aim of data assimilation is to
provide as close to initial conditions as possible (Asch, Bocquet, & Nodet, 2016). The different sources of data typically
include recent measurements of precipitation and a previous forecast valid at the same time the measurements are
made (Dance et al., 2019). The development of convection-permitting NWP models has necessitated international
research efforts in data assimilation over the past few years (Dance et al., 2019; Flack, Skinner, et al., 2019; Hintz
et al., 2019). Unlike large-scale models that rely on some form of parametrisation process to add in convective features,
convection-permitting NWP models can represent convective structures directly (Clark et al., 2016). To do this well,
existing convective features need to be represented in the initial conditions.
One example of a world-leading convection-permitting NWP model is the UK Met Office UKV model. Its current
configuration provides forecasts on a 1.5-km grid across the United Kingdom for up to 120 hr ahead (5 days) with6 of 24 SPEIGHT ET AL.
frequent updates for up to 54 hr ahead (https://www.metoffice.gov.uk/research/approach/modelling-systems/unified-
model/weather-forecasting). The UKV model can produce very realistic looking showers, which is a considerable
improvement over larger-scale model configurations (Clark et al., 2016). While the development in precipitation fore-
casting has led to a significant improvement in the ability of hydrometeorologists to forecast surface water flooding, the
size of typical convective features is smaller than the 1.5-km grid length, meaning that showers (especially small rain
showers) are still under-resolved (Clark et al., 2016).
3.2.1 | Nowcasting
Nowcasting is the term given to weather forecasting on a very short-term period of 0–6 hr. It uses surface weather
station data (radar echo maps and rain gauge data), wind profiler data, and any other weather data available blended
with NWP models. The value of nowcasts is their ability to represent the development of convective rainfall features
over small areas and short lead times (Liguori & Rico-Ramirez, 2014). As the reliability of nowcasts improves so will
the reliability of short-term surface water flood forecasting.
One example that shows the potential of this approach is the development of the UK Met Office very short-range
forecasts system. The system, known as NIMROD, was first developed in the mid-1990s (Golding, 1998). Ten years later,
a stochastic element was introduced known as the Short-Term Ensemble Prediction System (STEPS) that allowed fea-
tures smaller than the NWP resolution to be represented while also representing the spatial and temporal uncertainty
of such features (Bowler, Pierce, & Seed, 2006).The STEPS system is discussed here as it was developed in conjunction
with the Australian Bureau of Meteorology and has been integrated into other operational nowcasting system, for
example, in Belgium (Foresti, Reyniers, Seed, & Delobbe, 2016). It, therefore, provided a good example of an interna-
tionally recognized system. Other countries have also developed ensemble nowcasting systems, for example, in Switzer-
land (Sideris, Foresti, Nerini, & Germann, 2020) and the Netherlands (Heuvelink, Berenguer, Brauer, &
Uijlenhoet, 2020). A Nowcast Demonstration Project for the 2012 Olympics developed hourly cycling, 1.5-km resolution
nowcast with four-dimensional variational data assimilation (4D-Var). The skill of the Nowcast Demonstration Project
was shown to be greater than the UKV NWP forecast for the 6-hr nowcast period and better than the operational
nowcast at times beyond T + 2 hr (Ballard, Li, Simonin, & Caron, 2015). Work is ongoing to implement the 4D-Var
nowcast system for the whole of the United Kingdom. Despite these improvements, comparisons between the Nowcast
Demonstration Project, the STEPS nowcast, and the UKV forecast all showed issues forecasting light, scattered showers
(Clark et al., 2016) illustrating the ongoing forecasting challenge. The Met Office “seamless” Unified Model harnesses
the relative advantages of nowcasts and high-resolution NWP by blending from forecasts heavily weighted on observa-
tions at T + 0, through nowcasts, to forecasts heavily weighted toward the high-resolution NWP model at T + 6 hr (Met
Office, 2018). A similar approach to forecasting high-impact weather events from minutes to days in advance is being
developed through the Forecasting a Continuum of Environmental Threats (FACETs) project in America (Rothfusz
et al., 2018).
3.2.2 | Probabilistic forecasting
Convection-permitting forecasts are known to be sensitive to uncertainties in the initial conditions, boundary condi-
tions, and physical processes (Hagelin et al., 2017). It is largely accepted that it is not possible to rely on deterministic
forecasts of convective rainfall at a grid scale and a probabilistic approach is needed (Clark et al., 2016; Golding
et al., 2014).
Ensemble (or probabilistic) forecasts comprise a set of forecasts using slightly different input conditions or varying
the representation of physical processes to account for uncertainty (Box 1). Ensemble predictions are commonly made
at the major operational weather prediction facilities worldwide. For example, the German COSMO-DE-EPS model
runs on a 2.8-km resolution with 30 members providing a 21-hr lead time eight times a day, and Meteo France runs a
2.5-km ensemble with 12 members twice a day (Hagelin et al., 2017). The UK Met Office Global and Regional Ensemble
Prediction System (MOGREPS-UK) provides an ensemble of short-range convective-scale NWP forecasts (Bowler
et al., 2006; Hagelin et al., 2017). The MOGREPS-UK system has been running since 2012. It provides a 54-hr-lead time,
12-member ensemble forecast based on the UKV model at a 2.2-km resolution. As computational power increases it will
be possible to further increase the ensemble size, resolution, domain size, and forecast length of ensemble forecasts.SPEIGHT ET AL. 7 of 24
BOX 1 ENSEMBLE FLOOD FORECASTING
The development of surface water flood forecasting is linked to wider developments in ensemble forecasting.
Ensemble (or probabilistic) forecasts comprise a set of forecasts using slightly different input conditions or vary-
ing the representation of physical processes to account for uncertainty. In an EPS, each forecast run is equally
likely to occur and represents a different possible rainfall scenario. Considering the full ensemble provides a
range of possible future outcomes and allows forecasters to assess the probability of different scenarios. This
contrasts with a deterministic forecast, which produces one single best estimate prediction.
The use of ensembles in flood forecasting has been continually reviewed in the academic literature
(Cloke & Pappenberger, 2009; Emerton et al., 2016; Pagano et al., 2014; Wu et al., 2020). The majority of studies
to date have focused on forecasting of flooding associated with fluvial processes at the catchment scale for lead
times of up to 15 days rather than short-duration surface water events. The most recent example by Wu
et al. (2020) reviewed 70 papers on ensemble flood forecasting between 2001 and 2019 and found urban
flooding was the focus of only 12 of these papers (including flash flooding in small urban catchments). Of all
70 papers reviewed, worryingly, only 30% considered the application of ensemble flood forecasting to solve real-
world problems. The use of probabilistic forecasting is increasingly considered essential to produce useful sur-
face water flood forecasts.
Decisions need to be made about how best to optimize the use of computational resource to support forecasting.
Hagelin et al. (2017) showed more benefit in running a larger-member ensemble for MOGREPS-UK (24 opposed to 12)
over increasing the model resolution. Since 2017, the MOGREPS-UK system has been increased to 18 members using a
time-lagging technique with a 120-hr lead time. It is also able to provide hourly updates (compared to the previous
6 hourly updating cycle), which allows close monitoring of the development of convective showers (latest configuration
details for MOGREPS-UK are given here https://www.metoffice.gov.uk/research/weather/ensemble-forecasting/
mogreps).
Studies have shown that the predictability of convective precipitation depends on whether it is controlled by large-
scale or local factors (Flack, Gray, Plant, Lean, & Craig, 2018). Flack et al. found that for 85% of convective precipitation
events in the United Kingdom, the convection-driving process resulted in scattered showers (rather than organized con-
vection) and displayed relatively large uncertainty in the rainfall locations but higher confidence in the total rainfall. In
contrast, the other 15% showed confidence in the location of the rainfall but lack of confidence in the amount (Flack
et al., 2016, 2018; Flack, Gray, & Plant, 2019; Flack, Skinner, et al., 2019). The limited number of ensemble members in
an operational convective-permitting ensemble prediction system (EPS) means that in these situations the ensemble
may not capture the full range of uncertainty. Understanding the limits of predictability of convection-permitting NWP
enables hydrometeorologists to make informed assessments of forecast skill in different weather situations. This is par-
ticularly important when ensemble rainfall forecasts are being used further down the chain, for example, to drive flood
inundation and impact assessments (e.g., in Cole et al., n.d. and Speight et al., 2018 and other approaches described in
Section 4).
3.2.3 | Postprocessing
Postprocessing is defined as the processing of data after other processes have been completed. Postprocessing converts
rainfall predictions from forecasting systems (i.e., ensemble NWP model outputs and nowcasting outputs) into forecast
products. They add value to the raw data, correcting bias and producing forecasts that reliably quantify uncertainty.
Postprocessing for intense rainfall is particularly challenging due to the small-scale nature of the features of interest
(Clark et al., 2010; Leoncini, Plant, Gray, & Clark, 2013). This means that probabilities for specific locations will remain
very low and may not alert meteorologists or flood forecasters to the risk of an event, and may remain below the proba-
bility threshold at which decision-makers are willing to take action (Golding et al., 2016; Kox, Gerhold, &
Ulbrich, 2015). To help account for this, neighborhood processing is often used to search for events within a spatial and
temporal search window that could be considered equally likely to occur anywhere within the window (see Golding8 of 24 SPEIGHT ET AL.
et al., 2016 for a description of the process). This process changes the low point probabilities of occurrence to show
higher probabilities of an event occurring somewhere within the specified spatial area or temporal time frame. The
neighborhood sampling technique removes some of the noise of the result and effectively increases the ensemble size.
The noise is a result of the ensemble not being large enough to convey the uncertainty in the process (Hagelin
et al., 2017). The use of different postprocessing techniques can influence how forecasts are presented and hence how
decisions are made. Hydrometeorologists need to understand the postprocessing method and ideally be involved in dis-
cussions around what metrics, time frames, and neighborhood sizes are most useful for their purpose. Flack, Skinner,
et al. (2019) and Speight et al. (2018) report on research projects where this has successfully occurred.
3.3 | The future of convection-permitting NWP for surface water flood forecasting
The introduction of convection-permitting NWP models has led to a step change in the ability to forecast the type of
rainfall events that lead to surface water flooding. However, although the output from the models looks realistic, users
need to remain mindful that NWP at a 1.5-km resolution is unable to accurately forecast the timing and location of con-
vective rainfall. Although ongoing scientific developments will improve the skill of the forecasts, there is likely to
remain a limit to the deterministic predictability of convective rainfall. Golding (2009), (also discussed in Speight
et al., 2018) estimates this to be 3 hr ahead for a 10-km by 10-km rainstorm and just 30 minutes ahead for the most
intense 1-km by 1-km part of the storm. The use of probabilistic forecasts is therefore essential to support surface water
flood forecasting. The interpretation of probabilistic forecasts requires user expertise. It is known that in some situations
the skill of the forecast is better than others. The interpretation of probabilistic forecast also requires knowledge of the
postprocessing technique as this can have a large influence on how the probability of heavy rainfall is presented.
This review has focused on the scientific developments in convection-permitting NWP. Alongside this, there have
also been rapid developments in computational capacity and data availability, which have been essential to support the
forecasting science. We cannot expect processing power to continue to increase at the rate required to support the grow-
ing requirements of NWP (Bauer, Thorpe, & Brunet, 2015). Instead, we need to make more use of both parallel comput-
ing and new forecasting techniques, for example, machine learning. One example of this is Google's development of
MetNet (Sønderby et al., 2020). MetNet is a neural network that forecasts precipitation up to 8 hr into the future at the
high-spatial resolution of 1 km2. It has been shown to outperform traditional NWP forecasts in the United States for
these short-lead time forecasts. Machine learning approaches such as this will emerge from the research arena in the
near future and offer much potential to address some of the challenges of surface water forecasting. As concluded by
Clark et al. (2016, p178) “the current state of the art [of convection-permitting NWP] represents a beginning, not a con-
clusion, and it is anticipated that many advances in various directions will be possible in the future.”
4 | APPROACH E S TO S U R FACE WA T E R F L O O D F O R E C A ST I NG
In their scoping review of potential options for surface water flood forecasting and warning for the United Kingdom,
Priest et al. (2011) presented a spectrum of possible approaches ranging from simple rainfall-based alerts at large scales
to more complex and targeted impact-based flood warnings at local scales. In this updated review, we examine the
models and forecasting systems that have been developed over the past 10 years to support operational surface water
flood forecasting. Multiple approaches have developed based on different forecasting scales, end-user needs, and data
and resource availability. Broadly based on Henonin, Russo, Mark, and Gourbesville (2013) who classified available
approaches based on the use (or not) of hydraulic models, our review is structured using a three-type classification of
real-time flood forecasting systems as follows:
1. Empirical-based scenarios: Surface water flood forecasting based on observed or forecast rainfall scenarios, typi-
cally based on historical data and evidence of pluvial flooding
2. Hydrological forecasting linked to presimulated impact scenarios: Real-time flood forecasts using hydrological
modeling with warning triggers based on scenarios or results catalogue built from offline hydraulic simulations,
applied at either a national or regional scale
3. Hydrological forecasting linked to real-time hydrodynamic simulations at the urban scale: Real-time operation
and simulation of hydraulic model(s).SPEIGHT ET AL. 9 of 24
FIGURE 2 Conceptual approaches to surface water flood forecasting
BOX 2 RISK BASED FORECASTING
Instead of just reporting the expected inundation area, risk-based flood forecasts combine information about
the probability of an event and the severity of potential impacts. Flood forecasting in the United Kingdom, par-
ticularly at national scales, is increasingly risk-based. The UK Met Office National Severe Weather Warning
Service (NSWWS), the FFC (for England and Wales), and the Scottish Flood Forecasting Service (for Scotland)
communicate the flood risk for all sources of flooding using a matrix of impact and likelihood. The overall flood
risk could be reported as “medium” for both a forecast showing a high probability of significant impacts or a
forecast showing a low probability of severe impacts. Further details of the flood risk matrix are available here
http://www.ffc-environment-agency.metoffice.gov.uk/services/FGS_User_Guide.pdf.
Figure 2 presents the conceptual approaches to surface water flood forecasting in a systematic diagram. The output
from each system can range from a simple alert that flooding is possible to a full-risk-based forecast incorporating
assessment of both the probability of an event occurring and the likely impacts (Box 2).
4.1 | Empirical-based threshold scenarios
The use of precalculated rainfall thresholds to identify the risk of pluvial flooding is a quick means of postprocessing
NWP output, radar rainfall rates or gauged data to support decision-making. Depth–duration thresholds are set based
on existing knowledge of the amount of rainfall falling within a specified time period or water level that could cause
flooding impacts. The thresholds are then validated against observed events. Due to their low development and running
costs, such systems are in widespread use.
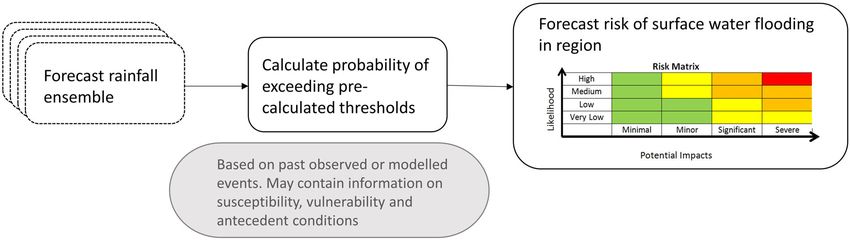
The simplest form of such systems (Figure 3) can be found at city and local scales. For example, in Bonn in Ger-
many, water levels in a local stream are continually monitored and sent in real time to the fire brigade who issue a
warning if the specified thresholds are exceeded (Hofmann & Schüttrumpf, 2019). Acosta-Coll, Ballester-Merelo,
Matrinez-Peiro, and De la Hoz-Franco (2018) describe other examples of systems from across the world where simple
triggers linked to rain gauges, radar systems, or sewer sensors provide pluvial flooding alerts directly to the authorities
or the public usually through web apps or mobile phones. Accepting that the density of formal discharge and rainfall
gauges is not always sufficient to support such systems, there is a strong link between the developments of local
threshold-based systems and crowdsourced or community data (see Section 5). Since these local systems are based on
observed rainfall or flow, they offer limited lead time to prepare for surface water flooding. However, they do provide10 of 24 SPEIGHT ET AL.
FIGURE 3 Schematic of a local-observed empirical-based system for surface water flood forecasting
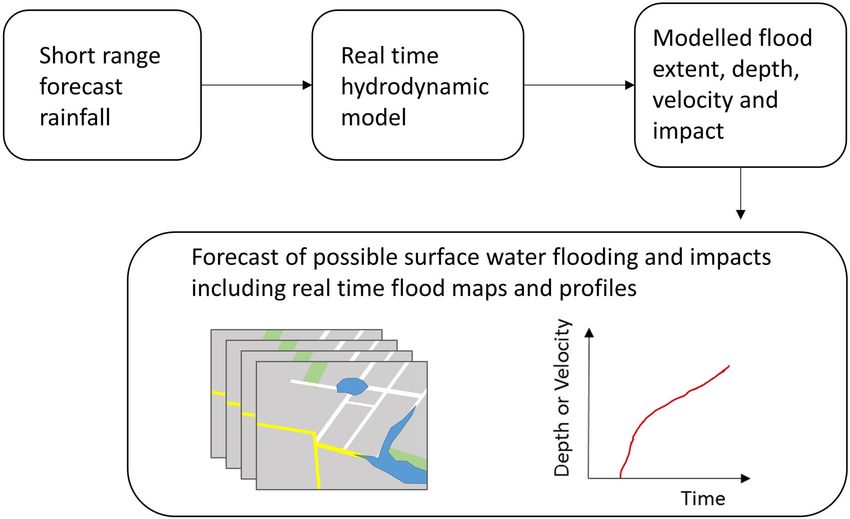
FIGURE 4 Regional ensemble forecast empirical-based system for surface water flood forecasting
an opportunity for increased community-level awareness and encourage individuals to be proactive in taking actions to
reduce their own flood risk (Starkey et al., 2017).
At national scales, precalculated threshold systems can be used to identify regions of the country most at risk of sur-
face water flooding based on forecast rainfall. Where an ensemble forecast is used as input this enables a risk-based
forecast to be produced as shown in Figure 4.
Using forecast rainfall in flood forecasting increases the available lead time but reduces the spatial fidelity and
hence the regional application. The UK Met Office refers to the use of this type of threshold system as a “first-guess
early warning” and uses it for multiple weather-driven hazards (Neal et al., 2014). The complexity of such systems has
evolved alongside developing rainfall forecasting capabilities and understanding of surface water hazard and impact.
For example, France has developed a system called Vigiecrues Flash (Javelle et al., 2016; Javelle, Saint-Martin, Gar-
andeau, & Janet, 2019) that combines a simple 1 km2 distributed hydrological model for rivers, with radar rainfall to
identify rivers exceeding high-impact or very-high-impact thresholds (associated with return period). It is aimed at flash
flooding in ungauged catchments but is also a surrogate for identifying the potential for pluvial flooding in communi-
ties (Dermagne & Javelle, personal communication, 2019). The United States has had a flash flood guidance system
warning of flooding in small river basins from rainfall of less than 6-hr duration since 1971 (Mogil, Monro, &
Groper, 1978). Recognizing that flash flooding occurs on smaller scales, the Flash Flood Potential Index was developed
to determine the gridded susceptibility of flooding (Clark, Gourley, Flamig, Hong, & Clark, 2014; Gourley, Hong, &
Wells, 2012). Further developments to this system are ongoing through the FACETS research program. The program
aims to deliver detailed hazard information through the use of “threat grids” and will be applied to severe convective
and flash flooding events. Currently, the approach to flash flood guidance in the United States is “warn on detection”;
however, the new approach of “warn on forecast” will combine satellite, NWP, and radar data to forecast the future
track of severe convection (Rothfusz et al., 2014, 2018).
In the United Kingdom, the first system for surface water flooding was the extreme rainfall alert (ERA) system
introduced by the UK Met Office and the Environment Agency in 2009 (Hurford, Priest, Parker, & Lumbroso, 2012;
Priest et al., 2011). The service was based on the likelihood of exceeding depth–duration thresholds for a 30-year return
period event, but it did not consider surface–subsurface processes or vulnerability (Pilling et al., 2016). In 2010, the
Flood Forecasting Centre (FFC) launched the Surface Water Flooding Decision Support Tool (SWFDST) for England
and Wales. Details of the SWFDST are given by Pilling et al. (2016) and Ochoa-Rodríguez, Wang, Thraves, Johnston,SPEIGHT ET AL. 11 of 24
and Onof (2018). The SWFDST is a more targeted system than the ERA as it takes account of urbanization and anteced-
ent conditions. It uses forecast rainfall from MOGREPS-UK to assess the probability of exceeding six different rainfall
thresholds (for different durations and severities). This is then combined with information on the soil moisture deficit,
the rainfall spatial extent, and potential impacts on the ground based on 1 km2 from static flood risk maps. Each county
is assigned a surface water flooding risk category of very low, low, medium, or high.
While threshold-based approaches such as these are valuable (particularly at broad scales), there appears to be lim-
ited confidence in the use of this type of system as a standalone approach. Instead, they are usually used alongside other
sources of information, including expert judgment, to inform end-user facing products (Rothfusz et al., 2018). For exam-
ple, the chief forecaster has the capability to vary the thresholds used in the UK Met Office system to account for vary-
ing seasons or antecedent conditions (Neal et al., 2014). Similarly, Cole, Moore, Aldridge, Lane, and Laeger (2013) state
the SWFDST is used alongside “expert judgment and feedback from local Environment Agency flood teams, public
weather service civil contingency advisers, and the Met Office chief forecaster to produce the surface water flooding ele-
ment of the FGS.” The reasons for this include concerns about uncertainty due to the relatively small ensemble sizes,
the need to maintain consistency with other products, offline inclusion of hydrological and hydraulic processes rather
than just a rainfall-based assessment, and a need to be able to vary thresholds to account for changes in vulnerability of
antecedent conditions.
4.2 | Hydrological forecasting linked to presimulated impact scenarios
Thanks to the development of surface water flood risk mapping activities in recent years (De Moel, Van Alphen, &
Aerts, 2009), the use of presimulated scenarios for flood forecasting is becoming an acceptable compromise between
benefiting from the detail available from detailed hydraulic inundation mapping and allowing a direct link to the
assessment of impacts while reducing the operational computation time. There are examples at a city scale (Speight
et al., 2018), at regional scales (Cole et al., n.d.), at national scales (Saint-Martin, Fouchier, Javelle, Douvinet, &
Vinet, 2016; Saint-Martin, Javelle, & Vinet, 2018), and at international scales (Dottori et al., 2017). The approach is
based on the assumption that a link can be made between the real-time forecasting model and the static inundation
and impact assessment. For example, in Speight et al. (2018) and Cole et al. (n.d.), the assumption is made that the
effective rainfall used to produce the static flood maps is equivalent to the surface runoff from the real-time hydrologi-
cal model. This enables the most appropriate flood and impact maps from a library of static maps to be selected based
on the forecast rainfall scenario as per Figure 5. A strength of this approach is that the spatial variability of rainfall can
be accounted for by selecting a different hazard map and associated impacts for each grid cell (Aldridge et al., 2020).
Repeating this process for each ensemble members gives the probability of impact exceeding a given threshold within
each grid cell and thus overall flood risk (Speight et al., 2018).
The success of the approach relies on (a) the quality of the original hydraulic inundation modeling, (b) the represen-
tation of urban drainage capacity, and (c) having a large enough library of events (in terms of return periods and event
durations) to be able to reflect the varying response to the forecast rainfall event. Unlike the threshold scenario
approaches (Section 4.1), the spatial variability of rainfall is accounted for by linking forecast rainfall and effective rain-
fall at a grid cell level as well as the spatial variability of impacts using spatial impact databases. The use of a real-time
hydrological model allows the incorporation of antecedent conditions. Using a library of inundation maps and impact
assessments allows for full consideration of rainfall forecast ensembles rather than focusing only on deterministic fore-
casts or short-range nowcasts. The static inundation maps and impact assessments have often been made at a finer reso-
lution than the predictability of the forecast rainfall; therefore, consideration must be made of an appropriate reporting
scale that meets end-user needs but also reflects the uncertainty in forecasts of convective rainfall.
Speight et al. (2018) discuss the operational experience of using a city-scale surface water forecasting model during
the summer of 2014 (in particular for the Commonwealth Games held in Glasgow, Scotland). The output from the city-
scale forecasting system was challenging to communicate due to the low probabilities of impact for the specific areas of
interest to end users. This also led to a challenge of maintaining a consistent message between the Glasgow city-scale
forecast and the national flood guidance and weather warnings. For example, on one occasion, the national flood guid-
ance statement highlighted a risk of surface water flooding across south west Scotland, but the Glasgow forecasts identi-
fied that the chance of any impact in Glasgow itself was very low. A high level of hydromet staff time was found to be
needed to interpret and communicate the output from the Glasgow surface water forecasting pilot (Speight et al., 2018).
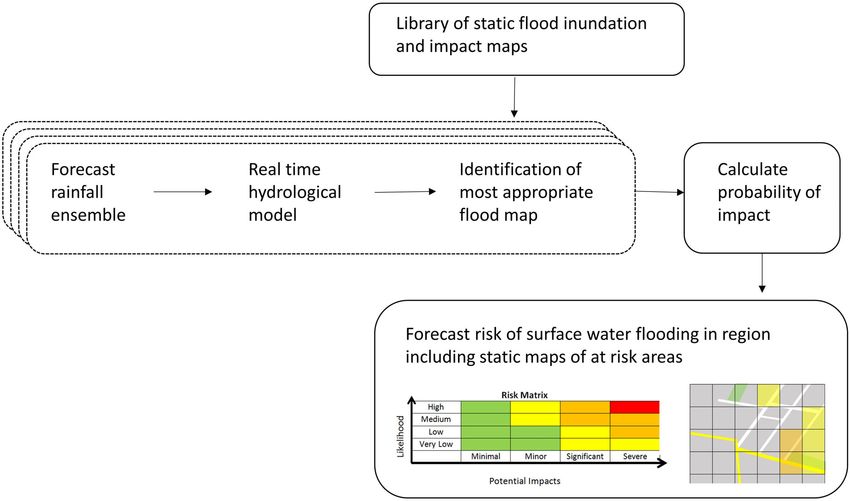
In parallel to the Glasgow trial, the FFC has developed a similar system to forecast surface water flood risk (Cole12 of 24 SPEIGHT ET AL. FIGURE 5 Hydrological forecasting linked to presimulated impact scenarios for surface water flood forecasting (based on Speight et al., 2018) et al., n.d.). This system incorporates static flood inundation and impact maps at a 1-km resolution but mitigates the challenge of low small-scale probabilities by aggregating the forecast up to a regional scale to inform the national flood guidance statement support (see Gunawan and Aldridge (2016) and Aldridge et al. (2020) for details of the method and development of the supporting impact databases). Rabb et al. (2019) explored through a flood exercise how this addi- tional detail on risk, presented at different spatial and temporal scales, might be used by decision-makers. Echoing the findings of Arnal et al. (2019), Rabb et al. reported a “degree of caution” (p. 28) over the usefulness of new enhanced information over existing data sources, particularly where full training had not been given on how to use the new prod- ucts. More technical users did find it a helpful addition to the existing flood forecasting information available, but, like Speight et al. (2018), cited the need for expertise and local knowledge to interpret and communicate the forecasts successfully. 4.3 | Hydrological forecasting linked to real-time hydrodynamic simulations Moore et al. (2015) concluded that due to run time constraints, there were limited linked hydrological and hydrody- namic models that had the potential to run in real time and those that could potentially be used in this way had not been developed with continuous updating of the system states in mind (Moore, Bell, Cole, & Jones, 2007; Speight et al., 2018). As computational power has increased over the past few years and cloud computing and graphical processing units (GPUs) have developed rapidly, these new technologies have emerged as a realistic and affordable way to run computationally demanding surface water flooding models in less time (see Flack, Skinner, et al., 2019; Glenis, Kutija, & Kilsby, 2018; Xia, Liang, Ming, & Hou, 2017). The benefit of real-time hydrodynamic simulations is the ability to directly model the forecast spatial variability of rainfall on inundation and impacts at a city scale. Another potential benefit is the ability to set thresholds based on the velocity of flow as this is known to be important when considering a danger to people, movement of vehicles, or damage to property (Hofmann & Schüttrumpf, 2019). Despite the growing potential of real-time hydrodynamic simulation, the run time remains a barrier to use. In Germany, a research project compared the runtime for a hydrodynamic pluvial flooding model of a 36-km2 area of the city of Aachen on a 1–3-m grid and showed that the computational time using the GPU was 10.5 times faster than a standalone CPU, but at 4,610 and 439 min, respectively (Hofmann & Schüttrumpf, 2019), neither would be suitable for operational surface water
SPEIGHT ET AL.                                                                                                               13 of 24

FIGURE 6         Hydrological forecasting linked to real-time hydrodynamic simulations for surface water flood forecasting

forecasting. In this instance, Hofmann and Schüttrumpf (2019) envisage a multifunctional system whereby full hydro-
dynamic simulations are used to understand more about the flood hazard and validate the model, but a presimulated
library of flood inundation maps (as per Section 4.2) is used in real time.
    The use of real-time hydrodynamic models is currently possible at shorter lead times and without using a full
ensemble of forecast rainfall (Figure 6). Flood nowcasting refers to forecasting urban flooding in real-time using the
rainfall nowcast as input to a city-scale hydrodynamic model. This term was first coined by Willems, Delobbe, and
Reyniers (2016) who describe an application in Ghent, Belgium, using the probabilistic STEPS nowcast as input. In the
United Kingdom and China, FloodMap-HydroInundation2D (Yu & Coulthard, 2015) has been used to provide high-
resolution flood mapping at a street-level resolution (2–50 m). FloodMap integrates surface water runoff modeling with
a simplified representation of sewer surcharge in an urban area and also represents hydrological inflow to the urban
area from multiple upstream sources. The flood nowcasting system was originally developed to help identify access
routes for emergency responders during flood events in Leicester using rainfall input from the Met Office 6-hr nowcast
(Green et al., 2017) and illustrates a good example of developing a workable solution in partnership with end users. The
system has been well received, the Chief Constable of Leicestershire Police said, “It's passed the ultimate test for me
which is its met the real people, who do the real stuff, who will be up to their ankles and knees in water at the time,
and they thought it was useful” (Loughborough University, 2017).
    Although there is now the emerging potential to use real-time hydrodynamic simulation at the urban scale, there
remains a key research question around how much detail can decision-makers use effectively on an operational time-
scale, given the computational costs involved. Like the presimulated inundation scenarios, real-time hydrodynamic
modeling also has the potential to display results at a more detailed resolution than is appropriate, given the known
uncertainty in the rainfall forecasts.

4.4 | Machine learning

In addition to the approaches identified in Figure 2, machine learning and artificial intelligence models offer a means
of reducing simulation times by seeking to extract significant patterns in large historical data sets and use these patterns
to make predictions about the future (Chang et al., 2019). They are becoming popular with hydrologists
(Wu et al., 2020) and could provide a valuable means of linking ensemble rainfall forecasts with inundation and impact
maps. For example, Chang et al. (2019) describe an intelligent hydroinformatics integration platform that utilizes the
14 of 24 SPEIGHT ET AL.
Google Maps interface to provide real-time flood-related information such as rainfall data and regional flood inundation
maps in the Tainan city of Taiwan. However, “the current state of Machine Learning modelling for flood prediction is
quite young and in the early stage of advancement” (Mosavi, Ozturk, & Chau, 2018). To fully understand their potential
requires close cooperation between hydrologists and machine learning specialists (Mosavi et al., 2018). In our opinion,
the operational uptake of machine learning approaches is likely to be further delayed by concerns about using new
types of models (Arnal et al., 2019), a general mistrust of “black box”-type approaches in hydrology (Wu et al., 2020)
and the need for observed inundation data to train the models on (Chu, Wu, Wang, Nathan, & Wei, 2020). Machine
learning approaches have not been considered further in this paper as the authors are not aware of any operational
machine learning approaches to surface water flood forecasting.
4.5 | Comparison of surface water forecasting approaches
Tables 1–3 provide a comparison of the advantages and disadvantages of the operational flood forecasting methodologi-
cal approaches reviewed in this paper, including comments on the operational challenges of each. The selection of the
most suitable approach for particular applications will depend on the requirements and budget of the operational orga-
nization for development and delivery.
Empirical-based rainfall scenarios (Table 1) are widely used and provide a good “first-guess” early warning of the
potential for surface water flooding. Recent improvements to convection-permitting NWP have improved their reliabil-
ity; however, they do not take account of real-time changes to vulnerability and cannot provide details at the local scale.
In most cases, they are used alongside other sources of information. There is potential to link empirical-based solutions,
which can provide early warnings at lead times of up to 5 days, with local sensor-based systems to provide updated local
warnings at lead times of less than 6 hr.
Hydrological forecasting linked to presimulated impact scenarios (Table 2) is becoming popular for both surface
water and fluvial flood forecasting at a range of scales. This approach provides a compromise between incorporating
the spatial and temporal variability of rainfall and impacts with limited computational resources. By using a
presimulated impact scenario approach, it is possible to provide a fully risk-based forecast 5 days in advance. At a
national scale, this approach has been shown to provide a more targeted forecast than empirical-based rainfall scenarios
alone. The approach is sensitive to the way that impact and probability thresholds are calculated, which can result in
reporting inconsistencies between scales.
While hydrological forecasting linked to real-time hydrodynamic simulations at the urban scale (Table 3) potentially
enables a fully hydrodynamic real-time simulation of rainfall, inundation, and impact, it remains an emerging
TABLE 1 Advantages, disadvantages, and operational challenges of forecasting surface water flooding using empirical-based rainfall
scenarios
Advantages Disadvantages Operational challenges
• Low development and • Systems using deterministic forecasts provide no account of • Usually used alongside other
computational costs uncertainty approaches
• Quick to use • Probabilistic systems are reliant on postprocessing that can • Usually require expert
• Probabilistic approaches make them difficult to interpret knowledge and experience to
possible • Thresholds are static and do not take account of interpret
• Allows immediate use of hydrological or hydraulic process or changes in • Maintaining consistency across
improvements to NWP vulnerability multiple products
• Continual validation against • Trigger-based systems using observed rainfall or water level
observed events possible offer limited lead times
• At a local scale, can
encourage community
engagement
Note: Operational examples - UK Flood Forecasting Centre Extreme Rainfall Alert (Hurford et al., 2012, Priest et al., 2011), UK Flood Forecasting Centre
Surface Water Flooding Decision Support Tool (Pilling et al., 2016), UK Met Office MOGREPS-W system to inform the National Severe Weather Warning
Service (Neal et al., 2014), USA Flash Flood Guidance System (Clark et al., 2014; Gourley et al., 2012), French Vigicrues Flash System (Javelle et al., 2019), and
Local trigger-/sensor-based warning systems (Acosta-Coll et al., 2018).You can also read