Farm Management Support in Denmark - A Case Study European Association of Remote Sensing Companies - Earsc
←
→
Page content transcription
If your browser does not render page correctly, please read the page content below
European Association of Remote Sensing Companies

                         Sentinels Benefits Study (SeBS)

                            A Case Study
 Farm Management Support in Denmark
                                  March 2018

SeBS-CR-001                            Page 1                    March 2018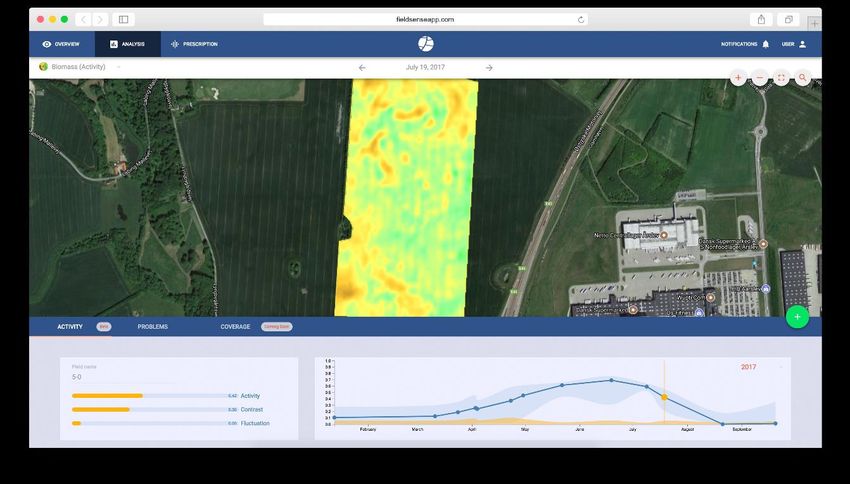
Client:                  ESA
 Client Representative:
                          Alessandra Tassa
 Date of Delivery:        February 2018
 Version:                 02
 Author(s):               Geoff Sawyer (EARSC)
                          Marc de Vries (The Greenland)
                          Nikolay Khabarov (IIASA)

 Reviewer                 Alessandra Tassa (ESA)

              Version                   Date                                     Comment

 01                          December 2017                       First Draft

 02                          January 2018                        Revisions to structure

 03                          February 2018                       Final Editing

 Final                       March 2018                          First Issue

For more information contact:
   • EARSC: info@earsc.org
   • ESA: Alessandra.Tassa@esa.int

Funded by the EU and ESA - ESA Contract Number: 4000119743/17/I-SBo.
The views expressed herein can in no way be taken to reflect the official opinion of the European
Space Agency or the European Union.

SeBS-CR-001                                    Page 2                                     March 2018
Table of Contents
Setting the Scene: ....................................................................................................................................... 5

1       Introduction & Scope .......................................................................................................................... 6

2   Farming in Denmark ............................................................................................................................ 8
2.1   Overview................................................................................................................................................ 8
2.2   The Agriculture Industry in Denmark .................................................................................................... 9
2.3   Farm Management Practices and Challenges in Denmark .................................................................. 12
2.4   The Socio-environmental Context. ...................................................................................................... 13
2.5   Organic Foods ...................................................................................................................................... 17

3   The Use of Satellite data. .................................................................................................................. 19
3.1   Summary.............................................................................................................................................. 19
3.2   The Service - Fieldsense....................................................................................................................... 19
3.3   The Role of the Satellite Data .............................................................................................................. 22

4   The Value Chain ................................................................................................................................ 25
4.1   Description of the Value-chain ............................................................................................................ 25
4.2   Value-Chain Actors & Other Stakeholders .......................................................................................... 26
4.2.1      Service Provider (Tier 1) ........................................................................................................................................ 26
4.2.2      Farmers, Agronomists, Consultants (Tier 2) .......................................................................................................... 27
4.2.3      Farm Machinery, Agro-chemical businesses (Tier 2 & 3) ...................................................................................... 29
4.2.4      Livestock farms, Food Processors (tier 3) ............................................................................................................. 30
4.2.5      Supermarkets (tier 4) ............................................................................................................................................ 31
4.2.6      Water Supply Companies (tier 4) .......................................................................................................................... 31
4.2.7      General Public / Consumers (tier 5) ...................................................................................................................... 31
4.2.8      Other Stakeholders ............................................................................................................................................... 32

5   Assessment of the Economic Benefits ............................................................................................... 34
5.1   The Service Provider (Tier 1) ............................................................................................................... 34
5.2   Farmers, Agronomists & Consultants (Tier2) ...................................................................................... 35
5.2.1      Generic Parameters .............................................................................................................................................. 35
5.2.2      Technical Capability .............................................................................................................................................. 36
5.2.3      Benefits for the Farmers. ...................................................................................................................................... 36
5.2.4      Market adoption potential ................................................................................................................................... 38
5.2.5      Total Benefits to Farmers (actual and potential) .................................................................................................. 39
5.2.6      Other Tier 2 Factors .............................................................................................................................................. 39
5.3        Farm Machinery, Agro-chemical businesses (Tier 2 & 3) .................................................................... 40
5.4        Livestock Farms, Food Processors (tier 3) ........................................................................................... 40
5.5        Supermarkets (tier 4) ........................................................................................................................... 40
5.6        Water Supply Companies (tier 4) ........................................................................................................ 40
5.7        General Public / Consumers (Tier 5) .................................................................................................... 41
5.8        Other Stakeholders. ............................................................................................................................. 41
5.8.1      Danish Agriculture Agency .................................................................................................................................... 41
5.8.2      Danish Environmental Protection Agency ............................................................................................................ 42

6   Conclusions ....................................................................................................................................... 43
6.1   Summary of Findings : Benefits to Denmark ....................................................................................... 43
6.2   The Impact of Sentinel Data ................................................................................................................ 46

SeBS-CR-001                                                                          Page 3                                                                    March 2018
6.3       Widening the Perspective.................................................................................................................... 47
6.4       Final Thoughts ..................................................................................................................................... 49

Annex 1: References and Sources ............................................................................................................. 50

Annex 2: General Approach and Methodology ......................................................................................... 51

Annex 3: Winners… and losers? ................................................................................................................ 52

Annex 4: About the Authors ..................................................................................................................... 54

Table of Figures
Figure 1-1: On-site visit - guided by the farm-dog. ............................................................................ 6
Figure 2-1: Agriculture sector contribution to exports. ..................................................................... 9
Figure 2-2: Danish food exports by Type ......................................................................................... 10
Figure 2-3: Cereals and grassland are over 80% of arable farming in Denmark. ............................. 10
Figure 2-4: Number of farms is shrinking as they grow larger ......................................................... 11
Figure 2-5: Growing size of farms in Denmark ................................................................................. 11
Figure 2-6: Comparison of pesticide sales in 2014, (Eurostat)......................................................... 15
Figure 2-7: Use of pesticides (Kg per ha) in 2014, Eurostat ............................................................. 16
Figure 2-8: Changes in sales of pesticides in EU Member States (tonnes of active ingredients) .... 17
Figure 3-1: Screenshot of the Dashboard of Fieldsense service ...................................................... 20
Figure 3-2: Example of crop stress (snail attack) over 2 years ......................................................... 21
Figure 3-3: Contemporary biomass activity and stress map of the same field. ............................... 22
Figure 3-4: Biomass Activity Evolution in satellite imagery ............................................................. 23
Figure 3-5: "Variations" or Stress Map of the same field over time. ............................................... 24
Figure 4-1: Farming in Denmark Value Chain................................................................................... 25
Figure 4-2: In-situ measurement tool from Fieldsense .................................................................... 26
Figure 5-1: Characteristic increase in value with performance for Fieldsense. ............................... 36
Figure 6-1: Actual and potential economic benefits ........................................................................ 45
Figure 6-2: Cummulative Benefits coming from the use of Fieldsense ........................................... 46

Table of Tables
Table 5-1: Generic parameters used in calculating the benefits. .................................................... 35
Table 5-2: Benefits coming from Tier 2. ........................................................................................... 39
Table 5-3: Annual EPA Pesticide statistics sales kg/ha. .................................................................... 42

SeBS-CR-001                                                                   Page 4                                                            March 2018

Setting the Scene

 Jakob peered at the screen on his smartphone. He adjusted the controls and zoomed in
 on a small area in the north-eastern corner of his field known as Vandmolle. The mill had
 been closed down long-ago but the name stayed as a reminder of the technology of the
 past. How this contrasted with the satellite image he was looking at today.
 He inspected the history and the variations map coming from his Fieldsense app. Snails,
 it had to be snails again. Last year they had invaded the field next door which belonged
 to his neighbour. This year they had decided to move south rather than north. His
 neighbour, Sandi, had talked about it only last week at the local co-operative meeting.
 She had reported that she did not have the problem this year so far. It was the case, if
 they had come in his direction
 He looked again at the screen which showed the variations in Vandmolle. The images
 coming from the satellite Sentinel 2 showed that the outbreak was still quite small and
 he questioned whether it would be better to spread the pesticide pellets now or wait to
 see how the outbreak developed. The weather forecast was for a continued dry spell
 which would slow their advance, plus he could see on the field history that they had
 treated the same area for thistles just 2 weeks ago which meant that the snails would not
 have that as added fodder.
 He looked back at the last 4 years history. The snails had last invaded 3 years ago. That
 time they had not treated with pesticide and had lost a significant area of crop as a result.
 But then it had been wetter and the snails more aggressive.
 On balance he decided to wait a few more days and see. A new satellite image should be
 available in 2 days time and since the forecast was fine, cloud cover should not be a
 problem. Spraying the one hectare would cost him €120 in chemicals plus time which
 could usefully be spent elsewhere on the farm. He reflected that without the imagery he
 would not even know that the problem was there; Given his neighbours report and the
 weather conditions it could be a few weeks before he may have noticed and even then it
 would not be certain that he would scout that area of the farm.
 If the attack continued he would lose much more. A hectare of wheat was forecast to sell
 at around 1000Euro and if he lost 50% of that it would greatly outweigh the cost of
 treatment. The Fieldsense service was extremely efficient in helping him take these
 decisions. He returned to the screen and moved to another field, Lavtfelt, were there any
 problems here? Would it be a good time to apply a weedkiller? His digital farm was
 working better than ever!

SeBS-CR-001                                      Page 5                                     March 2018

1 Introduction & Scope
Poul Jakob, a third-generation farmer in Jutland, welcomes us into his farm office; his dog had
welcomed us to the farmyard a few minutes earlier. The magnificent farmhouse, over 500 years
old, is situated right next to the golf course for which Poul has leased some 100ha of his land. Poul
owns 550ha but leases out the golf-course and farms around 80ha for another owner so is farming
530ha. His primary crop is wheat, but he also grows barley.
                                                         Poul is a typical user of the Fieldsense service
                                                         which provides digital information to around
                                                         100 farmers in Denmark. Fieldsense, the
                                                         supplier of the service, is a small Danish start-
                                                         up situated in Aarhus. Unlike many other
                                                         platforms which provide a full management
                                                         system for record keeping, action tracking etc,
                                                         Fieldsense has a really strong focus on
                                                         information to aid decision making for cereal
                                                         farmers. Satellite data is the key data source to
                                                         provide their service.
Figure 1-1: On-site visit - guided by the farm-dog. Data coming from imagery gathered by the
                                                    Sentinel 2 satellites is processed into stress
maps which are overlaid onto the farm field boundaries. If the crop-stress reaches a certain level,
then an alert is sent to the farmer. The alert allows the farmer to investigate further the cause of
the stress and hence to react.
This provides value to farmers using the service by saving them time on inspections (crop scouting),
reducing the use of chemicals and increasing yield by enabling earlier detection of a problem. It also
helps farmers gain a “digital picture” of their farm hence improving overall management practices.
Benefits today are modest, but the potential is high. Fieldsense is serving around 3% of the farming
land in Denmark devoted to cereals. It is also early on the technology capability curve meaning that
much more significant benefits are expected in the future as improved algorithms coupled with
machine learning and artificial intelligence allow higher reliability to determine the cause of the
stress without farmers scouting (or visual inspections).
Benefits accrue to the farmer through reduced costs of chemicals and time saved. These benefits
are very much focused on the farmer although in time some of the benefit may be shared with
others in the value-chain. The value-chain may change with time as players who are suppliers to
the farmers look to expand their role.
The reduced use of chemicals also has a beneficial environmental impact. Pesticides entering the
food chain and drinking water is a problem for countries where farming is intensive as is the case
in Denmark. There is even greater potential to reduce the environmental impact where the

SeBS-CR-001                                           Page 6                                   March 2018
information service is used to manage fertilizer application – which is not the case today for
Fieldsense.
In the case, we have interviewed players at the core of the value chain in order to develop a close
understanding of the use of Sentinel data and the impact on farming in Denmark. Fieldsense is just
one service in this market and it could be interesting in the future to contrast what is done in
Denmark with other countries. The information service forms part of a market sector referred to as
precision farming (or increasingly smart farming) which is dedicated more to the farmers
themselves. Other information services are more suited to governments, food producers and other
parts of the overall food value-chain. These should form the subject of future studies to identify the
complementarity between information types.
We wish to thank the following persons for their time spent talking with us to develop the case. In
particular, John Smedegaard from Fieldsense who guided us through the agriculture sector and
introduced us to a number of the experts we have consulted.

         •    John Smedegaard, CEO & Founder of Fieldsense
         •    Poul Jakob, Farmer
         •    Jens Christian, GeoTeam A/s, consultant agronomist
         •    Stefan Sherer, CEO & funder of Geocledian
         •    Peter Ahrendt, Danish Technical Institute.
         •    Rita Horfarter, SEGES
         •    Casper Rolighed, Farmer
         •    Gorm Petersen, Ministry of Education and Science,
         •    Adam Mollerup, Head of Danish Paying Agency, Ministry of Agriculture
         •    Jakob Dragsbek, Danish Paying Agency
         •    Peter Eigaard, Danish Paying Agency
         •    Johan Scheller, Danish Paying Agency
         •    Henrik Zeltner, Ministry of Agriculture

SeBS-CR-001                                      Page 7                                    March 2018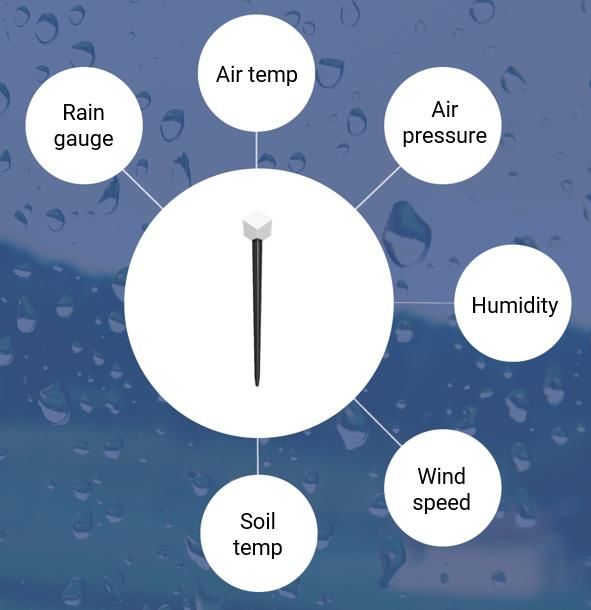
2 Farming in Denmark
Farming is going through its own digital revolution driven by economies of scale (as farms get larger)
and environmental pressures (to reduce the impact of farming on the environment). Even if
Denmark is one of the world leaders in reducing the use of chemicals, further reduction can only
have a beneficial impact - provided crop yields are maintained. Larger farms being run with no
increase in farm employees, demand greater efficiency which digital technology can deliver. In this
chapter, we shall look at the macro-environment of farming in Denmark against which the
Fieldsense service is being offered.

2.1 Overview

Farmer’s goals around the world are to maximise production whilst minimising cost and at the same
time to abide by ever, more-strict environmental regulation. As global demand for food is
skyrocketing, there is a continuous push for more efficient and cost-effective operations, further
challenged by changing climatic conditions. For Denmark, which has a strong and highly efficient
agriculture industry, this is actually good news leading to competitive advantage on the global
market. However, it also puts constant pressure on farmers to improve; forcing them to produce
more with less and in a more sustainable way. Accordingly, they seek to further mechanize
production, allowing them to manage larger areas of crops and more animals, with the same
numbers of farm workers.
This being said, farming is a highly complex business with many decisions to be taken each and
every day. When and what to sow, when and how much growth retardant to apply, when and how
much pesticide/fungicide/fertlizer should be applied? Applications of herbicides, fungicides,
pesticides and most particularly fertilizers are all determined by the type of crop, the weather, the
spread of pests and diseases and the local soil conditions. On top of that, the interaction between
these aspects is difficult to predict.
Accordingly, farming is increasingly (becoming) a highly knowledge-intensive sector, in constant
search of monitoring data ‘from the field’, putting them in context with other sources of impact
(like meteorological, soil, ground water level data etc.) and data on human intervention such as
localizing tractors and sprayers in the field or for adapting the chemicals being applied to the local
conditions.
Satellite data is playing a significant role. Whilst satellite navigation satellites (GPS and Galileo) are
enabling better positioning of farm machinery (tractors, sprayers etc.), earth observation satellites
can monitor field data in unprecedented ways and volumes. Denmark is a pioneering nation which
can leverage on a well-developed (informational) infrastructure as well as an ever-increasing pool
of well-educated and technology savvy farmers.
This is where the Fieldsense service comes in, providing farmers in Denmark with up-to-date
information on the state of their crops. It is primarily used to programme the spraying or

SeBS-CR-001                                        Page 8                                      March 2018
distribution of chemicals and knowing the location and cause of crop-stress to optimize quantities
applied which can save farmers both time and money. Assessing these benefits deriving from the
availability of satellite data is the core of this case study.
2.2 The Agriculture Industry in Denmark
Agriculture remains a key sector for Denmark even if its importance as measured by its contribution
to GDP has been falling steadily. In 1985, it represented 4.9% of total GDP whilst in 2015 this had
fallen to 1.3%1. The agriculture industry in Denmark provides enough food to feed 15m people
compared to the Danish population of 5.7m2 and exports of the surplus represents 25% of the total
value of Danish goods exported of which food directly makes up 17%.
Figure 2-1: Agriculture sector contribution to exports.
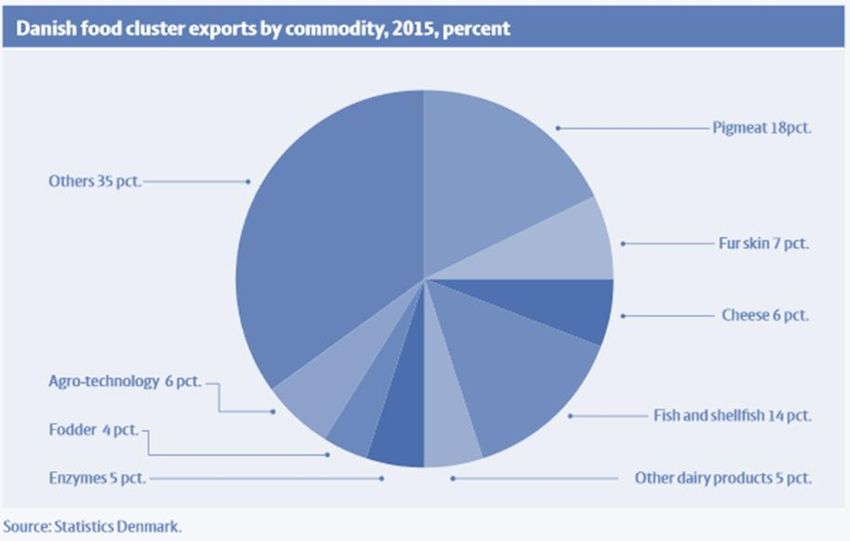
The total value of exports of the food sector is DKK159b (€20.6b) in 2015. Of this, pig and dairy
products make up almost 30% of the total see Figure 2-2.
The main agriculture “products” are pigs, cattle and cereals but 75% of the cereal production is
used for animal feed. Whereas farms were quite integrated 30 years ago, this has changed with
much more specialization in either animals or in cereals. The total area of Danish agricultural land
is around 2.6 million ha which corresponds to approximately 2/3 of the Danish territory. Cereals
covers around 1.5m ha or 57% of this area with grassland accounting for a further 25%; see Figure
2-3.
1 Danish Statistical Yearbook 2017.
2 Danish Agriculture: Facts and Figures 2017.
SeBS-CR-001 Page 9 March 2018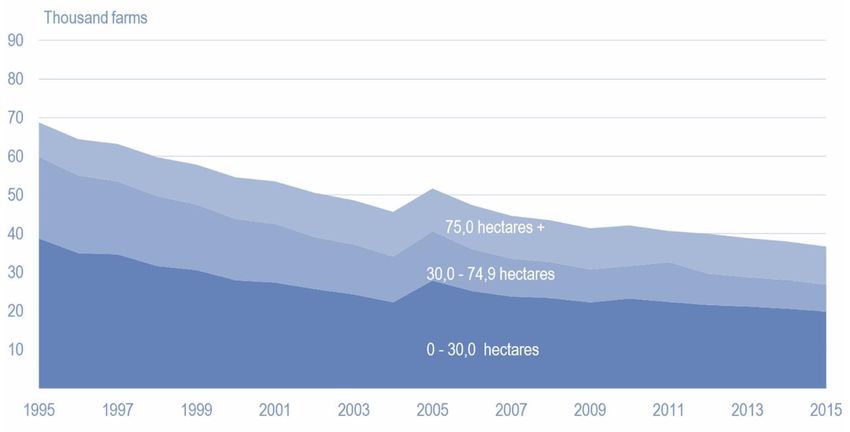
Figure 2-2: Danish food exports by Type

Figure 2-3: Cereals and grassland are over 80% of arable farming in Denmark.

The size of farms has been increasing steadily such that today, the average farm size is 71.9ha up
from 30.7ha in 1985. As farm size has grown, so the number of farms has steadily decreased. In
1985 Denmark had around 92,000 farms. Over a period of 30 years this number has been reduced

SeBS-CR-001                                    Page 10                                  March 2018
by more than 50 per cent so that Danish agriculture now consists of around 37,000 farms only. Of
these 21 per cent have a size of at least 100 hectares where in 1984 only 3 per cent had this size.

     Figure 2-4: Number of farms is shrinking as they grow larger
Even if 79% of the farms are smaller than 100ha, this trend and concentration means that over 1.8m
ha or 68% of the Danish farmland is part of farms of 100ha or more – see Figure 2-5. Thus 7,855
(21%) of Danish farms account for 68% of the total farmland. Fieldsense considers that its market
today is for farms of 100ha or more but this could extend down to farms of 50ha in the future as
the technology becomes even more performant.

   Figure 2-5: Growing size of farms in Denmark

SeBS-CR-001                                    Page 11                                   March 2018
Even if the farms are growing, the number of workers on each one is not, and mechanization has
driven greater efficiency. This now becomes coupled with digital technology and smart farming has
become the mantra.
2.3 Farm Management Practices and Challenges in Denmark
Farming in Denmark, as in other EU member states is mainly controlled under EU regulation. This
includes many of the environmental considerations that impact strongly the way that farmers work.
The production of food and agricultural products is highly regulated. Most of the
regulation is based on EU regulation, and often these rules are interpreted and
implemented strictly in Denmark, leading to even higher standards. The areas of
regulation include hygiene, animal welfare, the use of medicine, pesticides and
fertilizers etc.3
Hence farmers are driven by two pressures:
• To maximize production whilst minimizing costs
• To satisfy regulatory requirements including those for the environment.
Productivity is key in the Danish food and agricultural cluster. From farm to fork, all processes are
optimized, and resources used efficiently. Continuous innovation in many areas puts Denmark in
the lead of productivity; advances in agro-technology to improve fertilizer and chemicals use lead
to greater efficiency in the fields.
The Danish food and agricultural cluster works hard to ensure that production is sustainable and
has shown that economic growth is possible while at the same time reducing resource use. From
1990 to 2014, the value of agricultural production increased by 22%. In the same period, nitrogen
loss was cut by 43%, the phosphorus excess went down 83% and greenhouse gas emission
decreased by 16%.
Farmers are faced with many daily decisions which are complex, often without right answers (!) and
which depend on the type of crop being grown. For example, the growth pattern and management
of potatoes is very different to that of wheat; the former put on leaf very rapidly and hence have a
steep change in vegetation index compared to wheat so that fertlizer, growth and irrigation needs
are very different. Crop information services like Fieldsense need to adapt to these differences to
be fully useful to the farmer and this is reflected in the evaluation made of the economic benefit.
Diseases, such as scab, stripe rust, Septoria tritici blotch, Septoria nodorum blotch and various root
rots, cause some losses each year. Spraying with fungicides is common practise to control these
diseases4; Boscalid and Triazole are the two most commonly used fungicides. Rates to apply depend
3 Source: Danish Agriculture and Food Council; Facts and Figures.
4
Wheat in the World; B.C Curtis. http://www.fao.org/docrep/006/y4011e/y4011e04.htm
SeBS-CR-001 Page 12 March 2018on many factors but early and precise application is the goal - aided by the information coming from Fieldsense. Pests, such as birds, mites and snails all cause crop damage and should be dealt with in different ways. Treatments are sometimes liquid requiring sprays, or pellets requiring scattering. The effective area to be treated is limited by the equipment ie the length of booms dictates the minimum area to be covered whilst the separation of spray head or distributor influences the precision of application. Planning of the planting is a key factor. Crop rotation has long been a primary question for farmers to address and is no less true today. Winter wheat can be planted after a spring crop. Harvesting takes place in July and August and new planting should take place soon afterwards. Availability of labour and maybe farm machinery will affect the dates. If the new crop is planted early, then often a growth inhibitor will be applied to ensure that the plants put on growth in their root system avoiding too much top development before the winter which is vulnerable to adverse weather. It also provokes stronger and sometimes shorter, stems hence increasing the resistance of the plants to adverse weather conditions5. Growth inhibitor may also increase the yield by a small amount, but the cost can be high and outweigh the gains. Hence, such decisions are well-balanced and, since precise meteorological conditions are unknown, also a gamble if not a risk. The ultimate use of the crop may also determine the practices adopted. If wheat is used for animal feed, then a high protein level is sought to attract a higher price. This requires a specific pattern of growth And, last but not least, all of these decisions are influenced by the weather! 2.4 The Socio-environmental Context Regulation of chemical use plays a very strong role in farming practices. A pesticide is a chemical substance used in agriculture to kill or limit organisms which are considered 'pests' because they might endanger agricultural crop output; pesticides can be subdivided into categories e.g.: fungicides (against fungi), herbicides (against plants considered to be 'weeds'), and insecticides (against insects)6. The use of pesticides plays an important role in agricultural production by ensuring less weed and pest damage to crops and a consistent yield. However, their use can have negative environmental impacts on water quality, terrestrial and aquatic biodiversity (persistence and toxic effects on non-target species, etc.), and pesticide residues in food may also pose a risk for human health7. 5Plant Growth Regulators for Wheat. TopCrop Manager September 2015. https://www.topcropmanager.com/cereals/plant-growth-regulators-for-wheat-17806 6Eurostat: http://ec.europa.eu/eurostat/statisticsexplained/index.php/Glossary:Pesticide 7Agri-environmental indicator - pesticide risk, Eurostat, http://ec.europa.eu/eurostat/statistics- explained/index.php/Agri-environmental_indicator_-_pesticide_risk SeBS-CR-001 Page 13 March 2018
The environmental risks of pesticide use vary considerably from one pesticide to another,
depending on the intrinsic characteristics of their active substances (toxicity, persistence, etc.) and
use patterns (applied volumes, application period and method, crop and soil type, etc.). Measuring
the real use of pesticides would allow a better estimate of risks by crop and region for different
compartments of environment and for human health7. At the moment, harmonized statistical data
on use of pesticides are not available on a European scale: under regulation (EC No 1185/2009
concerning pesticide statistics8), data deliveries on the agricultural use by crop each five years
started in 2015, but the data remains fragmented7. Nevertheless, Member States annually monitor
pesticide residues relative to European maximum residue limits (MRLs) and in 2014 over 97% of the
around 83 000 samples analyzed fell within the legal limits [4]. Cases exceeding this, observed
during the annual monitoring activities, are more often found in foods imported from outside the
EU (6.5 % of the samples from third country in 2014 contained residues that exceded the permitted
concentrations), but some residue problems can also be assigned to European agriculture (1.6 % of
the samples in 2014)7.
As a result of their potential toxicity, often even at very low levels, the application of pesticides in
EU is strictly controlled by Community legislation since 1991 (by national legislation prior to 1991)9.
Policy control measures in the EU are driven by the objectives of protecting human health and the
environment (consumers, operator safety, protection of water quality and biodiversity)9. The 2009
EU Directive on the Sustainable Use of Pesticides aims to reduce impacts on human health and the
environment10. To this end, Member States established National Action Plans including quantitative
objectives, targets, measures and timetables. These plans should promote low-pesticide-input pest
management and non-chemical methods, including both integrated pest management and organic
farming.
The contamination of surface waters with pesticides is managed under the 2000 EU Water
Framework Directive11.
Denmark is among EU Member States which in addition to controls on impacts (e.g. the 1998
Drinking Water Directive12) have introduced pesticide taxes – a specific measure to restrict the use
of pesticides9. The relative amount of pesticides sold in Denmark, Figure 2-6, is only about 0.5% of
the total EU quantity (where Spain, France, and Italy together account for about 55% of EU total)

8
 Regulation (EC) No 1185/2009 of the European Parliament and of the Council of 25 November 2009
concerning statistics on pesticides

9  Pesticide sales statistics, Eurostat, http://ec.europa.eu/eurostat/statistics-
explained/index.php/Pesticide_sales_statistics.
10
   Directive 2009/128/EC of the European Parliament and of the Council of 21 October 2009 establishing a
framework for Community action to achieve the sustainable use of pesticides.
11 Directive 2000/60/EC of the European Parliament and of the Council of 23 October 2000 establishing a

framework for Community action in the field of water policy.
12 Council Directive 98/83/EC of 3 November 1998 on the quality of water intended for human

consumption.

SeBS-CR-001                                       Page 14                                     March 2018
and Denmark’s major share of pesticides are fungicides/bactericides (25%), and herbicides/haulm
destructors/moss killers (75%), according to data for the year 20149. In terms of pesticide sales by
country’s utilized agricultural area (UAA), Denmark is among the EU countries with the lowest
values (below 1 kg/ha of UAA), see Figure 2-7 which is substantially lower than 3 kg/ha of UAA
(and more) of the largest consumers (Spain, France, and Italy), whereas intensive use of pesticides
in Malta and Cyprus is above 9 kg/ha of UAA9.
Whilst overall sales of pesticides have remained fairly constant at just under 400,000 tonnes per
annum, the pesticide sales in Denmark decreased from 2011 to 201413. A new tax on pesticides was
introduced in Denmark in 2013 which has encouraged the reduction but also may have encouraged
farmers to stockpile in 2012 so exaggerating the reduction.

Figure 2-6: Comparison of pesticide sales in 2014, (Eurostat)
In Denmark, the most commonly utilized herbicide is glyphosate (round-up) and the mostly used
fungicides are boscalid and triazole14.

13 Agri-environmental indicator – consumption of pesticides, Eurostat,
http://ec.europa.eu/eurostat/statistics-explained/index.php/Agri-environmental_indicator_-
_consumption_of_pesticides
14 Working communication on the SeBS Project with Geoff Sawyer, SeBS Project Manager, December 2017.

SeBS-CR-001                                     Page 15                                   March 2018
Figure 2-7: Use of pesticides (Kg per ha) in 2014, Eurostat
While the chemical safety information does not list health effects of long-term or repeated
exposure to glyphosate, effects of short-term exposure include severe irritation of eyes and mild
irritation of skin. Moreover, carrier solvents used in commercial formulations may change physical
and toxicological properties15. The substance is toxic to aquatic organisms, and despite it does enter
the environment under normal use, great care should be taken to avoid any additional releas15.
Triazole is a whole family of fungicides and is not covered in this document. As it concerns boscalid,
it is practically nontoxic to terrestrial animals, is moderately toxic to aquatic animals on an acute
exposure basis, and according to the United States Environmental Protection Agency (US EPA)
estimate, the potential ecological risks are low16. Boscalid is persistent and has low mobility in soil,
however, it may move to surface water through spray drift and runoff of soil and suspended
sediments16. Boscalid is classified by US EPA as suggestive evidence of carcinogenicity, but not
sufficient to assess human carcinogenic potential16.

15 International Program on Chemical Safety, Chemical Safety Information from Intergovernmental
Organizations, http://www.inchem.org/documents/icsc/icsc/eics0160.htm
16
   Boscalid, Pesticide Fact Sheet, Office of Prevention, Pesticides and Toxic Substances, United States
Environmental Protection Agency, July 2003,

SeBS-CR-001                                          Page 16                                        March 2018
Figure 2-8: Changes in sales of pesticides in EU Member States (tonnes of active ingredients)
In summary, even though the current situation with pesticides use in Denmark is fully compliant
with legislative requirements and the values of residues are well below prescribed thresholds, a
further potential reduction of pesticides’ use in Denmark would have a positive effect on
environment and human health especially when seen from the perspective of risk avoidance. Even
though this positive impact is hardly quantifiable, it should not be neglected.

2.5 Organic Foods

Since we are looking at a service which impacts on the use of pesticides and other chemicals, it is
worth a quick word on the place of organic farming in Denmark. Not strictly relevant for the case
since organics avoids the use of any chemicals relying on natural methods to control pests and
weeds, it is still an important trend in Denmark which shows the sensitivity of the issue to the
general public.
Organic does not mean no use of fertilisers, pesticides or herbicides but that only naturally
occurring forms should be used. Support to early detection ie by using the Fieldsense service, is just
as, if not more, important for an organic farmer as it is for non-organic ones.
In 2017, approximately 9% percent of Danish farmland is cultivated organically, and Danish
consumers buy more organic food than any other Europeans. Proportionally, the organic market in
Denmark is the biggest in the world, with organic food making up 9.6 percent of the total retail food

SeBS-CR-001                                      Page 17                                   March 2018
market in 201617. With the growing demand, Denmark imports significant quantities of organic
produce and, to counter this, there is an increase of hectares being devoted to organic farming.

17Danish Agriculture and Food Council: http://agricultureandfood.dk/danish-agriculture-and-food/organic-
farming

SeBS-CR-001                                       Page 18                                     March 2018
3 The Use of Satellite data

3.1 Summary

Fieldsense is a service supplied by start-up company to farmers and agronomists in Denmark. The
service includes crop monitoring to help farmers get a clear view of their crop performance and to
detect and manage crop threats and prescription maps to optimise the application of chemicals.
The information is supplied via a web-platform to subscribing farmers and consultants.
The system allows farmers not only to see changes in their fields indicating the condition of the
crop but also to assemble and compare with historical data. Alerts are made when certain changes
are detected so that the farmer can investigate further. Machine learning is being introduced which
will guide the farmer as to the problem which has been detected whether it is due to disease, pests
or other causes ie drainage or pipe-bursts.
Sentinel 2 imagery is used to map the vegetation and especially how it is changing with time. Each
pass over Denmark is processed to provide an easily assimilated vegetation map which lies at the
heart of the system. Other data is being added coming from in-field sensors which provide the local
conditions (rainfall, air and soil temperatures, winds, humidity etc).

3.2 The Service - Fieldsense

Information from Fieldsense is used to support key decision making by farmers and especially the
quantity and timing for the application of chemicals. The farmer enters his fields of interest in the
portal and Fieldsense offers them an activity map of each field which is a measure of the crop
growth. It can provide a variable rate map18, also called a prescription map, to control the
distribution of chemicals or fertilizer by the farm machines. Today, around 50,000ha of crop land is
being managed with the aid of the Fieldsense service. This is growing quite quickly as a major sales
drive is engaged.
Satellites capture images of the farmers’ fields several times a month. By focusing on specific
wavelengths of light, FieldSense analyzes the photosynthetic performance and provides detailed
insights into the cellular activity of the crops, giving a new perspective on their growth.
When crops are under stress, their growth activity decreases. FieldSense detects small variations in
activity by automatically running analyses each time new imagery is available. Once an issue has
been detected, subscribers receive a notification telling them exactly where action is needed.

18 A Variable Rate Map (VRM) shows the prescribed or planned application of fertilizer or chemicals to a
field based on the location in that field.

SeBS-CR-001                                         Page 19                                      March 2018
Figure 3-1: Screenshot of the Dashboard of Fieldsense service

Figure 3-1 shows the typical screen used by farmers to assess his fields. The field highlighted is
showing the biomass activity where strong green indicates good vegetation growth. The imagery is
taken from the selection available which can be scrolled through on the page and shows the
evolving conditions for the field as shown on the occasion of each satellite overpass. A historic plot
of measurements is shown at the bottom of the screen offering both mean and variation for the
measured vegetation index. Three key indicators are shown in the box to the left and plots of each
of these to the right. These allow a farmer to see the evolution of his crop with time.
Historic data is now available to the farmer for the last 4 years. This allows problems to be identified
and forms the basis for the alert system. As the database develops, and more years’ data are
acquired, so the precision of the analysis will improve in the future. Ultimately, the expectation is
that a highly reliable indicator can be given to identify the cause of the crop stress.
Fieldsense now provides an alert to the farmer when a variation is considered to present an issue.
The history of the activity is used to characterize the issue and to recommend a remedy to the
farmer. Issues can be due to pest attack ie snails, weed growth ie thistles, disease ie leaf blight or
may be due to watering (over or under watering) or simply meteorological ie storm damage.

SeBS-CR-001                                       Page 20                                    March 2018
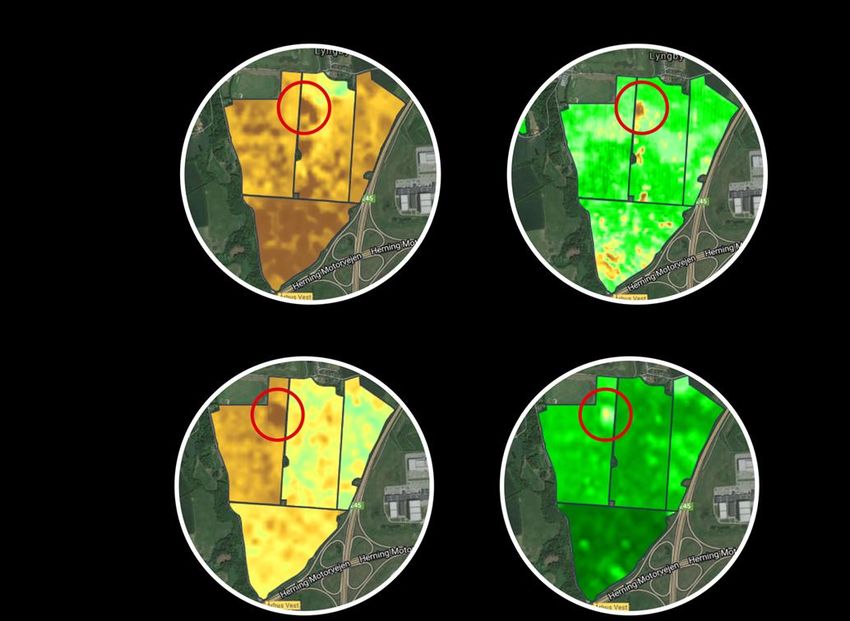
Figure 3-2: Example of crop stress (snail attack) over 2 years

The example in Figure 3-2 shows two similar areas of crop stress caused by a snail attack. The snails
live in the hedges and in 2015 emerged on one side into the crop and in 2016 they emerged on the
other side. Such a picture is characteristic of snails and is easily recognizable by an expert. The goal
of Fieldsense is that this becomes recognizable automatically such that there is a high degree of
confidence and treatment can be planned without even a field visit. One this goal has been achieved
for most of the possible causes of stress, then the full potential of Fieldsense will be realized.
Early detection of an issue can avoid bigger problems later. Without Fieldsense, the farmer would
be relying on scouting - where a farmer is walking the fields to assess crop condition - to detect the
problem. However, only a small fraction of the area of large farms can be monitored in this way. A
farmer such as Poul is spending around 3 hours per week on crop scouting throughout the growing
season.

SeBS-CR-001                                       Page 21                                    March 2018
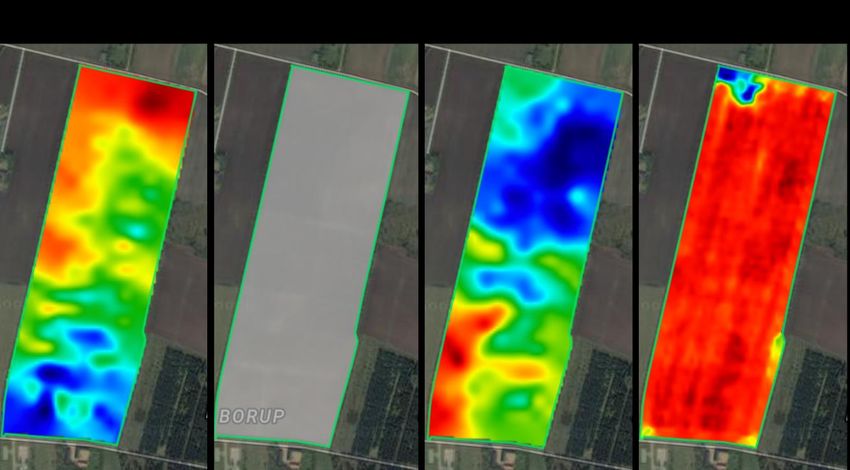
Figure 3-3: Contemporary biomass activity and stress map of the same field.

Figure 3-3 shows the same field in biomass extent and the variations (right side). It illustrates two
key issues. There is a marked divide down the middle of the field. It turned out that this was due to
the farmer having stopped distributing fertilizer because it had started to rain. The right-hand side
was treated earlier than the left side. The impact is more vegetation on the right side than on the
left side. With the evidence presented by the imagery, the farmer can better identify and plan the
next actions to take.
The second effect in the field is the brown area showing up in the biomass extent - also visible in
the variations map. In this case, a drainage pipe was blocked and the area was wetter than the rest
of the field. Again, identification through the Fieldsense service can allow earlier detection and
treatment than would otherwise be the case.

3.3 The Role of the Satellite Data

One of the primary features of FieldSense is its ability to show multiple types of Earth observations.
These observations are usually represented as a “map type” or “map layer”. There are three
different map types in FieldSense; (1) biomass activity, (2) variations, and (3) visible light (regular
RGB photos).
Optical imagery taken by Sentinel 2 is used to generate maps which indicate the state of the
vegetation in the image. Clearly, Fieldsense will not disclose the exact algorithm which they are
using but it is based upon the very familiar NDVI19; which we can describe for those who are not
familiar with the term or technique.

19   NDVI = Normalised Difference Vegetation Index.

SeBS-CR-001                                       Page 22                                   March 2018
NDVI is a classical technique which allows the amount of vegetation to be measured. It is a simple
but powerful algorithm using the properties of the green leaves to absorb or reflect light. The
pigment in plant leaves, chlorophyll, strongly absorbs visible light (from 0.4 to 0.7 µm) for use in
photosynthesis. The cell structure of the leaves, on the other hand, strongly reflects near-infrared
light (from 0.7 to 1.1 µm). The more leaves a plant has, the more these wavelengths of light are
affected, respectively.
Sentinel 2 measures the energy reflected in visible and infra-red bands from which the NDVI can be
calculated for each pixel. A description of NDVI and the scene classification of which it is part see
the Sentinel 2 user guide20 and for a more detailed guide to vegetation indices21.
A key process to be applied before the NDVI can be calculated is to filter out all areas covered by
cloud. A cloud mask is produced such that these and the areas which are shadowed by the cloud
can be identified. Clearly, clouds can be a problem in Europe and over Denmark which has the
impact of reducing the effective coverage which is possible.

Figure 3-4: Biomass Activity Evolution in satellite imagery
Figure 3-4 shows the evolution over 6 weeks of the biomass in one field. The image of 13th May was
cloud covered and masked out. The other images show the progressive crop growth during the
fastest time of the growing season.
Other factors which must be taken into account are the field boundaries since the farmers are
interested in the crop stress in their own fields. Some information services rely on cadastral driven

20Sentinel 2, level 2A Algorithm Overview.
21Twenty Five Years of Remote Sensing in Precision Agriculture: Key Advances and Remaining
Knowledge Gaps. David Mulla, University of Minnesota. April 2013

SeBS-CR-001                                      Page 23                                  March 2018
boundaries but these are not always available or are costly and field edges can be discriminated in
the images. Fieldsense gives farmers the capability to correct their field boundaries manually in
their account.
Once the NDVI has been calculated it shows a measure of the leaf volume in each pixel. In ideal
circumstances this will then be homogeneous across a crop in a field. The variations map enhances
the variations in biomass activity on a field specific scale. This has the benefit of making similar-
looking green shades of the biomass activity map more distinct. However, since this map is field
specific, it is not possible to compare fields to one another and it is used to indicate where there is
stress on a crop within a field.
The history of the in-field variation and knowledge of the field itself can be used over time to build
up a stronger picture. Using artificial intelligence techniques Fieldsense will provide increasingly
more sophisticated products in the future. The goal will be to link all the processes together in an
automatic processing chain. Hence a problem is detected by Fieldsense which alerts the farmer and
provides the variable rate map directly for uploading to the relevant farm machinery. The farmer
only has to validate the process.

Figure 3-5: "Variations" or Stress Map of the same field over time.

In Figure 3-5 is shown the stress map (called variations in the Fieldsense terminal) for the same field
and same period as for Figure 3-4. The area to the top left in the map of 19th June may be something
to investigate. A decision could depend on historic information and knowledge of the farm
conditions ie wet corner of the field, specific growing conditions etc.

SeBS-CR-001                                      Page 24                                    March 2018
4 The Value Chain
Having covered the service and the macro environment it is embedded in, we will now look into its
impact on the value chain it functions in: what parties are in there and what subsequent effects
does the availability of Fieldsense cause in their interactions? In this chapter we look at the role
each is playing in the value-chain whilst in the next chapter we shall look at the value being created.

4.1 Description of the Value-chain

Central to our methodology – in this case study as well as past and future ones - is the value-chain
stemming from the use of the satellite data. It is the basis for the analysis of the value generated
by the availability of the Sentinel data. The value chain features a set of ‘tiers’ representing
subsequent users of satellite-based services (and their subsequent users and so on). Each tier
connects to a different form of information (packaged in the form of a service), which can still be
related to the Sentinel data22.

The value-chain associated with this case is shown in Figure 4-1. It starts with tier 1 (the service
supplier, which supplies the farmers and their consultants - the agronomists. Farmers produce is
sold to tier 3 (food producers as well as other farmers for livestock feed who then, via the
distributors, like supermarkets, sell their output to tier 5 (the end beneficiaries, being the citizens
and consumers in Denmark and beyond since large parts of the production are sold as exports.

Figure 4-1: Farming in Denmark Value Chain.

22   Annex 2 contains further details on the concept of the value chain and our methodology.

SeBS-CR-001                                           Page 25                                  March 2018
4.2 Value-Chain Actors & Other Stakeholders

4.2.1 Service Provider (Tier 1)

Fieldsense23 is a young, start-up company formed in 2015 by a group of 6 computer scientists,
farmers and business developers who have the objective to develop easy-to-use decision-support
solutions for the agricultural industry. The decision to launch the company was taken following the
success of the founders at the Copernicus Masters24 competition in 2014. From the 6 initial
founders, the company has grown in its 2 years of existence to employ 12 people today.

Fieldsense analyse Sentinel 2 data to generate information products so providing digital services
for farmers through web access and IoS and Android mobile platforms. Formally, called CEPTU,
Fieldsense also gathers, integrates and analyses data from other sources. A small, remote, in-situ
                                                   measurement tool has been developed to
                                                   improve the service offered. This contains
                                                   several sensors to provide key, localised
                                                   conditions. It is also being sold as a second line
                                                   of business.

                                                     This is not the only way in which Fieldsense has
                                                     adapted its business model as it has developed;
                                                     even within the timeframe of this case. When
                                                     our analysis started, the satellite image maps
                                                     were being provided by Geocledian; a micro
                                                     company in Germany processing satellite data.
                                                     Interestingly, Fieldsense found it more
                                                     advantageous to develop its own processing
                                                     capability, integrating the image processing
                                                     and map generation into their own processing
Figure 4-2: In-situ measurement tool from Fieldsense chain. Now, they even start to develop business
by providing this service to others. This backward integration is not only a measure of the skill of
the company but also of the dynamism of the market it is operating in.

In the meantime, Geocledian are also now starting to offer an agriculture service of their own –
Ag!Knowledge. As a start-up specialized in designing and providing geospatial cloud services,
Geocledian’s goal is “to provide high quality, easy-to-use and low-cost information products based

23Fieldsense: https://site.fieldsenseapp.com/
24Copernicus Masters is an international competition which awards prizes to innovative solutions for
business and society based on Earth observation data.

SeBS-CR-001                                        Page 26                                      March 2018
on satellite data and other sources.” As a team of remote sensing experts with a strong research
background they seek other ways to exploit their skills such as the new agriculture service.
Both Fieldsense and Geocledian are expanding as a result of being able to use the free and open
Sentinel data.
4.2.2 Farmers, Agronomists, Consultants (Tier 2)
a) Farmers
The primary users or beneficiaries of the Fieldsense service are the farmers who use it directly to
inform and help them with farm management. They also share it with their advisors: the
agronomists or consultants. However, other players in the value chain can also benefit from the
availability of farm information and this is a sector which is rapidly evolving.
It is important to realize that the increasing availability of data, including (services based on)
satellite data, impact heavily on the traditional role of the farmer. Having much more land and crop
to look after, the modern farmer has turned into a tech-savvy manager with a small staff which
work in the fields. Whilst the farmer will decide what action to take and when, he will mostly be in
his office directing the operations. The trend towards larger farms which we discussed in section 2,
is both a driver of and a consequence of increasing digitalisation and connectivity.
This means that the farmer is not directly viewing his fields and crops on a daily basis; even the
workers will only visit a field when there is a task to be performed. The farm workers are not skilled
to recognise disease or plant problems which is why a system like Fieldsense can deliver so much
value. Satellites can provide imagery on a sufficiently regular basis that anomalies can be detected,
without having to be in the field. And this is only the beginning; in the near future tractors are
expected to drive themselves, relying on in-situ sensors on-board, providing additional data so
complementing that coming from the satellites.
b) Agronomists/Consultants
As even the farmer is not expert in all aspects of crop management, when needed, they turn to an
agronomist; sometimes referred to as a consultant. Their advice may range from technical
assistance regarding the farm machinery to use and especially new technologies being incorporated
into it such as variable rate spraying, digital rate maps, positioning and automatic controls, or it may
concern the type of crop to plant and when to do so, the incidence and treatment of disease or
pests on crops.
Two categories of agronomist exist in Denmark; private and independent ones such as Jens
Christian who works for GeoTeam As, and those (the majority) working for the DLBR25. DLBR is a co-
operative structure consisting of 31 consulting companies distributed throughout the country. The
25 DLBR is the Danish Agriculture Advisory Service. https://www.dlbr.dk/
SeBS-CR-001 Page 27 March 2018DLBR companies are owned by Danish farmers, which also make up the majority of customers. The
companies are locally-based and provide expert advice to the farmers.
Each farmer has the right to call upon 3 hours of agronomist expertise from the DLBR each year as
benefit for part of their annual fees (subscriptions). Farmers also meet regularly (weekly during the
height of the growing season) in local groups to exchange on their experiences. This allows news
on diseases or pest outbreaks to be conveyed and shared quickly as well as the efficacy of different
treatments.
c) Co-operatives
Many of the organisations in Denmark concerned with agriculture and food products are co-
operatives - a well-recognized legal structure. It makes for a more dynamic and integrated sector
and is surely one reason for Danish competitive advantage in the sector. Three co-operatives are
particularly relevant to the Fieldsense case: SEGES which provides an advisory service to farmers
and is often referred to as a farmers’ union, Danish Agro and DLG. As such, co-operatives are a
strong feature in the Danish agriculture sector and, as reported by the Danish Agriculture and Food
Council:
The major food enterprises in Denmark are farmer owned co-operatives. With today’s
professional daily management, they are among the world’s largest exporters of safe,
high-quality food and agricultural products. Profits are returned to the own-ers – the
farmers. It is voluntary to join a co-operative, and the companies are controlled by the
members. The basic principle is “one farmer - one vote”, irrespective of farm size and
production volume26.
The Danish Agriculture & Food Council (DAFC) represents the farming and food industries of
Denmark including companies, trade and farmers’ associations. Over 90% of Danish farmers are
members of the DAFC. SEGES offers services to farmers and the local advisory service (DLBR) such
as research in farming practices, advice on farm management, deliver IT solutions on farm
management and host the huge databases with farm data (Registration of animals, crops, fertilizer
and pesticide use). It has the goal to ensure27 that Danish farmers have access to and can deploy
the latest technology and knowledge as quickly and as efficiently as possible. SEGES is also the
primary body to advise government policy on farmers views, it offers services to farmers such as
advice on farm management and it sponsors research into farming practices.
Since 2016 SEGES and the Danish Ministry for Agriculture has offered the use of CropSat for free to
all farmers (in 2017 there was 7.300 users and in 2018 it is 7.500 users). With CropSat farmers can
create application maps (variable rate maps) for fertilizer and pesticide use on basis of biomass
measured form Sentinel-2. To push the interest for CropSat and precision farming, SEGES also send
out to all farmers application maps with a suggestion for distribution of the first nitrogen in oilseed
26 Danish Agriculture: Facts and Figures. Danish Agriculture and Food Council.
27 Danish Agriculture and Food Council http://agricultureandfood.dk/
SeBS-CR-001 Page 28 March 2018You can also read