Low-Cost Flights and Far-Right Votes: The Electoral Geography of Hypermobile Migration - OSF
←
→
Page content transcription
If your browser does not render page correctly, please read the page content below
Low-Cost Flights and Far-Right Votes:
       The Electoral Geography of Hypermobile Migration

                      Elena Pupaza∗ and Joachim Wehner†

                                      March 30, 2021

       Transportation and geography scholars link low-cost flights to a new type of hy-
       permobile migration, but the political implications of this development remain
       poorly understood. We examine patterns of migration and far-right voting in
       London following the Eastern enlargement of the European Union in 2004 and
       2007. We show that the distribution of migrants from this region is linked to
       pre-existing transport infrastructure providing access to low-cost flights back
       home. Combining ward-level election and census data with geo-referenced in-
       formation on bus stops serving relevant airports, our instrumental variable
       approach addresses immigrant sorting and reveals a large positive effect on
       changes in support for far-right anti-immigrant parties between the 2004 and
       2012 London elections. Our approach expands the methodological toolkit for
       studying the effects of migration. The findings challenge claims of low-cost
       airlines “bringing the EU closer together” and have policy implications based
       on the spatial predictability we uncover.

   ∗
    Elena Pupaza (e.c.pupaza@lse.ac.uk) is a PhD candidate in Political Science, Department of
Government, London School of Economics and Political Science.
   †
     Joachim Wehner (j.h.wehner@lse.ac.uk) is Associate Professor in Public Policy, Department of
Government and School of Public Policy, London School of Economics and Political Science.
    We are grateful for comments from Florian Foos, Javier Ortega, Raluca L. Pahontu, Tony
Travers, and Ben Wilson, as well as seminar participants at LSE, Sciences Po Paris, and Stockholm
University, and at the EPSA 2019 meeting. We would like to thank Jamie Baker, Electoral Services
Manager at the London Borough of Lewisham, for supporting our efforts to collect voter registration
data, Lau Magro at the Office for National Statistics for assistance with our commissioned census
data, as well as staff at Transport for London and the London Datastore for their help with data
queries. The LSE Research Infrastructure and Investment Fund provided financial support.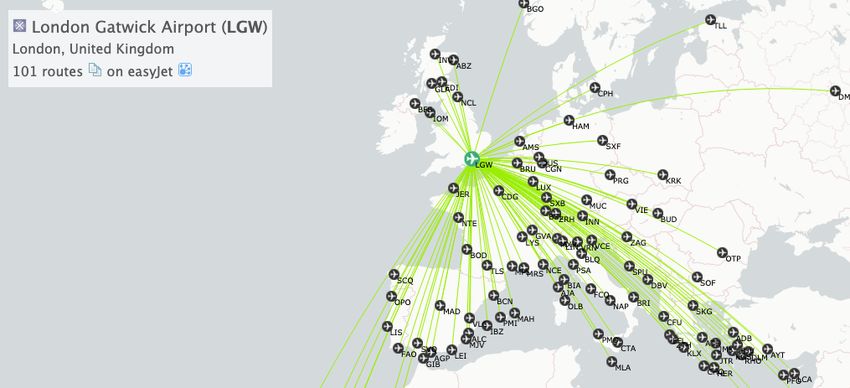
1    Introduction
How does “hypermobile” migration affect electoral support for far-right parties? Once
settled, many migrants face legal, logistic, or affordability constraints to frequent
travel back home, and those who flee from a repressive regime are unlikely to return
to places from which they escaped. In recent decades, however, the liberalization of
transportation markets in some parts of the world has led to unprecedented increases
in the availability and affordability of cross-national travel (Akgüç et al. 2018; Do-
bruszkes 2009). Transport and geography scholars highlight that this has given rise
to a new type of “hypermobile” migration characterized by a far higher degree of
connectivity between the country of birth and the host country of migrants than in
previous population movements (Burrell 2011; Pooley 2017). While a growing num-
ber of studies examine electoral effects of different migratory flows (e.g., Barone et al.
2016; Calderon et al. 2019; Dinas et al. 2019), the consequences of this new mobility
for patterns of far-right voting have yet to be analyzed. This is important, as prior
research shows that different categories of migration can affect election outcomes in
distinct ways (e.g., Edo et al. 2019; Mayda et al. 2018).

We examine the electoral geography of hypermobile migration in the context of the
Eastern enlargement of the European Union (EU) in 2004 and 2007. This change
brought unprecedented access to the UK for citizens of ten Central and Eastern Eu-
ropean countries, and it occurred in the wake of the liberalization of the air travel
sector in the EU. Many scholars and policymakers vastly underestimated the flows re-
sulting from this development. A major study commissioned by the UK government
considered the country “not a very popular migration destination” and estimated an
annual net inflow of between 5,000 and 13,000 from these countries in the years up

                                            2
to 2010 (Dustmann et al. 2003: 57). Instead, official statistics show actual numbers
averaged more than 100,000.1 This period thus saw a radical change in migration
into the UK and its capital city in particular. We demonstrate that access to key
travel nodes shaped the geographic dispersion of this influx and, in turn, the electoral
support for far-right anti-immigrant parties.

Our study relates to a growing literature on the electoral impact of migration at the
local level (e.g., Barone et al. 2016; Calderon et al. 2019; Dinas et al. 2019; Dustmann
et al. 2019). Subnational units are more comparable than independent countries, thus
helping to mitigate concerns about omitted variable bias (Golder 2016). Yet with
rare exceptions (e.g., Dustmann et al. 2019) the location decisions of migrants are
not (as-if) random. If migrants avoid hostile areas and are drawn to more welcom-
ing ones, we may underestimate the effect of migration on the electoral support for
far-right parties. On the other hand, some migrants have little choice but to settle in
locations where socio-economic challenges can make native-born voters susceptible
to far-right parties. In attempts to address the problem of immigrant sorting, many
studies rely on a version of the shift-share instrument (e.g., Edo et al. 2019; Halla
et al. 2017; Mayda et al. 2018). This approach exploits an initial distribution of
migrants to project the flow of new migrants across geographic units, based on the
idea that location decisions are influenced by existing networks (Jaeger et al. 2018).
This requires reliable historical data, which in our case are not available for migrants
from countries that did not exist during the Cold War period.

  1
     Central and Eastern European residents from the 2004 accession countries increased from an
estimated 167,000 in 2004 to 1,323,000 in 2018, while those from Bulgaria and Romania increased
from 42,000 in 2007 to 495,000 in 2018 (Vargas-Silva and Fernandez-Reino 2018: 4).

                                              3
We draw on transport and human geography literature to develop a new approach for
settings with highly-mobile migrants. Where migrants maintain regular links with
their home countries, their location decisions partly reflect ease of access to relevant
travel infrastructure (Burrell 2011; Dobruszkes 2009). Our study shows that the dis-
tribution of migrants from the new EU member states across London is linked to the
location of pre-existing infrastructure that provides access to the principal means of
travel to and from their home countries, especially low-cost airlines. We combine
2001 and 2011 census data on the inflow of migrants into London with information
on the location of pre-existing bus stops serving the two dominant airports for cheap
flights to and from Central and Eastern Europe. We confirm empirically that these
bus stops are associated with changes in the population of migrants from this re-
gion, but not other migrants. Using proximity to these bus stops as an instrument
for ward-level increases in the population from these countries, we uncover a large
positive effect on changes in support for far-right anti-immigrant parties between the
2004 and 2012 London elections.
Our study makes several contributions. First, we shed light on the distinct ways
in which highly-mobile migrants make location decisions, and how this shapes the
electoral geography of support for far-right parties. Our empirical strategy offers
an alternative to the commonly used shift-share instrument that is useful where
data limitations hamper the latter, or as a robustness check. We also contribute
estimates from one of Europe’s major cities to the literature linking migration to
support for far-right parties at the local level (e.g., Barone et al. 2016; Halla et al.
2017), providing further evidence that cosmopolitan areas are not immune to anti-
immigrant sentiments. More fundamentally, our results relate to debates about the
relationship between economic and political integration. While some argue that low-
4cost airlines are “bringing the EU closer together” (Akgüç et al. 2018), we document
a dark side of international mobility in this crucial period leading up to the UK’s
referendum on leaving the EU (Clarke et al. 2017; Fetzer 2019). Yet because of the
spatial predictability we uncover, our work also suggests how policy interventions
might be targeted to contain such adverse political reactions.
2 Transportation, migration, and politics
The role of transportation infrastructure is a recognized but neglected element in the
literature on migration and mobility (Pooley 2017). Studies of different urban con-
texts find that location decisions are linked to access to public transport, on which
especially new migrants tend to rely more than established residents (Chatman and
Klein 2009; Perez et al. 2019; Tsang and Rohr 2011), and that some migrants value
access to airports (Maslova and King 2020). In this section, we examine the link
between transportation and migration with high cross-national mobility. We then
set out how we use insights from the transportation and geography literature and
related fields in order to address empirical challenges in our study of the electoral
consequences of migration.
The period around the start of the millennium was characterized in many industri-
alized countries by increased competition in aviation markets. The entry of low-cost
operators, containing operating costs and offering more basic “no-frills” services than
traditional airlines, made air travel affordable on a wide scale not seen before. In
1993, the US Department of Transportation described this as the “Southwest Effect”
with reference to the airline’s expansion. In Europe, too, low-cost or “budget” airlines
grew rapidly during this period. Liberalization from 1992 allowed EU airlines with
5an operating license to serve the entire EU market without commercial restrictions.
Low-cost carriers took advantage of this development and increased their seat share
from less than 2% in the early 1990s to more than 40% by 2010, exceeding that of
“legacy carriers” - those with established routes prior to liberalization - thereafter.
In 2016, Ryanair, the EU’s first low-cost carrier, became Europe’s largest airline by
passengers carried (Akgüç et al. 2018).
During this period, low-cost carriers were a powerful force behind an expansion and
diversification of flight networks on west-east routes with Central and Eastern Eu-
ropean member states that joined the EU in 2004 (the “EU8” comprising the Czech
Republic, Estonia, Hungary, Latvia, Lithuania, Poland, Slovakia, and Slovenia) and
2007 (Bulgaria and Romania, the “EU2”).2 Especially the Irish carrier Ryanair and
Hungarian airline WizzAir aggressively increased their provision of flights on west-
east routes and commenced a range of new services (Dobruszkes 2009; Jankiewicz
and Huderek-Glapska 2016).
Policy assessments of the consequences of low-cost travel in Europe have focused
on economic aspects and benefits in terms of mobility. The European Parliament
has noted impacts on established airlines and airports, competition, and regional
development (Macário et al. 2007). Low-cost air travel can increase tourism and
business-related travel, and it boosts the mobility of labour and students by lowering
the cost of migration. Following the initial migration of an individual, affordable
travel facilitates visits to and from friends and relatives, or “VFR” travel in indus-
try jargon. A leading EU think tank concludes that low-cost carriers “play a vital
2
Official UK statistics label these groups of new member states as the “EU8” and “EU2” respec-
tively and we collectively refer to them as the “new EU” or “EU8+2” countries.
6role in bringing Europe closer together by fostering mobility and making air travel
affordable to a wider public” (Akgüç et al. 2018: 44).
This unprecedented level of connectivity is a crucial new element that characterizes
this period of European integration. In sharp contrast, earlier migration from Cen-
tral and Eastern Europe to the West was typically final and much more constrained
(Ignatowicz 2011: 35). Traditional airlines were too expensive and alternative modes
of transport - coach, ferry, or rail - too cumbersome to enable large volumes of mi-
gration with high levels of mobility (Akgüç et al. 2018). When the EU’s Eastern
enlargement removed restrictive work and travel rules, low-cost carriers fuelled and
shaped this new wave of migration. Citizens from the “new” EU member states
could travel to and work in the “old” ones with far greater ease than at any point
in the past. Moreover, access to regular and affordable journeys back home allowed
them to maintain family and social ties, and lowered the perceived risk of migration.
According to Ignatowicz (2011: 43), this also had significant emotional value, since
mobility is “not only about the actual physical movement but also about a feeling of
being in a privileged position to go home at any time.” Burrell (2011: 1023) sums
up thus: “Ryanair flights define this new migration.”
What do these developments imply for the study of the electoral consequences of
migration? The transportation-focused literature cited above does not cover political
or electoral implications. Yet it provides the underpinnings of our empirical approach.
The insight we develop is that the distribution of highly-mobile migrants is likely to
be systematically linked to their access to low-cost travel infrastructure that connects
them - both practically and emotionally - with their home countries. In our empirical
context that we introduce below, this allows us to link the location decisions of this
7category of migrants to specific pre-existing access points to low-cost air travel to
and from Central and Eastern Europe. If empirically confirmed, this link offers a
strategy to overcome bias due to immigrant sorting and to assess the causal effect of
migration on electoral support for far-right parties in such settings.
3 Context
Our study exploits significant spatial heterogeneity in the changing composition of
London’s population as a result of the Eastern enlargement of the EU. This offers
a unique context to examine the electoral effects of migration caused by the UK
government’s decision not to impose transitional work restrictions on workers from
EU8 countries. Most other EU governments feared a large influx of migrants would
put pressure on labor markets, and implemented a phasing-in period of up to seven
years for the free movement of workers from the accession countries. However, in
2004 the UK was among the few countries which did not impose any restrictions and
allowed unfettered access to its labor market from day one (Becker and Fetzer 2016).
With significantly fewer restrictions here compared to countries such as Germany or
Austria, many Eastern European migrants chose to come to the UK. This resulted
in a substantial inflow of migrants into the capital in particular, but with significant
variation in settlement patterns (Kone 2018).3
3
Bulgaria and Romania joined the EU in 2007, slightly later than the EU8. This matters little
for our study. We analyze the impact of migration as captured in the 2001 and 2011 census rounds,
which span both accession dates. Although EU2 nationals, unlike their EU8 counterparts, were
subject to interim work restrictions until the end of 2013, census data show a sharp increase in
London residents born in Bulgaria (+24,200 or 802%) and Romania (+41,800 or 1371%) between
2001 and 2011. These growth rates are the sixth and second highest of all immigrant groups, which
is also reflected in EU2 air passenger traffic during this period (see Figure A.4 in Appendix A).
8This context also allows us to examine the electoral effects of a category of migrants
that has hitherto not been studied. Some subnational studies of the political effects
of migration look at migrants in general (e.g., Barone et al. 2016), others at spe-
cific subcategories, in particular refugees (e.g., Dinas et al. 2019; Dustmann et al.
2019). Several authors distinguish migrants by education of skill levels (e.g., Edo
et al. 2019; Halla et al. 2017; Mayda et al. 2018). We are the first to consider the role
of post-migration travel to their country of birth. This is not only of importance for
the empirical design of our study, which we discuss below, but also a contribution
in substantive terms. If hyper-mobility supports the maintenance of social ties to
the home country of migrants, it may also reduce pressure to integrate into the host
society (Ignatowicz 2011: 43). This, in turn, may affect the perceptions of host com-
munities. It is unclear how existing findings from very different types of migrants
translate to the context of hyper-mobile migration. Our study thus contributes a
novel focus that is important for assessing the generalizability of earlier results with
different categories of migrants.
We analyze local elections as opposed to national ones because they allow us to
carry out a highly spatially disaggregated analysis of voting patterns at the ward
level. National election results are announced at the borough or constituency level,
which are far larger geographic areas.4 One potential complication is the possibility
that EU8+2 migrants themselves directly influenced the outcome of these elections,
as citizens from one EU country enjoy voting rights at the local level in other EU
countries. We checked the extent to which EU8+2 nationals were registered to vote
4
This analysis focuses on 620 wards, while for general elections London is divided into 73
constituencies. The total population of wards ranged between 4,692 and 17,257 in 2001 and between
5,110 and 23,084 in 2011. In contrast, parliamentary constituencies in 2010 had total populations
between 81,831 and 136,111 (London Parliamentary Constituency Profiles 2010, London Datastore).
9by matching ward-level data on electors by nationality that we requested from the
electoral services managers of all 32 London boroughs, to census data we commis-
sioned from the Office for National Statistics on the country of birth of the population
of voting age (18 years or above).5 We used this information to approximate EU8+2
registration rates across 216 wards from the 11 boroughs that supplied data, which
yielded an average ratio of 62.1% (for further details, see Appendix D). A sizable
share of EU8+2 migrants did register to vote. In our results section, we investigate
to what extent this influenced the voting patterns we document, and show that our
results are driven by the voting behaviour of the native population.
The unique electoral system used in London Assembly elections motivates our fo-
cus on the capital. This is unusual among local governments in the UK in that it
uses an “additional member system” combining first past the post as well as closed
list proportional representation. Studying the effects in the London-wide Assembly
Members election context means that we can capture the purest form of support
for far-right parties. Votes cast for the London-wide party list are least likely to
be distorted by strategic considerations that play a role in other settings, notably
the first-past-the-post electoral system used for local and parliamentary elections in
Britain. Furthermore, this is the only ballot choice where voters are asked to vote for
a party, not a candidate, meaning that party affiliation will be the primary heuristic
used by most voters. Finally, the ballot is unique to the whole of London, hence
there is no need to account for candidate effects, ballot order effects, or whether a
party is fielding a candidate or not.
5
Census 2011 Commissioned Table CT0796. There is a mismatch in the underlying definitions.
Few of these migrants were likely to have acquired British citizenship at this point. The latter
would bias our estimates of registration ratios downwards.
10This period offered fertile ground for far-right parties to tap into real or perceived
grievances associated with immigration (Campbell 1965; Dancygier 2010; Golder
2003; Ivarsflaten 2008). In addition to fears related to increased competition for
jobs, anti-immigration parties amplify welfare concerns by claiming that migrants
put pressure on services such as schooling, housing, and health care, and extract
welfare benefits (Clarke et al. 2017).6 They also capitalize on perceived cultural
threats.7 Labor market, welfare, and cultural concerns are reflected in public debates
in the UK during this period (Becker and Fetzer 2016). Judah (2016) portrays the
capital city as teeming with migrants, many unable to speak English, sleeping rough,
and working for cut-throat wages. In the run-up to the 2016 referendum on leaving
the EU, an infamous campaign poster claimed the UK was at “breaking point.” It
showed a long queue of dark-skinned migrants and demanded: “We must break free
of the EU and take back control of our borders.”
4 Data
This section provides an overview of our data, with full details in Appendix C. The
dependent variables are the percentage point changes in support for the UK Indepen-
dence Party (UKIP) and the British National Party (BNP) between 2004 and 2012.
While the BNP is a fascist party and UKIP held more populist right-wing positions
(see Golder 2003: 443), both strongly opposed immigration. We focus on 2004 and
6
For the UK, Dustmann and Frattini (2014) calculate positive net fiscal contributions for Euro-
pean migrants, but negative ones for both natives and other migrants.
7
Allport (1954) proposed the inter-group contact theory as the mediating factor between out-
group presence and attitude formation towards the other group. Several studies investigate how the
quality and quantity of inter-group contact impacts on voting for anti-immigration parties (Dinas
et al. 2019; Dustmann et al. 2019; Steinmayr 2020; Halla et al. 2017).
112012 because these elections are temporally closest to relevant census years, 2001
and 2011. There were also minimal boundary changes in this period, so that our
results are directly comparable without any adjustments or imputation. Although
London Mayoral and Assembly elections were held in 2000, when these institutions
were established, this was followed by major boundary changes. Moreover, ward-
level results were not collected until 2004.
Importantly, the 2004 elections took place only one month after the EU’s enlarge-
ment. As a result, the number of migrants from the new EU member states who
would have had time to settle in London is likely to be negligible. Therefore, we use
the 2004 election results as the baseline for pre-enlargement political views. If the
inflow of migrants in the first few weeks following the 2004 Eastern enlargement was
already sizable enough to leave an impression on the local population, and to affect
their voting behavior, our results may understate the electoral response.
The main independent variable is the percentage point change in residents born in
any of the EU8+2 member states who settled in each of the 620 London wards in our
dataset. To calculate this, we commissioned the UK Office for National Statistics
to produce ward-level census data for 2001 on the country of birth of all residents,
consistent with information from the 2011 census.8 A positive number indicates an
increase in migrant residents from EU8+2 countries. The values range from -0.06
percentage points (in Hacton, Havering, which is the only ward with a negative trend
with an EU8+2 share that dropped from 0.86% in 2001 to 0.8% in 2011) to +15.28
8
Such high-quality and granular census data may not be available for parts of the country with
fewer migrants, due to statistical disclosure controls that involve the swapping of records to safe-
guard personal information. This approach is targeted at households with unusual characteristics
in small areas, such as wards.
12percentage points (in Grove Green, Waltham Forest, where it jumped from 0.51% in
2001 to 15.79% in 2011). Figure 1 depicts these data.
We account for several potentially confounding socio-economic and demographic fac-
tors that might be correlated with both changes in voting patterns and the compo-
sition of the population. The first category encompasses changes in the median
household income and in the unemployment rate between 2001 and 2011, as well as
median house prices in 2001. The latter variable is important for modeling patterns
of migration, as affordability of housing is a key driver of residential choice. The
second category includes the percentage point changes in the retired and student
populations, as well as the percentage point change in all other foreign-born resi-
dents (excluding those born in EU8+2 countries). Changes in the native population
constitute the omitted reference category.9
5 Empirical strategy
In exploiting the geographic distribution of migrants, we face the problem of endo-
geneity of settlement choices. To overcome this issue, many papers use a shift-share
instrument, which interacts national inflows by country of origin with an initial geo-
graphic distribution of immigrants (Jaeger et al. 2018). This is an attractive solution
where previous supply shocks are unlikely to be correlated with ongoing responses.
However, constructing a shift-share instrument is not always possible. For example,
in our case, we can use data from either the 1991 or the 2001 census to recreate the
original (pre-enlargement) stock of migrants from new EU member states. The 1991
9
We also considered accounting for the change in cultural diversity and in relative deprivation.
However, we are worried about post-treatment bias and do not account for these variables in our
main specifications. Table F.3 in Appendix F reports results with alternative controls.
13census data capture the distribution of migrants prior to the granting of freedom of
movement and residence rights to nationals of EU countries in the Treaty of Maas-
tricht in 1992.10 However, most countries that joined the EU in 2004 did not exist
as independent states when the 1991 census was designed.11 While the 2001 census
contains reliable disaggregated country of birth data, we worry that the distribution
it captures is not exogenous as migration patterns may have started to shift in an-
ticipation of the EU’s Eastern enlargement.
We implement an alternative instrument based on proximity to pre-existing travel
nodes. The literature reviewed earlier emphasizes that proximity to relevant travel
nodes has both practical and emotional value for this category of migrants. Hence, it
should be reflected in their location decisions. We harness this insight and instrument
the distribution of new EU migrants across the London wards between 2001 and 2011
using distance from the nearest relevant travel hub:
zw = min(| Centroidw − BusStopi |) (1)
where the instrument zw captures the distance, in kilometres, to the nearest pre-
existing 757 bus stop (connecting central London to Luton, the base of WizzAir) or
A6 bus stop (for Stansted, the base of Ryanair). As we discuss in detail in Appendix
B, these two operators dominated bus transport to the respective airports and their
buses travelled along the same main route north through London. We only consider
10
The Treaty of Maastricht created the EU and took effect in November 1993. It established,
among others, the freedom of movement of persons. This refers to freedom of settlement, freedom
to access employment and to work, and freedom to provide services in another EU member state.
11
In 1991, Estonia, Latvia, Lithuania became independent from the USSR, and Slovenia declared
independence from Yugoslavia. In 1993, Czechoslovakia dissolved into two independent states, the
Czech Republic and Slovakia
14stops established prior to May 2004. We calculate the distance from each ward’s ge-
ometric center Centroidw to these pre-existing 757 and A6 bus stops. For each ward,
we then keep the shortest distance. This is illustrated and summarized in Figure 2,
where the bus stop locations are indicated as white dots. The darker the shading of a
ward, the closer its centroid is to the nearest of these bus stops. The inset map shows
the location of Luton and Stansted airports, both to the north of London. Flights
to and from the capital are also available at several other airports that are omit-
ted here, including Heathrow in the West and Gatwick in the South, which are the
two busiest airports in the country, as well as London City and Southend in the East.
Figure 1: Change in EU8+2 migrants, 2001-2011
15Figure 2: Proximity to bus stops instrument
We focus on bus stops, as opposed to access points to other modes of transport, for
several reasons. Luton and Stansted airports are not connected to London’s under-
ground network, unlike the capital’s largest airport Heathrow, thus ruling out this
mode of transport. We know that public transport is disproportionately important
for recent migrants in particular, as they are less likely to have a car (e.g., Tsang
and Rohr 2011; Ignatowicz 2011: 36).12 For those without a car, taking a train or
taxi would be alternatives, but both of these are significantly more expensive than a
bus.13 This makes the bus a likely choice for budget-conscious travellers. Statistics
12
Census 2011 Table DC4203EW from the Office for National Statistics shows tenure by car
or van availability by ethnic group. In London, merely 28% of those classified as English, Welsh,
Scottish, Northern Irish, or British lived in households without a car or van, while the equivalent
figure for “other white” (such as European migrants from the EU8+2 countries) was 43%.
13
The price of train journeys between London and Luton or Stansted listed in travel guides from
2004 that we consulted (see Appendix B) was up to twice the cost of a bus. The listed price of a
one-way transfer on a London taxi, or “black cab,” was up to 11 times the price for a bus. Private
16from this period confirm that sizable proportions of travellers used the bus to get to
both Luton and Stansted airports.14 Overall, these are strong reasons to focus on
this mode of transport to the airport for EU8+2 migrants who came to he capital
during these years.
The validity of our instrument rests on the key assumption that the evolution of
far-right political success was not affected by the existence of these travel nodes,
except for their effect through the proportion of immigrants who decide to settle in
their proximity for easy access to means of travel to their home countries. In our
case, the establishment of this specific transport infrastructure precedes the Eastern
enlargement of the EU. To verify the location of individual bus stops at the time
of enlargement, we obtained official confirmation from the responsible government
body, Transport for London, of the pre-existing stops on the main routes of the two
dominant operators.15 In the case of the 757 to Luton, this line was established
before the end of the Cold War, in the wake of the 1980 Transport Act deregulating
coach services. Bus services to the redeveloped Stansted airport were in place fol-
lowing the opening of a new terminal building in 1991.
hire vehicles or minicabs can be somewhat cheaper than a black cab.
14
The UK Civil Aviation Authority carries out an Annual Passenger Survey. In the
years 2004, 2005, and 2006, the reported shares of departing passengers who travelled to the
airport by bus/coach were, respectively: 24.1%, 10.4%, and 29.8% for Luton; and 11.4%,
14.3%, and 16.3% for Stansted. From 2007, the reported categories of transport modes are
different. (www.caa.co.uk/Data-and-analysis/UK-aviation-market/Consumer-research/Departing-
passenger-survey/Survey-reports/, Table 9a “Modes of transport used at the [...] survey airports,”
downloaded on January 27, 2021).
15
Coach companies need permission to operate any bus routes within London. Transport for
London (TfL) is the governing body which authorizes these requests. As we document in Appendix
B, we confirm the dominant pre-existing bus routes and operators against sources including travel
guides and official documents from the period. Smaller operators such as EasyBus or Terravision
varied over time and often travelled along the same or similar routes.
17While the decisions of some airlines to expand their routes between London and Cen-
tral and Eastern Europe responded to demand, our identification strategy requires
that their choice of airport base in London was exogenous to the processes we study.
Indeed, low-cost carriers chose their airport bases before any large-scale migration
movements from the region to London. Ryanair moved its base from Gatwick to
Stansted in 1991 already, at a time when the outcomes of the transformation pro-
cess in Central and Eastern Europe were highly uncertain and more than a decade
prior to the accession to the EU of new member states emerging from this process.
WizzAir commenced flights to and from Luton in May 2004, coinciding with their
accession. The airline had also considered Stansted as a base. Importantly, these
were not the only feasible airports for low-cost carriers, as London had a total of six
international airports. Had these airlines chosen different airports as their bases, we
contend, subsequent migrant settlement patterns across London would likely look
different, too. Given the timing of the different decisions involved, it seems highly
implausible that these companies chose their London base with reference to some
anticipated spatial distribution of Central and Eastern European migrants across
the capital, or how far-right parties might perform across different wards.
The exclusion restriction would be violated if these travel nodes affected the loca-
tion decisions of other migrant categories. This is unlikely. On average, migrants
from Western Europe constitute the wealthiest population segment in the UK (Dust-
mann and Frattini 2014), which makes them less reliant on low-cost transportation.
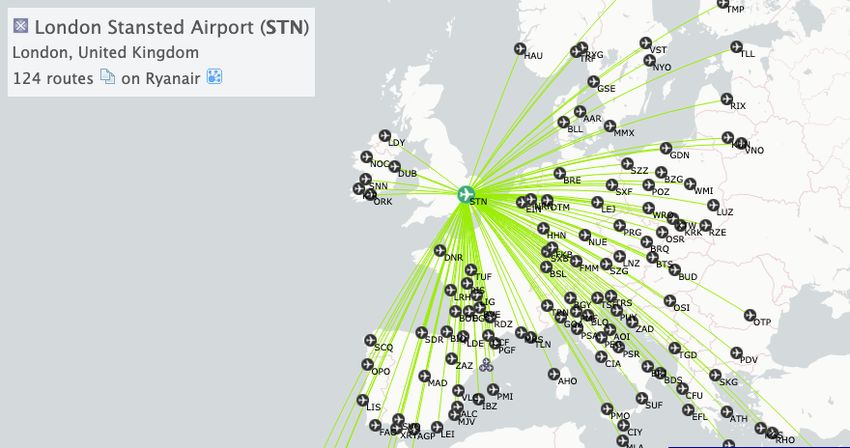
Those among this group who prefer low-cost flights have options that are more geo-
graphically dispersed. For instance, another major low-cost airline, EasyJet, services
a dense network of Western European destinations from its largest base, Gatwick,
18which is South of the capital. In addition, convenient access to several Western Eu-
ropean countries exists via several other modes of transport, including a high-speed
rail service, the Eurostar, or by car using the Channel Tunnel opened in 1994.16 Non-
EU migrants have longer travel distances to their countries of birth, which makes
travel to these destinations less convenient and more expensive. As a result, they are
less likely to travel home as frequently as those from the EU. This, in turn, makes
it unlikely that the location decisions of non-European migrants are influenced by
the proximity or accessibility of any particular international travel nodes. While
these are strong reasons to believe that the relevance of our instrument is specific to
EU8+2 migrants, we also confirm this empirically in the following section.
Casual inspection of the two maps above also suggests that our instrument is relevant.
Overall, the Northern half of the capital was both better connected to Luton and
Stansted airports, via the bus stops on the main coach routes to these airports, and
it contains many more wards with substantial post-enlargement migrant inflows than
the South. It is striking that the South East of London is furthest from access to
the key travel nodes we identify, and at the same time the part of the capital that
received the fewest migrants from the region between 2001 and 2011. In the following
section, we formally assess the relevance of our instrument.
16
Eurostar alone transported 100 million passengers between 1994 and 2009. See
www.eurostar.com/uk-en/about-eurostar/our-company/our-history (last accessed January 24,
2021).
196 Specification and results
Our model specification is as follows:
∆N ewEU w,2001−2011 = α1b + βzw + γC1w + ∆1w (2)
∆V otesp,w,2004−2012 = α2b + ρ∆N ewEU
d w,2001−2011 + γC2w + ∆2w (3)
where β in equation 2 captures the first-stage effect of our instrumental variable zw
on the percentage point change in immigrants from EU8+2 countries in ward w be-
tween 2001 and 2011, while accounting for ward-level covariates C and borough fixed
effects αb . The fitted values ∆NewEUd
w ,2001 −2011 enter the second stage specified in
equation 3, where the outcome is the percentage point change in votes cast for party
p, either UKIP or the BNP, between the 2004 and 2012 elections.
Our main findings for both outcomes are presented in Table 1. The first two columns
report baseline OLS results. The coefficients on our variable of interest suggest no
relationship in the case of UKIP, and at best a substantively small and statistically
weak relationship for the BNP. A one percentage point increase in the share of mi-
grants from the new EU member states is associated with a .01 percentage point
increase in the share of votes cast for UKIP, and an equivalent of .06 for the BNP.
These results give us a baseline against which we can evaluate our empirical ap-
proach.17
17
In our setting there is no pre-period that would allow us to assess parallel trends, or to run a
placebo regression using electoral outcomes for the pre-period. As noted earlier, although the first
elections to the London Assembly took place in 2000, no ward-level results were retained.
20Table 1: Migration from new EU member states and support for far right parties in London
OLS First Stage Placebo 1st Stage 2SLS Reduced Form
∆ All other
UKIP BNP ∆ New EU foreign-born UKIP BNP UKIP BNP
∆ New EU residents (pp) 0.01 0.06 -0.12 0.67*** 0.61***
(0.21) (1.54) (-1.87) (3.53) (3.70)
∆ All other foreign-born residents (pp) -0.14*** -0.11*** -0.07 -0.09* -0.07 -0.13*** -0.11***
(-5.18) (-3.96) (-1.73) (-2.12) (-1.76) (-5.03) (-4.00)
∆ Unemployed residents (pp) -1.11** -1.20*** 1.00* 2.91*** -1.42*** -1.46*** -0.75* -0.85**
(-3.30) (-3.96) (2.49) (5.70) (-3.41) (-4.07) (-2.21) (-2.85)
∆ Retired residents (pp) 3.25*** 2.31*** -1.38 -1.05 4.20*** 3.11*** 3.28*** 2.27***
(5.37) (4.31) (-1.63) (-0.84) (4.91) (4.08) (5.44) (4.41)
∆ Student residents (pp) -0.65* -0.90*** -0.03 3.33*** -0.67* -0.92*** -0.69* -0.94***
(-2.23) (-3.75) (-0.15) (7.98) (-2.08) (-3.48) (-2.34) (-3.83)
∆ Median household income (£000s) 0.06 -0.02 -0.09 -0.06 0.14* 0.04 0.08* -0.01
(1.48) (-0.68) (-1.22) (-0.71) (2.05) (0.75) (2.09) (-0.31)
21
Median house price in 2001 (£000s) 0.01*** 0.01*** -0.01*** -0.00 0.01*** 0.01*** 0.00* 0.00*
(3.54) (3.99) (-4.73) (-0.76) (4.31) (4.72) (2.39) (2.54)
Distance from closest A6/757 bus stop (km) -0.20*** 0.05 -0.14*** -0.12***
(-5.62) (0.92) (-4.44) (-4.48)
Observations 620 620 620 620 620 620 620 620
Borough fixed effects 3 3 3 3 3 3 3 3
F-test on excluded instrument 31.56 0.84
R2 0.74 0.70 0.61 0.65 0.75 0.71
Notes: OLS or 2SLS estimates with t-statistics based on robust standard errors. The dependent variable for columns 1, 5 and 7 is the percentage
point change (∆ pp) in votes cast for the UK Independence Party between 2004 and 2012. Columns 2, 6 and 8 have as outcome the percentage
point change in votes cast for the British National Party between 2004 and 2012. The outcome variable in column 3 is the percentage point change
in residents from new EU member states between 2001 and 2011, while the outcome variable for column 4 is the percentage point change in all
other foreign-born residents during the same time period. Columns 1 and 2 estimate the OLS results. Column 3 estimates Equation 2, while
column 4 is a placebo first stage, where we estimate the role of A6 and 757 bus stops on the settlement patterns of non-EU8+2 migrants. Columns
5 and 6 estimate Equation 3. The final two columns show the reduced form for the bus stop instrument. All ∆ in the control variables refer to the
percentage point change between 2001 and 2011, except for median household income, which refers to the change between 2001/02 and 2012/13,
the closest available data. * p < 0.05, ** p < 0.01, *** p < 0.001The first-stage results in column three of Table 1 allow us to assess the strength of
our instrument. The instrument is a significant predictor of the change in new EU
residents. The first-stage F-test on the omitted instrument comfortably exceeds the
conventional cut-off value of 10, indicating that our instrument provides sufficient
exogenous variation. In other words, our bus stop instrument and the spatial dis-
tribution of the accession-induced migration shock are sufficiently correlated for the
instrument to be relevant.
We also carry out a placebo first-stage regression, where we use the change in other
foreign-born residents as the dependent variable and control for the change of EU8+2
residents. These results are presented in column four of Table 1. As we argue above,
other migrant groups are not obviously dependent on the specific transportation
infrastructure that underpins our identification strategy. Indeed, the results con-
firm that our instrument is unrelated to the change in non-EU8+2 migrants across
wards. This provides additional support for our claim that the bus stops in Figure
2 are likely to affect the location decisions of EU8+2 migrants in particular, but not
those of other foreign-born residents where the country of birth is further away or
conveniently accessible via a wider range of travel options.
Columns five and six in Table 1 implement our instrumental variables (IV) approach.
The second-stage point estimates of .67 (for UKIP’s vote share) and .61 (for the
BNP’s) are positive and statistically significant at all conventional thresholds. In
relative terms, the IV estimates are much larger than their OLS baselines, increas-
ing ten-fold for the BNP and over sixty-fold for UKIP. These increases in coefficient
size relative to the OLS results underscore the importance of modeling the location
choices of migrants. The OLS estimates suffer from substantial bias due to immi-
22grant sorting that masks the true effect of migration on support for far-right parties.
Our instrument addresses this bias by identifying a channel which functions indepen-
dently of the electoral dynamics we examine. Translated into the absolute number
of votes, a one percentage point increase in EU8+2 migrants in a ward generated 27
additional votes for UKIP and 19 for the BNP (Table F.1). These are sizable impacts
given that in 2012 these parties averaged 124 and 59 votes, respectively (Table C.3).
To round off our results, the final two columns in Table 1 present reduced-form re-
gressions for both outcome variables. A statistically insignificant coefficient on our
instrument in these regressions would result in no significant effect in our IV regres-
sions, which is not the case. Conversely, a significant coefficient would be a particular
concern if it coincided with no result in the first stage, indicating a violation of the
exclusion restriction that our instrument works only through its effect on the loca-
tion decisions of EU8+2 migrants. In our case, the coefficient on the instrument is
statistically significant in both the first-stage and reduced-form regressions.
As EU8+2 migrants were registered to vote in sizable proportions, one possibility is
that they themselves voted for the BNP or UKIP, perhaps in reaction to the capital’s
ethnic diversity. Although we cannot test directly to what extent these electors did
participate in elections, we find no significant effect of EU8+2 migration on overall
turnout (Table F.2). However, survey evidence does not support the hypothesis that
a significant number of migrants voted for the BNP and UKIP. In 2016, wave eight
of the internet panel of the British Election Study 2014-2023 (Fieldhouse et al. 2020)
included the question: “Which party or independent candidate will you vote for to be
your Assembly-wide member?” Out of 2,798 respondents, 282 declared they voted
for UKIP. Of these 282, merely five had another EU country’s citizenship, four were
23Commonwealth citizens, and two declared another non-British citizenship. The EU
category includes EU8+2 nationals but also respondents from the 15 member states
of the EU prior to 2004. While results for the BNP are not available from this study,
it is even less plausible that immigrants would vote for this ultra-nationalist party
(John et al. 2006). This strongly supports the conclusion that the electoral response
we document is driven by the voting behavior of the UK-born population.
We assessed our empirical strategy against alternative approaches in related litera-
ture. Appendix E provides a detailed discussion of these results. We use, in turn,
initial distributions of EU8+2 migrants in 1991 or 2001 and versions of the shift-
share instrument exploiting this information (Table E.3). As the 1991 census does
not contain precise data on EU8+2 migration, we develop an imputation strategy.
The resulting instruments are somewhat weaker, perhaps due to these data limita-
tions. In contrast, instruments using the 2001 initial shares are strong. In addition,
we also use an alternative transportation-related instrument. Analogous to our bus
stop instrument, we calculated each ward’s distance to the nearest of three train
stations with direct connections to Luton (King’s Cross/St Pancras) or Stansted
(Tottenham Hale and Liverpool Street). Finally, we combine our preferred bus stop
variable and either 1991 or 2001 initial shares as instruments (Table E.4). As it
turns out, for each party we analyze, the IV estimates obtained with any of seven
alternative instruments or their combinations with our bus stop instrument are very
similar to our core results.
Finally, we explore the sensitivity of our results to variations in control variables in
Table F.3. First, we drop all controls. In this specification, our instrument is too
weak. A more complete model of residential choice includes the affordability of hous-
24ing. When we add median house prices in 2001 as a control, our instrument becomes
highly relevant. We then introduce, in turn, borough fixed effects and demographic
controls. This reduces the size of the coefficients of interest, but does not affect the
pattern of results. Finally, we experimented with an index of deprivation widely used
by policy-makers in the UK. This required dropping some other controls that are re-
lated to or incorporated into this measure, such as house prices. Our instrument
is borderline weak in this specification. All of these alternatives yield positive and
statistically significant estimates on our variable of interest. Our results are robust
and our main specification produces the most conservative estimates.
7 Conclusion and implications
Recent decades have seen the rise of new patterns of migration that involve unprece-
dented levels of mobility between the country of birth and the destination country
of migrants. To examine the electoral consequences of hypermobile migration, we
draw on two separate strands of research: a growing political economy literature on
the electoral impact of migration at the local level, and the transport and human
geography literature related to migration. Our empirical work exploits substantial
heterogeneity of changes in the composition of residents across 620 wards in London
following the EU’s Eastern enlargement in 2004 and 2007. The enlargement brought
a policy shift by disabling legal barriers to migration from the region and coincided
with a boom in the low-cost aviation industry that ensured regular and affordable
flight connections. We show that the location decisions of these highly-mobile mi-
grants were linked to the ease of access to this travel infrastructure, in turn shaping
the electoral geography of support for far-right parties. Based on this, we estimate
that a one percentage point increase in the share of migrants from the EU’s Eastern
25accession countries increased the vote shares of the two major anti-immigrant far-
right parties, UKIP and the BNP, by about two-thirds of this amount. Even one of
the world’s most diverse cities is not immune to far-right parties.
Our work makes several contributions to the study of migration and its electoral
consequences. First, much of the literature on the electoral effects of migrants has
focused on groups with typically infrequent post-migration travel to their country
of birth, including refugees. Yet as we highlight, this may not apply to the entire
population of migrants, which is extremely heterogeneous. We are not aware of
prior work that has attempted to identify the causal effect on electoral outcomes
of highly-mobile migration. We tackle this gap by exploiting the distinct transport
patterns that influence the location decisions of such migrants in the context we ex-
amine. Prior studies incorporate different distinctions, for instance between high and
low-skilled migrants (e.g., Halla et al. 2017; Mayda et al. 2018). Our work suggests
that a distinction between highly-mobile and less-mobile migrants deserves further
exploration. For instance, given that mobility may affect pressures to assimilate and
the perceptions of the host community, future work should assess whether there are
distinct electoral consequences associated with more and less mobile migrants, and
the persistence of any effects over time.
In addition, our approach expands the methodological toolkit for the study of the
consequences of migration, which thus far has relied heavily on versions of the shift-
share instrument in attempts to tackle endogeneity of settlement choices among new
migrants. Yet over-reliance on this strategy has been a growing concern among migra-
tion scholars (Jaeger et al. 2018), and alternatives are needed where data constraints
preclude or limit the usefulness of this approach. Our paper provides such an alterna-
26tive. Drawing on a hitherto separate literature on transport and human geography,
we develop an instrumental variable based on the proximity to travel hubs that are of
specific importance to the migrant group we study. Our approach offers a potential
solution to researchers who face similar data constraints, and it can serve as a ro-
bustness check for studies that primarily rely on the traditional shift-share approach.
We see significant potential to deploy our approach across a wider range of settings to
analyze the electoral consequences of migration. One of the distinguishing features
of the wave of migration into the UK that we study is that it resulted in settlement
patterns that are more geographically spread out than previous waves of migration
(Kone 2018). This may well be linked to the evolution of flight networks across
the UK during this period, and similar relationships may hold in other countries
where low-cost travel boosted international mobility. Moreover, the flip side of the
phenomenon we examine is emigration, which affects the demographic composition
of communities that are left behind. Recent scholarship exploits geographic hetero-
geneity in emigration to analyze its electoral consequences (Anelli and Peri 2017).
In this area, too, future work could deploy empirical strategies based on pre-existing
transportation links.
Our analysis also has policy implications at a time when migration is a major theme
in political debates in many countries. Concerns about high levels of immigration
played a significant role in the UK’s 2016 referendum decision to leave the EU (Clarke
et al. 2017). In the EU, policy debates relating to the liberalization of travel mar-
kets and increased mobility have highlighted the economic benefits, going as far as
claiming that low-cost airlines are “bringing Europe closer together” (Akgüç et al.
2018). Our work highlights a political dark side of mobility that pulls into the po-
27lar opposite direction, and which is ignored in this argument. In drawing lessons
from Brexit for the prospects of European integration, discussions of cross-national
mobility should look beyond economic benefits. If policy-makers promote mobility,
they should also pay attention to its potential political consequences and consider
how they might be mitigated. By uncovering the geographical distribution of the
unintended political side-effects of low-cost travel, our work can help target policy
interventions to counteract the attraction of anti-immigrant rhetoric in communities
most affected by migration.
28References
Akgüç, M., M. Beblavý, and F. Simonelli (2018). Low-Cost Airlines: Bringing the
EU Closer Together. Brussels: Centre for European Policy Studies.
Allport, G. (1954). The Nature of Prejudice. Reading, MA: Addison-Wesley.
Anelli, M. and G. Peri (2017). “Does Emigration Delay Political Change? Evidence
from Italy during the Great Recession”. Economic Policy 32 (91), 551–596.
Barone, G., A. D’Ignazio, G. de Blasio, and P. Naticchioni (2016). “Mr. Rossi, Mr.
Hu and Politics. The Role of Immigration in Shaping Natives’ Voting Behavior”.
Journal of Public Economics 136, 1–13.
Becker, S. O. and T. Fetzer (2016). “Does Migration Cause Extreme Voting?”. CAGE
Working Paper 306, Center for Competitive Advantage in the Global Economy,
University of Warwick, Coventry.
Burrell, K. (2011). “Going Steerage on Ryanair: Cultures of Migrant Air Travel
between Poland and the UK”. Journal of Transport Geography 19 (5), 1023–1030.
Calderon, A., V. Fouka, and M. Tabellini (2019). “Racial Diversity, Electoral Prefer-
ences, and the Supply of Policy: The Great Migration and Civil Rights”. Harvard
Business School Working Paper 20-017, Harvard Business School, Cambridge, MA.
Campbell, D. T. (1965). “Ethnocentric and Other Altruistic Motives”. In D. Levine
(Ed.), Nebraska Symposium on Motivation, Volume 13, pp. 283–311. Lincoln, NE:
University of Nebraska Press.
29Census Information Scheme (2011). “2011 Census Labour Market & Qual-
ifications, Labour Data” [Computer file]. London Datastore [distributor],
https://data.london.gov.uk/dataset/e943184f-c873-4a67-bc04-a8fad272ce6c.
Chatman, D. G. and N. Klein (2009). “Immigrants and Travel Demand in the United
States: Implications for Transportation Policy and Future Research”. Public Works
Management and Policy 13 (4), 312–327.
Civil Aviation Authority (2020). “International Air Passenger Traffic To and From
UK Reporting Airports” [Computer file]. Civil Aviation Authority [distributor],
www.caa.co.uk/Data-and-analysis/UK-aviation-market/Airports/Datasets/UK-
Airport-data/Airport-data-1990-onwards/.
Clarke, H. D., M. J. Goodwin, M. Goodwin, and P. Whiteley (2017). Brexit. Cam-
bridge: Cambridge University Press.
Dancygier, R. M. (2010). Immigration and Conflict in Europe. Cambridge: Cam-
bridge University Press.
Dinas, E., K. Matakos, D. Xefteris, and D. Hangartner (2019). “Waking up the
Golden Dawn: Does Exposure to the Refugee Crisis Increase Support for Extreme-
Right Parties?”. Political Analysis 27 (2), 244–254.
Dobruszkes, F. (2009). “New Europe, New Low-Cost Air Services”. Journal of
Transport Geography 17 (6), 423–432.
Dustmann, C., M. Casanova, M. Fertig, I. Preston, and C. M. Schmidt (2003). “The
Impact of EU Enlargement on Migration Flows”. Home Office Online Report
25/03, Home Office, London.
30Dustmann, C. and T. Frattini (2014). “The Fiscal Effects of Immigration to the UK”.
Economic Journal 124 (580), F593–F643.
Dustmann, C., K. Vasiljeva, and A. Piil Damm (2019). “Refugee Migration and
Electoral Outcomes”. Review of Economic Studies 86 (5), 2035–2091.
Edo, A., Y. Giesing, J. Öztunc, and P. Poutvaara (2019). “Immigration and Electoral
Support for the Far-Left and the Far-Right”. European Economic Review 115, 99–
143.
Fetzer, T. (2019). “Did Austerity Cause Brexit?”. American Economic Re-
view 109 (11), 3849–3886.
Fieldhouse, E., J. Green, G. Evans, H. Schmitt, C. van der Eijk,
J. Mellon, and C. Prosser (2020). “British Election Study Internet
Panel Waves 1-19” [Computer file]. British Election Study [distributor],
https://www.britishelectionstudy.com/data-objects/panel-study-data/.
Golder, M. (2003). “Explaining Variation in the Success of Extreme Right Parties in
Western Europe”. Comparative Political Studies 36 (4), 432–466.
Golder, M. (2016). “Far Right Parties in Europe”. Annual Review of Political Sci-
ence 19, 477–497.
Goldsmith-Pinkham, P., I. Sorkin, and H. Swift (2020). “Bartik Instruments: What,
When, Why, and How”. American Economic Review 110 (8), 2586–2624.
Greater London Authority (2004). “London Elections Results 2004,
Votes by Ward 2004” [Computer file]. London Datastore [distributor],
https://data.london.gov.uk/dataset/london-elections-results-2004-borough.
31You can also read