Retail Analytics Market Overview 2019 - ComCap LLC
←
→
Page content transcription
If your browser does not render page correctly, please read the page content below

2019

Retail Analytics Market Overview
ComCap’s perspectives on Retail Analytics is shared with ~500+
financial and ~300+ strategic investors
▪   ComCap’s perspectives on various industries, including trends in retail analytics, is being shared with our large
    network of strategic and financial investors globally
▪   This facilitates a better understanding of sweet spots for these investors; and ultimately helps to better position a
    mandated client with selected players
▪   Unique disruptors additionally gain a boost to global coverage via ComCap’s reach

                                                                                                                            2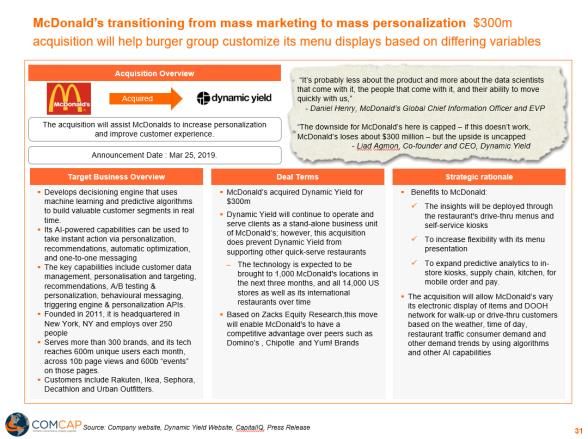
An introduction to ComCap
▪   ComCap is a premier boutique investment bank focused on the intersection of commerce and capital, with key focus on B2B SaaS,
    B2C ecommerce, payments, mobile commerce, marketplaces and B2B services for retail technologies (IT and marketing services, in-
    store, fulfillment, logistics, call center, analytics, personalization, location intelligence)

▪   Headquartered in San Francisco with European coverage from London & Moscow, and LATAM coverage from Sao Paulo. Our firm
    works with mid-cap public companies on buyside initiatives and public and private growth companies on financing and strategic M&A

▪   In addition to being the only boutique focused on disruptive commerce models, we differentiate by:
    ‒ Bringing bulge bracket techniques to emerging models;
    ‒ A strong and uncommon buyside/strategy practice;
    ‒ Deep understanding of industry drivers and synergy analyses;
    ‒ Deep relationships across the sector; and
    ‒ Worldwide coverage with closed transactions in the United States, Japan, China, the ASEAN region, Western and Eastern
      Europe and Latin America
    ‒ If you would like to make a submission, please email analytics@comcapllc.com

▪   Your global ComCap team:

                  Aron Bohlig                    Steve Terry                   Fermin Caro                  Carlos Gonzalez
                  Managing Partner               Managing Director             Director                     Director
                  M: +1 415-235-8270             M: +1 415-971-3794            M: +1 650-743-7825           M: +7 915-413-1911
                  E: aron@comcapllc.com          E: steve@comcapllc.com        E: fermin@comcapllc.com      E: carlos@comcapllc.com

                                                 Peter Creech                  Daniel Radomysler
                                                 Senior Associate              Associate
                                                 M: +1 508-685-1620            M: +55 11 99658-7977
                                                 E: peter@comcapllc.com        E: daniel@comcapllc.com

                                                                                                                                        3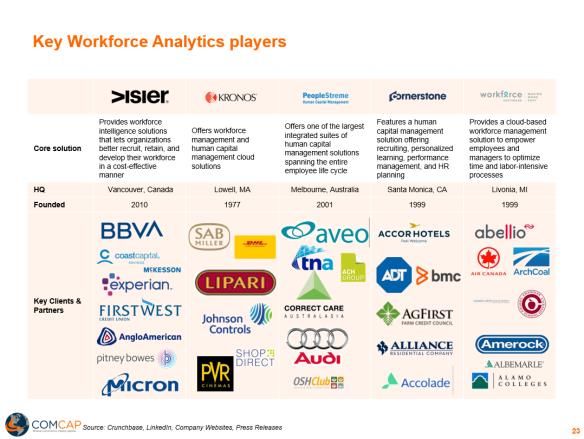
ComCap – Active in 14 countries, including 9 of the top 10
global ecommerce markets

     $740.0

                      $561.0

                                              Retail Ecommerce Sales Worldwide – 2019 ($US bn)1
                                      $93.0          $87.0     $77.0        $69.0      $55.0      $44.0     $22.0      $16.0

     China              US             UK            Japan    Germany    South Korea   France     Canada   Australia   Brazil

        1Source:   Shopify Plus Ecommerce Playbook
                                                                                                                                4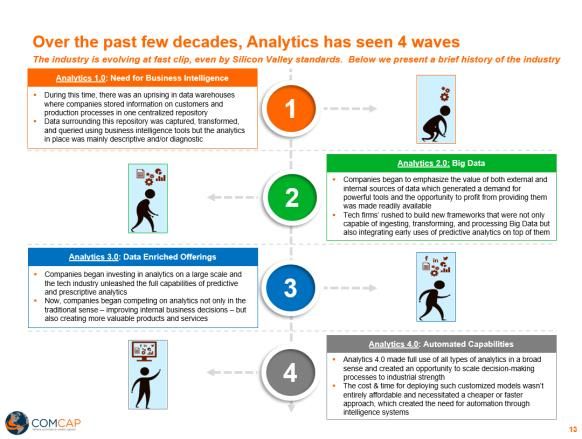
ComCap’s current thematic focus areas

         Theme                                                       Description                                                 Select companies
Artificial Intelligence /   Focus on disruptors in the artificial intelligence space focused on ecommerce, logistics, retail,
Analytics                   predictive, payment, risk and marketing

                            Digitally native D2C brands harnessing modern technology and business models to reach the
B2C and Vertical
                            end consumer, covering clothing, accessories, personal care, home and kitchen, furniture, and
Brands (DNVBs)
                            other consumer-focused products

Ecommerce SaaS              Emerging and disruptive SaaS businesses in the ecommerce sector

                            Retail and commerce-related disruptors in the fintech universe. Current focus areas include
Fintech
                            payments, risk analytics, false declines and retail point-of-sale, especially mobile (mPOS)

                            Emerging platforms and providers innovating and optimizing the many facets of the supply
Logistics                   chain ecosystem

                            Emerging platforms in digital marketing, who focus on optimization in digital marketing and
Marketing Suites
                            content delivery

                            Focused on mobile solution providers optimizing the mobile experience from desktop-to-mobile
Mobile
                            website conversions, targeted mobile marketing, to simplifying the mobile checkout experience

Personalization             Emerging players in the ecommerce personalization space

Retail In-store             Platforms and solutions that enable retailers improve customer experience, productivity, and
technology                  operational inefficiencies

                            Agencies and systems Integrators implementing retail focused technology spanning the above
Agencies and System
                            sectors, including large SIs covering multiple platforms, as well as smaller SIs covering just one
Integrators
                            or a handful of platforms

                                                                                                                                                    5
ComCap’s thematic landscape
                                                     Tech Companies                                                Retailers/Brands
Major Players

                                                                                                        Welcome AG i.G.

                >$200m

                $100m

                $75m
Amount Raised

                $50m

                $25m

                0
                         AI/Analytics          B2C            Ecommerce   Fintech   Logistics   Marketing                 Mobile      Personalization      Retail
                                                                 SaaS                                                                                     In-store
                                                                                                                                                        technology
                             Source: Capital IQ, Pitchbook
                                                                                                                                                                     6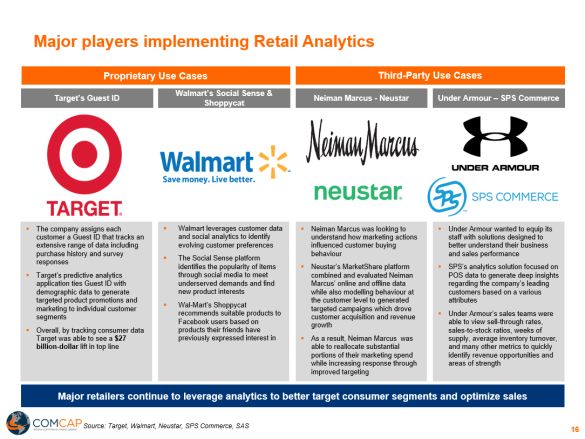
Retail Analytics – Key themes and case studies

  P.
  8
       Retail Analytics Landscape

         P.
         10
               Retail Analytics Broad Market Overview

              P.
              15    Customer Engagement Analytics

               P.
               19    Workforce Analytics

               p.
               23    Supply Chain Analytics

              p.
              27    Landmark M&A Transactions

         P.
         36
               Leading Public Companies

  P.
  38   Select Key Disruptors

                                                        7
Retail Analytics Landscape

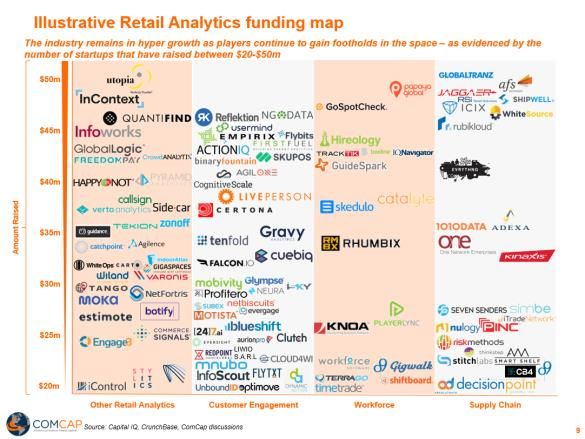
Illustrative Retail Analytics funding map
                The industry remains in hyper growth as players continue to gain footholds in the space – as evidenced by the
                number of startups that have raised between $20-$50m

                   $50m

                   $45m

                   $40m
Amount Raised

                   $35m

                   $30m

                   $25m
                                                                           LIWIO
                                                                           S.A.R.L

                   $20m

                              Other Retail Analytics               Customer Engagement   Workforce           Supply Chain

                            Source: Capital IQ, CrunchBase, ComCap discussions
                                                                                                                                9
Retail Analytics Broad Market Overview
Over the past few decades, Analytics has seen four waves
The industry is evolving at fast clip, even by Silicon Valley standards. Below we present a brief history of the industry
       Analytics 1.0: Need for Business Intelligence

▪   During this time, there was an uprising in data warehouses

▪
    where companies stored information on customers and
    production processes in one centralized repository
    Data surrounding this repository was captured, transformed,
                                                                        1
    and queried using business intelligence tools but the analytics
    in place was mainly descriptive and/or diagnostic

                                                                                                 Analytics 2.0: Big Data

                                                                            ▪   Companies began to emphasize the value of both external and
                                                                                internal sources of data which generated a demand for

                                                                        2   ▪
                                                                                powerful tools and the opportunity to profit from providing them
                                                                                was made readily available
                                                                                Tech firms rushed to build new frameworks that were capable
                                                                                of managing and processing big data but also incorporated
                                                                                early uses of machine learning and predictive analytics

           Analytics 3.0: Data Enriched Offerings
▪   Companies began investing in analytics on a large scale which
    fully leveraged both predictive and prescriptive analytics
▪   Now, companies began competing on analytics not only in the
    traditional sense – improving internal business decisions – but
    also creating more valuable products and services through a
                                                                        3
    combination of proprietary first party data and merged 3 rd party
    data

                                                                                        Analytics 4.0: Automated Capabilities
                                                                            ▪   Analytics 4.0 is making full use of all types of analytics in a

                                                                        4   ▪
                                                                                broad sense and created an opportunity to scale decision-
                                                                                making processes to industrial strength
                                                                                The cost & time for deploying such customized models wasn’t
                                                                                entirely affordable and necessitated a cheaper or faster
                                                                                approach, which created the need for automation,
                                                                                accomplished through the incorporation of artificial intelligence

                                                                                                                                                    11
Key drivers for the implementation of Analytics in Retail
▪ Retailers can use analytics to more ▪ Incorporating analytics to assess store-by-
strategically allocate their budget, store performance allows brands to better
increasing productivity and scheduling while position themselves as strategic partners to
improving recruitment, retention, and retailers who understand their unique
development activities customer base
▪ Furthermore, analytics can help align the ▪ Through data sharing, retailers and
supply of labour and forecasted demand suppliers will be able to further improve
while taking into consideration the
Workforce Supply Chain efficiency and reduce costs for managing,
availability and preferences of associates Development Efficiency purchasing, and delivering products
and their individualized abilities and skills
▪ In the past few decades, methods for ▪ Advanced analytics can allow retailers to
generating, collecting, and storing data derive valuable insights by measuring
have fundamentally changed with the rise of differences in demand across customer
massive data sources creating torrents of Growth in Dynamic segments, identifying key value items,
information that is both deep and diverse Sources of Pricing clustering in zones, and assessing
▪ The increasing availability of data has also Data shopping behaviour across channels
fuelled advances in analytical techniques ▪ Guided by a data-driven pricing strategy,
and technologies and these newly retailers can also identify unmet customer
developed tools have been and will demand for retailers to profitably fulfil
continue to transform traditional retail
Marketing Customer ▪ Customer analytics can be leveraged to
▪ Today’s analytics tools can deliver insights
through looking at interactions among items
Optimization Engagement generate customer insights identifying sales
and margin levers in the process along with
like the media channels, promoted items,
more traditional targeted marketing
and target segments to understand the most
effective media weight, placement, and ▪ As a result analytics has begun shift
flighting towards analyses of customer engagement
to determine underserved groups of
▪ Analytics is also expanding to include
customers with the propensity to increase
collaborative systems that integrate
spending broadly and more specifically in
marketing and merchandising – more closely
corresponding opportunity categories
connecting supplier and distribution partners
Source: Deloitte, McKinsey
12Retail Analytics will continue to experience its industry leading
growth trajectory
At-a-Glance: Retail Analytics Market Breakdown Global Retail Analytics Industry
▪ Expected to exceed $13B by 2024 from $3.1B in 2016, growing at In US $ Billions
a CAGR 19.7%
$14
▪ Major business leaders continue to recognize the value of $12
analytics 19.7% CAGR
$10
– 49% of high-performance companies have CEOs who believe
$8
strategic, actionable insights based on customer analytics are
vital to an organization’s success $6
– 62% of retailers report that the use of analytics creates a $4
competitive advantage for companies $2
▪ Despite this, most retailers struggle to make the most of their data $0
2016 2017 2018 2019 2020 2021 2022 2023 2024
– 74% of firms say they want to be data-driven, but only 29% are
Global Retail Analytics Market
successful at connecting analytics to action
– Of the 700 million websites that exists, 72% fail to consistently US Retail Analytics Market by Application
engage users or drive conversions
In US $ Billions
▪ Companies that are successful in implementing analytics $20
experience a myriad of benefits: $18
$16
– Highly data-driven organizations are 3x more likely to report $14
significant improvement in decision-making $12
$10
– Companies championing the use of retail analytics are 6.5x $8
more likely to retain customers, 7.4x more likely to outperform $6
their competitors on making sales to existing customers and $4
$2
nearly 19x more likely to achieve above-average profitability
$0
Customer Merchandising In-Store Supply Chain Strategy and
– 50% of companies who master the art of analytics are likely to Management Operations Planning
have sales significantly above their competitors 2016 2024
Source: McKinsey, Forrester, University of Pennsylvania, Google, Forbes
13Major players implementing Retail Analytics
Proprietary Use Cases Third-Party Use Cases
Walmart’s Social Sense &
Target’s Guest ID Neiman Marcus - Neustar Under Armour – SPS Commerce
Shoppycat
▪ The company assigns each ▪ Walmart leverages customer data ▪ Neiman Marcus was looking to ▪ Under Armour wanted to equip its
customer a Guest ID that tracks an and social analytics to identify understand how marketing actions staff with solutions designed to
extensive range of data including evolving customer preferences influenced customer buying better understand their business
purchase history and survey behaviour and sales performance
▪ The Social Sense platform
responses
identifies the popularity of items ▪ Neustar’s MarketShare platform ▪ SPS’s analytics solution focused on
▪ Target’s predictive analytics through social media to meet combined and evaluated Neiman POS data to generate deep insights
application ties Guest ID with underserved demand and find Marcus’ online and offline data regarding the company’s leading
demographic data to generate new product interests while also modelling behaviour at customers based on a various
targeted product promotions and the customer level to generate attributes
▪ Wal-Mart’s Shoppycat
marketing to individual customer targeted campaigns which drove
segments
recommends suitable products to
customer acquisition and revenue ▪ Under Armour’s sales teams were
Facebook users based on able to view sell-through rates,
growth
▪ Overall, by tracking consumer data products their friends have sales-to-stock ratios, weeks of
Target was able to see a $27 previously expressed interest in ▪ As a result, Neiman Marcus was supply, average inventory turnover,
billion-dollar lift in top line able to reallocate substantial and many other metrics to quickly
portions of their marketing spend identify revenue opportunities and
while increasing response through areas of strength
improved targeting
Major retailers continue to leverage analytics to better target consumer segments and optimize sales
Source: Target, Walmart, Neustar, SPS Commerce, SAS
14Customer Engagement Analytics
Customer Analytics represents a $4bn market and shows no sign
of slowing momentum
                      Customer Analytics outlook                                   Global Customer Analytics Market (In $b)

▪   Expected to reach ~ $9.5B by 2024 while growing at an 18.2%
    CAGR over the next 5 years                                                                                                     $9.5

▪   The rise of customer analytics largely stems from recognition of its
    necessity by industry leaders
                                                                                                                $4.1
    – 73% of business leaders say that delivering a relevant and
      reliable customer experience is critical to their company’s overall              $1.6
      business performance today
                                                                                      2014                  2019                  2024E
▪   Despite the recognition that there is a need for customer analytics,
    very few companies have acted on this need
                                                                                  Importance of real-time customer analytics
    – Only 3% of respondents believed they are able to act on all of the      Percentage of respondents indicating that the ability to use
      customer data they collect; 21% say they can act on very little of it   real-time customer analytics to improve customer experience
                                                                              across touch points and device is extremely important today
    – Additionally, 42% of respondents say their analytics systems don’t      and that it will be extremely important in two years
      meet current organizational needs
                                                                                         60%                                     79%
▪   However, there are clear incentives to make the shift as data-driven
    organizations are 23x more likely to acquire customers, and 6 times
    as likely to retain customers
                                                                                      2018                                     2020
▪   Companies championing the use of customer analytics are also 7.4x
                                                                              Current ability to deliver real      Future ability to deliver real
    more likely to outperform competitors in selling to existing customers    time customer interactions           time customer interactions
    and nearly 19x more likely to achieve profitability                       across touch points and              across touch points and
                                                                              devices.                             devices.

             Source: McKinsey, Mordor Intelligence, MIT, Forbes
                                                                                                                                                    16
Key Customer Analytics players
Provides an API-based Leading enterprise Develops a customer Develops AI-powered
Amplitude offers product
analytics platform customer success engagement and consumer experience
analytics to help
designed to deeply solution that enables analytics platform platform enabling
companies better
Core solution understand every user’s companies to align offering collated and greater customer
understand user
journey with instant around their customers consolidated customer engagement and better
behaviour and derive
insights for everyone on to increase loyalty and journeys augmented by omnichannel buying
insights
mobile and web customer lifetime value machine learning experiences
HQ San Jose, CA San Mateo, CA San Francisco, CA Sunnyvale, CA Singapore, Singapore
Founded 2007 2001 2012 2013 2008
Key Clients &
Partners
Source: Crunchbase, LinkedIn, Company Websites, Press Releases
17Capillary Technologies overview
Bata Case Study
Bata’s existing marketing efforts at the time were primarily via SMS to
Challenges mass customer list and as a result Bata was not able to hit their target
segments nor generate a strong conversion rate from marketing efforts
Filtered customers using offline data such as purchase behaviour and
campaign responsiveness and segmented based on demographics
Incorporated analytics to clearly identify marketing campaigns aimed at
Solution the targeted customer segments generated from first layer of filtering
Overall, Bata saw a 34% higher hit rate from targeted campaigns and 57x
ROI specifically from the targeted ladies wear campaigns
Product Overview
Omnichannel Data Capture – customers can gather and integrate customer data across channels to create customer journeys
Essential Insights – enables customers to create analytics dashboards, promoting cross functional collaboration
Insight+ Deep Customer Analytics – offers companies better understanding of customer journeys and behaviour to enable data-driven marketing
Automated Business Insights – improves efficiency and growth with strategic, actionable generated from AI-powered predictive models
Retail Store Insights – vision-based analytics solution analysing in-store foot patterns to optimize staffing and store performance
Campaign Manager – companies can better manage campaigns through intelligent rewards and personalized customer engagement
Journey Builder – leverages data to better engage with and influence consumer journeys to increase marketing impact and relevance
Engage+ Real Time Dynamic Offers – personalized, dynamic offers sent to customers at each interaction increasing avg. basket sizes and values
Data Drive Marketing – incorporates analytics into understanding consumer behaviour and preferences from existing data sets
Omnichannel Customer Engagement – increases efficiency of data capture and marketing efforts across platforms
Source: Capillary Technologies
18Workforce Analytics
Workforce Analytics growth lags other cohorts as only certain
industries are embracing the technology
            Workforce Analytics Market Breakdown                                         Global Workforce Analytics Industry
▪   Expected to reach ~$2B by 2025 while growing at an 11% CAGR                In US $ Millions

    –   Retail is expected to dominate the market going forward,               1200.0
        accounting for more than 23% of the overall revenue share                                       11% CAGR
                                                                               1000.0
    –   North America currently dominates the field, but the Asia-
        Pacific region is likely to grow most quickly over the next             800.0
        decade
                                                                                600.0
▪   Approximately 71% of companies see people analytics as a high
    priority in their organizations                                             400.0
    –   At 68% of organizations, HR analytics is the most common
                                                                                200.0
        area for future investment
    –   65% of companies are planning to increase investment into                 0.0
                                                                                         2016    2017   2018   2019   2020   2021   2022   2023   2024
        analytics over the next 3 years
▪   Over the last 5 years, the industry has moved from static HR                                    Global Workforce Analytics Market

    management to more dynamic, real-time tools and platforms
    – 29% of companies think they are effectively leveraging                              Workforce Analytics Maturity Model
      external data as part of their people analytics
    – 44% of companies are using their workforce data to predict
      their own business performance                                                    Institutionalized & Business-Integrated                     2%
    – 51% of organizations now review the business impact of their
      HR programs                                                                                  Accessible & Utilized                            15%
▪   Despite the strong growth of workforce analytics, predominantly
    across North America, adoption has been concentrated in certain
    industries and overall adoption rates remain relatively low                                  Consolidated & Building                            69%
▪   Incorporation of workforce analytics allows companies to optimally
    allocate their human resources with minimal operational cost to
    the organization                                                                            Fragmented & Unsupported                            14%

             Source: Zion Market Research, Grandview Research, PwC, Deloitte
                                                                                                                                                          20
Key Workforce Analytics players
Provides workforce Features a human Provides a cloud-based
Offers one of the largest
intelligence solutions Offers workforce capital management workforce management
integrated suites of
that lets organizations management and solution offering solution to empower
human capital
Core solution better recruit, retain, and human capital recruiting, personalized employees and
management solutions
develop their workforce management cloud learning, performance managers to optimize
spanning the entire
in a cost-effective solutions management, and HR time and labor-intensive
employee life cycle
manner planning processes
HQ Vancouver, Canada Lowell, MA Melbourne, Australia Santa Monica, CA Livonia, MI
Founded 2010 1977 2001 1999 1999
Key Clients &
Partners
Source: Crunchbase, LinkedIn, Company Websites, Press Releases
21Visier overview
Electronic Arts Case Study
EA was looking to revamp their HR process. Despite having plenty of data,
Challenges reporting was often difficult and time-intensive to produce, and further, these
reports didn’t offer enough depth to go from workforce observation to diagnosis
Visier’s automated reporting and analytics offered improved visibility across
divisions and business partners to better integrate headcount planning processes
Addition of applicant tracking allowed EA evaluate competencies of new grad
Results hires and found they were more likely to be rated as high performers, more likely
to be promoted and cost the company less than their more experienced peers
Overall, EA saved 24+ weeks of labour yearly due to analytics implementation
Product Overview
Transforms workforce planning process and its effectiveness, by enabling continuous, collaborative, data-driven planning
Planning allowing companies to make more informed investments, optimize workforce costs, and eliminate surprises
Achieve deep insights into your recruitment processes, programs, and results – from questions about your applicant pipeline
Talent Acquisition and sourcing, to quality of hire and candidate diversity, to hiring process and recruiter capacity
Answers all important talent questions, from those about employee retention and movement to performance and engagement to
Talent leave management, compensation, leadership succession, risk management, and how talent decisions impact business results
Gain new understanding of the effectiveness of learning programs, activities, and content – from questions about learning
Learning impact, to learning engagement and operations, to compliance learning, new hire programs, and leadership development
Source: Visier
22Supply Chain Analytics
Supply Chain Analytics maintains huge potential in the coming
years
                    Supply Chain Analytics outlook                                                     Supply chain Analytics Market (in $b)

▪   Expected to reach ~ $10B by 2025 while growing at a 16.2% CAGR
    over the next 7 years
                                                                                                                                                 $10.0
▪   A big factor in this growth is the recognition by industry leaders of
    analytics revolutionary potential across the supply chain:
    – 66% of supply chain leaders say advanced supply chain analytics
                                                                                                           $3.10
      are critically important to their supply chain operations in the next
      2 to 3 years                                                                                          2017                                 2025E
▪   Despite this, companies have been slow to act:
    – Nearly two-thirds (63%) of companies do not use any technology                                     Use of supply chain capabilities
      to monitor their supply chain performance                                                                     Optimization Tools       56%         39%     94%
    – While 94% of supply chain leaders say that digital transformation                                          Demand Forecasting         53%          43%     96%
      will fundamentally change supply chains, only 44% have a                                           Integrated Business Planning       48%         45%     94%
      strategy in place                                                                       Supplier Collaboration and risk analytics     46%         47%      92%
    – The current average supply chain has a digitization of only                                               In-memory computing        37%      52%         89%
      around 43%                                                                                                    GPS and/or RFID*       37%      49%         86%
▪   However, companies that aggressively digitize their supply chains                                   Real time Shipment tracking *      37%      50%         86%
    can expect to boost annual growth of earnings by 3.2% and annual                          Control tower analytics and visualization 27%        53%         79%
    revenue by 2.3%                                                                             Advanced robotics in manufacturing** 26%           51%        77%

▪   Furthermore, businesses with optimal supply chains have 15% lower                                                     3D Printing** 24% 48%            72%

    supply chain costs, less than 50% in inventory holdings, and cash                                          Wearable technology** 23%          50%      73%

    conversion cycles at least three times faster than companies not                                               Artificial Intelligence 17%    56%     73%
    focused on supply chain optimization                                                                  Advanced delivery systems* 12% 47%             59%

             Source: Accenture, McKinsey, Forbes, Grandview Research, Logistics Bureau
             * Manufacturing and retail respondents only. ** Manufacturing respondents only                                                                            24
Key Supply Chain Analytics players
Global leader in supply Global provider of Offers advanced Provides quantitative Offers flexible supply
chain analytics with end- supply chain planning analytics to business supply chain chain solutions for
to-end offerings and demand analytics leaders to support real- optimization software, growing middle market
Core solution designed to transform software featuring world supply chain with a focus on enabling companies increasing
supply chains at every probability forecasting decisions in order to business to optimize forecast accuracy,
planning horizon and and machine learning achieve profitability and their purchasing and enhancing collaboration,
across multiple domains based decision-making growth goals replenishment decisions and optimizing inventory
HQ Atlanta, GA Boston, MA Ann Arbor, MI Paris, France Chicago, IL
Founded 2001 1993 2003 2008 1996
Key Clients &
Partners
Source: Crunchbase, LinkedIn, Company Websites, Press Releases
25ToolsGroup overview
Proctor & Gamble Case Study
Arc Distribution Iberica (ADI), a subsidiary of Arc International, was
looking for solutions to optimize the balance of stock to service by
Challenges
reducing inventories, improving service levels, ensuring future network
capacity from an optimal base, and optimizing fulfilment processes
SO99+ restructured the physical facilities and IT systems ADI had been
using as a part of their supply chain by centralizing its inventories and
Results optimized the fulfilment process through the elimination of redundant
structures, lowering logistics costs, and ensured service quality
Overall, ADI maintained service levels as inventory was reduced by 38%
Product Overview
Allocation & Automatically calculates optimal inventory levels for both existing and new items to create a phased, time-series plan that
Replenishment achieves target service levels even in the face of demand variability and distribution complexity
Demand Planning & Automates the creation of demand plans using machine learning and by incorporating detailed short-term demand signals and
Sensing demand collaboration, reducing forecast errors and optimally deploying inventory
Provides business-focused technology enabled resources to help customer quickly achieve value from Service Optimizer 99+
Planning as a Service
implementation and accelerates time-to-value over a traditional implementation and lean approach
Provides unparalleled visibility, insight, and control of the entire production lifecycle to improve efficiency and quality control,
Production Planning
and service demand
Factors in multiple planning variables and probabilities to generate an optimal, multi-echelon inventory plan for every item in a
Inventory Optimization
portfolio to achieve target service levels
Source: ToolsGroup
26Landmark M&A Transactions
Select M&A across Retail Analytics technology in 2019
($USD millions)

                                                                                                      Transaction   Enterprise     Implied        LTM     EV / LTM   EV / LTM
 Closed Date                       Target                                                  Acquirer      Size         Value      Equity Value   Revenue   Revenue    EBITDA
9/4/19            Certain Assets of Arcadia Data Inc.   Cloudera, Inc.                                    NA           NA            NA           NA        NA         NA
8/6/19            Celect, Inc.                          NIKE, Inc.                                        NA           NA            NA           NA        NA         NA
7/17/19           Lymbyc Solutions Private Limited      Larsen & Toubro Infotech Limited                  $6           $5            NA           $1        5.4x       NA
7/11/19           Mnubo Inc.                            Aspen Technology, Inc.                           $78           $78           $71          NA        NA         NA
6/13/19           Lattice Engines, Inc.                 The Dun & Bradstreet Corporation                  NA           NA            NA           NA        NA         NA
6/10/19           Tableau Software, Inc.                salesforce.com, inc.                            $17,378      $16,337       $16,933      $1,192     13.3x       NM
6/6/19            Looker Data Sciences, Inc.            Google LLC                                      $2,600       $2,600        $2,600         NA        NA         NA
5/29/19           Geografia Aplicada Sociedad Limitada CARTO                                              NA           NA            NA           NA        NA         NA
5/20/19           Profitect Inc.                        Zebra Technologies Corporation                   $86           NA            NA           NA        NA         NA
4/17/19           MapAnything, Inc.                     salesforce.com, inc.                             $225         $262          $262          NA        NA         NA
4/4/19            ClearStory Data Inc.                  Alteryx, Inc.                                    $20           $20           $17          NA        NA         NA
3/25/19           Dynamic Yield Ltd.                    McDonald's Corporation                           $300         $300          $300          NA        NA         NA
3/7/19            SnappyData, Inc.                      TIBCO Software Inc.                               NA           NA            NA           NA        NA         NA
2/15/19           Operatedata Ltd.                      Apple Inc.                                        NA           NA            NA           NA        NA         NA
Min                                                                                                                                                         5.4x       N/A
Mean                                                                                                                                                        9.3x       N/A
Median                                                                                                                                                      9.3x       N/A
Max                                                                                                                                                        13.3x       N/A

                       Source: CapitalIQ
                                                                                                                                                                                28
McDonald’s transitions from mass marketing to mass personalization – The $300m
acquisition will help McDonald’s customize its menu displays based on differing variables
Acquisition Overview
“It’s probably less about the product and more about the data scientists
that come with it, the people that come with it, and their ability to move
Acquired quickly with us,”
- Daniel Henry, McDonald’s Global Chief Information Officer and EVP
The acquisition will assist McDonalds to increase personalization “The downside for McDonald’s here is capped – if this doesn’t work,
and improve customer experiences McDonald’s loses about $300 million – but the upside is uncapped
- Liad Agmon, Co-founder and CEO, Dynamic Yield
Announcement Date: Mar 25, 2019
Target Business Overview Deal Terms Strategic Rationale
▪ Develops decisioning engine that uses ▪ McDonald’s acquired Dynamic Yield for ▪ Benefits to McDonald:
machine learning and predictive algorithms $300m ✓ The insights will be deployed through
to build valuable customer segments in real ▪ Dynamic Yield will continue to operate and the restaurant's drive-thru menus and
time serve clients as a stand-alone business unit self-service kiosks with the goal of
▪ Its AI-powered capabilities can be used to of McDonald’s; however, this acquisition increasing flexibility with its menu
take instant action via personalization, does prevent Dynamic Yield from presentation…
recommendations, automatic optimization, supporting other quick-serve restaurants ✓ …and to expand predictive analytics to
and one-to-one messaging – The technology is expected to be in-store kiosks, supply chain, kitchen,
▪ The key capabilities include customer data brought to 1,000 McDonald's locations in for mobile order and pay.
management, personalisation and targeting, the next three months, and all 14,000 US ▪ The acquisition will allow McDonald’s to
recommendations, A/B testing & stores as well as its international vary its electronic display of items and
personalization, behavioural messaging, restaurants over time DOOH network for walk-up or drive-thru
triggering engine & personalization APIs ▪ Based on Zacks Equity Research, this customers based on the weather, time of
▪ Founded in 2011, it is headquartered in move will allow McDonald's to maintain a day, restaurant traffic consumer
New York, NY and has over 250 employees significant competitive advantage over its demand and a whole host of other factors
▪ Serves more than 300 brands, and its tech peers that have not adopted similar that will power Dynamic Yield’s integrated
reaches 600m unique users each month, technology such as Domino’s, Chipotle and AI capabilities
across 10b page views and 600b “events” Yum! Brands
on those pages
▪ Customers include Rakuten, Ikea, Sephora,
Decathlon and Urban Outfitters
In some cases the value add from analytics is enough to warrant an outright acquisition
Source: Company website, Dynamic Yield Website, CapitalIQ, Press Release
29Zebra Technologies to acquire Retail Analytics technology, Profitect
The acquisition expands Zebra’s relevance deeper and wider within global retail operations while advancing their software capabilities
Zebra Technologies entered into an agreement to acquire Profitect for an undisclosed sum
Acquisition Overview “We are excited to join Zebra and bring our award-winning prescriptive
analytics solution to every worker at the edge... Together we will ensure the
workforce of the future is more connected and optimally utilized. We value
Zebra’s support and expertise over the past five years as a key venture
capitalist. I’m proud of the contribution that Profitect’s solution will bring
to Zebra and look forward to working closely to deliver prescriptive
analytics as part of its innovative and broad solution portfolio”
- Guy Yehiav, CEO and Chairman of the Board of Profitect, PR dated May
20, 2019
Announcement Date : May 20, 2019
Target Business Overview Deal Terms Strategic Rationale
▪ Develops cloud-based prescriptive analytics ▪ Zebra expects to fund the acquisition of ▪ With the acquisition, Zebra adds a capable
solutions for the retail and CPG industries Profitect with a combination of cash on hand retailer data gathering and interface system to
▪ Core platform analyses data from across the along with fully committed financing available its Enterprise Asset Intelligence solution
value chain to help brands improve inventory under its credit facility – Assist retailers to increase sales and reduce
and pricing accuracy, out of stocks, supply ▪ Guy Yehiav, CEO and Chairman of the Board inventory mismatch via its mobile-connected
chain efficiency, unsellable merchandise, and of Profitect, will be a key leader in the business monitoring and resolution module suite
assortment discrepancies integration – To expand the range of its service offerings
▪ Raised $14.5m from Benhamou Global ▪ The transaction is subject to customary closing beyond just automatic data capture
Ventures, Motorola Solutions Venture Capital, conditions and is expected to close in the – Will work with its’ partners to empower front-
Genesis Partners and Cedar Fund second quarter of 2019 line workers – across all verticals - with the
▪ Founded in 2007, the company is ▪ The transaction is expected to be immaterial to insights that require to make better, faster,
headquartered in Burlington, MA sales and profitability in the near term smarter decisions
– Leverage the investment to accelerate the
development of its Savanna data platform
▪ The retail analytics market size is expected to exceed $13 billion by 2024, according to market research report by Global Market Insights in
2019
▪ Key drivers: Need for omnichannel insights, retailers seeking to attract both new customers while retaining existing customers, and an
increased demand for customized software solutions
Source: Press Releases
30Salesforce is buying data visualization company Tableau for
$17.4bn in an all-stock deal
Acquisition Overview
“As part of the world's #1 CRM company, Tableau's intuitive and powerful
analytics will enable millions more people to discover actionable insights
Acquired across their entire organizations.”
Adam Selipsky, President and CEO of Tableau
The acquisition will merge the top CRM platform with “It's truly the best of both worlds for our customers—bringing together two
the leading analytics platform critical platforms that every customer needs to understand their world.”
Marc Benioff, Chairman and co-CEO of Salesforce
Announcement Date : June 10, 2019
Target Business Overview Deal Terms Strategic rationale
▪ Provides business analytics software products ▪ Salesforce to acquire Tableau from Christian ▪ With Tableau, Salesforce aims to:
that helps users visualize and understand data Chabot, Patrick Hanrahan, Christopher Stolte ❑ accelerate digital transformation efforts
– Products include: Tableau Desktop, and other shareholders for $17.4bn(1) enabling the companies to streamline and
Tableau Server, Tableau Online, Tableau ▪ Each common stock of Tableau will be access the data across their entire
Prep and Tableau Public exchanged for 1.103 shares of Salesforce business
▪ A pioneer of self-service analytics that is common stock. ❑ surface deeper insights to make smarter
considered as the #1 analytics platform ▪ Key transaction multiples & Implied EV: decisions, drive intelligent customer
▪ Has ~86K business customers, including $16.3b experiences, and accelerate innovation
Charles Schwab, Verizon, Schneider Electric, – Implied EV / LTM Revenue: 13.7x ▪ It will also make Salesforce's Customer 360
Southwest, and Netflix – Implied EV / NTM Revenue: 11.4x and analytics capabilities stronger than before
▪ Listed on NYSE on May 16, 2013 – Implied EV / NTM EBITDA: 67.7x ▪ Tableau to integrate with Salesforce Einstein
▪ Founded in 2003 and is headquartered in ▪ Tableau will operate independently under the to deliver an intelligent, intuitive analytics and
Seattle, WA Tableau brand as a business unit of data visualization platform for every
▪ Employs over 4,200 individuals salesforce.com and will remain headquartered department at a company to reach more
in Seattle, WA customers
(In $m) ▪ It will continue to be led by CEO Adam ▪ The purchase will merge Salesforce's
$1,155.4
$826.9 $877.1 Selipsky along with the current leadership community of 1.4 million users and Tableau’s
$653.6
team consumer base of 1 million individuals
-$96.6 -$146.2 -$54.0
-$28.4
▪ Expected closing date: Salesforce Q3 ending
FY15 FY16 FY17 FY18 October 31, 2019
Revenue EBITDA
Note: (1) Transaction Size based on CapitalIQ (2) Implied EV based on CapitalIQ
Source: Salesforce website, Tableau Website, CapitalIQ, Press Release
31Nike acquires Celect to optimize inventory, analyze consumer
behavior, and tackle $2bn in inventory write-offs
Nike’s August 2019 acquisition of inventory
analytics company Celect demonstrates the
expected impact that transformative technology
can have on a retailer’s operations and
profitability.
Based on ComCap’s analysis, Celect’s technology could be worth $100’s of
Celect’s ML and AI-based consumer data millions over the next several years if it can even marginally reduce Nike’s nearly
science & demand forecasting technology $2bn FY2019 inventory write-offs.
allows retailers to understand customer shopping
patterns in-store and online, helping retailers to ComCap sees two primary drivers of value:
estimate future demand and optimize inventory
portfolios in stores and across the supply chain. ▪ A 2% reduction in inventory write-offs could generate $130m in additional Net Income
▪ A 2% increase in sell-through rate could generate $114m in additional Net Income
The acquisition is aligned with Nike’s strategy of
trying to sell more directly to consumers and Over the next 5 years, these initiatives could combine to create a
shift business away from its traditionally dominant present value of $244m in additional Net Income
wholesale channel.
In 2019, Nike recorded nearly $2bn in inventory Nike P&L ($millions) FY2019A FY2024E
write-offs. By helping Nike reduce out-of-stocks, Revenue $39,117 $56,459
excess inventory, and connect more directly with Net Income $4,029 $7,451
consumers, ultimately increasing revenue and Inventory write-offs $1,820 $2,450
reducing write-offs, Celect’s technology is % Net Income 45% 33%
expected to make a direct impact to Nike’s bottom
Present value of Celect impairment reduction $130
line.
Present value of Celect additional sales $114
Total present value of Celect technology $244
This case highlights the continued trend that ComCap has both predicted and tracked - major retailers are increasingly becoming
technology companies in order to better adjust to a world driven by disruptors including Amazon and Google
Notes: Forecast period through 2024; Write-offs held constant as a % of COGS through forecast period; After tax benefit from impairment reductions and additional
sales grows from $33-$42m, and $27-$39 through the forecast period, respectively. Additional sales impact assumes recaptured sales Gross Margin flows directly to
EBIT. See ComCapllc.com/research for expanded case study and calculation details
Source: Inventory Write-offs via Nike 10k; Revenue, Gross Margin, Net Income, Effective Tax rate via CIQ
32Celect is expected to provide value to Nike by optimizing
inventory sales and reducing excess inventory write-offs
Estimated impacts to Nike’s Net Income justify a $100m+ present valuation
Assumptions
Discount rate (Nike WACC + 5%) 12.5%
Inventory write-off reduction due to Celect technology 2.0%
Additional inventory sell through due to Celect technology 2.0%
Nike P&L ($millions) FY2019A FY2020E FY2021E FY2022E FY2023E FY2024E
Revenue $39,117 $42,131 $45,534 $49,044 $52,622 $56,459
Revenue growth 7.7% 8.1% 7.7% 7.3% 7.3%
COGS $21,643 $23,109 $24,707 $26,244 $27,574 $29,133
% of revenue 55.3% 54.9% 54.3% 53.5% 52.4% 51.6%
Gross Profit $17,474 $19,022 $20,827 $22,801 $25,048 $27,326
Gross Margin 44.7% 45.2% 45.7% 46.5% 47.6% 48.4%
SG&A $13,445 $14,432 $15,560 $16,742 $18,317 $19,875
Net Income $4,029 $4,590 $5,267 $6,059 $6,731 $7,451
Inventory write-offs $1,820 $1,943 $2,078 $2,207 $2,319 $2,450
% Net Income 45% 33%
% of COGS (held constant) 8.4% 8.4% 8.4% 8.4% 8.4% 8.4%
Nike effective tax rate 16.1% 15.9% 15.8% 15.5% 15.0%
Impairment add-backs
2% of inventory write-offs impairment back into EBIT $39 $42 $44 $46 $49
After-tax Impact $33 $35 $37 $39 $42
Additional inventory sell through
2% of write-offs back into inventory for sale $39 $42 $44 $46 $49
COGS % revenue 54.9% 54.3% 53.5% 52.4% 51.6%
Additional revenue from inventory sale $71 $77 $82 $89 $95
Gross Margin 45.2% 45.7% 46.5% 47.6% 48.4%
Additional Gross Margin from sale $32 $35 $38 $42 $46
After-tax Impact* $27 $29 $32 $36 $39
Present value of Celect impairment reduction $130
Present value of Celect additional sales $114
Total present value of Celect technology $244
*Assumes Gross Profit flows through directly to EBIT
Source: Company data, Press Releases
33Select technology acquisitions by retailers
Date Target Acquirer
8/13/19 Sidestep Technologies Inc. Custom Ink
8/6/19 Celect, Inc. NIKE, Inc.
5/20/19 Boomerang Commerce Lowe's Companies, Inc.
4/11/19 Polymorph Labs, Inc Walmart Inc.
3/25/19 Dynamic Yield McDonald's
2/26/19 Aspectiva Ltd. Walmart Inc.
2/15/19 Operatedata Ltd. Apple Inc.
1/11/19 ZiipRoom, Inc. Bose Corporation
1/11/19 Askuity Inc. The Home Depot, Inc.
1/3/19 Wiggly-Amps Limited Walgreens Boots
12/13/18 Int Data Labs, Inc. Walmart Inc.
11/12/18 Unlockd Media Wesfarmers Limited
11/8/18 GlamST LLC Ulta Beauty, Inc.
11/8/18 Qm Scientific Ulta Beauty, Inc.
10/17/18 daco SAS Vente-privee.com
9/25/18 Upstream Commerce Ltd. Flipkart
9/13/18 Delivery Technologies Walmart Inc.
9/3/18 Dhurya Technologies Private Limited Walmart Inc.
8/21/18 Liv.ai Pvt. Ltd. Flipkart
8/1/18 Pretr Online Services Private Limited Flipkart
7/20/18 CuriosityChina Farfetch UK Limited
Source: CIQ
34Select technology acquisitions by retailers
Date Target Acquirer
7/16/18
Date Solvy
TargetTech Solutions Pvt. Ltd. Flipkart
Acquirer
6/12/18
7/16/18 b8ta,
Solvy Inc.
Tech Solutions Pvt. Ltd. Macy's,
Flipkart Inc.
5/2/18
6/12/18 STORY
b8ta, Inc. Macy's, Inc.
4/20/18
5/2/18 Detour.Com,
STORY Inc. Bose Corporation
Macy's, Inc.
4/9/18
4/20/18 Invertex Ltd Inc.
Detour.Com, NIKE, Inc.
Bose Corporation
3/22/18
4/9/18 Zodiac
InvertexInc.
Ltd NIKE, Inc.
3/16/18
3/22/18 Modiface Inc.
Zodiac Inc. L'Oréal S.A.
NIKE, Inc.
3/8/18
3/16/18 BevyUp
Modiface Inc. Nordstrom,
L'Oréal S.A.Inc.
3/8/18 MessageYes
BevyUp Nordstrom, Inc.
2/5/18
3/8/18 Spatialand
MessageYes Inc. Walmart Inc.Inc.
Nordstrom,
12/13/17
2/5/18 Shipt, LLC Inc.
Spatialand Target
WalmartCorporation
Inc.
11/16/17
12/13/17 Outward Inc.
Shipt, LLC Williams-Sonoma,
Target Corporation Inc.
10/3/17
11/16/17 Parcel
OutwardInc.
Inc. Walmart Inc.
Williams-Sonoma, Inc.
9/29/17
10/3/17 Regaind, SAS
Parcel Inc. Apple Inc.Inc.
Walmart
9/28/17
9/29/17 TaskRabbit,
Regaind, SASInc. IKEA
Apple Inc.
8/14/17
9/28/17 Grand Junction,
TaskRabbit, Inc. Inc. Target
IKEA Corporation
4/19/17
8/14/17 Inlogg
Grand Internet
Junction,Pvt.
Inc.Ltd. Flipkart
Target Corporation
4/5/17
4/19/17 Decorist, Inc. Pvt. Ltd.
Inlogg Internet Bed Bath & Beyond Inc.
Flipkart
4/3/17
4/5/17 Integra Commerce
Decorist, Inc. Magazine Luiza
Bed Bath & S.A.Inc.
Beyond
11/28/16
4/3/17 GameChanger Media, Inc.
Integra Commerce DICK'S Sporting
Magazine Goods, Inc.
Luiza S.A.
11/28/16 GameChanger Media, Inc. DICK'S Sporting Goods, Inc.
Source: CIQ
35Leading Public Companies
Analytics leaders

($USD millions, except per share amounts)
                                                   Trading Performance          FD Capitalization                      Trading Multiples                      Operating Statistics
                                                   Stock                   Equity      Net                     EV /                EV /            Rev. Growth                             LTM
                                                   Price        %52W       Market     Cash Enterprise        Revenue            EBITDA           CY18 /   CY19 /     EBITDA Margin        Gross
Company (FYE)                                    12/4/2019   Low   High    Value     (Debt)     Value      CY18E    CY19E     CY18E      CY19E    CY17     CY18       CY18E      CY19E    Margin
Analytics Leaders
Verisk Analytics, Inc. (US)                         $145.41   142%   88%    $23,828   ($2,630)   $26,458    11.0x     10.2x     23.4x    21.8x      11.6%     8.5%      47.2%    46.6%      63.0%
Splunk Inc. (US)                                    $146.62   163%   96%    $22,629    ($119)    $22,748    12.6x      9.7x      NM      58.3x      37.7%    30.4%      15.6%    16.6%      81.9%
Datadog, Inc. (US)                                   $36.92   134%   84%    $10,922     $699     $10,223      NA      29.1x      NM        NM         NM        NA        NA     (1.9%)     74.6%
Alteryx, Inc. (US)                                  $110.93   229%   75%     $7,219     $148      $7,071    34.6x     18.0x      NM        NM       55.2%    91.8%     (0.2%)    14.4%      90.4%
New Relic, Inc. (US)                                 $68.13   136%   63%     $4,005     $283      $3,722     8.4x      6.6x     49.3x    38.9x      35.0%    27.5%      16.9%    16.8%      83.3%
Teradata Corporation (US)                            $25.85   109%   52%     $2,908    ($147)     $3,055     1.4x      1.6x      9.0x     9.5x       0.4%   (13.1%)     15.7%    17.1%      50.3%

MicroStrategy Incorporated (US)                     $151.60   131%   95%     $1,556     $464      $1,093     2.2x      2.3x     49.0x    23.7x     (1.2%)    (2.8%)     4.5%      9.5%      79.1%

Min                                                                          $1,556   ($2,630)    $1,093     1.4x      1.6x      9.0x     9.5x     (1.2%)   (13.1%)    (0.2%)    (1.9%)     50.3%
Mean                                                                        $10,438    ($186)    $10,624    11.7x     11.1x     32.7x    30.5x      23.1%    23.7%     16.6%     17.0%      74.7%
Median                                                                       $7,219     $148      $7,071     9.7x      9.7x     36.2x    23.7x      23.3%    18.0%     15.6%     16.6%      79.1%
Max                                                                         $23,828     $699     $26,458    34.6x     29.1x     49.3x    58.3x      55.2%    91.8%     47.2%     46.6%      90.4%

                              Source: CapIQ as 12/4/2019
                                                                                                                                                                                                    37
Select Key Disruptors
Select AI company profiles
Company               Headquarters                  Employees   Amount Raised                      Description
                                                                                ▪ C3 delivers a comprehensive and proven set
                                                                                  of capabilities for developing, deploying, and
                                                                   $228.5m        operating large scale AI, predictive analytics,
                 Redwood City, California                ~350                     and IoT applications 10 to 100x faster than
                                                                                  alternative approaches.

                                                                                ▪ DataRobot offers a machine learning platform
                                                                                  for data scientists of all skill levels to build and
                                                                   $430.6m        deploy accurate predictive models in a fraction
                 Boston, Massachusetts                   ~750                     of the time it used to take. The technology
                                                                                  addresses the critical shortage of data
                                                                                  scientists by changing the speed and
                                                                                  economics of predictive analytics.

                                                                                ▪ Element AI is an artificial intelligence company
                                                                                  that gives organizations unparalleled access to
                                                                                  cutting-edge technology.
                 Montreal, Quebec                        ~350      $257.5m
                                                                                ▪ They deliver AI software products that
                                                                                  augment decisions to make your business
                                                                                  stronger, safer, and more agile.

                                                                                ▪ Symphony RetailAI is the leading global
                                                                                  provider of role-specific, AI-enabled revenue
                                                                                  growth management solutions and customer-
                 Addison, Texas                          ~700        NA           centric insights for retailers and CPG
                                                                                  manufacturers across the entire value chain.

          Source: Company Website, Capital IQ and Crunchbase                                                                             39
Select Retail Analytics company profiles
Company Profile Capabilities
Ace Turtle Business Highlights:
A technology driven platform company that provides ▪ Integrates online and offline retail channels automating and optimizing Omni-Channel
direct to consumer web commerce solutions for fulfilment
leading retail brands ▪ The platform provides brands with a single view of inventory
Founded: 2013 ▪ Has raised funds from Vertex Ventures, InnoVen Capital and C31 Venture
HQ: Karnataka, India ▪ Solutions are currently used by brands such as Ray-Ban, Puma, Max, Arrow, Flying
Total Funding: $8.9m Machine, Ed Hardy, US Polo, and Fossil
▪ Has offices in India and Singapore
Amplience Business Highlights:
Simplifies how clients plan, create, manage, and ▪ Provides products such as content, media, and content hub to help the creativity and
deliver content productivity of content and technology teams
Founded: 2008 ▪ Key partners include SAP, Salesforce, IBM, Oracle, Magento, and Akamai
HQ: London, UK ▪ It serves more than 200 businesses including Crate and Barrel, Heritage Parts,
Total Funding: $104.8m Boohoo, Mulberry, BMC, TUM and others
▪ On June 2019, Amplience partnered with Mobify to deliver modern headless front-
end experience for commerce
Capillary Technologies Pvt Ltd Business Highlights:
Develops customized and cloud-based customer ▪ Offers an integrated platform of AI and machine learning to make it easy for brands
analytics marketing platforms for retailers to get deep understanding, engage consumers, provide easy and connected cross-
Founded: 2008 channel commerce experiences and retain the best consumers
HQ: Singapore ▪ It serves around 400 brands across 30 countries, key clients include Pizza Hut,
Total Funding: $113.1m Walmart, PetroMin, ToysRus, Charriol and others
▪ It has a global presence in 30 countries with 14 offices, and powers 35k stores
CB4 Business Highlights:
Provides a patented AI tool that helps retailers ▪ Offers a patented software solution for brick and mortar retail companies which
uncover and fix the costliest execution problems in uncovers hidden purchasing patterns that detect unfulfilled consumer demand at the
stores SKU and store level
Founded: 2012 ▪ Key customers include Barnes & Noble, Urban Outfitters, Ace Hardware
HQ: New York, NY ▪ With headquarters in New York, CB4 has additional offices in London and Herzliya
Total Funding: $22.0m ▪ In Mar 2019, CB4 raised funds of $16m from Octopus Ventures and three others
Celect Business Highlights:
A cloud-based, predictive analytics SaaS platform for ▪ The company’s cloud-based analytics platform provides proprietary insights that allow
retailers retailers to optimize inventory across an omnichannel environment through hyper-
Founded: 2013 local demand predictions
HQ: Boston, MA ▪ On August 6, 2019, Nike acquired Celect to fuel its Consumer Direct Offense
Total Funding: $41.4m strategy, serving consumers personally at a global scale
Source: Company Website, Capital IQ and Crunchbase
40Select Retail Analytics company profiles
Company Profile Capabilities
Clarabridge, Inc. Business Highlights:
Offers SaaS products for sentiment analysis and text ▪ Offers advanced text analytics which transforms survey, social, voice and all other
analytics to automatically collect, categorize and forms of customer feedback into intelligence tools used to empower confident,
report on structured data and unstructured data decisive action across the business
Founded: 2006 ▪ Key partners include ORI, Smooch, Customerville, and Accenture Digital
HQ: Reston, VA ▪ Key customer include Adobe, United, Aramax, Electrolux, Autodesk and others
Total Funding: $124.9m ▪ It has offices in London, UK and San Francisco, CA
Clicktale Business Highlights:
A Content square company, that creates solutions to ▪ Offers enterprise-class platform and customer experience experts which transform
help clients understand their digital audience to millisecond-level behaviors and gestures into meaningful insights
connect with them better ▪ Key partners include Adobe, Google, Oracle, Salesforce, and Gaprise
Founded: 2006 ▪ It serves a wide range of industries including retail, telecommunication, media,
HQ: Tel Aviv, Israel finance, tech and travel;
Total Funding: $60.0m ▪ Key customers include Avis, Dell, Mobile, USAA, Metlife, and Ring Central
Cloud4Wi Business Highlights:
An AI- driven application suite for location services ▪ Offerings include Volare Splash, Volare Compass, Volare Spaces and an ROI
Founded: 2014 Calculator
HQ: San Francisco, CA ▪ Key industries include retail chains, restaurant chains, shopping centers, and
Total Funding: $23.5m transportation
▪ Key customers include Adecco, Bank of America, Burger King, Olive Garden,
Salvatore Ferragamo, and The Cordish Companies
▪ It connects more than 130 million mobile users across 45,000 locations in more than
120 countries, while collecting more than 10 billion points of location data per month
Dynamic Action Business Highlights:
An advanced retail analytics solution specifically built ▪ Delivers new metrics, automated diagnostics and both out-of-the-box and ad hoc
to enable eCommerce, store and omnichannel teams analytics and visualizations
Founded: 2007 ▪ It has three distinct partner categories including technology, solutions and service
HQ: Redwood City, CA ▪ Key customer include Cole Haan, Eddie Bauer, DXL Men’s Apparel, Farfetch, Heine,
Total Funding: $19.0m SportSchek, and MyOptique Group among others
Emarsys Business Highlights:
An independent marketing platform which enables ▪ Provides software products which enable companies to scale marketing decisions
truly personalized, one-to-one interactions between and actions beyond human capabilities
marketers and customers across all channels ▪ Key partners include CSO, eco, Return Path, sncd and others
Founded: 2000 ▪ It serves more than 4.2 billion consumers across 150 countries; key customers
HQ: Wien, Austria include Ebay, Macy’s, Best buy, Canon, ghd, Lesara, Superdrug and others
Total Funding: $55.3m ▪ Globally, the company operates 15 additional offices
Source: Company Website, Capital IQ and Crunchbase
41Select Retail Analytics company profiles
Company Profile Capabilities
Environics Business Highlights:
Offers the full range of analytical services—from data ▪ The company specializes in geodemographic-based segmentation, site evaluation
supplier to strategic consultancy modelling, and custom analytics
Founded: 2003 ▪ Additionally, the company offers marketing data related to demographics, financial,
HQ: Toronto, Canada media and behavior, business, geographic, and other consumer attributes
Total Funding: N/A ▪ Furthermore, it offers services in the areas of customer insights, geocoding,
multicultural marketing, target marketing, trade area and site modelling, and
customized solutions
Eversight Business Highlights:
AI-powered pricing and promotions service provider ▪ Offers solutions that help retailers and consumer goods manufacturers in improving
which helps brands in optimizing pricing and promotion effectiveness and making better use of trade spend dollars
maximizing ROI on promotional spend ▪ Serves various retail channels such as grocery stores, drug stores, mass
Founded: 2013 merchandise stores, online retailers, and pet speciality stores among others
HQ: Palo Alto, CA ▪ Key partners include Catalina, Vestcom, Altierre, Rite Aid, Google and others
Total Funding: $24.2m ▪ It has offices in New York, NY and Chicago, IL
EVRYTHNG Business Highlights:
An IoT SaaS platform for consumer products that ▪ Provides a suite of solutions to drive new digital applications, better control the
manage a wide range of unique digital identities in supply chain, and engage directly with customers
the cloud ▪ It offers its solutions to the appliances and electronics, apparel and accessories,
Founded: 2011 consumer packaged goods, food and beverages, health and insurance, insurance,
HQ: London, UK lighting, telecommunication, and toys & entertainment industries
Total Funding: $41.3m ▪ Key customers include Puma, Diageo, Coca-Cola, Almond, Carrefour, Avery
Dennison, WestRock, and Almond
First Insight Business Highlights:
A SaaS-based predictive analytics platform enabling ▪ Offers SaaS-based predictive analytics platform that provides insight about expected
data-driven product decisions for the next generation product performance, optimal entry price points for new items, planning and target
of retail marketing
Founded: 2007 ▪ It serves 100+ customers including Rue21, Camuto group, Randa Accessories,
HQ: Warrendale, PA Caleres, Crocs, and Vince Camuto
Total Funding: $23.4m ▪ First Insight partners with HSN to identify top-performing products
Fractal Analytics Business Highlights:
A technology company which helps brands to listen ▪ Offers products which power every human decision by bringing analytics & AI to the
to their customers and make informed decisions decision-making process
Founded: 2000 ▪ It serves wide range of industries such as consumer goods, insurance, financial
HQ: New York, NY services, retail, technology, healthcare & life sciences, media, and telecom
Total Funding: $325m ▪ It has presence across 15 global locations including the United States, UK, Ukra,
China, Singapore, Germany, Canada, Australia, Malaysia, Sweden, Netherlands,
Switzerland, and India
Source: Company Website, Capital IQ and Crunchbase
42You can also read