Optimizing UV Index determination from broadband irradiances - GMD
←
→
Page content transcription
If your browser does not render page correctly, please read the page content below
Geosci. Model Dev., 11, 1093–1113, 2018
https://doi.org/10.5194/gmd-11-1093-2018
© Author(s) 2018. This work is distributed under
the Creative Commons Attribution 4.0 License.
Optimizing UV Index determination from broadband irradiances
Keith A. Tereszchuk1 , Yves J. Rochon1 , Chris A. McLinden1 , and Paul A. Vaillancourt2
1 Air Quality Research Division, Environment and Climate Change Canada, Toronto, Ontario, Canada
2 Meteorological Research Division, Environment and Climate Change Canada, Dorval, Quebec, Canada
Correspondence: Keith A. Tereszchuk (keith.tereszchuk@canada.ca) and Yves J. Rochon (yves.rochon@canada.ca)
Received: 2 November 2017 – Discussion started: 5 December 2017
Revised: 27 February 2018 – Accepted: 20 March 2018 – Published: 27 March 2018
Abstract. A study was undertaken to improve upon the prog- from the high-spectral-resolution irradiances and the resul-
nosticative capability of Environment and Climate Change tant GEM broadband irradiances are typically within 0.2–
Canada’s (ECCC) UV Index forecast model. An aspect of 0.3 with a root-mean-square relative error in the scatter of
that work, and the topic of this communication, was to in- ∼ 6.6 % for clear-sky conditions. Similar results are repro-
vestigate the use of the four UV broadband surface irradi- duced under cloudy conditions with light to moderate clouds,
ance fields generated by ECCC’s Global Environmental Mul- with a relative error comparable to the clear-sky counterpart;
tiscale (GEM) numerical prediction model to determine the under strong attenuation due to clouds, a substantial increase
UV Index. in the root-mean-square relative error of up to 35 % is ob-
The basis of the investigation involves the creation of a served due to differing cloud radiative transfer models.
suite of routines which employ high-spectral-resolution ra-
diative transfer code developed to calculate UV Index fields
from GEM forecasts. These routines employ a modified ver-
sion of the Cloud-J v7.4 radiative transfer model, which inte- Copyright statement. The works published in this journal are
grates GEM output to produce high-spectral-resolution sur- distributed under the Creative Commons Attribution 4.0 License.
This license does not affect the Crown copyright work, which
face irradiance fields. The output generated using the high-
is re-usable under the Open Government Licence (OGL). The
resolution radiative transfer code served to verify and cal- Creative Commons Attribution 4.0 License and the OGL are
ibrate GEM broadband surface irradiances under clear-sky interoperable and do not conflict with, reduce or limit each other.
conditions and their use in providing the UV Index. A subse-
quent comparison of irradiances and UV Index under cloudy © Crown copyright 2018
conditions was also performed.
Linear correlation agreement of surface irradiances from
the two models for each of the two higher UV bands cover- 1 Introduction
ing 310.70–330.0 and 330.03–400.00 nm is typically greater
than 95 % for clear-sky conditions with associated root- Throughout the late 1980s and early 1990s, extensive atmo-
mean-square relative errors of 6.4 and 4.0 %. However, un- spheric studies in the polar regions of the planet revealed that
derestimations of clear-sky GEM irradiances were found on stratospheric ozone (O3 ) concentrations were being depleted
the order of ∼ 30–50 % for the 294.12–310.70 nm band and due to a variety of O3 -destroying catalytic cycles driven by
by a factor of ∼ 30 for the 280.11–294.12 nm band. This un- photochemical reactions liberating chlorine (Cl) and bromine
derestimation can be significant for UV Index determination (Br) atoms from chlorofluorocarbon (CFC) and hydrofluo-
but would not impact weather forecasting. Corresponding rocarbon (HCFC) molecules emitted into the atmosphere as
empirical adjustments were applied to the broadband irra- airborne anthropogenic pollutants (Rowland, 1996).
diances now giving a correlation coefficient of unity. From Ozone is an important atmospheric absorber of energetic
these, a least-squares fitting was derived for the calculation short-wavelength radiation emitted by the Sun. Most criti-
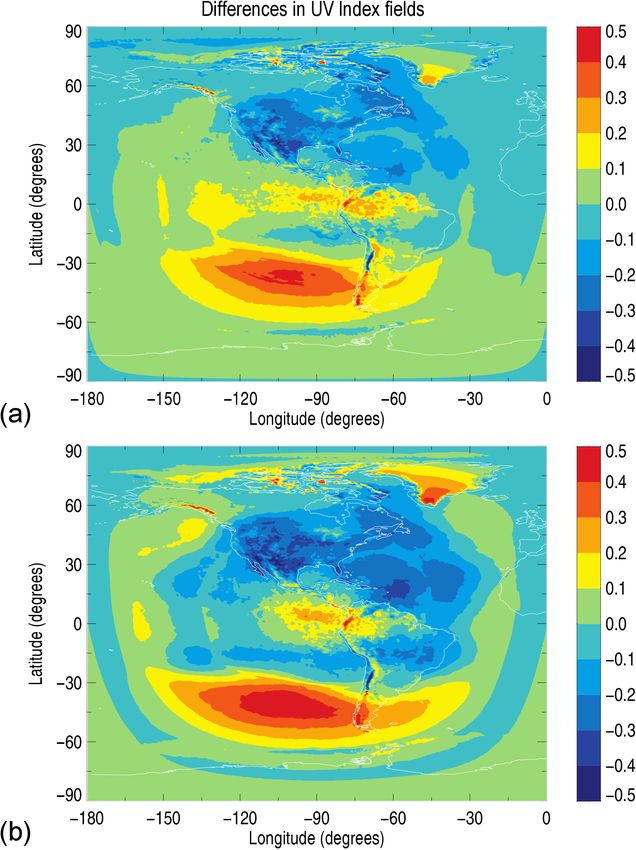
of the UV Index. The resultant differences in UV indices cally, O3 is the primary absorber of ultraviolet (UV) radia-
tion, which has wide-ranging implications for the health of
Published by Copernicus Publications on behalf of the European Geosciences Union.
1094 K. A. Tereszchuk et al.: Optimizing UV Index determination from broadband irradiances
done to human skin by UV radiation. It had been well known
for quite some time that UV-A and UV-B radiation are harm-
ful to unicellular organisms, the surface cells of plants and
animals, and to the health of the more photosensitive pop-
ulation. Increased photosensitivity in people can be caused
by a number factors, the most common cause is due to hav-
ing minimal skin pigmentation (melanin), which provides a
natural barrier to the Sun’s UV rays. Certain immune sys-
tem ailments such as solar urticaria can cause hypersensi-
tive allergic reactions to minimal exposures of UV radiation
causing hives, rashes, and blistering. Photosensitivity is of-
ten associated with the use of certain medications, including
some non-steroidal anti-inflammatory drugs and painkillers,
tranquillizers, oral anti-diabetics, antibiotics, and antidepres-
sants (http://www.who.int/uv/faq/uvhealtfac/en/).
Colblentz and Stair (1934) sought to obtain measurements
Figure 1. Sample UV irradiance spectrum at the Earth’s surface on of the spectral erythemic reaction (reddening) of untanned
a clear summer day (averaged and sampled over 0.5 nm intervals). human skin exposed to UV light. In essence, this was one
Stratospheric (O3 ) is the primary species which serves to absorb of the first recordings of a UV erythemal action spectrum,
UV radiation in the atmosphere (blue curve). The Huggins–Hartley where an action spectrum for a particular biological effect ex-
band system of O3 attenuates the radiative flux (black curve) by
presses the effectiveness of radiation at each wavelength as a
several orders of magnitude in the UV-B region. The product of the
absorption cross section and the top-of-atmosphere flux gives the
fraction of the effectiveness at a certain standard wavelength
resultant incoming irradiance at the surface (red curve). The ery- – in this case, the tolerance of human skin to UV radiation.
themal action spectrum (green curve) demonstrates the increasing Today, research has revealed that humans are susceptible to
susceptibility of human skin to epidermal damage (erythema). much more than sunburns when exposed to UV rays. Pro-
longed exposure can lead to the premature aging of the skin,
suppression of the immune system, eye damage including
the biosphere: both on a molecular level with the potential of the development of corneal photokeratitis and cataracts, and
damaging the cellular DNA of individual organisms (Ravanat skin cancer (melanoma). The contemporary action spectrum
et al., 2001) and the destabilization of entire biogeochemical adopted by most international organizations is the CIE (Com-
cycles within a biome (Zepp et al., 1998). mission Internationale de l’Éclairage, International Commis-
UV radiation is categorized into three broadband regions sion on Illumination) action spectrum (CIE Technical Report,
which are defined as UV-A (315–400 nm), UV-B (280– 2014). The CIE standard spectrum, Eq. (1), is based on the
315 nm), and UV-C (100–280 nm). Molecular species in action spectrum originally developed by McKinlay and Dif-
the Earth’s atmosphere absorb very little of the longer- fey (1987), which was constructed by re-normalizing the data
wavelength UV-A radiation, as it reaches the surface with points and modifying the piecewise function to avoid having
a minor net difference (mainly due to scattering) in the ra- overlapping wavelength intervals (Webb et al., 2011).
diative flux from the top of the atmosphere. UV-B radia-
tion is partially transmitted through the atmosphere and is 1.0 250 ≤ λ ≤ 298
primarily absorbed by O3 (Huggins–Hartley band system). EAS(λ) = 100.094(298−λ) 298 < λ ≤ 328 [λ nm] (1)
0.015(140−λ)
The Huggins–Hartley system (∼ 200–360 nm) of O3 and the 10 328 < λ ≤ 400
Hopfield and Schumann–Runge systems (∼ 70–200 nm) of
molecular oxygen (O2 ) serve to absorb all UV-C radiation, The UV Index was developed as an erythemally weighted
which is impeded from reaching the top of the troposphere. representation of the total surface flux of UV radiation in the
This absorption occurs primarily in the ozone layer, a thin biologically active range of 280–400 nm (CIE Technical Re-
band of O3 contained within the stratosphere where the peak port, 2014; Fioletov et al., 1997; Allaart et al., 2004; Fiole-
molecular number density of O3 is located ∼ 20–30 km tov et al., 2010; Moshammer et al., 2016); the range below
above sea level. Figure 1 demonstrates how the absorption ∼ 280–290 nm can be excluded as its contribution is negli-
by ozone increases rapidly with decreasing wavelength in the gible. It was conceived to produce a simplified scale which
UV-B region, causing surface irradiances to fall off sharply reports the relative strength of the Sun’s UV radiation, and
with decreasing wavelength. to inform the public of the Sun protection actions that should
At progressively shorter wavelengths of UV light, increas- be taken as a precaution if they are to be exposed to the Sun’s
ingly energetic photons become subsequently more and more rays for extended periods of time.
damaging to biological species, including humans. Studies To determine the UV Index from high-spectral-resolution
were conducted as early as the 1930s to quantify the damage irradiances, an effective spectral curve is calculated from the
Geosci. Model Dev., 11, 1093–1113, 2018 www.geosci-model-dev.net/11/1093/2018/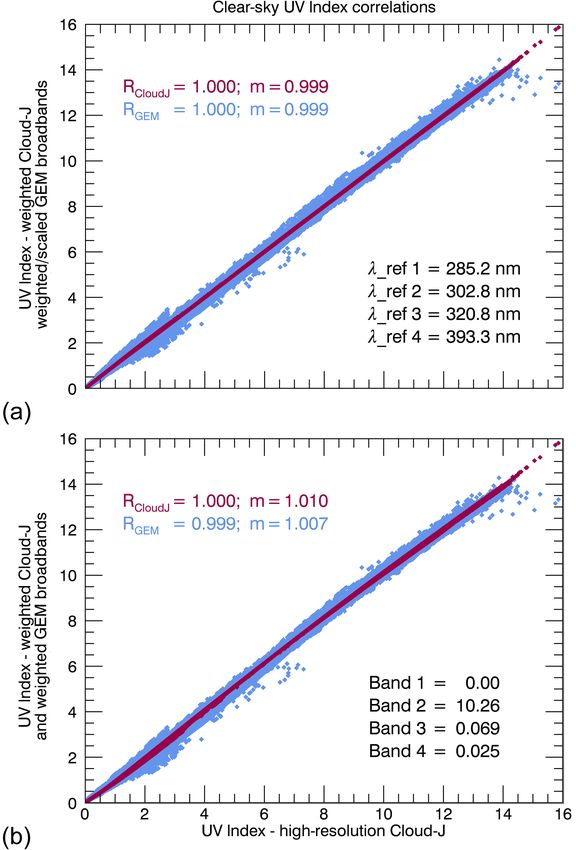
K. A. Tereszchuk et al.: Optimizing UV Index determination from broadband irradiances                                              1095

product of the erythemal action spectrum and the surface ir-
radiance (Fig. 2). This effective curve, the weighted UV irra-
diance, is then integrated over the spectral range representing
UV-A and UV-B (280–400 nm) to produce the UV Index (see
Eq. 2). A scaling factor of (25 mW m−2 )-1 is implemented to
provide a convenient set of numerical values, normally rang-
ing from 0 to 11. In extreme cases, values of > 11 can be
reached and are typically recorded in the tropics where the
solar zenith angle and the total column ozone are small. Ex-
treme values are also recorded at high elevations where the
atmospheric optical path is shortened, resulting in a reduced
attenuation of actinic fluxes and consequently producing in-
creased surface irradiances.
                      400
                       Z nm
            1
UVI =                        I (λ) · EAS(λ)dλ               (2)
        25 mW m−2
                    280 nm
                                                                   Figure 2. The UV Index is defined as the integral of the erythemally
                                                                   weighted irradiance spectrum (shaded region), produced from the
   Amidst mounting concerns arising in the late 1980s from         product of the surface irradiance (red curve; see Fig. 1) and the ery-
the escalating depletion of stratospheric O3 due to CFCs, and      themal action spectrum (green curve), over the UV-A and UV-B
the subsequent increases in the surface irradiances of UV ra-      spectral ranges. The result is then multiplied by a scaling factor
diation (Crutzen, 1992), Environment and Climate Change            (25 mW m−2 )-1 to create a numerically convenient value for the in-
Canada began providing daily UV Index forecasts as of 1992         dex. Also depicted are the corresponding irradiances for the GEM
(Burrows et al., 1994). Since its inception in 1992, the UV        broadbands divided by their respective bandwidths.
Index has been adopted worldwide as a standard indicator to
characterize solar UV intensity at the Earth’s surface (Fio-
letov et al., 2010) and serves to inform the public about the      products available from ECCC to Canadians, such as day-
strength of the Sun’s UV radiation and the adequate sun pro-       time variation, longer forecasts, and continental and regional
tection actions recommended to avoid excessive exposure to         maps. The ECCC Global Environmental Multiscale (GEM)
UV radiation (WHO Report, 2002; CIE Technical Report,              numerical weather prediction model described by Charron et
2014). The UV Index was officially adopted as the method           al. (2012), and the references therein, provides four broad-
of reporting surface UV irradiances by the World Meteoro-          band irradiances shown in Fig. 2 covering the UV spectrum
logical Organization (WMO) and World Health Organization           in the range of 280–400 nm, which can be calculated using
(WHO) in 1994.                                                     three-dimensional prognostic ozone fields. The work pre-
   At present, the UV Index determination for the ECCC             sented in this communication consists of investigating and
forecast system relies on a statistically derived weather-based    optimizing the calculation of the UV Index from these broad-
computation of the total column ozone field, adjustments us-       band irradiances, with focus on clear-sky conditions, for min-
ing total column measurements of the Canadian Brewer net-          imizing computational cost and processing time. This is car-
work, and empirical conversions to the UV Index accounting         ried out through comparisons of the UV Index and broadband
for the solar zenith angle, cloud conditions, surface altitude,    irradiances produced from GEM to those calculated using the
and snow cover. A recently undertaken study toward improv-         Cloud-J radiative transfer model (Prather, 2015), which has
ing the UV Index forecast system makes direct use of ozone         been adapted to provide high-resolution irradiance spectra at
data assimilation, ozone model forecasts, and model UV ir-         the Earth’s surface.
radiance forecasts for both clear-sky and cloudy conditions           The following subsections provide some background on
as carried out in some capacity at other forecast centres (e.g.,   the GEM-based weather forecast system, the Cloud-J ra-
NCEP/NOAA, KNMI, and ECMWF). A summary of UV In-                   diative transfer model, and their products. Section 2 de-
dex forecasting practices conducted by various governmen-          scribes the general methodology and the related fitting ap-
tal organizations worldwide were compiled by Long (2003);          proaches applied in Sect. 3 to investigate and optimize the
a more recently updated overview of UV measurement sta-            calculation of the UV Index from the broadband irradiances
tions and monitoring networks in Europe was reported by            through the use of high-resolution spectral irradiance simula-
Schmalwieser et al. (2017).                                        tions for clear-sky conditions. While a specific optimization
   This current study is part of a multi-faceted project which     under cloudy conditions is not performed due to differing
seeks to include having a UV Index forecasting package             cloud radiative transfer models, comparisons for both clear
more tightly integrated into the current weather (and air qual-    and cloudy conditions are presented and fully discussed in
ity) forecasting system and increasing the array of UV Index       Sect. 3. Conclusions are provided in Sect. 4.

www.geosci-model-dev.net/11/1093/2018/                                                 Geosci. Model Dev., 11, 1093–1113, 2018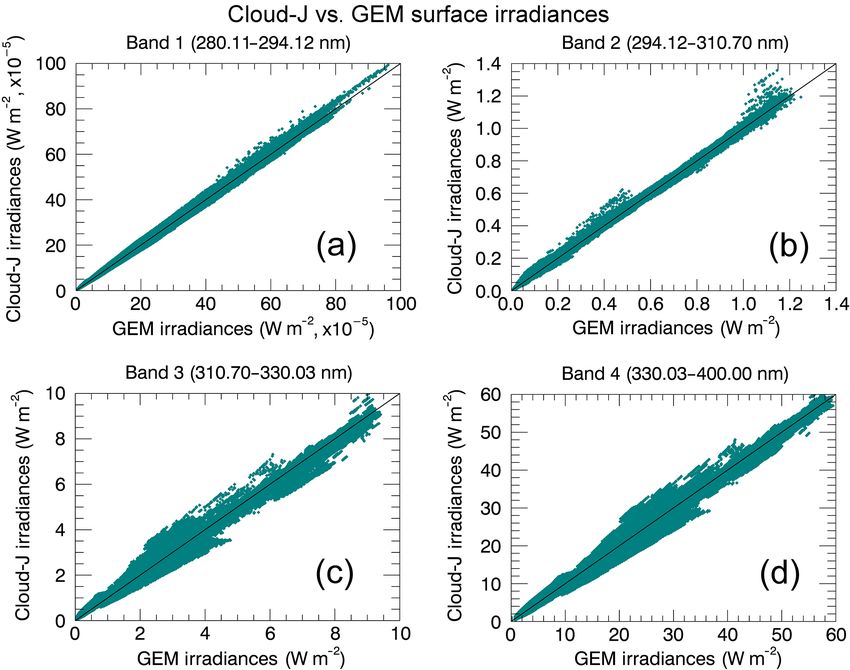
1096                           K. A. Tereszchuk et al.: Optimizing UV Index determination from broadband irradiances

1.1    GEM with LINOZ                                             for non-convective clouds. The radiative transfer impact from
                                                                  clouds is primarily dictated by the liquid and ice water mix-
The irradiance fields calculated by GEM use the CCCmarad          ing ratios (LWCR and IWCR) and cloud fraction (CLDR).
radiative transfer model. CCCmarad is an in-house radiation       Fractional cloudiness is based on a relative humidity thresh-
scheme based on a modified version of the Canadian Centre         old, which varies in the vertical. Individual cloud layers are
for Climate Modelling and Analysis (CCCma) atmospheric            assumed to overlap in the vertical using a maximum random
general circulation model (Scinocca et al., 2008), which uses     cloud overlap (Sundqvist et al., 1989; Paquin-Ricard et al.,
a correlated-k distribution method for gaseous transmission       2010).
detailed by Li and Barker (2005) and von Salzen et al. (2013).       The GEM model currently does not assimilate aerosol
The Li and Barker (2005) radiation scheme has four wave           measurement data. The radiative effects associated with
number intervals for the shortwave and nine intervals for the     background aerosols are based on a climatology produced by
longwave. The visible and UV portion of the shortwave is          Toon and Pollack (1976). This climatology specifies max-
further subdivided into nine sub-bands. The four sub-bands        imum aerosol loading at the Equator and a decrease to-
of relevance to the calculation of the UV Index cover the         ward the poles, with different values for continents and
following spectral ranges: 280.11–294.12, 294.12–310.70,          oceans. These distributions also include a latitudinal gradi-
310.70–330.03, and 330.03–400.00 nm. For convenience, the         ent. Aerosols are assumed only to affect the solar absorp-
remainder of the text will instead refer to the integer values    tion properties of the clear-sky atmosphere (Markovic et al.,
of 280, 294, 311, and 400 nm. The irradiances of the sub-         2008).
bands, i.e., the broadband irradiances, consist of direct and
diffuse components, which are available in addition to their      1.2   Cloud-J
sum. This paper involves use of all three irradiance terms of
these four sub-bands. It will separately consider the clear-      Cloud-J, a recent release of the Fast-J program (Wild et
sky and all-sky cases in the calculation of the irradiances as    al., 2000; Bian and Prather, 2002), is a multi-scattering,
well, with all-sky conditions implying the possible presence      eight-stream, radiative transfer model for solar radia-
of clouds.                                                        tion (Prather, 2015) developed for integration into three-
   The GEM dynamical core is described in Girard et al.           dimensional chemical transport models to calculate pho-
(2014), while basic descriptions of the physical parameter-       tolysis rates (J values) in the atmosphere. The version of
izations and detailed references can be found in Zadra et         the program used for this work is Cloud-J v7.4. The pro-
al. (2014a, b). Model runs were performed using a 7.5 min         gram is developed and maintained by Michael Prather in
time step for a uniform 1024 × 800 longitude–latitude grid        the Department of Earth System Science at the University
(0.352◦ × 0.225◦ ) and a Charney–Phillips vertically stag-        of California, Irvine (http://www.ess.uci.edu/group/prather/
gered grid with 80 thermodynamic levels extending from the        scholar_software/cloud-j, last access: 23 March 2018).
near surface (at η = 1) to ∼ 0.1 mbar (η ≈ 0.0001). The anal-        To calculate photolysis rates, the standard Cloud-J code
yses, serving as initial conditions for providing the forecasts   uses 18 interpolated wavelength bins covering a spectral
used in this study, are a composite of the already available      range of 187–599 nm. The integrated radiative transfer model
ECCC weather analysis and separately generated ozone anal-        uses a plane-parallel atmosphere assumption and a full scat-
yses. The GEM forecast products used as input for the simu-       tering phase function. Rayleigh and isotropic scattering are
lations performed with Cloud-J are detailed in Sect. 2.1.         taken into consideration. Numerous cloud types and aerosol
   Prognostic ozone is solved with a linearized photochem-        species of varying sizes are accounted for in the calcula-
istry scheme called LINOZ (McLinden et al., 2000), which          tions by making use of look-up tables containing the scat-
was implemented online within the GEM NWP model (de               tering functions for water droplet size, ice crystals of vari-
Grandpré et al., 2016). For this work, the ozone anal-            ous phases, dust, absorbing soot (black carbon), stratospheric
yses stem from assimilation of total column ozone data            sulfates (background and volcanic), and water haze at 0.1 and
obtained from the National Environmental Satellite, Data,         0.4 µm. Optical depth properties include extinction optical
and Information Service (NESDIS/NOAA) for the Global              depth, single scatter albedo, and a scattering phase function.
Ozone Monitoring Experiment-2 (GOME-2) instruments of                Cloud-J provides numerous options for the treatment of
the MetOp-A and MetOp-B satellites (Callies et al., 2000;         clouds in its radiative transfer calculations. Option 1 is the
Munro et al., 2006) . Assimilations were performed with the       calculation for clear-sky conditions. Options 2 and 3 are vari-
incremental three-dimensional variational approach with the       ations of the direct use of the cloud water content, which em-
first guess at appropriate time (FGAT; Fisher and Andersson,      ploys cloud fraction and separate liquid and ice water paths.
2001) using elements of the system described in Charron et        The remaining five options (4–8) employ different variations
al. (2012), and the references therein, adapted for chemical      in the correlated, overlapping cloud scheme. The approach
data assimilation.                                                seeks to represent the fractional cloud cover in the model lay-
   For the treatment of cloud, GEM employs a prognostic           ers through the calculation of numerous independent cloud
total cloud water variable with a bulk-microphysics scheme        atmospheres (ICAs), where each ICA would be either 100 %

Geosci. Model Dev., 11, 1093–1113, 2018                                            www.geosci-model-dev.net/11/1093/2018/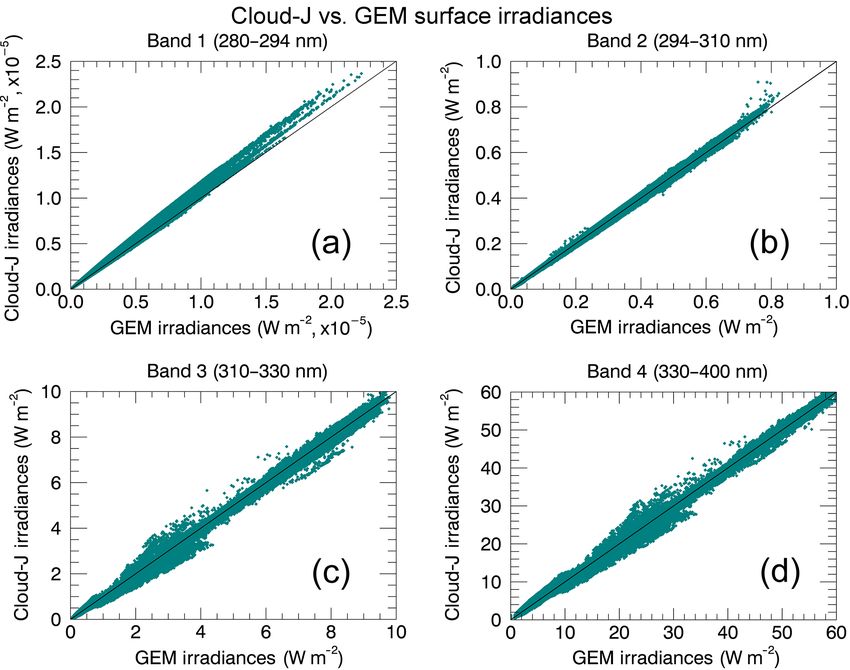
K. A. Tereszchuk et al.: Optimizing UV Index determination from broadband irradiances                                      1097

cloudy or clear in each cell of the cloud model layer. This        the GEM model and output direct and diffuse, high-spectral-
fractional cloud-overlap model serves to determine the layer       resolution surface irradiances instead of mean photolytic in-
structure, weighting, and number of ICAs that best represent       tensities. The resultant surface spectral irradiances are, in
the actual cloud distribution in the model layers.                 turn, used to calculate UV Index fields.
                                                                      To produce the high-spectral-resolution output for UV In-
                                                                   dex calculations, the number of wavelength bins was in-
2     Methodology                                                  creased to 241 with 0.5 nm intervals over the 280–400 nm
                                                                   spectral range. Having augmented the number of wavelength
Given the availability of realistic three-dimensional prognos-
                                                                   bins to perform the high-resolution calculations, additional
tic ozone to the GEM numerical weather prediction model
                                                                   spectroscopic data were required for integration into Cloud-
through the LINOZ linearized ozone model and ozone data
                                                                   J. These spectral parameters were interpolated onto a 0.5 nm
assimilation, it was proposed to make direct use of the four
                                                                   resolution grid and reformatted for reading into the program
GEM model UV broadband irradiances at the Earth’s sur-
                                                                   along with the GEM model forecasts. The spectral data in-
face to calculate the UV Index. The Cloud-J radiative transfer
                                                                   corporated into Cloud-J include
model was adapted to provide high-spectral-resolution sur-
face irradiances in the UV spectral range, 280–400 nm. The           – a set of UV–visible temperature–pressure absorption
high-resolution output is used to evaluate the GEM broad-              cross sections for O3 obtained from the GEISA spec-
band irradiances for clear-sky conditions and to optimize the          troscopic database (Jacquinet-Husson et al., 2008);
determination of the UV Index using these coarse-resolution
spectral broadbands. A comparison of results from the two            – an Earth surface reflectance climatology from 5 years
models under cloudy conditions is also performed in Sect. 3.           (2005–2009) of OMI data (Kleipool et al., 2008) (sur-
   To perform the optimization of the GEM broadband irra-              face reflectivities are provided as monthly averages for
diances, the desired output from Cloud-J is twofold.                   23 wavelength channels and a 328–499 nm range, on a
                                                                       0.5◦ × 0.5◦ grid);
    1. Sets of Cloud-J broadband irradiances are generated
       by integrating portions of the high-resolution irradiance     – a high-resolution, top-of-atmosphere (TOA) solar flux
       spectra to produce simulated versions of the four GEM           spectrum between 250 and 550 nm (Dobber et al., 2008)
       UV broadbands covering 280–294, 294–311, 311–330,               (provided by Quintus Kleipool of the Royal Nether-
       and 330–400 nm.                                                 lands Meteorological Institute, the reference spectrum
    2. A global UV Index field is produced by integrating the          was created to calibrate and validate the Ozone Moni-
       erythemally weighted high-resolution irradiance spectra         toring Instrument, OMI);
       over the 280–400 nm spectral range, Eq. (2).
                                                                     – Rayleigh scattering parameters calculated using the
   Simulated broadband irradiances are generated for com-              methodology detailed in a publication by Chance and
parison with the GEM broadband irradiances and, as needed,             Spurr (1997).
used to create sets of scaling functions to calibrate the GEM
values to the Cloud-J output. The scaled GEM broadband ir-            The O3 cross sections obtained from the GEISA
radiances are then weighted accordingly such that the global       database (http://cds-espri.ipsl.upmc.fr/etherTypo/index.php?
UV Index field produced using the GEM broadband irradi-            id=950&L=1, last access: 23 March 2018) were recorded
ances emulates the high-resolution UV Index field calculated       by Voight et al. (2001) on a Bruker IFS 120HR Fourier-
from Cloud-J. Two different approaches were implemented            transform spectrometer at a spectral resolution of 5.0 cm−1 .
to calculate the UV Index from the resultant GEM broadband         The measurements were performed as a follow up to the
surface irradiances. A least-squares fitting was employed in       cross-sectional data initially recorded by Burrows et al.
both cases to optimize the weighting under clear-sky con-          (1999) on the GOME-FM instrument. The new data sets
ditions using the UV Index field produced from the high-           recorded by Voight et al. (2001) offer precise reference spec-
resolution Cloud-J spectra as a reference.                         tra where the spectral accuracy of the data is better than
   The following subsections briefly describe the application      0.1 cm−1 (∼ 0.5 pm at 230 nm and ∼ 7.2 pm at 850 nm),
of GEM products and the Cloud-J model to ultimately evalu-         which was validated by recording visible absorption spectra
ate and optimize the UV Index determination from the broad-        of gaseous diatomic iodide (I2 ) in a reference cell using the
band irradiances.                                                  same experimental set-up. The agreement between observed
                                                                   and modelled data was determined to be 1 % and better
2.1    Calculation of high-spectral-resolution irradiances         within the 255–310 nm region. Sets of O3 absorption spectra
                                                                   were recorded using total pressures of 100 and 1000 mbar at
Originally designed to calculate tropospheric and strato-          five different temperatures ranging from 203 to 293 K. The
spheric photolysis rates in 3-D global models, the Cloud-J         spectra in the UV range at 100 and 1000 mbar are nearly
program was adapted to input three-dimensional fields from         identical to larger differences at higher wave numbers. Three

www.geosci-model-dev.net/11/1093/2018/                                               Geosci. Model Dev., 11, 1093–1113, 2018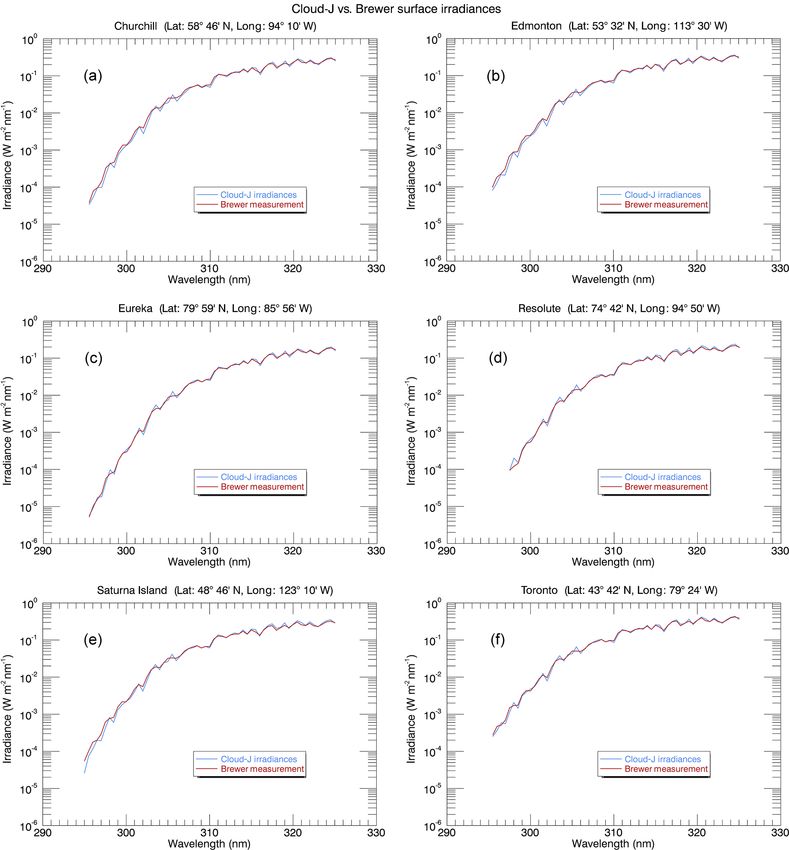
1098                           K. A. Tereszchuk et al.: Optimizing UV Index determination from broadband irradiances

O3 absorption spectra from this data set were used for incor-    by Thuillier et al. (2003) was also considered since it is com-
poration into Cloud-J (1000 mbar at 293 K and 100 mbar at        posed of measurements made from the SOLSPEC and SOSP
246 and 223 K). The selection of the three spectra was based     satellite instruments (Thuillier et al., 1998, 2003) with a res-
on consideration of the typical temperature distribution as a    olution of 1 nm. With both spectra being similar, the former
function of pressure.                                            was selected due to its higher spectral resolution even though
   In addition to the O3 temperature cross sections, the O1 D    the resolution of the latter is only a factor of 2 coarser than
quantum yields associated with ozone photolysis were also        our simulation resolution. A moving boxcar averaging win-
required by the Cloud-J radiative transfer model. Values         dow covering ±0.25 nm about sampling points at intervals of
for the quantum yields were calculated using the prescribed      0.5 nm was applied to the OMI composite spectrum to gen-
method outlined by Matsumi et al. (2002) for the same three      erate the simulation spectrum.
temperatures associated with the GEISA O3 cross sections.           Consideration was also given to high-resolution spectra
   The albedo data were interpolated from their native grid      based on accurate models of the Sun using the Kurucz et
onto the 1024 × 800 GEM global grid. A linear interpola-         al. (1984) spectrum, such as those by Chance and Spurr
tion was then performed on the data from the 23 re-gridded       (1997) and Chance and Kurucz (2010), which provide ex-
wavelength channels to obtain the intermediate albedo global     cellent spectral range, sampling, and resolution. These spec-
fields corresponding to 0.5 nm intervals over the 328–400 nm     tra unfortunately neglect optimization in the UV-B region for
spectral range to be subsequently used in the high-resolution    radiometric accuracy. The SAO96 and re-calibrated SAO96
irradiance calculations. Albedo values for the bins corre-       (SAO2010) reference spectra described by Chance and Ku-
sponding to the missing wavelength range of 280–328 nm           rucz (2010) both utilize the original Kurucz et al. (1984)
were obtained by linearly interpolating the data between the     Kitt Peak spectrum for UV-B, where O3 structure was not
328 nm OMI channel and the UV-B values published by              fully removed. Chance and Spurr (1997) reported that ef-
Chadyšien and Girgždys (2008). According to the experi-          forts were focused on intensity calibration of the wavelength
mental data reported in Table 2 of Chadyšien and Girgždys        range where most application to satellite measurements is
(2008), snow and/or ice are the primary reflectors of UV-        performed. Intensities for portions of the spectrum shortward
A and UV-B radiation, where surface reflectivity for these       of 305 nm may be in substantial disagreement, by as much
spectral regions is 94 and 88 % respectively, representing a     as 20 %, with both Dobber et al. (2008) and Thuillier et al.
drop in reflectivity of 6.38 % in the shorter wavelength re-     (2003). These spectra were deemed unsuitable for use in the
gion. To emulate the experimental data, the reflectivities for   calculation of the UV Index.
the 328 nm OMI channel were linearly reduced by 6.38 %              It should be noted that the solar spectrum used in this work
over the 280–328 nm spectral range.                              is representative of a yearly average value of the Earth’s TOA
   The OMI solar reference spectrum produced by Dobber           flux. Changes in the Earth–Sun distance and associated solar
et al. (2008) was used to provide the TOA solar flux values      fluxes during the Earth’s annual cycle are taken into account
required for the high-resolution irradiance calculations per-    and are corrected for by Cloud-J in the high-resolution sim-
formed by Cloud-J. Currently, there are no high-resolution       ulations.
solar spectra that cover the UV-A and UV-B wavelength               The input atmospheric conditions provided to Cloud-J
ranges. Most UV–vis TOA spectra are pieced together from         for this study consist of a set of 6 h forecasts from the
different sources in order to provide a continuous, unbroken     GEM model output for the dates of 23–29 August 2015,
spectrum. The OMI reference spectrum was created to val-         at 18:00 UTC with daytime over North America. The GEM
idate the radiometric calibration of OMI measurements and        fields provided as input are surface pressure, and the three-
to monitor potential optical degradation of the instrument.      dimensional fields of temperature, pressure (derived from
Also a combined spectrum, it was produced by employing           the vertical coordinate and surface pressure), ozone, spe-
the approach used by Chance and Spurr (1997). It merges the      cific humidity (converted to relative humidity), LWCR and
balloon spectrum of Hall and Anderson (1991), which cov-         IWCR, and CLDR. For the all-sky conditions, the parame-
ers a shortwave UV region between 200 and 310 nm, with           ters LWCR, IWCR, and CLDR determine the liquid and ice
a ground-based spectrum obtained from the McMath–Pierce          water partial column amounts (g m−2 ) of each model layer in
solar telescope at Kitt Peak National Observatory (Kurucz et     the presence of clouds.
al., 1984). The broadband Kitt Peak spectrum covers a spec-         Cloud-J was run individually for each day during the pe-
tral range of 296–1200 nm. The final derived spectrum is at      riod of 23–29 August 2015 to produce irradiance fields rep-
0.01 nm sampling and at 0.025 nm resolution.                     resenting the direct, diffuse, and total surface flux under both
   This spectrum was chosen for use in this work because         clear-sky and all-sky conditions. Weekly (7-day) averages of
the OMI composite spectrum uses high-resolution (0.01 nm)        the direct, diffuse, and total spectral irradiances served as ref-
UV measurements made in the stratosphere from a balloon          erence spectra in the least-squares minimization for evalua-
at ∼ 40 km in altitude (Hall and Anderson, 1991) to avoid        tion and adjustment of GEM broadband irradiances, with in-
affects of the strong atmospheric absorption below 300 nm        dividual forecast values used in the scatter plot comparisons.
(Dobber et al., 2008). The solar reference spectrum produced     While the choice of 7 days was arbitrary as fewer or more

Geosci. Model Dev., 11, 1093–1113, 2018                                            www.geosci-model-dev.net/11/1093/2018/
K. A. Tereszchuk et al.: Optimizing UV Index determination from broadband irradiances 1099
ter, a boxcar averaging window was applied instead of the ap-
proximately triangular-shaped Brewer slit function. Figure 4
depicts 5-day averages of Brewer measurements taken at
18:00 UTC on random days in the months of July and August
of 2015 and the equivalent counterpart irradiance spectra cal-
culated from Cloud-J. The locations were chosen to provide
in situ measurements for different solar zenith angles in ad-
dition to varying geographic locations to evaluate the level
of agreement between the Cloud-J model application and the
Brewer spectra. Only 5-day averages were used, partly due
to the limited number of coincident Brewer measurements
made during the July–August 2015 period which met the
selection criteria for the comparative analysis. Brewer mea-
surements not only had to have been made under clear-sky or
near-clear-sky conditions but also had to have been recorded
within ∼ 2 min local time of the analogous 18:00 UTC model
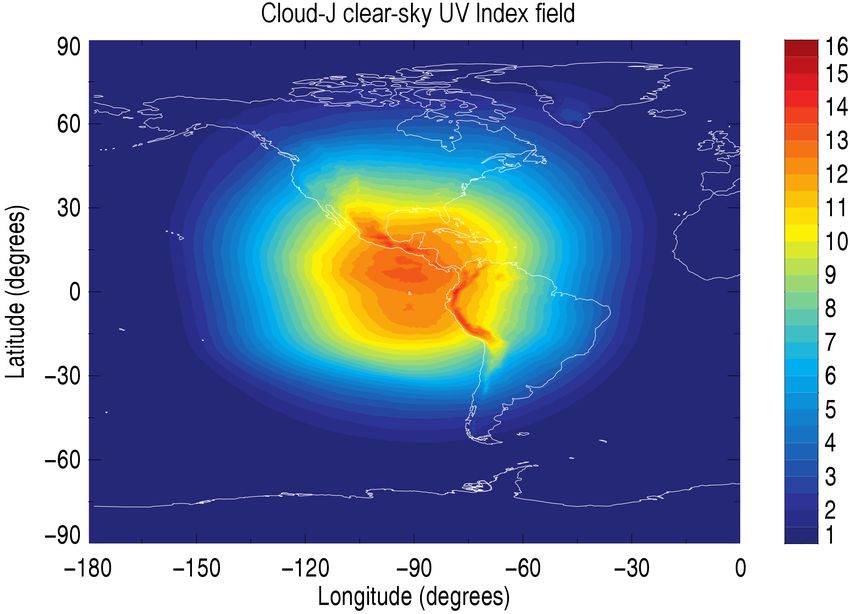
Figure 3. Cloud-J clear-sky UV Index field produced using GEM
data.
6h forecast data with the OMI and GEISA spectral parameters de-
tailed in Sect. 2.1. The UV Index field was generated from a 7-day The Cloud-J derived spectral irradiance curves largely fol-
average of spectral irradiances produced from 23 to 29 August 2015 low those recorded by the Brewer spectrophotometers. The
at 18:00 UTC. differences between the sets of curves give an overall root-
mean-square relative error between the Cloud-J and Brewer
spectra of ∼ 16 %. This reflects the level of varying differ-
days could also have been selected, the averaging was per- ences over the range of measurement wave numbers. Some
formed for computational efficiency in the minimization. The sources that might be contributing to the spectral variabil-
UV indices produced with Eq. (2) from the weekly averages ity in the differences would include differences between the
of total spectral irradiances served as reference in optimizing boxcar averaging for the simulations and an approximately
broadband irradiances based on UV Index estimation mod- triangular instrument slit function, measurement random er-
els. The UV Index field from the clear-sky weekly averages rors, and or errors in the TOA spectra for the simulations, if
is shown in Fig. 3. not others. Having large differences visually seen in Fig. 4
to often appear at relative extrema points suggests that the
2.2 Comparison to ground-based clear-sky irradiances differences of averaging functions may play a notable role in
the differences. Investigating this further, including a com-
In addition to measuring total column ozone, Brewer spec- parison of applying a triangle-shaped window instead of a
trophotometers provide ground-based measurements of the boxcar with the simulations, was not carried out as the over-
UV spectrum in the range of 290–325 nm with a full width all consistency in spectral shape was considered sufficient for
at half maximum of about 0.58 nm and a sampling inter- this work.
val of 0.5 nm. The data processing scheme used to gener- The overall differences in the Cloud-J and Brewer data
ate spectral irradiances at each 0.5 nm interval, which in- were also quantified by integrating the spectra of each of the
cludes calibration and corrections for various factors, is de- six stations to produce sets of broadband irradiances covering
scribed in the work detailed by Kerr (2010) and the refer- the 295–310 and 310–325 nm regions and the 310 nm node
ences within. A sample inter-comparison of three Brewer in- denoting the approximate transition point between the simi-
struments by Thompson et al. (1997) (see Kerr, 2010, for larly corresponding GEM irradiance broadbands.Ideally, for
other inter-comparison sources) showed relative overall dif- our comparative analysis, the wavelength ranges for the these
ferences between instruments within 6 % with an average of broadbands should be analogous to the GEM UV broad-
3 % for wavelengths longer than 300 nm; uncertainties are bands representing 294–311 and 311–330 nm, but due to
larger at shorter wavelengths. limitations in the Brewer wavelength range, broadbands for
Cloud-J clear-sky surface UV irradiances were compared 295–310 and 310–325 nm were produced for the Cloud-J
to Brewer spectra obtained from six different measurement and Brewer comparison. The resultant mean percent differ-
stations belonging to ECCC’s ozone monitoring network and ences of the Cloud-J broadband irradiance values compared
identified to be under clear-sky to optically thin cloud con- to the ground-based measurements for the 295–310 and 310–
ditions. The applied TOA solar spectrum used here for the 325 nm bands are −1.6 ± 3.8 and 2.9 ± 1.8 %, respectively.
Cloud-J simulations, as well as for optimizing use of the The band mean differences are in the range of uncertainties
GEM broadband irradiances in UV Index calculations, has from the three Brewer inter-comparisons by Thompson et al.
the same sampling interval of 0.5 nm as the Brewer measure- (1997) and provided above, and within the spread of mean
ments and a similar effective resolution of 0.5 nm. For the lat- differences in Bais et al. (2001) over the different Brewer
www.geosci-model-dev.net/11/1093/2018/ Geosci. Model Dev., 11, 1093–1113, 2018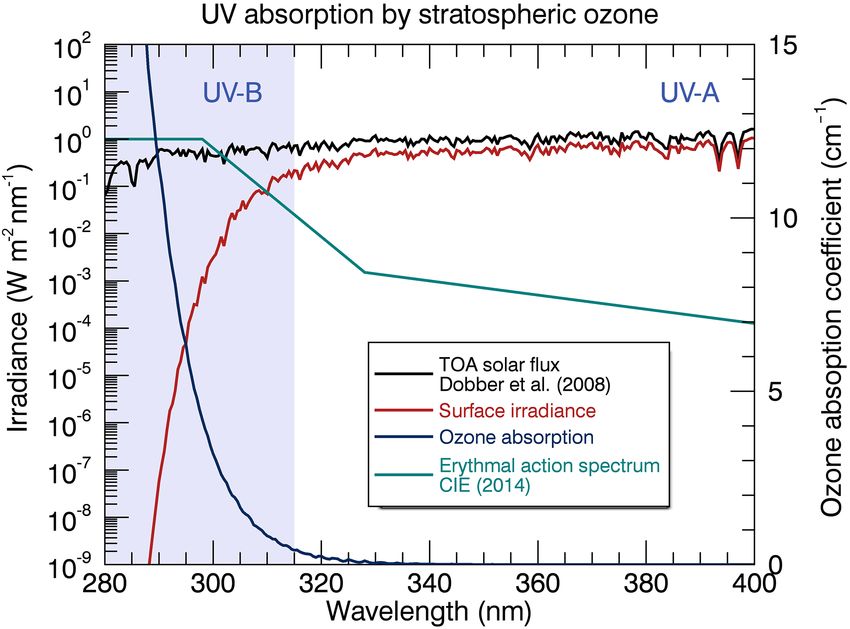
1100                             K. A. Tereszchuk et al.: Optimizing UV Index determination from broadband irradiances

Figure 4. Cloud-J clear-sky surface irradiances compared to in situ Brewer measurements obtained from six measurement stations belonging
to ECCC’s ozone monitoring network. Plotted are 5-day averages for 18:00 UTC of Brewer spectral irradiances (red curve) and the associated
Cloud-J irradiances (light blue). The Cloud-J irradiances shown here were calculated with the Dobber et al. (2008) TOA spectrum averaged
over 0.5 nm intervals with a sampling resolution also of 0.5 nm.

spectrophotometers and instruments of other types from the             tual locations and heights between the Brewer stations and
SUSPEN inter-comparison for wavelengths above 300–305                  the nearest corresponding model grid points used to repre-
nm. Sources affecting the smaller band differences might in-           sent these locations. Differences in height above sea level be-
clude disparities in clear-sky to light cloud conditions, sur-         tween the model grid points and station locations are under
face reflectivities, air pollution, column ozone, and in the ac-       30 m except for Saturna (Fig. 4e) at 26 m vs. 202 m and Eu-

Geosci. Model Dev., 11, 1093–1113, 2018                                                   www.geosci-model-dev.net/11/1093/2018/
K. A. Tereszchuk et al.: Optimizing UV Index determination from broadband irradiances                                           1101

Figure 5. Correlation of GEM and Cloud-J total surface irradiances for clear-sky conditions. The GEM UV broadband irradiances are
compared to simulated broadband irradiances produced by integrating the high-resolution Cloud-J output over the same spectral regions.
Presented are the individual 7-day irradiance contributions from 23 to 29 August 2015.

reka (Fig. 4c) at 159 m vs. 9 m. These differences would im-         UV Index spectral range, these changes are within roughly
ply differences in UV Index that are no greater than ∼ 1.5 %         0.2 % and 0.6–1.5 % based on measurements over the recent
with similarly sized differences for the UV irradiances.             decades (Yeo et al., 2015; Marchenko et al., 2016; Matthes
   Average differences in total column ozone between the             et al., 2017); the total irradiance has a weaker solar cycle
GEM model ozone fields provided to Cloud-J simulations               change of ∼ 0.1 %. These variations are within the standard
and the Brewer measurements for the sample data set of the           deviations of the mean differences over the six stations.
figure in the range of 2.8 to 4.4 % for the four non-Arctic             Further analysis of the data sets depicted in Fig. 4 reveal
stations and 0.5 and 0.4 % for the two Arctic stations of Eu-        that the ratio of the 310–325 to 295–310 nm bands used in
reka (Fig. 4c) and Resolute (Fig. 4d). It was determined that        the Brewer comparative analysis is ∼ 25 for the two Arctic
the GOME-2 column ozone data used in the assimilation to             stations and 15 to 17 for the four non-Arctic stations. This il-
generate the model forecasts were similarly biased relative to       lustrates the relative increase in irradiances above vs. below
Brewer spectrophotometers for that period; satellite data bias       311 nm for increasing solar zenith angles associated with the
can be reduced through corrections such as in van der A et           stronger increased atmospheric attenuation by ozone in the
al. (2015). Correcting for the larger ozone differences of the       lower band. As the contribution of the 294–311 nm band to
non-Arctic stations would increase the Cloud-J irradiances           large UV Index values (low solar zenith angles) is more dom-
by 3–5 % in the lower band, correspondingly changing differ-         inant, the impact of differences above 311 nm would become
ences with the Brewer spectra. The higher band would be less         more visible for low UV Index values (high solar zenith an-
affected as absorption from ozone is comparatively weaker            gles). Implications of the differing sizes of differences be-
for the upper wavelengths. This would bring the 295–310 nm           tween the Li and Barker (2005) broadbands referenced in
band irradiance mean differences in percentage closer to the         Sect. 1.1 and in model ozone forecasts are briefly further ex-
310–325 nm differences.                                              amined in Sect. 3.1.3.
   The solar irradiance changes due to the changing orbital
Earth–Sun distance are reflected in the simulations and so           2.3   Estimation of the UV Index from GEM broadband
would not be a cause of notable differences. The Sun it-                   irradiances
self displays cyclical short-term (solar rotation) and long-
term (solar cycle) solar spectrum irradiance variability. In the     Two UV Index estimation approaches using the four broad-
                                                                     band irradiances were considered. One consists of linear fit-

www.geosci-model-dev.net/11/1093/2018/                                                  Geosci. Model Dev., 11, 1093–1113, 2018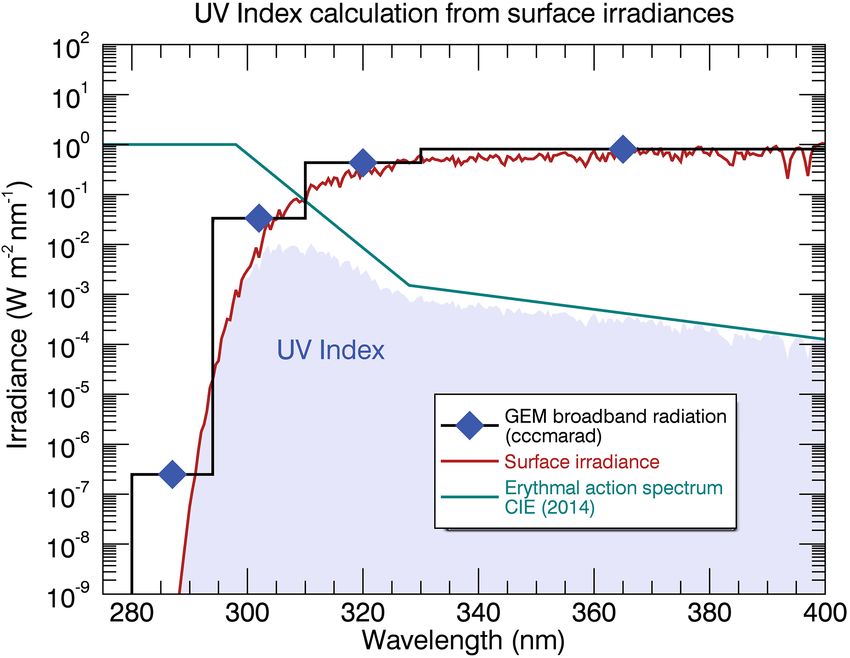
1102                            K. A. Tereszchuk et al.: Optimizing UV Index determination from broadband irradiances

ting directly to three of the four UV broadband irradiances,       is simply added to the sum of the integrations over the four
i.e.,                                                              ranges above as the erythemal function is constant with a
                                                                   value of unity over that spectral range; its contribution over
UVI = w1 I280–294 + w2 I294–311                             (3)    this integration segment could alternatively be omitted as it
       + w3 I311–330 + w4 I330–400 ,                               is negligible. Determination of a reference spectral irradiance
                                                                   for this first band in step 2 above is still carried out to pro-
with I1λ in watts per square metre and fit coefficient wi . With   vide a required interpolation node for the other integration
this equation, the contribution from the lowest band can be        segments. The specification of the segments is dictated by
neglected unless the total column ozone is less than roughly       the band widths and the two positions, 298 and 328 nm, of
210 DU to contribute at least 0.1 units to the UV Index. Its       the slope changes in the erythemal function. The applied in-
coefficient value w1 is analytically derived to be 40 m2 W−1       terpolations are of second order for the ranges 294–298 and
since the erythemal action spectrum is constant over the spec-     311–328 nm and are linear in the other ranges. The simple in-
tral range of the lowest band.                                     terpolations do not strictly preserve the original broadband ir-
   The other approach involves applying the integral of            radiance values nor accurately replicate high-resolution spec-
Eq. (2) to piecewise interpolated spectra. Both fits are in-       tra since the main interest is the fast computation of good
tended to have the UV Index values derived from the broad-         estimates of the resultant integral value. The integrations for
band irradiances be consistent with the values obtained from       the last three segments are performed using Simpson’s rule
the integrated high-resolution effective spectra. UV Index         with two subintervals (five interpolation nodes) and that for
values larger than 3 are used in the minimization to focus         294–298 nm is performed with one interval (three interpola-
the weighting on regions of moderate to high UV Index val-         tion nodes).
ues. The fitting over points with UV Index values larger than
3 does not exclude points and regions with isolated outlier
differences and includes both land, water, and snow/ice sur-       3     Results
faces. Minimization was performed using an amoeba down-
hill simplex method employing a least-squares fitting of the       3.1     Clear-sky conditions
UV Index fields from the scaled GEM broadband irradi-
ances to those from the high-resolution spectra produced by        3.1.1    Broadband irradiances
Cloud-J.
   For the integral approach, the available irradiances in watts   The comparisons made between GEM and Cloud-J broad-
per square metre over the four UV spectral broadbands must         band irradiances for clear-sky conditions shows a fairly good
be transformed to spectral irradiances for multiplication to       agreement in the 311–330 and 330–400 nm bands. For these
the erythemal function prior to spectral integration. The ap-      bands, the linear correlation agreement between the two
proximate conversion to spectral irradiances is performed as       models is typically greater than 95 % with associated root-
follows:                                                           mean-square relative errors of 6.4 and 4.0 % for midday val-
                                                                   ues. However, underestimations of GEM irradiances were
 1. The band irradiances are divided by the band widths to         found in the order of ∼ 30–50 % for the 294–311 nm band
    generate average spectral irradiances.                         and by a factor of ∼ 30 for the 280–294 nm band as shown
                                                                   in Fig. 5b and a, respectively. It was subsequently identified
 2. Each of the resulting average spectral irradiances in
                                                                   that the bulk of the differences for the two lower bands, es-
    W (m2 nm−1 )−1 is associated with a particular reference
                                                                   pecially the disparity in curvatures in bands 1 and 2 in Fig. 5,
    spectral position to be determined through fitting.
                                                                   stems from differences in equivalent broadband absorption
 3. Logarithmic first- or second-order Lagrange interpola-         cross sections if not also TOA solar fluxes. This is further
    tion is applied over each piecewise spectral integration       supported by the significantly improved agreement demon-
    interval without forcing agreement at the band inter-          strated in Fig. 6 where the cross sections of the correlated-k
    faces.                                                         approach cited in Table 6 of Li and Barker (2005) and the
                                                                   solar broadband TOA fluxes employed by the GEM model
   The selected order of the logarithmic interpolations and        were instead applied in the Cloud-J calculations. It should
initial estimates of the spectral reference positions were cho-    be noted that the band solar fluxes used in GEM differ by
sen through trial and error. The optimized spectral positions      approximately 0.02 to 0.15 % from the UV sub-band solar
are determined through least-squares fitting to the UV Index       fluxes reported in Table 6 of Li and Barker (2005).
values calculated from the Cloud-J high-spectral-resolution           A direct comparison was made between the GEM TOA
irradiances.                                                       solar fluxes and the broadband averages that were calcu-
   Interpolations and weighted integrations are performed          lated from Cloud-J using the data obtained from Dobber et
over four segments covering the ranges 294–298, 298–311,           al. (2008). There are significant differences in the two short-
311–328, and 328–400 nm. The irradiance for 280–294 nm             wavelength broadbands with the band values calculated from

Geosci. Model Dev., 11, 1093–1113, 2018                                              www.geosci-model-dev.net/11/1093/2018/
K. A. Tereszchuk et al.: Optimizing UV Index determination from broadband irradiances 1103
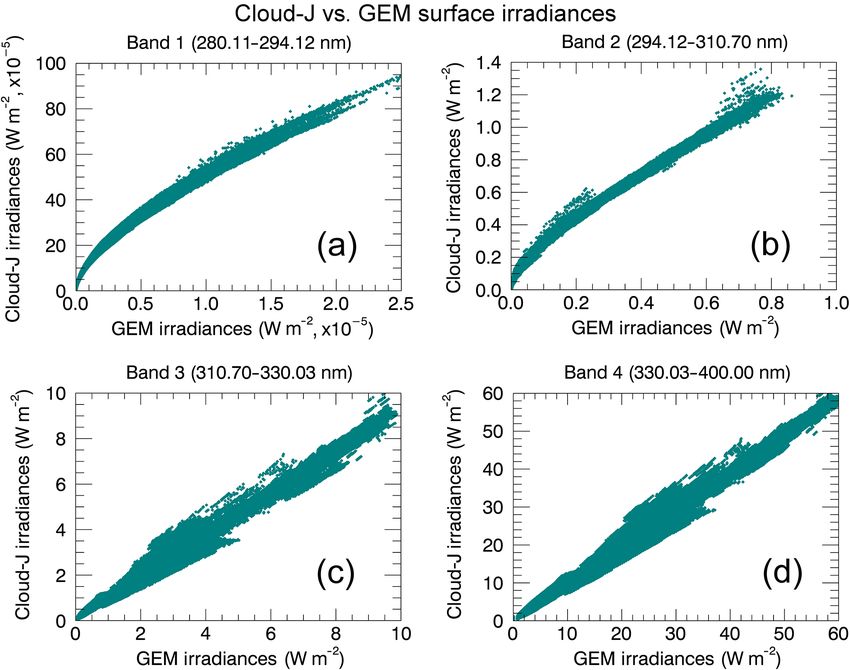
Figure 6. GEM broadband surface irradiances compared to simulated irradiances generated with Cloud-J, where the Cloud-J calculations
were performed using the broadband absorption cross section and TOA solar fluxes associated with the correlated-k scheme used by GEM
for each UV sub-band. Correlations represent the single-day irradiance contribution for 23 August 2015.
the Dobber et al. (2008) fluxes being smaller than the GEM for a reference temperature and pressure of 223 K and
fluxes by 35 and 15 % for the 280–294 and 294–311 nm 100 mbar, and the N is a total column ozone of
bands, respectively; values for the higher bands are only 3 % 8.07 × 10¹⁸ molecules cm−2 , equivalent to 300 DU. The nu-
smaller and 2 % larger, respectively. These differences would merator is equivalent to deriving broadband average solar
favour an underestimation of the Cloud-J irradiances relative fluxes from equally weighting values over all wavelengths
to GEM at the shorter wavelengths in the absence of dif- as in the previous paragraph. The effective cross section esti-
ferences in cross sections, which is opposite to the results mates calculated from Cloud-J for the two lowest UV bands
in Fig. 5. A comparison to the band averages derived from (280–294 and 294–311 nm), with values of 1.09 × 10⁻¹⁸ and
the solar flux spectrum of Chance and Kurucz (2010) gives 2.20 × 10⁻¹⁹ cm2 molecule−1 , respectively, are now instead
smaller differences of −12, 2, −1, and 3.5 % relative to the smaller by 31 and 19 % relative to the cross sections referred
GEM values. to in Li and Barker (2005), implying larger Cloud-J irradi-
The spectrally, uniformly weighted average cross sections ances; values are larger for the higher wavelength bands by
from the GEISA data set which represent the four UV broad- 5 % (311–330 nm) and 18 % (330–400 nm). The impact of
band irradiances are about 24–32 % larger than the values these differences is made stronger for the lower bands as
reported in Table 6 of Li and Barker (2005), this also be- their absorption cross sections are larger than for the higher
ing inconsistent in implication with Fig. 5. However, these bands by an order of magnitude or more; absorption by ozone
estimates do not account for the non-linear impact of the in the higher bands is comparatively much weaker. The im-
strong spectral variation in absorption cross sections from plied tendency is now in agreement with Fig. 5. This sug-
the GEISA database at lower wavelengths in the UV spectral gests weaker atmospheric attenuation at least from using the
range shown in Fig. 7. Effective band cross sections from GEISA cross-section data set instead of the broadband ab-
the GEISA spectrum were also calculated for each spectral sorption cross sections associated with the correlated-k ap-
region for irradiances at the surface using proach. Taking the spectrally dependent cross sections and
1
P
Fλ 1λ
solar fluxes used with Cloud-J as more reliable references,
ceff = · ln P , (4) then one or both elements of the broadband cross section
N Fλ e−Ncλ 1λ
and solar flux pairs associated with Li and Barker (2005)
where Fλ denotes the solar spectral irradiances in and GEM for the lower bands could be considered less op-
W (m2 nm−1 )−1 , cλ are the absorption coefficients set
www.geosci-model-dev.net/11/1093/2018/ Geosci. Model Dev., 11, 1093–1113, 20181104 K. A. Tereszchuk et al.: Optimizing UV Index determination from broadband irradiances
Table 1. Sets of scaling functions to calibrate the GEM UV broadband irradiances to emulate the simulated broadband irradiances produced
by Cloud-J. Functions were obtained for total surface irradiances and also their direct and diffuse components.
GEM UV broadband irradiance scaling functions
Wavelength range Total irradiance (W m−2 ) Direct component (W m−2 ) Diffuse component (W m−2 )
0.554x 0.608 x ≤ 7.5 × 10⁻⁶ 0.561x 0.619 x ≤ 4.0 × 10⁻⁶ 0.226x 0.575 x ≤ 3.0 × 10⁻⁶
280.11–294.12 nm f (x) = f (x) = f (x) =
0.729x 0.631 x > 7.5 × 10⁻⁶ 1.060x 0.671 x > 4.0 × 10⁻⁶ 0.239x 0.579 x > 3.0 × 10⁻⁶
1.212x 0.635 1.079x 0.657 x ≤ 0.1 0.890x 0.609
x ≤ 0.2 x ≤ 0.05
294.12–310.70 nm f (x) = f (x) = f (x) =
1.390x 0.727 x > 0.2 1.310x 0.742 x > 0.1 1.093x + 0.095 x > 0.05
310.70–330.03 nm f (x) = 0.953x f (x) = 1.026x f (x) = x 0.872
330.03–400.00 nm f (x) = 0.985x f (x) = 1.025x f (x) = x 0.965
ing functions are provided in Table 1. The correlation of the
broadband Cloud-J and the scaled GEM total irradiances ob-
tained for clear-sky conditions are provided in Fig. 8.
3.1.2 UV Index from broadband irradiances
The UV Index fitting based on the Sect. 2.3 integral approach
applied to GEM scaled broadband irradiances provided refer-
ence positions of 285.2, 302.8, 320.8, and 393.3 nm for bands
1 through 4, respectively, while the straightforward linear fit
yielded
UVI = 10.26I294–311 + 0.069I311–330 + 0.025I330–400 , (5)
where the first coefficient was derived analytically as men-
tioned in Sect. 2.3. Most of the sensitivity to ozone variabil-
ity is typically reflected in I294–311 as absorption from ozone
Figure 7. GEISA ozone absorption cross sections measured at is comparatively weaker for the upper wavelength bands.
a temperature and pressure of 223 K and 100 mbar, respectively. Reductions in column ozone by 20 % from 300 DU imply
Overlaid are the effective absorption coefficients calculated from changes of about 38, 8.6, and 0.15 % in UV Index from the
the GEISA cross section, as described in Sect. 3.1.1, and the GEM last three terms, respectively, when the Sun is directly over-
average absorption coefficients for each representative UV broad- head.
band region.
Differences of the clear-sky UV Index field between the
Cloud-J and resulting GEM values are shown in Fig. 9 and
are found to be typically less than 0.2–0.3 for both the in-
timal for determining irradiances at the surface. This stance tegration (panel a) and linear fit (panel b) approaches. The
is supported by the better agreement, for the six stations in integration approach provides better agreement with Cloud-
Sect. 2.2, between the Cloud-J and Brewer sample spectra, J, this by up to about 0.1–0.2 for some locations. Over North
especially for the dominant 295–310 nm band. America, the resultant UV Index values are usually smaller
Considering the above analysis of the differences in broad- than the Cloud-J-based values by 0.1 to 0.3. Both plots also
band irradiances shown in Fig. 5, scaling of the GEM ir- demonstrate an extended circular region at high zenith an-
radiances to the Cloud-J broadband irradiances was applied gles in the Southern Hemisphere with positive differences
as functions of the irradiance values for each spectral band. reaching up to ∼ 0.5 in the South Pacific area. These larger
While contributions to the UV Index from the 280–294 nm differences are coincident with UV Index values near the
band itself could be neglected for total column ozone above threshold value of 3 used in the least-squares minimiza-
roughly 150 DU, scaling functions for this band were still tion of the scaled GEM broadband irradiances to the high-
generated since the band value is used in the spectral inter- resolution UV Index field produced by Cloud-J. In addition,
polation to higher wave numbers for the second UV Index there are a sparse number of hot spots which are primarily
model of Sect. 3.1. Also, scaling for the two highest UV confined to the Arctic and the high-altitude regions of the
bands is not essential and was performed here for complete- Western Cordilleras of North and South America. Here, the
ness. Fits were generated using the 7-day contributions for differences in the UV Index range between 0.2 and an ex-
the total, direct, and diffuse irradiances of the four bands treme of 2.4, where the largest differences are confined to a
under clear-sky conditions (23–29 August 2015). The scal- few isolated mountain peaks in Ecuador and the Southern
Geosci. Model Dev., 11, 1093–1113, 2018 www.geosci-model-dev.net/11/1093/2018/You can also read


