Mapping endothelial-cell diversity in cerebral cavernous malformations at single-cell resolution - eLife
←
→
Page content transcription
If your browser does not render page correctly, please read the page content below
RESEARCH ARTICLE

                                    Mapping endothelial-cell diversity in
                                    cerebral cavernous malformations at
                                    single-cell resolution
                                    Fabrizio Orsenigo1†, Lei Liu Conze2†, Suvi Jauhiainen2, Monica Corada1,
                                    Francesca Lazzaroni1, Matteo Malinverno1, Veronica Sundell2, Sara Isabel Cunha2,
                                    Johan Brännström2, Maria Ascención Globisch2, Claudio Maderna1,
                                    Maria Grazia Lampugnani1,3*, Peetra Ulrica Magnusson2*, Elisabetta Dejana1,2*
                                    1
                                     Vascular Biology Unit, FIRC Institute of Molecular Oncology Foundation (IFOM),
                                    Milan, Italy; 2Department of Immunology, Genetics and Pathology, Uppsala
                                    University, Uppsala, Sweden; 3Mario Negri Institute for Pharmacological Research,
                                    Milan, Italy

                                    Abstract Cerebral cavernous malformation (CCM) is a rare neurovascular disease that is
                                    characterized by enlarged and irregular blood vessels that often lead to cerebral hemorrhage.
                                    Loss-of-function mutations to any of three genes results in CCM lesion formation; namely, KRIT1,
                                    CCM2, and PDCD10 (CCM3). Here, we report for the first time in-depth single-cell RNA
                                    sequencing, combined with spatial transcriptomics and immunohistochemistry, to comprehensively
                                    characterize subclasses of brain endothelial cells (ECs) under both normal conditions and after
                                    deletion of Pdcd10 (Ccm3) in a mouse model of CCM. Integrated single-cell analysis identifies
*For correspondence:                arterial ECs as refractory to CCM transformation. Conversely, a subset of angiogenic venous
mariagrazia.lampugnani@ifom.eu      capillary ECs and respective resident endothelial progenitors appear to be at the origin of CCM
(MGL);                              lesions. These data are relevant for the understanding of the plasticity of the brain vascular system
peetra.magnusson@igp.uu.se          and provide novel insights into the molecular basis of CCM disease at the single cell level.
(PUM);
elisabetta.dejana@ifom.eu (ED)
†
 These authors contributed
equally to this work                Introduction
                                    Endothelial cells (ECs) are a particularly heterogenous cell population, as they have distinct struc-
Competing interest: See
                                    tural, phenotypic, and functional properties (Kalucka et al., 2020; Vanlandewijck et al., 2018).
page 29
                                    Recent studies have shown that ECs of arteries, veins, and the lymphatic system show high degrees
Funding: See page 29                of specialization in their responses to specific hemodynamic and functional requirements
Received: 24 July 2020              (Augustin and Koh, 2017). Compared to large-vessel endothelia, this adaptation of microvascular
Accepted: 12 October 2020           ECs is seen by their expression of highly specialized properties, in terms of their responses to the
Published: 03 November 2020         specific requirements of different organs. Thus, an improved understanding of the molecular basis of
                                    this EC heterogeneity will help toward the definition of organ function under physiological and path-
Reviewing editor: Salim
Abdelilah-Seyfried, Potsdam
                                    ological conditions.
University, Germany                     The cells that form the microcirculation of the brain represent a typical example of highly special-
                                    ized microvascular ECs. The main important functions of these vessels relate to the regulation of
   Copyright Orsenigo et al. This
                                    cerebral blood flow and oxygen delivery, and the supply of energy metabolites to the nerve cells.
article is distributed under the
                                    Dysfunction of the brain vascular system can cause major problems for brain connectivity, synaptic
terms of the Creative Commons
Attribution License, which          activity, and information processing (Zhao et al., 2015). The specialized function of the brain micro-
permits unrestricted use and        circulation requires coordinated and continuous cross-talk between ECs and the other cell types, to
redistribution provided that the    thus establish what is known as the ‘neurovascular unit’ (Zhao et al., 2015). ECs are surrounded and
original author and source are      embraced by pericytes and they are in contact with the glia (i.e. astrocytes, oligodendrocytes, micro-
credited.                           glia) and neurons (Armulik et al., 2010). The ECs in these neurovascular units form the blood–brain

Orsenigo, Conze, et al. eLife 2020;9:e61413. DOI: https://doi.org/10.7554/eLife.61413                                                1 of 34
Research article                                                                             Cell Biology Genetics and Genomics

                                   barrier (BBB), which strictly controls the entry of neurotoxic plasma components, circulating inflam-
                                   matory cells, and pathogens into the brain tissue (Iadecola, 2017).
                                       As well as their control of general vascular permeability, the cells of the BBB promote the passage
                                   of nutrients and other essential molecules from the blood into the brain through their expression of
                                   multiple highly specialized transport systems (Zhao et al., 2015). Thus, the integrity of the BBB is
                                   regulated through coordinated and continuous interactions of the ECs with the surrounding neural
                                   cells, pericytes, and fibroblasts, which form a favorable environment for the ECs to develop and
                                   express their specialized properties.
                                       Several genetic pathologies that can cause alterations in the development and function of the
                                   BBB arise as a result of inactivation of specific genes in the cells of the neurovascular units. While
                                   these diseases are relatively rare, they can help us to identify the key mechanisms that underlie the
                                   formation of the BBB and the acquisition of its specialized properties. A typical example here is the
                                   genetic disease known as cerebral cavernous malformation (CCM) (Clatterbuck, 2001). CCM vascu-
                                   lar lesions, or cavernomas, mostly develop in the central nervous system and the retina. These can
                                   frequently bleed, which leads to epileptic seizures, focal neurological deficits, and other neurological
                                   problems, such as hemorrhagic stroke (Clatterbuck, 2001; Labauge et al., 2007; Rigamonti et al.,
                                   1988; Wong et al., 2000).
                                       CCMs occur in both familial and sporadic forms. The familial form of CCM has an overall preva-
                                   lence of less than 1:10,000. It is characterized by multiple CCM lesions that increase in number and
                                   size through the life of the patient, which results in recurrent cerebral hemorrhage. Familial CCM is
                                   due to loss-of-function mutations in any one of the three genes known as KRIT1 (or CCM1), CCM2
                                   (or OSM), and PDCD10 (or CCM3). These three types of CCM loss-of-function mutations show com-
                                   parable morphology and specific brain localization. Instead, the sporadic form of CCM has relatively
                                   high prevalence, of about 1:200, and in the majority of cases, it occurs as a single cavernoma. Spo-
                                   radic CCM can also result in a relatively variable set of symptoms, which are similar to familial CCM
                                   and depend on the location of the cavernoma (Labauge et al., 2007; Akers et al., 2017;
                                   Cavalcanti et al., 2012).
                                       At present, to limit disease progression, there remains the need for an effective
                                   pharmacological treatment for patients with CCM, as to date, the only curative therapy is lesion
                                   eradication by surgical intervention or stereotactic radiosurgery. Open skull surgery is currently
                                   applied to selected symptomatic lesions only, as it is highly invasive, and it can result in significant
                                   complications, while being accompanied by unproven long-term benefit. Also, in familial CCM, nei-
                                   ther surgery nor radiotherapy can cure multiple lesions throughout the brain and spinal cord. There-
                                   fore, despite many studies into CCM, an effective pharmacological therapy for this disease is still
                                   missing (Abdelilah-Seyfried et al., 2020).
                                       An important step toward the understanding of CCM and any potential therapy is the identifica-
                                   tion of the EC populations that trigger and sustain the development of these vascular malformations.
                                   Here, we have used single-cell RNA sequencing (scRNA-seq) to map the transcriptional diversity of
                                   ECs in vascular cavernomas, with specific focus on PDCD10. Using this system, we identified distinct
                                   EC clusters and we define their functional roles in the development and progression of CCM.

                                   Results
                                   Endothelial cell heterogeneity across normal and CCM conditions
                                   To study the EC subpopulation(s) that form lesions in CCM, we used Cdh5(PAC)-Cre-ERT2/Ccm3f/f/
                                   Cldn5(BAC)-GFP mice for EC-specific recombination (Wang et al., 2010). Following a single tamoxi-
                                   fen injection administered to the pups on their first day after birth, by P8 these mice develop CCM
                                   lesions in the brain that resemble human cavernomas (Figure 1A–C; Figure 1—figure supplement
                                   1). ECs were isolated and enriched (CD45- and CD31+) from the brain of both Cre-negative
                                   (Pdcd10-wt) and Cre-positive (Pdcd10-ko) littermates and processed for droplet-based scRNA-seq.
                                   ScRNA-seq libraries were prepared using the 10 Genomics platform, and the R toolkit Seurat (ver-
                                   sion 3) (see Materials and methods) was used for integrated data analysis (Figure 1A).
                                      After quality control, 15,057 cells from two Pdcd10-wt mice and 17,204 cells from two Pdcd10-ko
                                   mice were analyzed jointly. Through unsupervised clustering, 17 cell clusters (C) were distinguished
                                   and visualized using ‘uniform manifold approximation and projection’ (UMAP) (Figure 1D–F). Based

Orsenigo, Conze, et al. eLife 2020;9:e61413. DOI: https://doi.org/10.7554/eLife.61413                                               2 of 34
Research article                                                                                      Cell Biology Genetics and Genomics

Figure 1. scRNA-sequencing of Pdcd10-wt and Pdcd10-ko endothelial cells. (A) Experimental scheme (see Materials and methods for details). (B)
Representative photographs of Pdcd10-wt (left) and Pdcd10-ko (right) whole brains at P8. (C) Representative confocal microscopy of the vasculature of
Pdcd10-wt (left) and Pdcd10-ko (right) cerebella at P8, stained for Podocalyxin (black; see also Figure 1—figure supplement 1). Scale bars: 1 mm. (D)
UMAP plot showing detected cell subpopulations in the Pdcd10-wt and Pdcd10-ko integrated analysis. The total numbers of cells within each cluster
Figure 1 continued on next page

Orsenigo, Conze, et al. eLife 2020;9:e61413. DOI: https://doi.org/10.7554/eLife.61413                                                          3 of 34
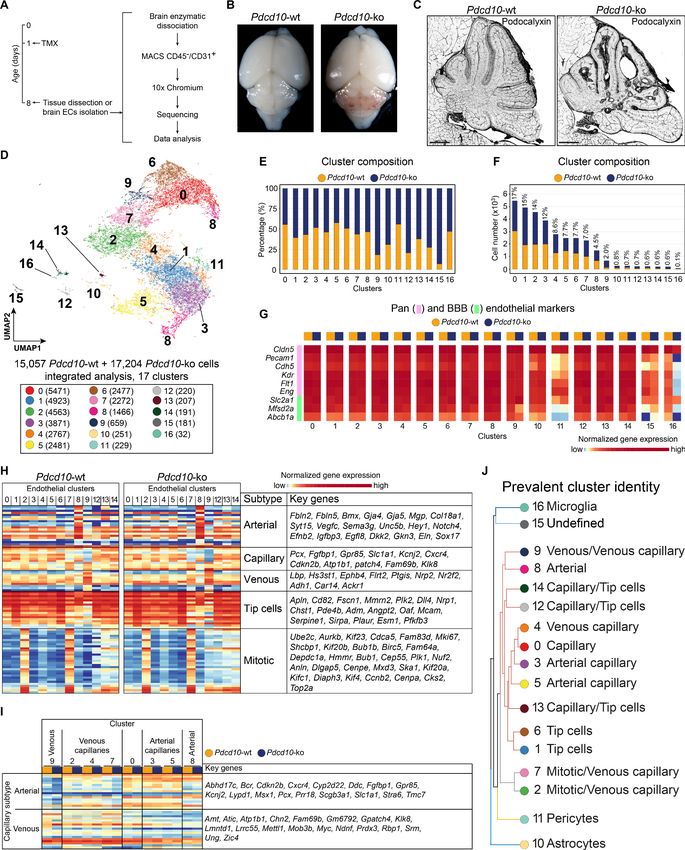
Research article                                                                                         Cell Biology Genetics and Genomics

Figure 1 continued
are shown in brackets in the color legend (bottom panel). (E) Plot of the percentages of Pdcd10-wt (orange) and Pdcd10-ko (blue) cells in each of the
cluster. (F) Plot of the numbers of Pdcd10-wt (orange) and Pdcd10-ko (blue) cells in each cluster. The percentages of total cells in each cluster (%) is
reported above each bar. (G) Heatmap of the selected pan- (pink) and blood–brain barrier- (BBB; green) endothelial cell markers (normalized
expression shown; see Materials and methods) for the Pdcd10-wt and Pdcd10-ko cells in each cluster. (H) Heatmap of the selected endothelial cell
subtype markers (from top to bottom, as indicated: arterial, capillary, venous, tip cells, mitotic), to show the normalized expression levels of the Pdcd10-
wt (left) and Pdcd10-ko (right) cells in each cluster (see also Supplementary file 1). For each subtype, the key genes are listed accordingly (top-to-
bottom). (I) Heatmap of normalized expression of arterial and venous capillary markers in the capillary and mitotic/capillary clusters (C0, C2, C3, C4, C5,
C7). The venous (C9; left) and arterial (C8; right) clusters are reported for reference. The Pdcd10-wt (orange) and Pdcd10-ko cells (blue) are shown
separately. Key genes are listed according to the top-to-bottom order in the heatmap. (J) Summary of the prevalent identities of the 17 clusters based
on endothelial cell subtype marker expression as in (H, I) and Figure 1—figure supplement 1. The dendrogram of the hierarchical clustering is shown
on the left. Non/mixed-ECs clusters (C10, C11, C15, C16) show early segregation. Arterial/venous (C8, C9), capillary (C0, C3, C4, C5), tip (C1 and C6)
and mitotic/capillary (C2, C7) cells segregate as distinct groups of the final branches. Clusters 12, 13, and 14 show features of both capillaries and tip
cells, but only C12 and C14 segregate on neighbor final branches.
The online version of this article includes the following figure supplement(s) for figure 1:
Figure supplement 1. Representative confocal microscopy of Pdcd10-wt and Pdcd10-ko brains at P8 immunostained for Podocalyxin.
Figure supplement 2. Expression of selected markers of endothelial and contaminant cells in the identified clusters.
Figure supplement 3. Sequencing quality control and clustering tree of examinedPdcd10-wt andPdcd10-ko ECs.
Figure supplement 4. Clustering tree of examined Pdcd10-wt and Pdcd10-ko endothelial cells with overlaid prevalent cluster identity.

                                      on the expression of a panel of known brain endothelial marker genes (Figure 1G; Figure 1—figure
                                      supplement 2A,B), four clusters were identified as mixed with non-ECs (C10, C11, C15, C16). While
                                      the identity of C15 remains unclear, two clusters were identified as enriched in pericytes (C11) and
                                      microglia (C16) (Figure 1—figure supplement 2C; Supplementary file 1). Cluster 10 (C10), instead,
                                      appeared to be a mixture of ECs and astrocytes, as marker genes of both of these cell types were
                                      highly expressed in this population (Figure 1—figure supplement 2C; Supplementary file 1).
                                          The remaining 13 endothelial subpopulations were then characterized on the basis of the overall
                                      expression levels of the reported endothelial marker genes (Figure 1H,I; Supplementary file 1; Fig-
                                      ure 1—figure supplement 2E). These were categorized into six groups of ECs, as venous (C9), arte-
                                      rial (C8), capillary (C0, C3, C4, C5), tip (C1, C6), mitotic/capillary (C2, C7), and tip/capillary (C12,
                                      C13, C14) cells (Figure 1H,J). The capillary ECs were further distinguished into venous (C2, C4, C7)
                                      and arterial (C3, C5) (Figure 1I,J; Sabbagh et al., 2018).
                                          In our mouse model, CCM lesion formation correlated with deletion of the Pdcd10 gene. All of
                                      the endothelial subpopulations except C13 showed significant down-regulation of Pdcd10 expres-
                                      sion after Pdcd10 deletion (Figure 1—figure supplement 2D). As expected, the mixed endothelial
                                      and non-EC clusters (C10, C11, C15, C16) did not show Pdcd10 down-regulation. Therefore, these
                                      five clusters were excluded from further analysis (Figure 1—figure supplement 2D).

                                      Pdcd10 deletion induces specific transcriptional profiles in distinct
                                      endothelial subpopulations
                                      To determine whether the formation of cavernomas occurs for specific subpopulations of ECs, we
                                      analyzed the changes in gene expression between the Pdcd10-wt and Pdcd10-ko ECs in each clus-
                                      ter. The comparisons between the total numbers of differentially expressed genes (DEGs) indicated
                                      that the venous/venous capillary ECs in C9 were highly modified by Pdcd10 deletion, while the arte-
                                      rial ECs in C8 were essentially not affected (Figure 2A). Also, the arterial- capillary ECs of C3 and C5
                                      were minimally affected by Pdcd10 deletion (Figure 2A). Furthermore, this analysis also showed that
                                      the tip cell C1 and C6 and the mitotic/venous capillary C7 and capillary C0 Pdcd10-ko EC clusters
                                      showed strong modifications to their gene expression, which indicated that Pdcd10 deletion was
                                      particularly significant in these cells, as compared to the other cell clusters.

                                      Lesion marker genes
                                      The transcription factors Klf4 and Klf2 are key drivers of the Pdcd10-ko phenotype, and they are up-
                                      regulated in brain ECs after Pdcd10 deletion (Maddaluno et al., 2013; Zhou et al., 2016;
                                      Cuttano et al., 2016). Here, both Klf4 and Klf2 were up-regulated in the Pdcd10-ko ECs compared
                                      to the Pdcd10-wt ECs in almost all of the clusters (C0–C7, C9). The exceptions here were the arterial

Orsenigo, Conze, et al. eLife 2020;9:e61413. DOI: https://doi.org/10.7554/eLife.61413                                                               4 of 34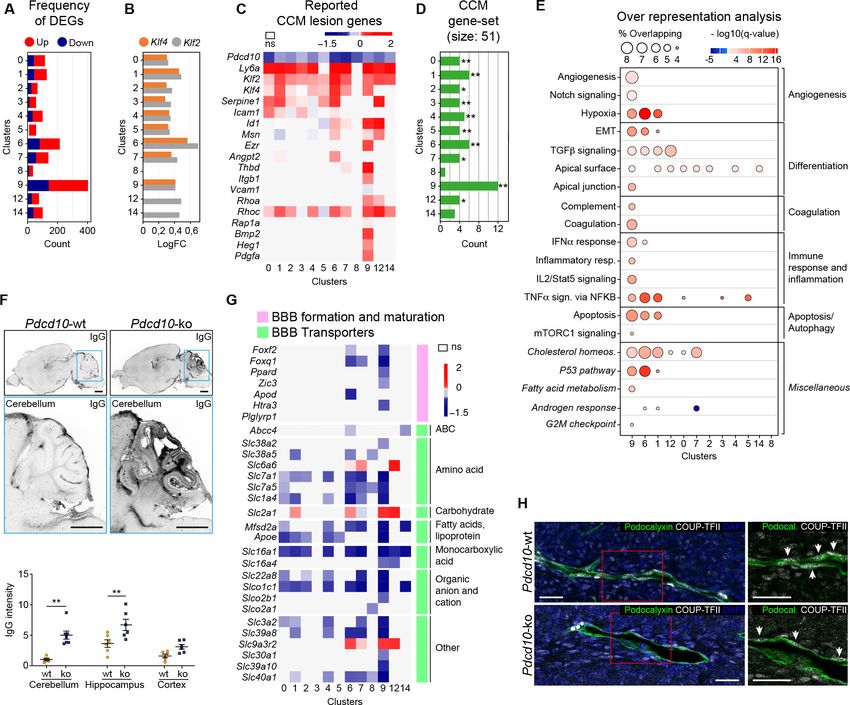
Research article                                                                                        Cell Biology Genetics and Genomics

Figure 2. Pdcd10 deletion induces specific transcriptional profiles in distinct endothelial cell subpopulations. (A) Numbers of significant differentially
expressed genes (DEGs) (padj
Research article                                                                                      Cell Biology Genetics and Genomics

Figure 2 continued
Figure supplement 1. Pdcd10 deletion increases vessel permebility and impairs endothelial cell-to-cell junction organization.

                                     C8 ECs, which were not affected (further commented below), and the tip/capillary C12 and C14
                                     ECs, which showed significant up-regulation of only Klf2 (Figure 2B). The greatest up-regulation of
                                     Klf4 and Klf2 was seen for the tip cell clusters C1 and C6. Pdcd10-wt arterial ECs of C8 showed sig-
                                     nificantly higher expression of Klf4 and Klf2 compared with Pdcd10-wt ECs of all the other clusters
                                     (average logFC, 0.72, 0.55, respectively; padj  0.3) between the
                                     Pdcd10-wt and Pdcd10-ko using the Gene Set Enrichment Analysis (GSEA) software and the ‘hall-
                                     mark’ gene sets from the Molecular Signatures Databases (version 7.0). In the absence of Pdcd10 in
                                     the venous/venous capillary C9 and tip cell C1 and C6 ECs, the biological processes implicated in
                                     CCM pathology were mainly altered, which included angiogenesis, cell differentiation, coagulation,
                                     immune responses, and cell apoptosis (Figure 2E; Supplementary file 4). In a previous study, we
                                     reported that ECs undergo endothelial-to-mesenchymal transition that is mediated through
                                     increased TGFb signaling (Maddaluno et al., 2013). This process is relevant for the development of
                                     vascular lesions, and is further confirmed here by this single-cell analysis (Supplementary file 4).

                                     State of BBB maturation and permeability
                                     In patients with CCM, the BBB is impaired (Clatterbuck, 2001; Mikati et al., 2015), as reported
                                     here in this murine Pdcd10-depletion model, where there was significant increase in vascular perme-
                                     ability to endogenous immunoglobulins (Figure 2F, cerebellum; Figure 2—figure supplement 1A,
                                     cerebrum). Coherent with this, the expression levels of many regulators of BBB
                                     formation and maturation that cooperate to establish the BBB (e.g. Foxf2, Foxq1, Ppard,
                                     Zic3) (Hupe et al., 2017) were decreased in the potential lesion-forming C9 and C6 clusters
                                     (Figure 2G, pink). Transporters that finely tune BBB functions (Figure 2G, green) were also diffusely
                                     down-regulated in the Pdcd10-ko cells, with the C9, C6, and C7 ECs as the most affected. Of note,
                                     three transporters (i.e. Slc2a1 or Glut1, Slc9a3r2, Slc6a6) were all up-regulated in the Pdcd10-ko cells
                                     of the C1, C6, C7, C9, and C12 ECs. Interestingly, enhancement of glucose transport mediated by
                                     Slc2a1 supports glycolytic metabolism in ECs of tumor vessels (Rohlenova et al., 2018). All of these
                                     functions indicated were minimally or not modified in the arterial C8 Pdcd10-ko ECs (Figure 2A–G)
                                     and in the putative arterial-capillary C3 and C5 ECs (Figure 1J), which were only partially affected by
                                     the Pdcd10 deletion (Figure 2A–G).
                                        As previous reports have shown disrupted endothelial cell-to-cell junctions in CCM
                                     lesions (Bravi et al., 2016), we investigated the gene expression levels of other key junctional com-
                                     ponents. Among the panel of junctional molecules investigated (Figure 2—figure supplement 1B),
                                     only Cldn5 expression was down-regulated in the C1, C6, and C9 ECs. Little or no changes were
                                     seen for the expression of other adherens and tight-junction components (Figure 2—figure supple-
                                     ment 1B). However, the tight-junction proteins Claudin-5, and Cingulin, as well as the adherens

Orsenigo, Conze, et al. eLife 2020;9:e61413. DOI: https://doi.org/10.7554/eLife.61413                                                       6 of 34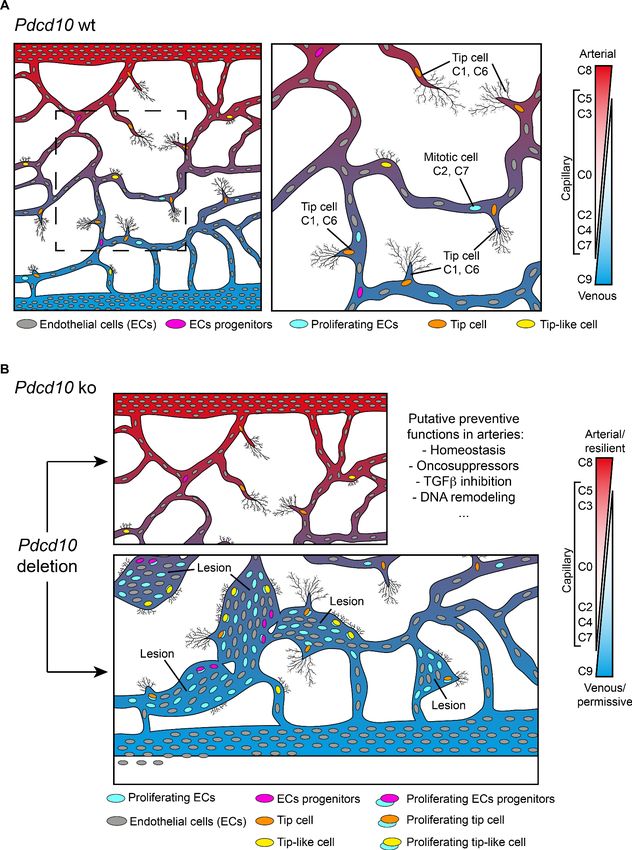
Research article                                                                            Cell Biology Genetics and Genomics

                                   junction VE-cadherin were not correctly localized at the cell-to-cell contacts in the ECs of the caver-
                                   nomas of the Pdcd10-ko mice (Figure 2—figure supplement 1C–E).
                                       In summary here, we have identified four endothelial subpopulations that are particularly affected
                                   by the deletion of the Pdcd10 gene: the venous/venous capillary C9, tip cell C1 and C6, and mitotic/
                                   venous capillary C7 EC clusters. Among these, under the Pdcd10-ko conditions here, the venous/
                                   venous capillary C9 ECs represent the strongest candidate to form the most advanced lesions, or
                                   the most progressed lesion areas. The venous nature of the ECs in the cavernomas was further con-
                                   firmed by expression of the venous marker COUP-TFII in vivo in the CCM lesions. Figure 2H shows
                                   the ECs in a large cavernoma that can be seen to be strongly positive for the venous marker COUP-
                                   TFII, which is encoded by Nr2f2.

                                   Arterial differentiation prevents ECs from forming CCM lesions
                                   Despite the successful deletion of the Pdcd10 gene (Figure 1—figure supplement 2D), gene
                                   expression of the arterial ECs (C8) in the Pdcd10-ko mice was almost unchanged from the effects of
                                   Pdcd10 deletion. Indeed, in the comparison of the Pdcd10-wt and Pdcd10-ko mice, these arterial
                                   ECs showed the following: the lowest total number of DEGs (Figure 2A); no increase in Klf4 and
                                   Klf2 expression (Figure 2B); no, or minimal, signs of increased expression of lesion markers
                                   (Figure 2C–E); and no, or minimal, decreases in BBB markers and BBB transporters (Figure 2G).
                                       Unique marker genes that are conserved between Pdcd10-wt and Pdcd10-ko cells specify the
                                   particularity of the transcriptome of each cluster (see Materials and methods). Therefore, to investi-
                                   gate the features of these arterial ECs that might promote their refractoriness to lesion formation,
                                   we identified the unique marker genes that were expressed in this C8 cluster (threshold: specificity
                                   average logFC >0.25; padj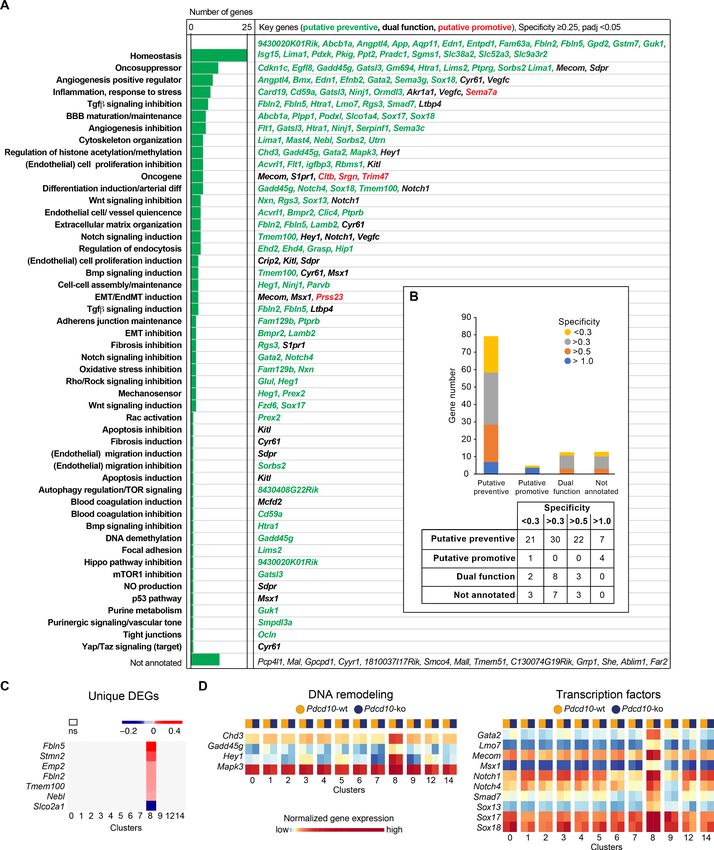
Research article                                                                                     Cell Biology Genetics and Genomics

Figure 3. Unique functional markers suggest arterial Pdcd10-ko ECs may be protected from forming cavernomas. (A) Annotation of C8 unique marker
genes. 111 unique marker genes were identified using a log fold change (specificity) cutoff of 0.25 and padj
Research article                                                                                        Cell Biology Genetics and Genomics

Figure 3 continued
entothelial cells’ or ‘gene name’ if the previous search gave zero results). Based on the functions of these genes and the deregulation of these functions
reported in Pdcd10-ko lesions, we tentatively categorized these unique marker genes into ‘preventive’ (green), ‘promotive’ (red) and ‘dual-function’
(black) (See details of annotation in Supplementary file 5 and 6). Here, 13 unique marker genes either lack clearly defined functionality or have non-EC
related functions and could not be annotated. (B) Statistics of annotated unique marker genes in C8. Each gene was counted only once, although it can
appear in more than one category in (A). (C) Heatmap of log fold changes of uniquely differentially expressed genes (unique DEGs) in C8. Unique
DEGs were identified using thresholds: average |logFC| > 0.2 and padj
Research article                                                                                        Cell Biology Genetics and Genomics

Figure 4. Pdcd10-ko cells of C9 express the same top mitotic phenotype as overt cavernomas. (A) Plot of fold-change in numbers of Pdcd10-ko versus
Pdcd10-wt cells in each cluster. (B) Plots of fold-change in the percentages (Pdcd10-ko vs. Pdcd10-wt) of cells positive for Mki67, Plk1, Mxd3, Birc5, and
Ube2c in each cluster (as indicated). Dashed lines in (A) and (B) show upper limit of 95% confidence interval (CI), calculated from the mean fold-changes
among the clusters. Red lines, clusters with fold-change >95% CI upper limit. (C) Heatmap of average logFC (padj
Research article                                                                                      Cell Biology Genetics and Genomics

Figure 4 continued
panels: Immunostained for PECAM-1 (pan-endothelial, blue), ERG (pan-endothelial nuclei, red) and Ki-67 (encoded by Mki67 transcript; mitotic nuclei,
green). Central panels: Immunostained for ERG (green) with outlines of the segmented nuclei (magenta). Lower panels: Results of the filtering
procedure showing EC-specific immunostaining of Ki-67 (ECs Ki-67, light blue) and PECAM-1 (red) (see Materials and methods). Arrows, mitotic ECs.
Scale bars: 100 mm. (E) Quantification of mitotic ECs in the cerebellum, as normal vessels in Pdcd10-wt, Pdcd10-ko pseudo-normal vessels, and Pdcd10-
ko lesions (mean ± SEM; *p
Research article                                                                                          Cell Biology Genetics and Genomics

Figure 5. Pdcd10-ko cells widely enhance the tip cell phenotype with greatest expression for cluster C9. However, such tip cell phenotype is
functionally defective. (A) Plots of the fold-changes in the proportions (Pdcd10-ko vs. Pdcd10-wt) of cells positive for Plaur, Apln, and Mmrn2 in each
cluster. Dashed line shows upper limit of 95% confidence interval (CI), calculated on the mean fold-change among the clusters. Red lines highlight
clusters with fold-changes > 95% CI upper limit. (B) Heatmap of average logFC (padj
Research article                                                                                           Cell Biology Genetics and Genomics

Figure 5 continued
tip-like cells at the migrating front in the Pdcd10-ko retina. Tip-like cells were present in the vein proximal to the optic nerve (Rear, black arrows)
exclusively for the Pdcd10-ko. Scale bars: main, 100 mm. magnifications, 50 mm. (G) Quantification of tip cells in the cerebellum (mean ± SEM; ns;
unpaired t-test). Pdcd10-wt, n = 6; Pdcd10-ko, n = 6. (H) Quantification of tip cells and tip-like cells at the retina front, for tip cell density (mean number/
100 mm; left), proportion of tip-like cells (%; middle), and number of filopodia/cell (mean ± SEM; right; *p
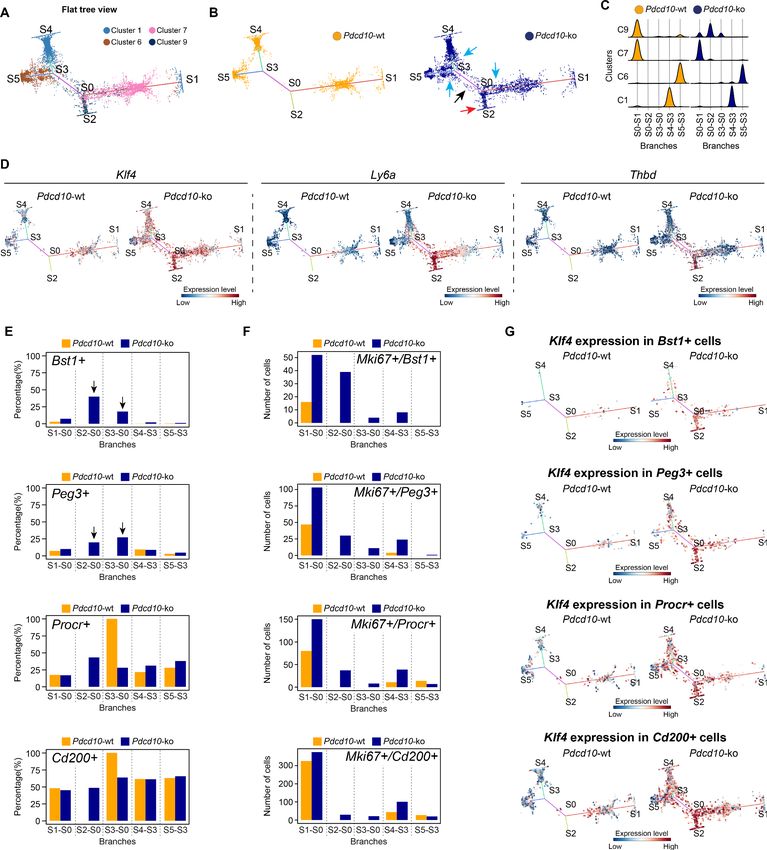
Research article                                                                                      Cell Biology Genetics and Genomics

Figure 6. STREAM trajectory analysis shows Pdcd10-ko venous cluster 9 concentrated in a distinctive branch with mitotic and abnormal tip cell
functions. (A) Flat tree view of the STREAM trajectory inferred for Pdcd10-wt and Pdcd10-ko cells of the most affected clusters (C1, C6, C7, C8), color
coded as indicated. Branching and end points are numbered sequentially (S0, S1, S2, S3, S4, S5) and each branch is named after the points connected
(S0–S1, S0–S2, S4–S3, S3–S0, S5–S3). For corresponding three-dimensional views of the STREAM trajectories see Figure 6—figure supplement 1A and
B. (B) Flat tree view of the trajectory as in (A) showing separately Pdcd10-wt (orange) and Pdcd10-ko (blue) cells. Red and black arrows, Pdcd10-ko
Figure 6 continued on next page

Orsenigo, Conze, et al. eLife 2020;9:e61413. DOI: https://doi.org/10.7554/eLife.61413                                                          14 of 34
Research article                                                                                         Cell Biology Genetics and Genomics

Figure 6 continued
specific branches (S0–S2, S3–S0, respectively). Light-blue arrows, Pdcd10-ko cells showing altered distributions within the other branches. (C)
Distributions of Pdcd10-wt (orange) and Pdcd10- ko (blue) cells according to cluster, for the five branches of the trajectory. Pdcd10-ko cells of Cluster 9
(top row, blue peaks) show the most heterogeneous distributions with the cells in branches S0–S1, S0–S2, and S3–S0. (D) Flat tree view showing
expression levels in Pdcd10-wt (left) and Pdcd10-ko (right) cells for three representative lesion markers: Klf4, Ly6a, and Thbd. (E) Plots showing the
percentage of cells positive for the progenitor cell markers Bst1, Peg3, Procr, and Cd200 (as indicated) for Pdcd10-wt (orange) and Pdcd10-ko (blue) in
each branch of the trajectories in (A) and (B). See Materials and Methods for definition of positive cells. (F) Plots showing numbers of cells double
positive for Mki67 and for indicated progenitor cell markers for Pdcd10-wt (orange) and Pdcd10-ko (blue) in each branch of the trajectories in (A) and
(B). See Materials and methods for definition of positive cells. (G) Flat tree view showing expression levels of Klf4 for Pdcd10-wt (left) and Pdcd10-ko
(right), for each of the progenitor cell subpopulations investigated. In (D and G) dots are color coded for expression levels, as blue, low; red, high.
The online version of this article includes the following figure supplement(s) for figure 6:
Figure supplement 1. STREAM trajectory analysis of C9 Pdcd10-ko cells from different branches for the expression of functions (GO) and tip, mitotic
and transcription factor genes.
Figure supplement 2. STREAM trajectory analysis of resident endothelial progenitor cells from different branches for the expression of the CCM-
related genes Id1 and Klf2.

                                         iii.The widespread distribution of the Pdcd10-ko cells (Figure 6B, blue) compared to the
                                             Pdcd10-wt cells (Figure 6B, orange) on each branch suggested that many Pdcd10-ko cells
                                             had not reached the end of their lineage differentiation; i.e. the Pdcd10-ko cells were either
                                             delayed in lineage differentiation or they were on-hold at different immature stages.
                                         iv. The expression of typical lesion markers Klf4, Ly6a, and Thbd (Maddaluno et al., 2013;
                                             Lopez-Ramirez et al., 2019) was higher for the Pdcd10-ko cells specific to the S0–S2 and
                                             S3–S0 branches, even if not exclusively limited to these branches (Figure 6D).
                                         v. Pdcd10-ko cells that belonged to C9 showed the highest heterogeneity, as these were dis-
                                             tributed along three different branches (i.e. S0–S2, S3–S0, S0–S1) (Figure 6C). To investigate
                                             the high heterogeneity of these Pdcd10-ko cells, multiple comparisons were performed, fol-
                                             lowed by Gene Ontology (GO) enrichment analysis of the DEGs (Figure 6—figure supple-
                                             ment 1C). Consistent with the data reported int Figures 2–5, the cells in S0–S2 showed
                                             strong down-regulation of BBB transporters and increased negative regulation of cell-cell
                                             adhesion, compared to those of S0–S1 (Figure 6—figure supplement 1C). Moreover, the
                                             Pdcd10-ko cells in S3–S0 were more involved in sprouting angiogenesis with enhanced mem-
                                             brane and actin dynamics, increased metabolic activity, and dysregulated responses to
                                             growth factor stimulation, compared to those of S0–S2 and S0–S1 (Figure 6—figure supple-
                                             ment 1C).
                                         vi. Finally, the Pdcd10-ko cells of C9 showed enhanced mitotic and aberrant tip cell characteris-
                                             tics compared to the Pdcd10-wt cells in the same cluster (Figures 4 and 5). This angiogenic
                                             character of mitotic and tip cells was also evident by comparisons of the gene expression lev-
                                             els of a selection of mitotic and tip cell markers for the Pdcd10-wt and Pdcd10-ko cells in the
                                             trajectory (Figure 6—figure supplement 1D).
                                         In summary here, the C9 Pdcd10-ko cells in the newly formed Pdcd10-ko specific branch of S0–S2
                                      highly expressed typical cavernoma markers, they were mainly mitotic, and they also had pathologi-
                                      cal tip cell traits. All in all, these can be envisaged as ECs of typical cavernoma lesions.
                                         A small proportion of the C9 Pdcd10-ko cells in S3–S0 was also apparently more tip cell special-
                                      ized. However, these cells failed to reach the states of the trajectories where fully specialized tip cells
                                      are located (i.e. S4–S3, S5–S3).

                                      Venous-resident Pdcd10-ko endothelial progenitor cells support the
                                      formation of cavernomas
                                      We then investigated the transcription factors that were differentially expressed by the C9 Pdcd10-
                                      ko cells for the different branches from the STREAM analysis. The Pdcd10-ko cells for S0–S2 versus
                                      S0–S1 showed increased expression of the transcriptional stimulator of progenitor cell proliferation
                                      and differentiation, Tcf15 (Davies et al., 2013; Figure 6—figure supplement 1E). As previously
                                      reported (Maddaluno et al., 2013), Id1 was up-regulated in Pdcd10-ko ECs of lesions, and it was
                                      consistently strongly increased in the S0–S2 branch (Figure 6—figure supplement 2A). Remarkably,
                                      Id1 inhibits Tcf15-mediated progenitor cell differentiation, but not Tcf15-mediated proliferation of
                                      progenitor cells (Davies et al., 2013).

Orsenigo, Conze, et al. eLife 2020;9:e61413. DOI: https://doi.org/10.7554/eLife.61413                                                              15 of 34
Research article Cell Biology Genetics and Genomics
Considering that our group recently reported that cavernomas have clonal origins from expansion
of Pdcd10-ko progenitor cells (Malinverno et al., 2019), we investigated the distribution of cells
that expressed progenitor cell markers in the STREAM-generated trajectories. We therefore quanti-
fied each branch for the proportions of cells positive for Bst1, Peg3, Procr, and Cd200 (i.e. reported
markers of resident endothelial progenitor cells Malinverno et al., 2017; Wakabayashi et al., 2018;
Yu et al., 2016). The proportions of Pdcd10-ko cells that were positive for Bst1 or Peg3 were highly,
and specifically, increased in the S0–S2 and S3–S0 branches (Figure 6E, arrows). In contrast, the pro-
portions of Pdcd10-wt and Pdcd10-ko cells positive for Procr and Cd200 were similar across all of
the branches of the trajectory (Figure 6E, lower panels). The only exception was the high proportion
of Procr-positive Pdcd10-wt cells in the S3–S0 branch, although this might be biased by the very low
number of Pdcd10-wt cells in this branch (i.e. only four cells).
We then asked whether the increased number of Pdcd10-ko progenitor cells might be sustained
by their increased proliferation. As shown in Figure 6F, co-expression of progenitor cell markers and
Mki67 in Pdcd10-wt cells was limited to the cells in the S0–S1 branch (orange bars), where mitotic
C7 cells were located (Figure 6A). Conversely, there were increased proportions of Mki67-positive
Pdcd10-ko progenitor cells in all of the branches, with the strongest increases seen for S0–S2
(Figure 6F, blue bars), compared to the Pdcd10-wt. Moreover, the expression levels of Bst1 were
specifically high in the Pdcd10-ko cells of the S0–S2 branch, while the expression of the other pro-
genitor cell markers in the Pdcd10-ko cells was high, but more similar across all of the branches of
the trajectory (Figure 6—figure supplement 2B). Interestingly, Id1 expression was high in Bst1-posi-
tive cells in the S0–S2 branch, which suggested that differentiation in these resident progenitor cells
can be inhibited (Figure 6—figure supplement 2C) as mentioned above and shown by
Davies et al., 2013.
These data indicate that Bst1-positive and Peg3-positive resident endothelial progenitor cells
were specifically concentrated in the branches that were most affected by Pdcd10 deletion. Interest-
ingly, the key driver genes of the CCM phenotype, Klf4 and Klf2, were highly expressed in Pdcd10-
ko progenitor cells of the S0–S2 branch that were also positive for Bst1, Peg3, Procr, and Cd200,
and also for these cells of the other branches (Figure 6G; Figure 6—figure supplement 2D, respec-
tively). This supports the concept that Klf4 and Klf2 are early response genes to Pdcd10 deletion in
these types of resident endothelial progenitor cells.
Colocalization of Bst1 and the cavernoma transcripts Klf2, Klf4, and Ly6a using Visium (Figure 7A,
B) showed concentration of Bst1 progenitor cell transcripts at the level of cavernomas and mulberry
lesions (Figure 7A). Similarly, we also confirmed the presence of Bst1-positive cells in the lesions
through in-situ hybridization in brain sections of the Pdcd10-wt and Pdcd10-ko
(Figure 7C; Malinverno et al., 2017).
In the analysis of the clusters identified in this scRNA-seq analysis, after Pdcd10 deletion the pro-
portions of Bst1-positive cells increased in all of the capillary-vein clusters (C2, C4, C7), with the
greatest expression in the venous/venous capillary C9 (Figure 7D; Bst1-positive cells, 39.9%), which
is in agreement with the data reported in Figure 6E. In contrast, the proportions of Bst1-positive
cells did not increase in only the arterial C8 and arterial capillary C3 and C5 Pdcd10-ko cells, in com-
parison with the respective Pdcd10-wt (Figure 7D). Therefore, Bst1 appears to be a preferential
physiological marker of vein-resident progenitor cells that is particularly increased in venous clusters
after Pdcd10 deletion, with no increase in arterial clusters (Figure 7D).
Although Peg3 appears to be a more general marker of resident endothelial progenitor cells in
Pdcd10-wt cells, it showed highest expression in venous C9 Pdcd10-ko cells (Peg3-positive cells vs.
wt, 24.0% vs. 9.3%). The venous-capillary C7 Pdcd10-ko cells showed the second highest increase
(Figure 7D). As for Bst1, the proportions of Peg3-positive cells did not increase in any of the artery
and arterial capillary clusters, which suggests that Pdcd10 deletion can induce endothelial prolifera-
tion at different maturation stages. These data are in agreement with the resistance to expression of
the Pdcd10 mutant phenotype of arterial ECs and with the high susceptibility of the venous ECs
described above.
The Procr-positive and Cd200-positive cells (Figure 7D) were ubiquitously expressed in the
Pdcd10-wt venous and arterial clusters, and did not significantly increase after Pdcd10 deletion at
the developmental stage examined (8dpn), in agreement with the trajectory data of Figure 6E.
Orsenigo, Conze, et al. eLife 2020;9:e61413. DOI: https://doi.org/10.7554/eLife.61413 16 of 34Research article Cell Biology Genetics and Genomics Figure 7. Venous-resident Pdcd10-ko endothelial progenitor cells support the formation of cavernomas. (A) Expression levels of Bst1 as measured according to Visium Spatial Transcriptomics. All of the sequenced dots are shown, color coded for expression, as blue, low; red, high. Negative spot outlines are shown without any fill color to allow the visualization of underlying H and E staining (dark and light violet). Both complete sections and magnified boxed areas are shown. Arrowheads, examples of positive spots. (B) Expression levels of representative lesion markers (as indicated) from Visium analysis. For each gene and for each sample, the same magnified areas are shown as in (A). Arrowheads, same spots as indicted in (A). (C) Representative in-situ hybridization for Bst1 (green) and Cldn5 (red) using the RNA-Scope assay for Pdcd10-wt and Pdcd10-ko mouse cerebellum at P8. Three magnifications are shown (increasing top to bottom). Top: DAPI staining (blue) is also shown. Bottom: Cldn5 and Bst1 shown separately (white). Yellow arrows points to colocalization of Cldn5 and Bst1 signals. Lesion lumens (L) are outlined by white dashed lines. Scale bars: 500 mm (left), 100 mm Figure 7 continued on next page Orsenigo, Conze, et al. eLife 2020;9:e61413. DOI: https://doi.org/10.7554/eLife.61413 17 of 34
Research article                                                                                         Cell Biology Genetics and Genomics

Figure 7 continued
(middle), 50 mm (right). (D) Plots of percentages (%) of cells positive for progenitor cell markers Bst1, Peg3, Procr, and Cd200 (as indicated) for Pdcd10-
wt (orange) and Pdcd10-ko (blue) cells of each cluster. See Materials and Methods for definition of positive cells.

                                      Discussion
                                      Through single-cell transcriptomic analysis, we have identified here some unique characteristics of
                                      ECs that form either normal vessels or cavernomas. Here, we have shown that brain ECs represent a
                                      heterogeneous population that is distributed across 13 different clusters on the basis of their gene
                                      expression. These cells express highly specialized functions that help to form the vasculature that is
                                      most appropriate for the needs of brain vascularization and for the development of the BBB
                                      (Figures 1I and 8A). Remarkably, resident progenitor cells were detected in all of the Pdcd10-wt
                                      clusters, although in different proportions. This indicates that resident progenitor cells are heteroge-
                                      neous and share several transcriptional features with the ECs of the vessels where they reside
                                      (Figure 8A). It can be speculated that this ‘mimicry’ behavior of endothelial-resident progenitors
                                      might be determined by the specificity of the different vascular microenvironments, and even that
                                      the ‘progenitor’ status might represent a transient and reversible response to microenvironmental
                                      signals, rather than a fate-committed, stable identity. In this study, we have further extended the
                                      concept of diversity through consideration of a pathological inherited condition (i.e. CCM) that is
                                      characterized by the development of cavernomas in the brain microcirculation. Although there is evi-
                                      dence that in CCM, deficient ECs of venous origin appear to be responsible for the formation of the
                                      lesions in the retina, an undisputed demonstration of their origin and of their functional characteris-
                                      tics was still missing (Abdelilah-Seyfried et al., 2020; Boulday et al., 2011).
                                          We report here that venous ECs are particularly sensitive to Pdcd10 deletion. Under Pdcd10-ko,
                                      these venous ECs undergo defective differentiation and angiogenic programs – with abnormal
                                      tip cell traits and increased mitosis – that gives rise to cavernous branching and mulberry lesions
                                      (Figure 8B). This confirms the venous nature of cavernomas at the molecular level, which has been
                                      described up to now anatomically. The venous compartment also responds to Pdcd10 deletion
                                      through increased numbers and expression of venous-resident Bst1-positive and Peg3-positive pro-
                                      genitor cells. These observations confirm our previous study (Malinverno et al., 2019), where we
                                      showed that the trigger in cavernoma formation is the recruitment of progenitor cells that attract
                                      mature ECs into the areas of the lesions. Interestingly, Goveia et al. recently described Bst1-positive
                                      cells as vein-resident endothelial stem cells that still have unexplored roles in lung tumor
                                      vascularization (Goveia et al., 2020).
                                          The role of specific progenitors can be different in different pathological contexts. For example,
                                      in injury repairing of the infra-renal aorta, Bst1 did not label highly proliferating cells with regenerat-
                                      ing ability (McDonald et al., 2018). On the contrary, during liver vascular damage, liver vascular
                                      homeostasis, and ischemic hindlimb muscle, Bst1-positive stem cells proliferate to reestablish new
                                      functional vessels (Wakabayashi et al., 2018). Although a comprehensive definition and comparison
                                      of the transcriptional and functional specificity of the progenitors that express Bst1, Peg3, Cd200,
                                      and Procr in different organs at different developmental stages and in different pathological situa-
                                      tions is of great interest, the details here remain very limited and deserve further investigation.
                                          The present study confirms and extends our earlier observations, to show that Pdcd10-ko cells
                                      appear to form malformations due to increased cell growth and defective sprouting of abnormal tip
                                      cells (Figures 4, 5 and 8). Another observation derived from the present study is that arterial ECs
                                      are resilient to Pdcd10 deletion. This striking result shows that brain arterial ECs maintain their
                                      genetic and functional phenotype also under Pdcd10 deletion. It is possible that the unique resis-
                                      tance of these cells is induced and maintained by up-regulation of a relatively large set of ‘putative
                                      defensive’ genes that could be modulated directly or indirectly by Pdcd10 (Figures 3 and 8). These
                                      data also allow us to conclude that the cells responsible for the formation of cavernomas are of
                                      venous and tip cell origin, while ECs of arterial origin are not responsive. Thus, the same mutation
                                      and inactivation of Pdcd10 can result in strongly different responses in ECs of venous and arterial ori-
                                      gin, and in the resident progenitor cells.
                                          Interestingly, the absolute level and the relative increases in Klf2 and Klf4 in the Pdcd10-ko do
                                      not directly correlate with the level of response to Pdcd10 deletion. Almost all of the clusters

Orsenigo, Conze, et al. eLife 2020;9:e61413. DOI: https://doi.org/10.7554/eLife.61413                                                               18 of 34
Research article Cell Biology Genetics and Genomics Figure 8. Model of brain cavernoma development based on the scRNA-seq analysis of Pdcd10-ko brain endothelial cells complemented with the findings obtained by immunofluorescence microscopy and spatial transcriptomics (Visium). Brain ECs (gray) are a heterogeneous population distributed in different clusters on the basis of their gene expression in both Pdcd10-wt (A) and Pdcd10-ko (B). Besides arterial, arterial capillary, venous, venous- capillary also tip cell and mitotic endothelial clusters could be detected at the developmental stage examined, P8 (orange and light blue , respectively). Besides, tip-like cells could be recognized morphologically (yellow). They are significantly increased in Pdcd10-ko, but their transcriptomic features remain to be studied. Resident endothelial cell progenitor cells (pink) were detected in all clusters, although in different proportions, which indicates that they are heterogeneous and share several transcriptional features with the ECs of the vessels where they reside. In (A) dashed square on the left is enlarged for the image on the right. (B) Although Pdcd10 deletion takes place comparably in arterial and venous ECs, only venous ECs can respond to Pdcd10 deletion. Pdcd10-ko venous cells follow defective differentiation and angiogenic programs, with abnormal tip cell traits and increased mitosis, giving rise to cavernous branching and mulberry lesions. Moreover, the venous compartment responds to Pdcd10 deletion with increased numbers and Figure 8 continued on next page Orsenigo, Conze, et al. eLife 2020;9:e61413. DOI: https://doi.org/10.7554/eLife.61413 19 of 34
Research article                                                                                         Cell Biology Genetics and Genomics

Figure 8 continued
expression levels of venous resident endothelial cell progenitors. Arterial ECs are instead resilient to Pdcd10 deletion. It appears that the resistance of
these cells is maintained by a relatively large set of putative defensive genes, some of which modulated by Pdcd10 deletion. In parallel, endothelial
progenitor cells within arterial cluster C8 neither increased in number nor were transcriptionally modified by Pdcd10 deletion.

                                      identified show up-regulation of both Klf2 and Klf4 in Pdcd10-ko cells, in comparison to the respec-
                                      tive Pdcd10-wt. However, while Pdcd10- ko cells in all of the clusters are modified, only a few clus-
                                      ters are particularly responsive to the mutation. This indicates that while Klf2 and Klf4 are necessary
                                      for expression of the mutant phenotype (Zhou et al., 2016; Cuttano et al., 2016), they are not suffi-
                                      cient. A specific transcriptional landscape appears necessary to allow the full transformation. This is
                                      particularly evident in the arterial cluster that express the highest levels of Klf2 and Klf4 but does not
                                      develop the Pdcd10 phenotype.
                                         Overall, this study adds several new aspects to the evolution of CCM and identifies the venous
                                      EC clusters and their related progenitor cells as the main cell types responsible for cavernoma devel-
                                      opment. This study thus opens new perspectives in our understanding of the development of cav-
                                      ernous malformations, and it should thus help in the development of novel and better-targeted
                                      therapeutics. Here we represents a public source for data exploration of the CCM and the physio-
                                      logical endothelium, as the data can be further explored in the online database https://edgroup.shi-
                                      nyapps.io/MapCcm3EC/.

                                      Materials and methods
Key resources table
Reagent type
(species) or                                                 Source or                                                                    Additional
resource                  Designation                        reference                         Identifiers                                information
Strains, strain           Cdh5(PAC)-Cre-ERT2,                Wang et al., 2010
backgrounds               C57BL/6 background
(mice)
Strains, strain           Cdh5(PAC)-Cre-                     Bravi et al., 2015
backgrounds               ERT2/Ccm3f/f,
(mice)                    C57BL/6 background
Strains, strain           Cldn5(BAC)-GFP                     Honkura et al., 2018
backgrounds               (Tg(Cldn5-GFP)Cbet/U),
(mice)                    C57BL/6 background
Strains, strain           Cdh5(PAC)-Cre-ERT2/                This paper
backgrounds               Ccm3f/f/
(mice)                    Cldn5(BAC)-GFP,
                          C57BL/6 background
Antibody                  Anti-CD93 (sheep                   R and D                           AF1696,                                    IF (1:500)
                          polyclonal)                                                          RRID:AB_354937
Antibody                  Anti-Erg (rabbit                   Abcam                             Ab92513, RRID:AB_2630401                   IF (1:400)
                          monoclonal)
Antibody                  Anti-Ki67 (rat                     Invitrogen                        14-5698-82, RRID:AB_10854564               IF (1:200)
                          monoclonal)
Antibody                  Anti-Podocalyxin                   R and D                           AF1556,                                    IF (1:400)
                          (goat polyclonal)                                                    RRID:AB_354858
Antibody                  Anti-CoupTFII                      LSBio                             LS-C356225                                 IF (1:200)
                          (rabbit polyclonal)
Antibody                  Anti-PECAM-1                       BD                                55369,                                     IF (1:200)
                          (rat monoclonal)                                                     RRID:AB_394815
Antibody                  Anti-PECAM-1                       Millipore                         MAB1398z, RRID:AB_94207                    IF (1:500)
                          (armenian hamster
                          monoclonal)
Continued on next page

Orsenigo, Conze, et al. eLife 2020;9:e61413. DOI: https://doi.org/10.7554/eLife.61413                                                                  20 of 34
Research article Cell Biology Genetics and Genomics
Continued
Reagent type
(species) or Source or Additional
resource Designation reference Identifiers information
Antibody Anti-Claudin-5 Invitrogen 352588, IF (1:200)
(mouse monoclonal, RRID:AB_2532189
Alexa fluor 488-
conjugated)
Antibody Anti-VE-cadherin BD 550548, IF (1:200)
(rat monoclonal) RRID:AB_2244723
Antibody Anti-Cingulin Invitrogen 36–4401 IF (1:500)
(rabbit polyclonal)
Antibody Alexa Fluor 488, Jackson laboratories IF (1:400)
555 and 647 donkey
secondary antibodies
Antibody Alexa Fluor 488 Jackson laboratories IF (1:400)
conjugated
donkey
anti-mouse
Antibody Anti-uPAR antibody Tjwa et al., 2009 IF (1:200)
Commercial 3-Plex positive ACD #320881 for detecting
assays or kits controls Polr2a, PPIB,
UBC mRNA
Commercial 3-Plex ACD #320871 for detecting
assays or kits negative DapB mRNA of
controls Bacillus subtilis
Commercial Multiplex ACD 323100
assays or kits fluorescent
Reagent Kit v2
Commercial Cldn5 ACD 491611-C2
assays or kits
Commercial Bst1 ACD 559841-C3
assays or kits
Commercial CD45 Miltenyi Biotech 130-052-301
assays or kits MicroBeads
Commercial CD31 MicroBeads Miltenyi Biotech 130-097-418, RRID:AB_2814657
assays or kits
Commercial Adult Brain Miltenyi Biotech 130-107-677
assays or kits Dissociation
kits
Commercial Single Cell 3’ 10 genomics PN-120237
assays or kits Reagent
kits v2
Instruments GentleMACS Miltenyi Biotech 130-095-937
Octo Dissociator
Instruments Chromium 10 genomics NA
controller
Instruments NovaSeq Illumina RRID:SCR_016387
6000 system
Instruments Vibratome Leica VT1200s, RRID:SCR_018453
Instruments Sp8 confocal Leica
microscope
Instruments Cryostat Thermo Scientific CryoStar NX50
Instruments High Sensitivity Agilent
RNA ScreenTape
Others Visium Spatial 10 genomics PN-2000233
Gene Expression
slides
Continued on next page
Orsenigo, Conze, et al. eLife 2020;9:e61413. DOI: https://doi.org/10.7554/eLife.61413 21 of 34Research article Cell Biology Genetics and Genomics
Continued
Reagent type
(species) or Source or Additional
resource Designation reference Identifiers information
Others Visium Tissue 10 genomics PN-1000193
Optimization
Slides and
reagents
Software, Fiji open source, RRID:SCR_002285
algorithms http://fiji.sc/
Software, Cell Ranger 10 genomics v2.1.0,
algorithms RRID:SCR_017344
Software, R package Butler et al., 2018; v3.1,
algorithms Seurat Stuart et al., 2019 RRID:SCR_016341
Software, R package Zappia and v0.4.2,
algorithms clustree Oshlack, 2018 RRID:SCR_016293
Software, R package Chen et al., 2013; v2.1, https://amp.
algorithms EnrichR Kuleshov RRID:SCR_001575 pharm.mssm.
et al., 2016 edu/Enrichr/
Software, GSEA Liberzon v2.2.3, https://www.
algorithms et al., 2015; RRID:SCR_003199 gsea-msigdb.org/
Subramanian gsea/msigdb/
et al., 2005 annotate.jsp
Software, STREAM Chen et al., 2019 v0.4.1
algorithms
Software, Space Ranger 10 genomics v1.0.0
algorithms
Software, Loupe cell 10 genomics v4.0,
algorithms browser RRID:SCR_018555
Study design
The research objective was to define and characterize the endothelial subpopulation(s) that form
lesions in CCM using single-cell RNA sequencing (scRNA-seq) technology. As previously
described (Bravi et al., 2015; Malinverno et al., 2019) we have extensive experience with the P8
neonatal CCM mouse model, upon which the sample sizes were estimated here. ScRNA-seq was
performed on littermates, with two mice per conditions. A total of 32,261 cells were sequenced with
good quality reads. Visium spatial transcriptomics was performed on littermates, with two mice per
condition, one section per mouse. uPAR staining and Bst1 RNA-scope were performed on litter-
mates, with three mice per condition. All of the other experiments were performed twice with differ-
ent litters and for n 6 (see details in Figure legends). No data inclusion or exclusion criteria were
predefined or applied. No outliers were defined or excluded. Given the early time points before
weaning and sexual maturity, no attempt was made to distinguish or segregate the data based on
gender. Injection of tamoxifen was performed 1 day after birth without knowledge of the
genotypes.
Statistical analysis
Unless differently specified, statistical analysis was performed as follow using GraphPad Prism 8. The
data were tested for normality using Shapiro-Wilk tests. The data showing normal distributions were
analyzed using unpaired t-tests or one-way analysis of variance (ANOVA) followed by post-hoc analy-
sis (Tukey’s or Sidak’s multiple comparisons tests), as specified in the relevant Figure legends. Non-
parametric data were analyzed using Mann-Whitney tests. For each experiment, the number of
samples is indicated in the relevant Figure legends or in the corresponding Material and Methods
section. More detailed information can be found in Supplementary file 9.
Murine models
The following mouse strains were used for immunofluorescence analysis: Cdh5(PAC)-Cre-ERT2/
Ccm3f/f mice in which Ccm3f/f mice with exons 4–5 of the Pdcd10 (Ccm3) gene flanked by loxP sites
Orsenigo, Conze, et al. eLife 2020;9:e61413. DOI: https://doi.org/10.7554/eLife.61413 22 of 34Research article Cell Biology Genetics and Genomics
(Taconic Artemis GmbH) were bred with Cdh5(PAC)-Cre-ERT2 mice to obtain endothelial-specific
and tamoxifen-inducible loss of function of the Pdcd10 (Ccm3) gene, as previously
described (Bravi et al., 2015). The Cdh5(PAC)-Cre-ERT2 mouse line was kindly provided by R.H.
Adams (Department of Tissue Morphogenesis, Faculty of Medicine, Max Planck Institute for Molecu-
lar Biomedicine University of Münster, Münster, Germany) (Wang et al., 2010). The genotype of the
Pdcd10 (Ccm3) ko mice was Ccm3f/f; Cdh5(PAC)-Cre-ERT2+. Pdcd10 (Ccm3) wt mice were Ccm3f/f;
Cdh5(PAC)-Cre-ERT2-.
The following mouse strains were used for scRNA-seq and Visium spatial transcriptomics: Cdh5
(PAC)-Cre-ERT2/Ccm3f/f/Cldn5(BAC)-GFP mice were generated by crossing Cdh5(PAC)-Cre-ERT2/
Ccm3f/f mice with the Cldn5(BAC)-GFP (Tg(Cldn5-GFP)Cbet/U) reporter mice (kindly provided by C.
Betsholtz; Department of Immunology, Genetics and Pathology, Rudbeck Laboratory, Uppsala Uni-
versity, Uppsala, Sweden) to obtain endothelial-specific expression of GFP (Honkura et al., 2018).
The genotype of the Pdcd10 (Ccm3) ko mice was Ccm3f/f; Cdh5(PAC)-Cre-ERT2+; Cldn5(BAC)-GFP
+. Pdcd10 (Ccm3) wt mice were Ccm3f/f; Cdh5(PAC)-Cre-ERT2-; Cldn5(BAC)-GFP+.
The mice were all bred on and back-crossed into the C57BL/6 background.
Tamoxifen treatment
Tamoxifen was dissolved in 10% ethanol-sunflower oil (10 mg/mL) and administered to the mice to
induce Cre activity and genetic modifications. In all of the experiments, mouse pups received a sin-
gle intragastric injection of 100 mg tamoxifen at P1(23, 34), and the tissues were harvested at P8.
Two mice of the Pdcd10-wt and two mice of the Pdcd10-ko from the same litter were used for the
single cell datasets. No statistical method was used to predetermine sample size.
The experimental animal protocols were approved by the Uppsala Ethical Committee on Animal
Research (permit number C145/15) and the Italian Ministry of Health. Animal procedures were per-
formed in accordance with the Institutional Animal Care and Use Committee (IACUC) and in compli-
ance with the guidelines established in the Principles of Laboratory Animal Care (directive 86/609/
EEC).
Brain endothelial single-cell isolation
The brains of Pdcd10-ko and Pdcd10-wt mice were collected and the olfactory bulbs were removed.
The brain single cell isolation was performed following the manufacturer’s instructions for Adult
Brain Dissociation kits (Miltenyi Biotech, 130-107-677). In brief, the brain tissues were first mechani-
cally and enzymatically dissociated using gentleMACS Octo Dissociator (Miltenyi Biotech), then mye-
lin, cell debris, and erythrocytes were removed. ECs were enriched by depletion of CD45-positive
cells using CD45 MicroBeads (Miltenyi Biotech, #130-052-301) and selection of CD31-positive cells
using CD31 MicroBeads (Miltenyi Biotech, #130-097-418). Then, the collected brain endothelial sin-
gle cells were processed for scRNA-seq.
Single-cell library preparation, sequencing and data pre-processing
The scRNA-seq libraries were prepared using the 10 Genomics Chromium system (10 Genomics),
following the manufacturer instructions for the Single Cell 3’ Reagent kits v2 (10 Genomics, #PN-
120237). A total of 10,000 cells were targeted for capture from each mouse sample. Subsequently,
the libraries were pooled and sequenced on a NovaSeq 6000 system (Illumina) with an aimed depth
of 50,000 reads per cell. The raw data were processed using the analysis pipeline Cell Ranger
(10 Genomics, 2.1.0 version) for sample demultiplexing, barcode processing, reads alignment to
mouse reference genome (mm10) and single-cell 30 gene counting.
Single-cell RNA-seq data analysis
Integrated analysis
The R package Seurat (v.3.1) (Butler et al., 2018; Stuart et al., 2019) was used to further analyze
the pre-processed data from the Cell Ranger pipeline. The quality controls were performed after first
merging the data by sample genotype. Cells with detected genes outside of 2 standard deviations
(±2 SD) of all of the detected genes were filtered out, and cells with >5% mitochondrial counts were
filtered out. The gene expression data of Pdcd10-wt and Pdcd10-ko were first log normalized to a
scale factor of 10,000 and then regressed on the total number of molecules detected per cell (nUMI)
Orsenigo, Conze, et al. eLife 2020;9:e61413. DOI: https://doi.org/10.7554/eLife.61413 23 of 34You can also read