Disparities in particulate matter (PM10) origins and oxidative potential at a city scale (Grenoble, France) - Part 2: Sources of PM10 oxidative ...
←
→
Page content transcription
If your browser does not render page correctly, please read the page content below
Atmos. Chem. Phys., 21, 9719–9739, 2021
https://doi.org/10.5194/acp-21-9719-2021
© Author(s) 2021. This work is distributed under
the Creative Commons Attribution 4.0 License.

Disparities in particulate matter (PM10) origins and oxidative
potential at a city scale (Grenoble, France) – Part 2: Sources
of PM10 oxidative potential using multiple linear regression
analysis and the predictive applicability of multilayer
perceptron neural network analysis
Lucille Joanna S. Borlaza1 , Samuël Weber1 , Jean-Luc Jaffrezo1 , Stephan Houdier1 , Rémy Slama2 , Camille Rieux3 ,
Alexandre Albinet4 , Steve Micallef3 , Cécile Trébluchon3 , and Gaëlle Uzu1
1 University
           of Grenoble Alpes, CNRS, IRD, INP-G, IGE (UMR 5001), 38000 Grenoble, France
2 University
           of Grenoble Alpes, Inserm, CNRS, IAB (Institute of Advanced Biosciences), Team of Environmental
Epidemiology applied to Reproduction and Respiratory Health, Grenoble, France
3 Atmo AuRA, 38400 Grenoble, France
4 INERIS, Parc Technologique Alata, BP 2, 60550 Verneuil-en-Halatte, France

Correspondence: Lucille Joanna S. Borlaza (lucille-joanna.borlaza@univ-grenoble-alpes.fr)
and Gaëlle Uzu (gaelle.uzu@ird.fr)

Received: 20 January 2021 – Discussion started: 10 February 2021
Revised: 27 May 2021 – Accepted: 27 May 2021 – Published: 29 June 2021

Abstract. The oxidative potential (OP) of particulate mat-          as well. This study presents the spatiotemporal variabilities
ter (PM) measures PM capability to potentially cause anti-          of OP activity with influences by season-specific sources,
oxidant imbalance. Due to the wide range and complex mix-           site typology and specific local features, and assay sensitiv-
ture of species in particulates, little is known about the pollu-   ity. Overall, both MLR and MLP effectively captured the
tion sources most strongly contributing to OP. A 1-year sam-        evolution of OP. The primary traffic and biomass burning
pling of PM10 (particles with an aerodynamic diameter be-           sources were the strongest drivers of OP in the Grenoble
low 10) was performed over different sites in a medium-sized        basin. There is also a clear redistribution of source-specific
city (Grenoble, France). An enhanced fine-scale apportion-          impacts when using OP instead of mass concentration, un-
ment of PM10 sources, based on the chemical composition,            derlining the importance of PM redox activity for the iden-
was performed using the positive matrix factorization (PMF)         tification of potential sources of PM toxicity. Finally, the
method and reported in a companion paper (Borlaza et al.,           MLP generally offered improvements in OP prediction, espe-
2020). OP was assessed as the ability of PM10 to generate           cially for sites where synergistic and/or antagonistic effects
reactive oxygen species (ROS) using three different acellu-         between sources are prominent, supporting the value of using
lar assays: dithiothreitol (DTT), ascorbic acid (AA), and 2,7-      ANN-based models to account for the non-linear dynamics
dichlorofluorescein (DCFH) assays. Using multiple linear re-        behind the atmospheric processes affecting OP of PM10 .
gression (MLR), the OP contributions of the sources identi-
fied by PMF were estimated. Conversely, since atmospheric
processes are usually non-linear in nature, artificial neural
                                                                    1   Introduction
network (ANN) techniques, which employ non-linear mod-
els, could further improve estimates. Hence, the multilayer         One of the most critical pollutants in the atmosphere is par-
perceptron analysis (MLP), an ANN-based model, was addi-            ticulate matter (PM), especially in urban areas that are heav-
tionally used to model OP based on PMF-resolved sources             ily impacted by anthropogenic emissions (David et al., 2019;

Published by Copernicus Publications on behalf of the European Geosciences Union.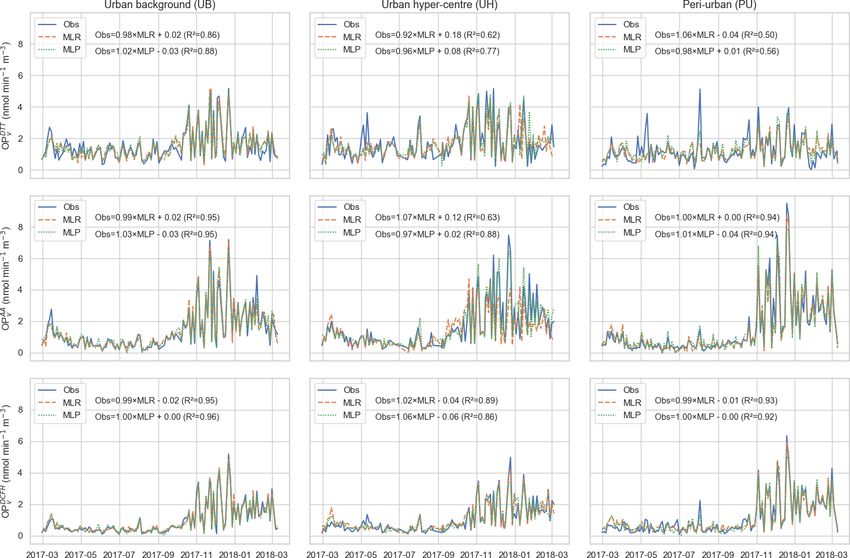
9720                                        L. J. S. Borlaza et al.: Disparities in PM10 origins and OP at a city scale (Part 2)

Qiao et al., 2018; Schwela, 2000). Recent studies showed in-         their estimated contributions. However, a non-linear relation-
creasing interest in PM at a city level, allowing assessment of      ship of redox-active components of PM is generally observed
fine-scale pollution variability (Boppana et al., 2019; Dioni-       (Arangio et al., 2016; Calas et al., 2017; Charrier and Anasta-
sio et al., 2010; Etyemezian et al., 2005; Krasnov et al., 2016;     sio, 2015; Li et al., 2012; Xiong et al., 2017; Yu et al., 2018),
Padhi and Padhy, 2008). The intricate topography and sea-            and hence traditional deterministic models could be, in some
sonality of particulate air pollution in the city of Grenoble        way, limited.
(France) make it an ideal location to explore variabilities of          Approaches using artificial neural network (ANN) analy-
PM pollution while also accounting for different site typolo-        sis have demonstrated enhanced results compared to classical
gies within a single medium-sized city (Calas et al., 2019;          models when predicting PM from different variables such as
Favez et al., 2010; Srivastava et al., 2018; Tomaz et al.,           meteorological data (Abderrahim et al., 2016; Chaloulakou
2016, 2017; Weber et al., 2019). Such small-scale variabil-          et al., 2003; Díaz-Robles et al., 2008; Hooyberghs et al.,
ities for mass and chemical composition have been recently           2005; Huang and Kuo, 2018; McKendry, 2002; Papanasta-
addressed in a companion paper (Borlaza et al., 2021).               siou et al., 2007; Perez and Reyes, 2006), satellite-derived
   Many research studies have focused on the links be-               aerosol products (Gupta and Christopher, 2009), and other
tween PM mass exposure and various adverse health effects            traffic-related variables (Cabaneros et al., 2020, 2017; Gietl
(Dabass et al., 2018; Delfino et al., 2005; Du et al., 2016;         and Klemm, 2009; He et al., 2015). The ANN-based models,
Hime et al., 2018; Lao et al., 2019; Matus C. and Oyarzún            such as multilayer perceptron (MLP), support pattern recog-
G., 2019; Pope et al., 2009; Pope, 2002; Winterbottom et al.,        nition and could extract trends from non-linear data, making
2018). However, it is also of high concern to improve the            it an interesting and competitive innovative method of analy-
understanding of the PM sources in relation to such health           sis in many scientific disciplines, including air quality studies
impacts. Indeed, oxidative stress is now well recognized as          (Cabaneros et al., 2019; Chattopadhyay and Bandyopadhyay,
one of the main biological mechanisms considered to be               2007; Dorling et al., 2003; García Nieto et al., 2018; Gupta
contributing to these detrimental impacts from air pollution         and Christopher, 2009; Jiang et al., 2004; Ordieres et al.,
exposure through the capability of PM to generate reactive           2005; Perez and Reyes, 2006). Since atmospheric processes
oxygen species (ROS) within the lung, which leads to pro-            are generally non-linear in nature, exploring the features of
inflammatory responses that can ultimately result in apopto-         MLP could provide meaningful results closer to realistic es-
sis (Ayres et al., 2008; Baulig et al., 2003; Dhalla et al., 2000;   timates than most linear models (Elangasinghe et al., 2014;
Donaldson et al., 2001; Jin et al., 2018; Kelly, 2003; Leni et       Eldakhly et al., 2017; Gerken et al., 2006; Kukkonen, 2003;
al., 2020; Mudway et al., 2020; Nel, 2005; Piao et al., 2018).       Nathan et al., 2017; Rahimi, 2017).
The oxidative potential (OP) of PM, defined as the capabil-             This study takes advantage of the enhanced source appor-
ity of PM to generate ROS/deplete anti-oxidants, makes an            tionment obtained in the companion paper (Borlaza et al.,
interesting complement to regulated metrics of ambient PM            2021), revealing the fine-scale spatiotemporal characteris-
exposure (Bates et al., 2019; Daellenbach et al., 2020; Guo et       tics of PM sources within a medium-size city area (Greno-
al., 2020; Gurgueira et al., 2002; Park et al., 2018; Shiraiwa       ble basin), specifically in three different urban environments
et al., 2017; Valavanidis et al., 2008).                             (background, hyper-centre, and peri-urban typologies). Here,
   Most studies often correlate OP from PM with chemical             the main drivers of OP are first attributed to PM sources (re-
species in ambient aerosols (Bell and HEI Health Review              solved by PMF) using a classical MLR analysis. Second, the
Committee, 2012; Boogaard et al., 2012; Borlaza et al., 2018;        possible advantages of MLP analysis are also evaluated to
Cassee et al., 2013; Janssen et al., 2014; Perrone et al., 2016;     compare MLP prediction of OP activity with MLR predic-
Pietrogrande et al., 2018; Rohr and Wyzga, 2012; Yang et al.,        tion. In summary, by taking the opportunity of this unique
2015). However, due to the wide range and complex mix-               database on PM chemistry and OP, we aim to investigate
ture of PM and the dynamic atmospheric processes to con-             mainly two innovative questions.
sider, the main drivers of OP can be difficult to highlight
(Calas et al., 2019). Several methods have been used to as-            1. Is there variability in the OP activity within a medium-
sign the sources of OP, including the application of recep-               sized urban area, and can this be related to the variability
tor modelling techniques such as positive matrix factoriza-               of the contributions of the emission sources?
tion (PMF) and chemical mass balance (CMB) (Ayres et al.,              2. Can MLP be used to accurately model the spatiotem-
2008; Bates et al., 2015; Cesari et al., 2019; Fang et al., 2016;         poral evolution of OP by taking the PM source contri-
Paraskevopoulou et al., 2019; Verma et al., 2014; Weber et                butions as input variables and, if so, does it catch the
al., 2018, 2021; Yu et al., 2019; Zhou et al., 2019), princi-             non-linear pattern of OP?
pal component analysis (PCA) (Borlaza et al., 2018; Conte
et al., 2017), and robotic chemical mass balance (RCMB)
coupled with multiple linear regression (MLR) analysis (Ar-
gyropoulos et al., 2016). With these current techniques, the
OP of PM has been linked to specific emission sources and

Atmos. Chem. Phys., 21, 9719–9739, 2021                                                https://doi.org/10.5194/acp-21-9719-2021
L. J. S. Borlaza et al.: Disparities in PM10 origins and OP at a city scale (Part 2) 9721
2 Materials and methods mannosan) and primary saccharides (arabitol and mannitol,
hereafter summed up and referred to as polyols), cellulose,
2.1 Site description and PM10 sampling collection and elements (Al, As, Ba, Cd, Cr, Cu, Fe, Mn, Mo, Ni, Pb,
Rb, Sb, Se, Sn, Ti, V, Zn). Detailed descriptions of the chem-
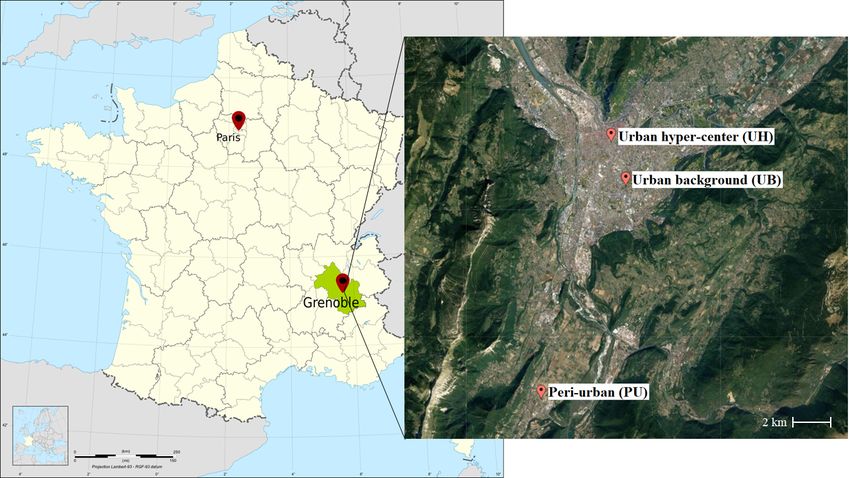
The sampling sites and samples used in this study are de- ical analyses are available in the companion paper (Borlaza
scribed in detail in the companion paper (Borlaza et al., et al., 2021), and a summary of PM10 characteristics is avail-
2021). Briefly, the sampling sites are located in the city of able in Table S1 in the Supplement.
Grenoble in the south-east of France, as illustrated in Fig. 1.
The mountainous environment in the area restricts atmo- 2.3 OP analysis
spheric movements and promotes the development of atmo-
spheric thermal inversions, resulting in an increase in pol- For OP analysis, the filters were subjected to PM10 extrac-
lutant concentrations, especially during the winter season tion using a simulated lung fluid (SLF) solution composed of
(Bessagnet et al., 2020; Tomaz et al., 2017). The three mea- a Gamble+DPPC (dipalmitoylphosphatidylcholine) mixture
surement sites are located in an urban background (UB, Les (Calas et al., 2018). In order to maintain a constant amount of
Frênes), urban hyper-centre (UH, Caserne de Bonne), and extracted PM10 , filter punches were adjusted by area to ob-
peri-urban (PU, Vif), all within 15 km from the city cen- tain iso-mass at 25 µg mL−1 . No filtration was done in order
tre of Grenoble. The UB site is an established urban back- to include both water-soluble and insoluble particles. Such an
ground reference site for the regional air quality monitor- extraction method has been adopted to facilitate the extrac-
ing network (Atmo Auvergne Rhône-Alpes) in the south of tion of PM10 in conditions closer to lung physiology (Calas
the city and largely investigated previously (Srivastava et al., et al., 2017). To avoid the interferences in the wells by insol-
2018; Tomaz et al., 2016). The PU site is in a suburban area uble particles, we subtracted the intrinsic absorbance of all
with rural residential areas adjacent to an urbanization (low- PM extractions before adding the reactants. This procedure
density area), where biogenic emissions are prominently ex- has been tested on both soluble and insoluble compounds
pected as the site is at the foot of the Vercors and Belledone that are likely within the range of atmospheric concentra-
mountain ranges. Lastly, the UH site is in the hyper-centre tions. The results have confirmed good dispersion of parti-
of Grenoble and, despite being in a pedestrian area, is the cles, leading to homogeneous results. A more detailed report
most highly exposed to surrounding commercial and traffic is available in Calas et al. (2018).
emissions amongst the three sites. For positive control tests, the 1,4-naphthoquinone (1,4-
The daily (24 h) filter-based PM10 (particles ≤ 10 µm in di- NQ) was used for both DTT and AA assays. Particularly, a
ameter) sampling was performed with a 3 d interval for about 40 µL of 24.7 µM stock solution was used for DTT assay and
1 year (28 February 2017 to 10 March 2018; sampling starts 80 µL of 24.7 µM 1,4-NQ solution for AA assay (Calas et
at 00:00 CEST) obtaining a total of about 130 samples per al., 2017, 2018). A 100 nM H2 O2 was used for DCFH assay.
site. PM10 was collected using a high-volume sampler (Dig- The measurement quality was estimated by calculating the
itel DA-80, 30 m3 h−1 ) onto 150 mm diameter quartz fibre coefficient of variation (CV) of the positive controls; all CVs
filters (Tissu-quartz PALL QAT-UP 2500 diameter 150 mm) were < 3 % for the three assays. Additionally, an ambient
following the recommendations of EN 12341:2014 proce- filter collected from the lab roof, with a known and constant
dures (CEN, 2014). All filters underwent a preheating treat- expected OP value, was analysed to ensure precision of OP
ment at 500 ◦ C for 12 h to avoid any organic contamination. measurements.
Additionally, field blank filters (n = 20) were collected to de- The OP activity can be represented using two different
termine the detection limits of the applied chemical analysis measures: (1) the mass-normalized OP activity (OPm ), where
and to secure quality of samples during transport, setup, and OP is normalized by the mass of PM10 (µg), and (2) the
recovery. The total PM10 mass concentration was also simul- volume-normalized OP activity (OPv ), where OP is normal-
taneously measured using a tapered element oscillating mi- ized by the sampled air volume (m3 ). The OPm is the in-
crobalance equipped with filter dynamics measurement sys- trinsic OP property of 1 µg of PM, while OPv represents the
tems (TEOM-FDMS) (CEN, 2017; Grover, 2005). PM-derived OP per m3 of air. Three acellular complemen-
tary assays were used to perform OP measurements and are
2.2 Chemical characterization briefly described in the following sections. All samples were
subjected to triplicate analysis, and each sample results in the
All samples were subjected to several chemical analyses to mean of such a triplicate. The common CV is between 0 %
quantify major and minor constituents of PM10 , including and 10 % for each assay.
organic carbon (OC), elemental carbon (EC), ions (sodium,
Na+ ; ammonium, NH+ +
4 ; potassium, K , magnesium, Mg ;
2+
2.3.1 Dithiothreitol (DTT) assay
2+ − − 2−
calcium, Ca ; chloride, Cl ; nitrate, NO3 ; sulfate, SO4 ),
methane sulfonic acid (MSA), organic acids (3-MBTCA, DTT is considered a chemical surrogate to cellular re-
pinic acid, phthalic acid), anhydro-sugars (levoglucosan and ducing agents, nicotinamide adenine dinucleotide (NADH)
https://doi.org/10.5194/acp-21-9719-2021 Atmos. Chem. Phys., 21, 9719–9739, 20219722 L. J. S. Borlaza et al.: Disparities in PM10 origins and OP at a city scale (Part 2)
Figure 1. Study area in Grenoble (France) on a European map (left) and location of the three urban sites (right), namely Les Frênes or UB
(urban reference background site), Caserne de Bonne or UH (urban hyper-centre site), and Vif or PU (peri-urban site). © OpenStreetMap
contributors 2020. Distributed under the Open Data Commons Open Database License (ODbL) v1.0.
and nicotinamide adenine dinucleotide phosphate oxidase Infinite M200 Pro) at 4 min intervals for a total of 30 min of
(NADPH) to mimic in vivo interactions of PM and biological analysis time.
oxidants. The consumption of DTT in the assay is inferred as
a measure of the ability of the PM to transfer electrons from 2.3.3 Dichloro-dihydro-fluorescein diacetate (DCFH)
DTT to oxygen, thereby producing reactive oxygen species assay
(ROS). Our procedure is based on a modified protocol by
Cho et al. (2005), as described in Calas et al. (2018). The The 2,7-dichlorofluorescin (DCFH) assay is commonly used
PM10 extracts were reacted with DTT, resulting in the con- for detecting intracellular H2 O2 and oxidative stress using
sumption of DTT in the solution. The remaining DTT is then a non-fluorescent probe through the formation of a fluores-
titrated with 5,5-dithiobis-(2-nitrobenzoic acid) (DTNB) to cent product (dichlorofluorescein or DCF) in the presence of
produce a yellow chromophore (5-mercapto-2-nitrobenzoic ROS and horseradish peroxidase (HRP). The DCF is mea-
acid or TNB), which is in direct proportion to the amount of sured by fluorescence at the excitation and emission wave-
reduced DTT remaining in solution after the reaction with lengths of 485 and 530 nm, respectively, every 2 min for a
the PM10 extract. These mixtures were injected in a 96-well total of 30 min of analysis time. The ROS concentration in
plate (CELLSTAR, Greiner-Bio), and the consumption of the sample is calculated in terms of H2 O2 equivalent based
DTT (nmol min−1 ) was determined by following the TNB on a H2 O2 calibration (100, 200, 300, 400, 500, 1000, and
absorbance at 412 nm wavelength using a microplate reader 2000 nmol).
(TECAN spectrophotometer Infinite M200 Pro) at 10 min in-
tervals for a total of 30 min of analysis time. 2.4 Data analysis
2.4.1 Synthesis of the methodology used for PM10
2.3.2 Ascorbic acid (AA) assay source apportionment
The AA assay is based on a modified procedure by Kelly and The source apportionment performed on this dataset has been
Mudway (2003), as described in Calas et al. (2018), using a described in detail in the companion paper (Borlaza et al.,
respiratory tract lining fluid (RTFL). This assay uses AA, a 2021). In brief, the PMF methodology used the EPA PMF5.0
known antioxidant which prevents the oxidation of lipids and software (US EPA, Norris et al., 2014) and closely follows
proteins in the lung lining fluid (Valko et al., 2005). The con- the parameterization used in previous works by our group
sumption of AA (nmol min−1 ) in the assay is inferred as the (Favez et al., 2017; Waked et al., 2014; Weber et al., 2019,
OP of PM10 quantified by the transfer of electrons from AA 2021) with a few relevant modifications.
to oxygen (O2 ). Similar to the DTT assay, the PM10 extracts The input variables used were mass concentration and un-
were reacted with AA into a 96-well plate UV-transparent certainty levels of PM10 and its chemical composition (a to-
(CELLSTAR, Greiner-Bio). The absorbance was measured tal of 35 variables) including OC, EC, ions, elements, and
at 265 nm using a plate reader (TECAN spectrophotometer some organic markers (MSA, levoglucosan, mannosan, poly-
Atmos. Chem. Phys., 21, 9719–9739, 2021 https://doi.org/10.5194/acp-21-9719-2021L. J. S. Borlaza et al.: Disparities in PM10 origins and OP at a city scale (Part 2) 9723
ols, pinic acid, 3-MBTCA, phthalic acid, and cellulose). The
associated uncertainties were calculated based on a method
proposed by Gianini et al. (2012). Specific geochemical con-
straints, based on expert prior knowledge, were added to the
solution using the ME-2 solver (Paatero, 1999), particularly
for the traffic source factor (Charron et al., 2019). The statis-
tical validity of the solution and the uncertainties were esti-
mated using the bootstrap and displacement methods follow-
ing the European recommendation for source apportionment
studies (Belis et al., 2019; Brown et al., 2015). The specific
tracers used to identify the sources are presented in Table S2.
2.4.2 Multiple linear regression (MLR) analysis
A MLR analysis was performed to attribute OP from the Figure 2. The MLP neural network architecture used in this study,
PMF-resolved sources of PM10 , following the OP deconvolu- where n refers to the number of sources, G is the normalized contri-
tion methodology proposed by Weber et al. (2018). The OPv bution from the PMF, and OPv is the different volume-normalized
from the three assays were used individually as the depen- OP activities (OPDTT
v , OPAA
v , and OPv
DCFH ).
dent variable, while the PMF-resolved source contributions
were used as independent variables, as shown in Eq. (1):
Implementation of the MLP
OPobs = Gn × β n + ε, (1)
As an initial step, a rescaling process is applied to both the
input and output layers to eliminate potential bias due to the
where OPobs is the observed daily OPv matrix of size d ×1 in range of variance within the dataset (Gardner and Dorling,
nmolreactant min−1 m−3 , G is the contribution of the sources 1998). Each variable is standardized by subtracting the mean
from the PMF in µg m−3 of size d × n, and β is the regres- observed value and then divided by the standard deviation.
sion coefficient representing the intrinsic OP (or the OPm ) The daily contributions of the PM sources obtained from the
of size 1 × n in nmol min−1 µg−1 . Finally, ε is the residual PMF were fed in the input layer to the hidden layer. The MLP
term accounting for the difference between the observed and analysis was performed for each site using the OPv from each
modelled OP of size d ×1 in nmolreactant min−1 m−3 . The OP assay (OPDTT , OPAA DCFH
v v , and OPv ) as multiple variables in
contribution of each source is calculated by multiplying the the output layer (see Fig. 2), making a set of nine independent
source-specific regression coefficient by the contribution of studies. At each node (or neuron), the information given by
the source to PM10 (Gk × βk ). the input neurons is condensed into a unique value and prop-
agated to the next layer. For instance, the MLP described in
2.4.3 Multilayer perceptron (MLP) neural network Fig. 2 is formally defined by Eq. (2) for the first layer (hidden
analysis layer):
Background of the MLP analysis Xd
G G
∀j ∈ {1, . . ., l} , zj = H w
i=1 i,j
× xi + w0,j , (2)
The MLP analysis is designed using a feed-forward learn-
G the weight of the neuron between the input and
with wi,j
ing model (Calcagno et al., 2010; García Nieto et al., 2018;
Salazar-Ruiz et al., 2008) that produces a predictive model hidden layer and w0,j G an activation constant for neuron j .
for one or more output variables (OPv ) based on the values The activation function H is often non-linear.
of the input variables (PM10 source contributions). The three To sum up, the hidden layer develops the input data and
main components of MLP are (1) the input layer, (2) the hid- deciphers the relationship of the neurons within the MLP
den layer, and (3) the output layer. Generally, the MLP con- network. The number of neurons in the hidden layer was de-
sists of interconnected layers of artificial neurons that form a termined automatically by the estimation algorithm. With the
network using a set of input data and draws it onto a set of activation function, the hidden layer transfers a response onto
output data, which are then used to further train the neural the output layer. The activation functions tested in this study
network through a back-propagation process (Bishop, 1995; were sigmoid and hyperbolic tangent (TanH) as these are ap-
Fontes et al., 2014; Kim and Gilley, 2008). In this study, the propriate for continuous dependent variables (IBM, 2016). A
neural network architecture was limited to a one hidden layer weight initialization was preset for potential occurrence of
design to demonstrate the applicability of non-linear models, vanishing gradients (Bengio et al., 1994; Hochreiter, 1998;
even only with a rudimentary architecture, and to compare Hochreiter and Schmidhuber, 1997). The scaled conjugate
its predictive capability against that of MLR. and stochastic gradient descent optimization algorithms were
https://doi.org/10.5194/acp-21-9719-2021 Atmos. Chem. Phys., 21, 9719–9739, 20219724 L. J. S. Borlaza et al.: Disparities in PM10 origins and OP at a city scale (Part 2)
tested to obtain the optimal weights in both the input and out- specific OP contributions (MLP = MLPsum ). In cases where
put layers (Slini et al., 2006; Vakili et al., 2015). The various MLP > MLPsum , then synergistic effects are highlighted be-
MLP architectures tested are summarized in Sect. S3 in the tween some PM10 sources, resulting in an increased MLP-
Supplement. modelled OP activity. Conversely, MLP < MLPsum high-
The dataset was partitioned into (1) the training set ac- lights antagonistic effects between some PM10 sources, re-
counting for 80 % and (2) the testing set accounting for 20 % sulting in a decreased MLP-modelled OP activity.
of the dataset. For each of the nine studies, the training set
contains data points that were used to train the MLP, while 2.4.4 Statistical analysis
the testing set is an independent set of data points used to
monitor errors during the training step. During the training For the comparison of temporal variations of the observed
step, the MLP is continually developed and refined until the measurements, all the correlations were evaluated using
weighting values between the nodes accurately predict the Spearman rank correlation coefficients (rs ), where p ≤ 0.05
outcome (i.e. minimal possible errors). To prevent the model is considered statistically significant. For the comparison of
from over-fitting, a set of stopping rules is applied to termi- OP measures, the correlations were evaluated using Pearson
nate the training of the MLP when any of these scenarios correlation coefficients (r), where p ≤ 0.05 is considered sta-
occur, such as (1) there being no decrease in prediction er- tistically significant. For the evaluation and comparison of
ror for more than one step, (2) the maximum training time model performance between the MLR and MLP results, a
being reached (15 min), (3) the minimum relative change in number of performance indicators were calculated, such as
the training error being reached (0.0001), and (4) the mini- the goodness of fit (R 2 ), root mean square error (RMSE),
mum relative change in the training error ratio being reached and Pearson correlation coefficient (r). The STATA/SE ver-
(0.001). A maximum of 1000 data passes (epochs) are stored sion 15.1 software (College Station, TX, USA) or Python li-
in memory until this step is completed. Using the results ob- braries were used for the statistical analyses.
tained in the training step, the results are validated in the test-
ing step to check the performance of the network by assess- 3 Results and discussion
ing its forecasting capability on data points outside the train-
ing set. The MLP neural network analysis was performed 3.1 Temporal variation of PM10 and OP activity
using IBM SPSS Statistics for Windows, version 20 (IBM
Corp., Armonk, NY, USA). The daily distributions of PM10 and OP activity (OPDTT v ,
OPAAv , and OP DCFH
v ) for each site are provided in Sect. S4.
Demonstration of the non-linear behaviour of sources The range of the OP measurements in Grenoble is well within
using the MLP models the range of measurements in France (Calas et al., 2018,
2019; Weber et al., 2021, 2018). Detailed discussion of the
Since MLP analysis should account for the interactions be- temporal variability of PM10 sources is available in the com-
tween PM10 sources, the non-linear atmospheric dynamics panion paper (Borlaza et al., 2021).
causing possible synergistic or antagonistic effects on the Overall, the average PM10 concentrations on days of mea-
OP activity can be captured. To visualize such possible non- surements were higher during the colder months (October to
linear behaviour, the MLP models obtained were applied on April) at 17±10 µg m−3 and lower during the warmer months
a set of dummy datasets. Each dummy dataset consists of the (May to September) at 10±4 µg m−3 in the city of Grenoble.
same mass contributions (from PMF analysis) of each source With the Alpine environment and the atmospheric dynam-
(in µg m−3 ) as in the original dataset but setting one source ics in the study area, the occurrence of atmospheric inver-
(n) to zero. sions and the restriction of strong winds often result in higher
This modelled OP using a dummy dataset (MLPn ) is sub- concentration levels of air pollutants, especially in the winter
tracted to the modelled OP by the original MLP model season (Bessagnet et al., 2020; Tomaz et al., 2017). Such ob-
(MLP) (containing all source contributions). This difference served seasonality in PM10 mass concentration is also com-
represents a source-specific OP contribution, and their sum- monly explained by higher contributions from the biomass
mation (MLPsum ) is described in Eq. (3): burning source in the colder seasons, especially in an Alpine
valley as previously reported in previous studies (Calas et al.,
X
MLPsum = MLPn . (3)
2019; Favez et al., 2010; Herich et al., 2014; Srivastava et al.,
For example, if the biomass burning source contribution was 2018; Tomaz et al., 2016, 2017; Weber et al., 2018, 2019). In
set to zero in the dummy dataset (MLPn=biomass burning ), then the same way, a seasonality is displayed in OP activity in the
(MLP − MLPn=biomass burning ) represents the MLP-modelled Grenoble basin as well. In fact, the average daily OP activ-
OP contribution of the biomass burning source. Assuming ity levels during the winter season can be up to 2, 7, and 5
there are completely no synergistic or antagonistic effects times higher than in the summer season for OPDTT v , OPAAv ,
DCFH
between PM10 sources, then the original MLP-modelled OP and OPv , respectively. Indeed, the observed strong sea-
contributions should be equal to the sum of all source- sonality (higher OP during winter, lower OP during summer)
Atmos. Chem. Phys., 21, 9719–9739, 2021 https://doi.org/10.5194/acp-21-9719-2021L. J. S. Borlaza et al.: Disparities in PM10 origins and OP at a city scale (Part 2) 9725
at all sites could induce a high spatial homogeneity between common sources (e.g. biomass burning and nitrate-rich), but
sites as well. However, there are a number of local features also in terms of specific local sources in these sites such as
observed at different sites, such as spikes in the OP activ- primary traffic, mineral dust, and, to a lesser extent, the in-
ity during the warmer months at the UH and PU sites (see dustrial factor. This could be attributed not only to their prox-
Fig. S1 in the Supplement). These spikes are prominently imity in terms of geographical location, but also to their re-
seen in OPDTT v , with some occurrences also in the OPAA
v and semblance in typology, resulting in similarities of both PM10
DCFH
OPv , which also emphasizes the sensitivity of each assay. and OP variabilities.
Previous studies have reported that OPDTT v has shown Conversely, there is an observed variability in the MR
higher sensitivity with organics, metals, and the synergistic in UH/PU and UB/PU suggesting weaker homogeneity
effect of the two (Bates et al., 2019; Dou et al., 2015; Fang (MR farther to 1) in the PU site compared to sites closer
et al., 2017; Gao et al., 2020a, b; Jiang et al., 2019; We- to the city centre (UH and UB sites). For example, the
ber et al., 2021; Yu et al., 2018), with OPAAv being sensitive PU site can be strongly influenced by some event days
mostly to metal concentrations (Bates et al., 2019; Crobeddu with extremely low OPDTT v , especially in the winter season
et al., 2017; Visentin et al., 2016; Weber et al., 2021). Ta- (OPDTT
v < 0.1 nmol min−1 m−3 , n = 3), resulting in an in-
ble S4 summarizes several publications on OP assays and crease in the MR against other sites. In fact, the MR for
their correlations with chemical species. In our study, a good OPDTT
v can be as high as 9.6 and 7.2 during winter for the
correlation (r = 0.68) was found between OPDTT v and OPAA
v UH/PU and UB/PU ratio. This can also be seen in the other
when all sites are combined (see Fig. S1), possibly affected seasons but is more prominent between the UH and PU sites.
by the local features solely captured by the DTT assay. Due Aside from seasonal influences, there are also some differ-
to the sensitivity to various ROS and RNS (reactive nitro- ences between assays as observed in the UH/PU and UB/PU
gen species) of most molecular probes, the sensitivity of the ratio during winter. For instance, the MR in OPDTT v are no-
DCFH assay to specific components of PM10 can be diffi- tably much higher than in OPAA v and OPv
DCFH
, further high-
cult to isolate (Bates et al., 2019; Jovanovic et al., 2019). lighting assay sensitivity.
However, OPDCFH v showed good correlation (r = 0.68) with Although spatial homogeneity was generally observed be-
OPDTT
v and an even stronger correlation (r = 0.93) with tween the sites, there are local features that must be taken
OPAAv (see Fig. S2). into consideration, as well as seasonal influence and OP as-
The comparison of the two OP measures, OPv and OPm , of say sensitivity. Overall, there is an observed similarity in the
each OP assay can provide information regarding the depen- spatiotemporal variabilities of PM10 and measured OP activ-
dency of OP activity on PM10 mass concentration. As shown ity, making it even more interesting to determine which of
in Fig. S3, there is only a moderate correlation (r = 0.51) be- the PM10 sources are driving OP.
tween OPDTT v and OPDTTm , suggesting the dependency of the
DTT assay on chemical composition rather than PM10 mass 3.3 Determination of the sources driving OP using
concentration. On the other hand, both OPAA (r = 0.76) and multiple linear regression (MLR) analysis
OPDCFH (r = 0.70) showed good correlations between their
measures per volume or per mass, pointing out their de- To determine the main drivers of the OP of PM10 , an OP
pendency on PM10 concentrations and, indeed, a potential deconvolution method was performed with a classical MLR
stronger influence by meteorological conditions, a key driver analysis following the proposed method by Weber et al.
for concentrations in Alpine valleys. (2018) using the source contributions obtained in the PMF
studies presented in the companion paper (Borlaza et al.,
3.2 Spatial variation of OP activity 2021) and the measured OP at each site.
The seasonal mean ratios (MR) of OP activities be- 3.3.1 Performance of the MLR models
tween sites are presented in Fig. 3, calculated by av-
eraging the daily ratios of volume-normalized OP ac- Thanks to the OP deconvolution method, the measured OP
tivities (OPDTT
v , OPAAv , and OPv
DCFH
) between the sites has been attributed to the PM10 sources, allowing the quan-
(hyper-centre/background UH/UB, hyper-centre/peri-urban tification of the contribution of each source to OP. Generally,
UH/PU, and background/peri-urban UB/PU) by season, the MLR-modelled OPs are well within the range of the ob-
where winter is from December to February, spring is from served OP activity, even taking into account the low uncer-
March to May, summer is June to August, and autumn is tainties of the measurements as presented in Fig. 4. However,
September to November. there are a few local features (i.e. high OP events) in the
Generally, there is spatial homogeneity (MR closer to 1) observed OPDTT v during warmer months in the UH and PU
in OP between the UB and UH sites in line with the find- sites that were not captured by the MLR models. There are
ings from the companion paper (Borlaza et al., 2021). Their also some overestimations during the colder months (specifi-
similarities in terms of PM10 sources have been previously cally around January to February 2018) at the same sites. Yet
attributed to similarities in source contribution not only from these lead to an acceptable goodness of fit (R 2 ) for the MLR-
https://doi.org/10.5194/acp-21-9719-2021 Atmos. Chem. Phys., 21, 9719–9739, 20219726 L. J. S. Borlaza et al.: Disparities in PM10 origins and OP at a city scale (Part 2)
Figure 3. Seasonal mean ratios (MR) between the sites (a) hyper-centre/background (UH/UB), (b) hyper-centre/peri-urban (UH/PU), and
(c) background/peri-urban (UB/PU) using volume-normalized OP activities (OPDTT v , OPAA
v , and OPv
DCFH ). Dashed grey line denotes MR
equal to 1, suggesting total spatial homogeneity. Boxplot mean marked by white circle and median marked by black line.
Figure 4. Comparison of the observed and modelled OPv (OPDTT v , OPAA
v , and OPv
DCFH ) at different urban sites using MLR and MLP
2
models. The equation of the line and goodness of fit (R ) between observed and modelled OP are included.
modelled OPDTT v in the UB (R 2 = 0.80), UH (R 2 = 0.62), should be interpreted with caution. For example, the relation-
2
and PU (R = 0.50) sites compared to the MLR-modelled ship between the observed and MLR-modelled OPAA v in the
OPAA 2 2 2
v (UB: R = 0.73, UH: R = 0.63, and PU: R = 0.94) UB site has a slope of 0.9 but an intercept of 0.7, showing
DCFH
and OPv (UB: R = 0.96, UH: R = 0.89, and PU: R 2 =
2 2 significant deviation between model and measurements. Ad-
0.93). These associations were also confirmed using Pearson ditional details on the correlation between the observed and
correlations (r) as presented in Fig. S6. MLR-modelled OP activity are summarized in Sect. S6.
However, there are instances where models, even those
with good R 2 values, could have a considerable bias and
Atmos. Chem. Phys., 21, 9719–9739, 2021 https://doi.org/10.5194/acp-21-9719-2021L. J. S. Borlaza et al.: Disparities in PM10 origins and OP at a city scale (Part 2) 9727
3.3.2 Intrinsic OP (OPm ) of each PM10 source OP from the DTT assay has been reported to be respon-
sive/sensitive to organics, making this quite intriguing. How-
The ability of each PM source to induce oxidative stress is ever, recent studies have reported that OP from the DTT
represented by the intrinsic OP (OPm ) given by the regres- assay could be unreactive to some metal species (specifi-
sion coefficient (β) of the MLR model, as shown in Fig. 5. cally iron), unlike other assays, namely AA and glutathione
With higher OPm , the source is more redox-active and highly (GSH). Hence, OP measured using the DTT assay may not
likely to contribute to the overall OP. completely capture ROS from Fenton chemistry or even the
Generally, the statistically dominant sources (based on synergistic effects with regards to hydroxyl radical ( qOH)
the MLR models, p value ≤ 0.05) in every site are the in- generation as reported by Xiong et al. (2017). Similarly, Yu
dustrial, biomass burning, and primary traffic (except for et al. (2018) have reported that soluble manganese showed
OPDCFH
m in the UH site) sources, suggesting stronger im- synergistic effects with quinones and an antagonistic effect
pact of anthropogenic sources. Both the biomass burning and between soluble copper and quinones. Generally, there is an
primary traffic sources have mostly shown significant pos- undeniable interplay between species that needs to be con-
itive OPm across all sites. However, amongst the sources sidered as well as the sensitivity of each assay to species.
with dominant intrinsic OP, it is important to note the vari- As much as each analysis attempts to fully characterize the
ability of the OPm of the industrial source. This source has chemistry of PM, there can still be species that are unmea-
been previously identified as a heterogeneous source in the sured but, in fact, play a role in ROS generation. Hence, re-
companion paper. It is important to note that the impact of ported associations could be due to similarity in variations
trace metals, used to identify this source (i.e. As, Cd, Cr, with PM concentration rather than a significant causal rela-
Mn, Mo, Ni, Pb, Zn), is inherently variable at this spatial tionship between assays and PM components. Nevertheless,
scale. Particularly, the industrial source has the highest OPm the sensitivity of the DTT assay to a wider range of com-
for both the UB (OPDTT m = 0.82 ± 0.24, p ≤ 0.01; OPAA m = pounds that are present in various sources led to a more bal-
0.99±0.20, p ≤ 0.01; OPDCFH m = 1.05±0.13, p ≤ 0.01) and anced distribution of OP sources (and so weighting the con-
UH (OPDTT m = 0.52 ± 0.18, p ≤ 0.01; OPAA m = 0.69 ± 0.16, tribution of biomass burning with regards to other sources)
p ≤ 0.01; OPDCFH
m = 0.62 ± 0.10, p ≤ 0.01) sites. However, than the other OP assays, such as AA and DCFH.
for the PU site, the industrial source has a low to negative Finally, Weber et al. (2021) discussed the variability of OP
OPm for the DTT and DCFH assays, suggesting that this at the national scale, and the values here are in the ballpark
source has less impact on this specific urban typology. In of the national results. A key feature is that the uncertainties
fact, in the PU site, the highest OPm was found in different of each OPm can provide information on its statistical signifi-
sources, such as the primary biogenic (OPDTT m = 0.29 ± 0.1, cance, therefore offering caution when using these values for
p ≤ 0.01), industrial (0.44 ± 0.17, p ≤ 0.01), and biomass modelling purposes.
burning (OPDCFH
m = 0.21 ± 0.01, p ≤ 0.01) sources for the
DTT, AA, and DCFH assays, respectively. 3.3.3 All-site average OP contribution (OPv ) by each
Although it is clear that anthropogenic sources have higher PM10 source
OPm , there are also impacts from biogenic sources (both pri-
mary and secondary biogenic oxidation) that need to be con- In terms of overall daily mean contribution, as pre-
sidered, especially in sites that have an abundance of this type sented in Fig. 6 (see Sect. S7 for site-specific figures),
of source. The secondary biogenic oxidation source has only the main contributors of PM10 mass are the biomass
shown statistically significant OPm in the PU site for all OP burning and the nitrate- and sulfate-rich sources in the
assays (also the UB site on OPDTT m only), underlining the in- Grenoble basin when taking into account the results
fluence of site-specific features on OPm . from the three sites. However, in terms of OPDTT v , the
Aside from biogenic sources, thanks to the enhanced PMF primary traffic source showed the highest contribution
solution used in this study, we were able to determine the (0.33 nmol min−1 m−3 ) closely followed by the biomass
redox characteristics of commonly unresolved sources. The burning source (0.31 nmol min−1 m−3 ). For both OPAA v and
contributions of specific organic tracers (particularly phthalic OPDCFH
v , the biomass burning source is notably the strongest
acid) in some anthropogenically derived sources, such as contributor (0.72 and 0.56 nmol min−1 m−3 , respectively).
sulfate- and nitrate-rich sources, can also point to contribu- The mass contributions of the biomass burning source can
tions from anthropogenic secondary organic aerosols (SOA) be twice as much as that of the primary traffic source, but
as discussed in the companion paper (Borlaza et al., 2021). OP contributions in terms of OPDTTv are almost similar. The
This is particularly important, especially that such sources industrial source also has very minimal contribution in terms
could play a key role in the dynamics of OP of PM10 (Dael- of PM10 mass but has a relevant contribution to OPv . More-
lenbach et al., 2020). over, there are sources that contribute to a large extent to the
It is also interesting that biomass burning appears to be total PM10 mass but barely contribute to the OP, such as the
contributing less to OPm in the DTT assay compared to both nitrate-rich (all OP assays) and sulfate-rich sources (only for
the AA and DCFH assays. We acknowledge the fact that OPAAv and OPv
DCFH
). This observed redistribution of source
https://doi.org/10.5194/acp-21-9719-2021 Atmos. Chem. Phys., 21, 9719–9739, 20219728 L. J. S. Borlaza et al.: Disparities in PM10 origins and OP at a city scale (Part 2)
Figure 5. Site-specific intrinsic OP (OPm ) per source analysis from each assay (OPDTT AA
m , OPm , and OPm
DCFH ) represented by mean (bar)
and standard deviation (error bar) based on the MLR (urban background, UB: blue, urban hyper-centre, UH: orange, peri-urban, PU: green).
Note: asterisks represent statistically significant OPm within a 95 % confidence interval (p value ≤ 0.05).
Figure 6. Overall daily mean OPv contribution of the sources to PM10 , OPDTT
v , OPAA DCFH using MLR analysis in the form of
v , and OPv
mean and 95 % confidence interval of the mean (error bar) (n = 378 samples).
Atmos. Chem. Phys., 21, 9719–9739, 2021 https://doi.org/10.5194/acp-21-9719-2021L. J. S. Borlaza et al.: Disparities in PM10 origins and OP at a city scale (Part 2) 9729
impacts based on OPv highlights the importance of consid- (discussed in detail in the companion paper, Borlaza et al.,
ering PM redox activity instead of solely mass concentration 2021). Surprisingly, there is also a similarity seen in the UH
(Daellenbach et al., 2020). and PU sites in terms of OPDTT v contributions from the pri-
Although secondary inorganic sources are commonly as- mary biogenic source during warmer months.
sociated with low impact on PM toxicity (Cassee et al., 2013; For OPAAv , the contribution from the mineral dust source
Daellenbach et al., 2020), the sulfate- and nitrate-rich sources during warmer months in the UB and UH sites and the con-
showed contributions to OPDTT v and OPDCFH
v , respectively. tribution from secondary biogenic oxidation source in the PU
Even with minimal OPm (see Fig. 5), the relevant mass con- site were similarly captured. During colder months, biomass
tribution of these sources resulted in a relevant contribution burning is dominating in the UB and PU sites; however, the
to OPv . It should also be considered that both sulfate- and UH site exhibited contributions from a variety of sources.
nitrate-rich sources have been previously associated with an- There is also a consistent OPAA v contribution of aged sea
thropogenic SOA due to phthalic acid contribution in this salt in the UB site and the contribution of nitrate-rich and
factor (Borlaza et al., 2021). sea/road salt during the colder months in the PU site.
Clearly, the OPv contribution of the biomass burning For OPDCFH
v , the contributions from the primary traffic
source is captured by all assays. In fact, in the AA and DCFH source (especially in the UB and PU sites) are much less than
assays, the OPv contributions are both heavily dominated by the two other assays, suggesting weaker sensitivity of the
the biomass burning source, while the DTT assay showed DCFH assay to this source. Instead, the contributions from
sensitivity to a wider range of sources. However, it is impor- the nitrate-rich source, a source also commonly associated
tant to take into consideration the mechanism at work behind with secondary anthropogenic emissions (Aksoyoglu et al.,
these assays. Both the DTT and AA assays mimic in vivo 2017; Boyd et al., 2017; Faxon et al., 2018; Pennino et al.,
interactions of redox-active components in PM10 and bio- 2016; Priestley et al., 2018), are more prominent during the
logical oxidants representing PM-induced oxidative stress, colder months in all sites.
while DCFH measures generated particle-bound ROS. Al- This further highlights not only the importance of PM re-
though these source-specific OPv contributions provide crit- dox activity over mass concentration, but also the impor-
ical knowledge on the main drivers of OPv , it is difficult to tance of considering the seasonal influence on PM sources
rely on just one measurement (i.e. one type of assay) without that drive the OP of PM. These findings are also consistent
testing its relevance to health outcomes. with current research, underlining that the main sources of
OP are those including species mainly originating from an-
3.3.4 Seasonal and site-specific differences in OP thropogenic emissions (Janssen et al., 2014; Shi et al., 2006;
contribution (OPv ) by each PM10 source Yang et al., 2015) such as road transport and biomass burn-
ing (Boogaard et al., 2012; Borlaza et al., 2018; Calas et al.,
Clearly, the previous yearly averages mask strong seasonal 2019; Daellenbach et al., 2020; Daher et al., 2014; Pant et
variabilities as presented in the monthly OPv contributions al., 2015; Park et al., 2018; Seo et al., 2020; Simonetti et al.,
of each source (see Fig. 7). During colder months, the OPv 2018; Weber et al., 2021) and also site typologies that favour
of the biomass burning source is present in all assays and the accumulation of pollutants and photo-active aging (Dael-
especially prominent in the AA and DCFH assays. During lenbach et al., 2020; Janssen et al., 2014; Pietrogrande et al.,
warmer months, the source OPv contributions vary across 2019).
different assays. However, the OPv contributions from the
primary traffic source is present throughout the year. Aside 3.4 Predicting OP activity from PM10 sources using
from seasonal influences, there are also differences between MLP analysis
the sites that vary according to the assay.
For OPDTT , there are similarities in the contributions of The residuals between the observed and MLR-modelled OP
v
some sources in the UB and PU sites such as the consis- could be attributed to atmospheric processes that were not
tent monthly contribution from the sulfate-rich source and captured as most linear models assume no interaction be-
the contributions from the secondary biogenic source dur- tween independent variables (i.e. multicomponent or multi-
ing warmer months, highlighting the influence of secondary source interactions). With this in mind, we are inclined to
aerosols in these sites. The UB and UH sites also have sim- explore another method of predicting OP from PM10 sources
ilarities in terms of OPDTT contributions from the mineral that hopefully addresses this limitation. The application of
v
dust source during warmer months and from the nitrate-rich ANN techniques using non-linear functions, such as MLP
source during the colder months, both of which are sources analysis, is an interesting new approach that accounts for cor-
that can be influenced by road emissions and anthropogenic relation and/or non-linear interactions between independent
SOA. This can be explained by the proximity of the UB and variables.
UH sites to roadways, where PM10 in these sites is more in-
clined to interact with metals from road dust resuspension
and other non-exhaust vehicular emissions than the PU site
https://doi.org/10.5194/acp-21-9719-2021 Atmos. Chem. Phys., 21, 9719–9739, 20219730 L. J. S. Borlaza et al.: Disparities in PM10 origins and OP at a city scale (Part 2)
Figure 7. The monthly mean OPv contributions of each PM10 source in the three urban sites in Grenoble, France, for OPDTT
v , OPAA
v , and
OPvDCFH based on MLR analysis.
3.4.1 Optimization of the MLP neural network It is important to note that, although there are other more
architecture complex architectures, we limited our tests to a rudimentary
MLP architecture that is deemed sufficient and appropriate
A number of MLP architectures (8 architectures in each site; based on the type of input and output dataset of this study.
total of 24 MLP models) were explored to find the optimal Clearly, there is room for further exploration in the direction
neural network in each site by exploring two different acti- of using MLP for predicting OP from PM sources. To our
vation functions (TanH and sigmoid), an optimization algo- knowledge, this is the first attempt to use MLP in apportion-
rithm (scaled conjugate and gradient descent), and different ing OP from PM sources and may serve as a baseline for
learning rates (from 0.2 to 0.6). In Sect. S3, Table S3 shows future applications of MLP in PM toxicity.
the performance comparison of all of the MLP models tested.
The optimal model was selected based on the lowest RMSE 3.4.2 Comparison of predictive accuracy between the
(ideally nearly 0) and the highest Pearson correlation coef- MLP and MLR models
ficient (r) (ideally nearly 1). Other model performance mea-
sures such as mean absolute error (MAE), mean absolute per- To conduct insightful evaluation of the predictive accuracy of
centage error (MAPE), and Spearman rank correlation coef- the MLP and MLR models, the model performance measures
ficient (rs ) were also explored and led to relatively similar were calculated as shown in Table 1. The predicted OPDTT v
results. by the MLP model generally showed lower prediction error
(RMSE) than the MLR model for all the sites. Conversely,
Atmos. Chem. Phys., 21, 9719–9739, 2021 https://doi.org/10.5194/acp-21-9719-2021L. J. S. Borlaza et al.: Disparities in PM10 origins and OP at a city scale (Part 2) 9731
the model performance measures in OPAA v and OPv
DCFH
were
AA
less straightforward. The predicted OPv showed lower pre-
diction errors for the UB and UH sites using MLP models,
with lower prediction errors for the PU site using MLR mod-
els.
The temporal distribution of the observed and modelled
OP activities for both the MLR and MLP models were pre-
viously presented in Fig. 4. It is interesting to note that even
MLP was not able to fully capture some peaks (especially in
the warmer months) of the observed OPDTT v . However, the
RMSE values using MLP were much lower than MLR, par-
ticularly in the UH site, where the RMSE was reduced from
0.69 to 0.54 and in the PU site from 0.62 to 0.58. In the
UB site, the MLP did not exceed the performance of MLR
by a weighty extent. Nonetheless, the MLP model generally
performed better, making it a competitive new technique in
predicting OP activity even with a rudimentary MLP archi-
tecture.
3.4.3 The non-linearity of OP contributions of PM10
Figure 8. The comparison of the original modelled OPDTT v (MLP)
sources based on MLP analysis and the sum of source-specific modelled OPDTT activity. Note:
v
dashed grey line corresponds to the 1 : 1 line. Data points below the
With some interactions between PM10 sources resulting in 1 : 1 line show an overall synergistic effect between PM10 sources
synergistic or antagonistic effects on the OP activity, it is on OP activity; above the 1 : 1 line it is otherwise.
deemed essential to look closer into this potential non-linear
aspect to understand better the oxidizing capacity of PM10
sources. To demonstrate this non-linearity, the MLP models tance of source interactions and dynamics, as it could have
were applied to dummy datasets leading to source-specific considerable influence on the OP of PM10 .
OPv . The total source-specific OPv (MLPsum ; see Sect. 2.4.3) In Sect. 3.4.2, it was presented that MLP offered improve-
was compared to the original MLP-modelled OPv as pre- ments compared to MLR, based on its much lower prediction
sented in Fig. 8 for OPDTT in the UH site (see Sect. S7 for errors in the UH site (see Table 1). Indeed, it is possible that
v
similar figures for the UB and PU sites). The data points be- MLR had difficulties in generating an accurate OP model for
low the 1 : 1 line show an overall synergistic effect between a site that has a highly non-linear behaviour based on the
PM10 sources on OPv , while data points above the 1 : 1 line potential synergistic effects between PM10 sources. In fact,
show an overall antagonistic effect between PM10 sources on the lowest prediction error by MLR (the OPDTTv model in the
OPv . PU site with RMSE = 0.21; see Table 1) also showed data
Overall, there is a synergistic effect of PM10 sources on points closer to the 1 : 1 line between the MLP vs. MLPsum
OPDTT in most days in the UH site. This is also seen in (see Fig. S9), suggesting weaker influence of the synergis-
v
the OPAA DCFH tic/antagonistic effects between PM10 sources. However, the
v and OPv (see Fig. S9). Several studies have
reported synergistic effects in OP due to the interaction be- MLP still performed better (the OPDTT v model in the PU site
tween metal and organic species (Arangio et al., 2016; Char- with RMSE = 0.19; see Table 1), supporting the flexibility
rier and Anastasio, 2015; Dou et al., 2015; Fang et al., 2017; of MLP in both linear and non-linear behaviour of PM10
Li et al., 2012; Lin and Yu, 2020; Xiong et al., 2017; Yu et al., sources compared to MLR.
2018). The UH site has pertinent contributions coming from
the mineral dust source (high in metal species, possibly com-
bined with anthropogenic organics, from road dust resuspen- 4 Conclusions
sion) and primary biogenic source (high in organic species)
which could be initiating the synergistic effects (see Fig. S7). This study, together with the findings of its companion paper
While there are relevant contributions from biogenic sources (Borlaza et al., 2021), has presented an extensive analysis of
in the other two sites, their mineral dust source is not as high a city-scale OP and its association with various sources of
as in the UH site (or vice versa). These findings further sup- PM10 based on a 1-year PM10 sampling over different sites
port the importance of accounting for the contribution of bio- in Grenoble (France), with approaches using both linear and
genic sources as previously reported in other similar studies non-linear modelling techniques. The main findings of this
(Samake et al., 2017; Tuet et al., 2017) as well as the impor- study are as follows.
https://doi.org/10.5194/acp-21-9719-2021 Atmos. Chem. Phys., 21, 9719–9739, 2021You can also read