Evapotranspiration in the Amazon: spatial patterns, seasonality, and recent trends in observations, reanalysis, and climate models - HESS
←
→
Page content transcription
If your browser does not render page correctly, please read the page content below
Hydrol. Earth Syst. Sci., 25, 2279–2300, 2021
https://doi.org/10.5194/hess-25-2279-2021
© Author(s) 2021. This work is distributed under
the Creative Commons Attribution 4.0 License.

Evapotranspiration in the Amazon: spatial patterns, seasonality,
and recent trends in observations, reanalysis, and climate models
Jessica C. A. Baker1 , Luis Garcia-Carreras2 , Manuel Gloor3 , John H. Marsham1 , Wolfgang Buermann4 ,
Humberto R. da Rocha5 , Antonio D. Nobre6 , Alessandro Carioca de Araujo7 , and Dominick V. Spracklen1
1 School   of Earth and Environment, University of Leeds, Leeds, UK
2 Department    of Earth and Environmental Sciences, University of Manchester, Manchester, UK
3 School of Geography, University of Leeds, Leeds, UK
4 Institut für Geographie, Universität Augsburg, 86135 Augsburg, Germany
5 Departamento de Ciências Atmosféricas, Instituto de Astronomia, Geofísica e Ciências Atmosféricas,

Universidade de São Paulo, São Paulo, Brazil
6 Earth System Science Center, INPE, São José dos Campos, São Paulo, Brazil
7 Empresa Brasileira de Pesquisa Agropecuária (EMBRAPA), Belém, Pará, Brazil

Correspondence: Jessica C. A. Baker (j.c.baker@leeds.ac.uk)

Received: 9 October 2020 – Discussion started: 14 November 2020
Revised: 4 March 2021 – Accepted: 5 March 2021 – Published: 28 April 2021

Abstract. Water recycled through transpiring forests influ-       catchment-balance estimates, underestimate seasonal and in-
ences the spatial distribution of precipitation in the Amazon     terannual variability, and show conflicting positive and neg-
and has been shown to play a role in the initiation of the        ative trends. Only two out of six satellite and model datasets
wet season. However, due to the challenges and costs asso-        analysed reproduced spatial and seasonal variation in Ama-
ciated with measuring evapotranspiration (ET) directly and        zon ET, and captured the same controls on ET as indicated by
high uncertainty in remote-sensing ET retrievals, the spatial     catchment-balance analysis. CMIP5 and CMIP6 ET was in-
and temporal patterns in Amazon ET remain poorly under-           consistent with catchment-balance estimates over all scales
stood. In this study, we estimated ET over the Amazon and         analysed. Overall, the discrepancies between data products
10 sub-basins using a catchment-balance approach, whereby         and models revealed by our analysis demonstrate a need for
ET is calculated directly as the balance between precipita-       more ground-based ET measurements in the Amazon as well
tion, runoff, and change in groundwater storage. We com-          as a need to substantially improve model representation of
pared our results with ET from remote-sensing datasets, re-       this fundamental component of the Amazon hydrological cy-
analysis, models from Phase 5 and Phase 6 of the Cou-             cle.
pled Model Intercomparison Projects (CMIP5 and CMIP6
respectively), and in situ flux tower measurements to pro-
vide a comprehensive overview of current understanding.
Catchment-balance analysis revealed a gradient in ET from         1   Introduction
east to west/southwest across the Amazon Basin, a strong
seasonal cycle in basin-mean ET primarily controlled by           Evapotranspiration (ET) is the transfer of water from the land
net incoming radiation, and no trend in ET over the past          to the atmosphere through evaporation from soil, open wa-
2 decades. This approach has a degree of uncertainty, due         ter, and canopy-intercepted rainfall, as well as transpiration
to errors in each of the terms of the water budget; there-        from plants. More than half of all water that falls as precip-
fore, we conducted an error analysis to identify the range of     itation over land is recycled back to the atmosphere through
likely values. Satellite datasets, reanalysis, and climate mod-   ET (Schlesinger and Jasechko, 2014; Good et al., 2015;
els all tended to overestimate the magnitude of ET relative to    Jasechko, 2018). This essential hydrological process affects
                                                                  the partitioning of heat fluxes at the Earth’s surface, caus-

Published by Copernicus Publications on behalf of the European Geosciences Union.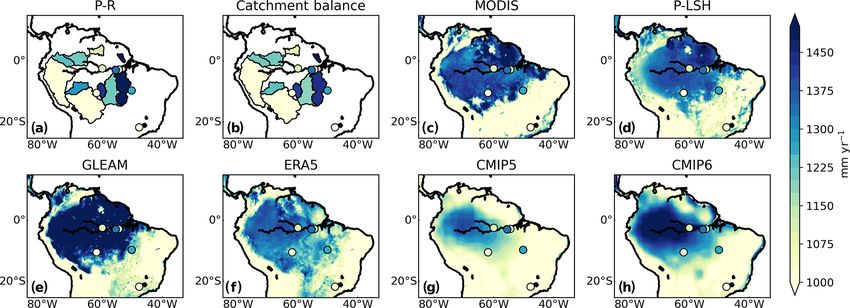
2280                                                                J. C. A. Baker et al.: Evapotranspiration in the Amazon

ing local cooling, while providing moisture for precipitation,     the wet season onset in the following year (Shi et al., 2019).
thereby sustaining the hydrological cycle (Jung et al., 2010;      However, while isotopes can help to partition ET into its re-
Wang and Dickinson, 2012; K. Zhang et al., 2016). Transpi-         spective components, they cannot provide information about
ration is the dominant component of terrestrial ET, and tran-      the absolute magnitude of the ET flux; thus, other methods
spiration rates over tropical forests are among the highest in     are required to quantify ET.
the world (Zhang et al., 2001; Jasechko et al., 2013; Good            Amazon ET can be quantified using a catchment-balance
et al., 2015; Wei et al., 2017). In the Amazon, where tropical     (i.e. water budget) approach, whereby ET is approximated
forest covers approximately 5.5×10⁶ km2 , sap flux measure-        as the difference between precipitation and runoff. Estimates
ments from a site near Manaus showed that the transpiration        of annual mean Amazon ET using this method range from
contribution to ET increased from 40 % in the wet season up        992 to 1905 mm yr−1 (mean ±σ = 1421 ± 254 mm yr−1 ;
to 95 % in the driest part of the year (Kunert et al., 2017).      Marengo, 2006, and references therein), although part of
   Amazon ET is essential for maintaining the regional hy-         this uncertainty is due to differences in the definition of
drological cycle and sustaining a climate favourable for trop-     the Amazon Basin extent. Historically, catchment-balance
ical rainforests (Salati and Vose, 1984; Eltahir, 1996; Eltahir    approaches have assumed that groundwater storage does
and Bras, 1994; Nepstad et al., 2008; van der Ent et al., 2010;    not change over time, although more recent studies have
Zemp et al., 2014). Consequently, changes in ET have impli-        been able to also account for changes in groundwater using
cations for local and regional climate (Spracklen et al., 2012;    terrestrial water storage anomalies measured by the Grav-
Silvério et al., 2015; Spracklen et al., 2018; Baker and           ity Recovery and Climate Experiment (GRACE) satellites
Spracklen, 2019) and may impact the stability of the Ama-          (i.e. Swann and Koven, 2017; Maeda et al., 2017; Sun et
zon forest biome (Zemp et al., 2017b). Deforestation, which        al., 2019). Swann and Koven (2017) estimated annual mean
has seen a recent upsurge in the region (Barlow et al., 2020),     Amazon ET to be 1058 mm yr−1 , which is towards the lower
causes reductions in ET, although the magnitude of the re-         end of previous estimates. Constraining Amazon ET in this
sponse is still not fully understood. Estimates based on in situ   way is useful, although a whole-basin-scale analysis by def-
and remote-sensing data from the southern Amazon suggest           inition does not capture spatial variation in Amazon ET.
that deforestation-driven ET reductions range from 15 % to         Maeda et al. (2017) used a water-balance approach to esti-
40 % in the dry season (von Randow et al., 2004; Da Rocha et       mate ET in five Amazon sub-basins and found values rang-
al., 2009b; Khand et al., 2017; da Silva et al., 2019). Changes    ing from 986 mm yr−1 in the Solimões Basin in the west-
in the global climate are also affecting Amazon ET by in-          ern Amazon to 1497 mm yr−1 in the northern Negro Basin.
creasing atmospheric demand for water vapour, resulting in         However, even this sub-basin-scale analysis is likely to mask
positive ET trends since the 1980s (Zhang et al., 2015b;           finer-scale spatial heterogeneities in ET.
Y. Zhang et al., 2016; Pan et al., 2020). Over the next cen-          Direct, site-level measurements of ET can be obtained
tury, coupled climate models suggest that there may be large       from eddy-covariance (EC) flux towers. During the 1990s,
reductions in ET as plants reduce stomatal conductance in          a network of towers was established in Brazil as part of
response to rising atmospheric CO2 (Skinner et al., 2017;          the Large-Scale Biosphere–Atmosphere Experiment in Ama-
Kooperman et al., 2018), leading to changes in the surface         zonia (LBA) research programme (see Keller et al., 2009,
energy balance and atmospheric circulation that drive reduc-       and references therein). ET measurements from these towers
tions in Amazon rainfall (Langenbrunner et al., 2019). To          have provided valuable insights into the drivers of variabil-
assess changes in ET over the Amazon and evaluate climate          ity in Amazon ET and how ET varies over different tempo-
model credibility, reliable observations of ET are required.       ral scales (da Rocha et al., 2004; Hasler and Avissar, 2007;
However, despite being integral to the health of the Amazon        Fisher et al., 2009; Restrepo-Coupe et al., 2013; Christof-
ecosystem, ET over this region remains a challenging vari-         fersen et al., 2014). EC data have shown that surface net radi-
able to measure and quantify (Pan et al., 2020).                   ation is the primary control on seasonal Amazon ET over wet
   Several early studies used measurements of stable water         areas of the Amazon (precipitation above 1900 mm), while
isotopes to evaluate water recycling in the Amazon, as the         variation in water availability governs ET in the seasonally
isotope composition of transpired water is distinct from that      dry tropical forests in the south and southeast Amazon, to-
of evaporated water (Salati et al., 1979; Victoria et al., 1991;   wards the boundary with the Cerrado biome (da Rocha et
Martinelli et al., 1996; Moreira et al., 1997). Such work first    al., 2009a; Costa et al., 2010). Despite these advances in un-
highlighted the predominance of transpiration over the Ama-        derstanding, it should be noted that EC measurements have
zon, relative to continental areas with lower forest cover, such   an inherent degree of uncertainty, as measured turbulent heat
as Europe (Salati et al., 1979; Gat and Matsui, 1991). More        fluxes do not sum to the total measured available energy (i.e.
recently, studies based on satellite retrievals of hydrogen iso-   the energy balance closure problem; Foken, 2008; Wilson et
topes in tropospheric water vapour have suggested that tran-       al., 2002). Tropical forest LBA tower sites underestimated
spiration could be key in triggering convection during the         the total energy flux by 20 %–30 % (Fisher et al., 2009), in-
Amazon dry-to-wet season transition (Wright et al., 2017),         dicating that part of the ET flux might have been missed.
and that ET reductions in the 2005 drought caused a delay in       A study in western Europe also suggested that flux towers

Hydrol. Earth Syst. Sci., 25, 2279–2300, 2021                                       https://doi.org/10.5194/hess-25-2279-2021
J. C. A. Baker et al.: Evapotranspiration in the Amazon 2281
do measure (essentially radiation), other satellite retrievals
(e.g. leaf area index, LAI), and, crucially, model-derived
inputs. Thus, although often referred to as “observational
datasets”, it is more accurate to consider satellite ET prod-
ucts as physically constrained land-surface models. Global-
scale ET product comparisons have been conducted before
– for example as part of the WACMOS-ET (WAter Cycle
Multi-mission Observation Strategy – EvapoTranspiration)
project (Michel et al., 2016; Miralles et al., 2016) as well
as a more recent detailed evaluation that included multiple
remote-sensing datasets and 14 land-surface models (Pan et
al., 2020). While these studies made some comparisons be-
tween products over the Amazon, they did not include any
“ground-truth” validation data over South America. Further
work has evaluated satellite ET products over the Amazon at
different spatial scales (e.g. de Oliveira et al., 2017; Maeda et
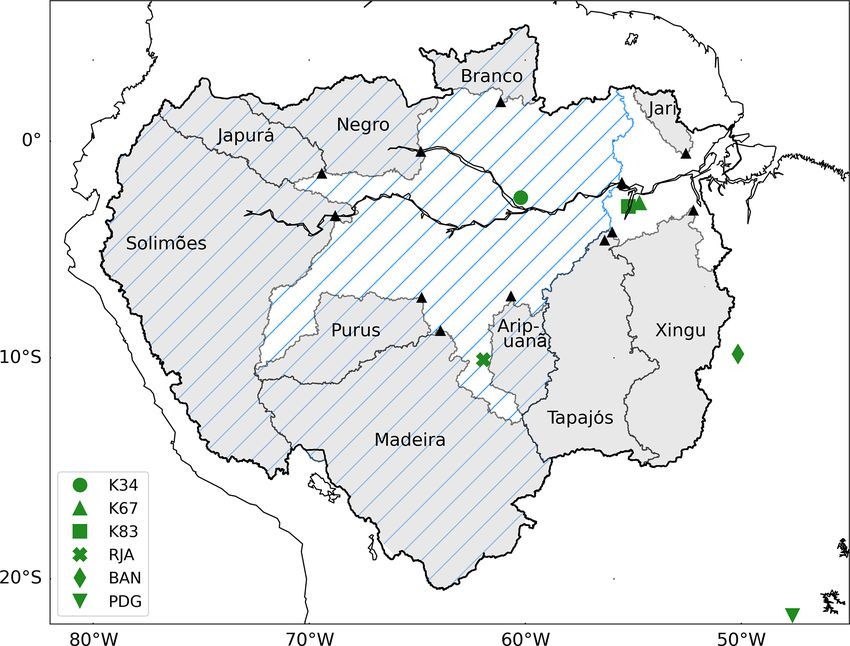
Figure 1. Locations of river catchments and in situ data. Map show- al., 2017; Swann and Koven, 2017; Ruhoff et al., 2013; Paca
ing the locations of the Amazon sub-basins (grey shaded regions) et al., 2019; Sörensson and Ruscica, 2018; Wu et al., 2020),
and the respective river-gauge stations (black triangles) used to es- although a detailed analysis of spatial and temporal varia-
timate catchment-balance evapotranspiration (ET). Note that two tion in remote-sensing ET products, evaluated against ET
stations in the Tapajós Basin were used (see Sect. 2.1). Blue hatch- from catchment-balance analysis and flux towers, is currently
ing indicates the area drained by the Óbidos measurement station, lacking.
which is used to represent “whole” Amazon ET. The locations of the Finally, the representation of Amazon ET in coupled cli-
LBA flux towers used in the study are also shown (green markers; mate models is still underdeveloped, in part due to limited
see Table S3 for site information). The markers for K67 and K83 high-quality reference observations. To overcome uncertain-
have been offset by 0.25◦ in longitude and latitude respectively to
ties in benchmarking data, Mueller and Seneviratne (2014)
improve visibility.
utilised a synthesis of 40 observational, reanalysis, and land-
surface model datasets (Mueller et al., 2013) to evaluate 14
models from Phase 5 of the Coupled Model Intercompari-
may underestimate ET over forests compared with ET from son Project (CMIP5). Their analysis showed that Amazon
lysimeters and water-balance methods (Teuling, 2018). Vari- ET tended to be overestimated at the annual scale but un-
ation in energy closure between flux tower sites also makes derestimated from June to August. More recently it was ob-
it difficult to make direct comparisons between absolute ET served that 28 out of 40 CMIP5 models misrepresented the
values measured in different locations, presenting a further controls on Amazon ET, with implications for future precip-
challenge (da Rocha et al., 2009a). Finally, the spatial dis- itation projections in the region (Baker et al., 2021b). Other
tribution of flux towers in South America is uneven, with assessments of CMIP5 models over the Amazon have found
no EC ET measurements currently available over large ar- that the choice of reference ET dataset can have a large im-
eas of the western and northern Amazon (see Fig. 1). Given pact on model performance metrics (Schwalm et al., 2013;
the relatively high costs associated with setting up and run- Baker et al., 2021a). Catchment-balance analysis accounting
ning flux towers as well as the inaccessibility of much of the for changes in groundwater storage offers an alternative ap-
Amazon Basin, it is desirable to find alternative methods of proach for directly quantifying Amazon ET and its associ-
monitoring ET over this region of remote tropical forest and ated uncertainty at the monthly timescale; however, to our
elsewhere. knowledge, this has not previously been applied to evalu-
Over the past few decades, ET products derived from Earth ate climate models. With output from the sixth generation of
observation satellites have become available (e.g. Martens CMIP models now available (Eyring et al., 2016), there is an
et al., 2017; Miralles et al., 2011; Mu et al., 2011, 2007; opportunity to extend earlier evaluation studies by comparing
Zhang et al., 2010). These products offer ET estimates over simulated Amazon ET against catchment-balance estimates,
previously unmonitored regions, such as the western Ama- thereby providing a first assessment of model performance
zon, and therefore have potential to further our understand- over the Amazon.
ing of the controls and drivers of the Amazon hydrologi- The aim of this study was to summarise the current “state
cal cycle. Satellite-based ET products provide spatially and of the science” for Amazon ET in an attempt to determine
temporally homogeneous information at scales that are well what aspects of Amazon ET are well-understood, identify
suited for climate model evaluation. However, it is impor- areas of remaining uncertainty, and provide a benchmark
tant to note that these products are not direct measures of to evaluate the latest generation of coupled climate models.
ET, but rather ET is estimated from variables that satellites Given the challenges associated with estimating ET, we col-
https://doi.org/10.5194/hess-25-2279-2021 Hydrol. Earth Syst. Sci., 25, 2279–2300, 2021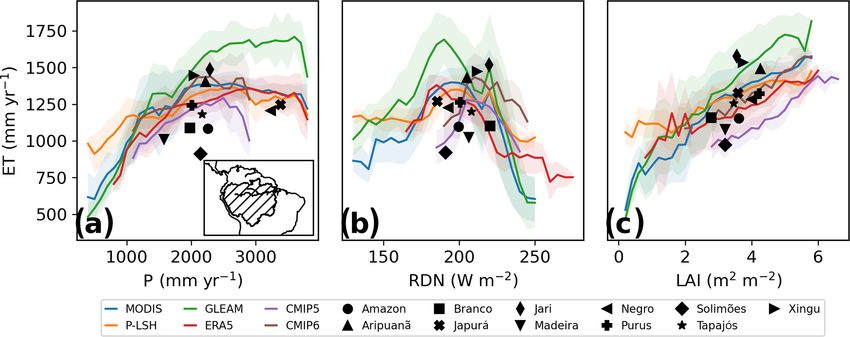
2282                                                                 J. C. A. Baker et al.: Evapotranspiration in the Amazon

lated data from a variety of sources, expanding earlier stud-       mean bias and absolute error values of −3.6 % and 28.4 mm
ies by including “direct” estimates of ET from catchment-           per month respectively (Paredes-Trejo et al., 2017).
balance analysis and flux towers in our validation as well as          Monthly mean river flow data were obtained from the
deriving ET estimates for 10 Amazon sub-basins, permitting          Agência Nacional de Águas (ANA) database in Brazil
an assessment of controls on spatial variation in ET. Our re-       (HidroWeb, 2018). To obtain runoff in millimetres per
sults highlight substantial differences between ET products,        month, volumetric flow rates (m3 s−1 ) were divided by the
while our catchment-balance analysis provides new insights          catchment area (m2 ), scaled to the monthly time step by
into the spatial and temporal patterns of ET variability over       multiplying by the number of seconds in each month and
the Amazon Basin.                                                   multiplied by 1000 to convert to millimetres. To estimate
                                                                    “whole” Amazon ET, we used runoff measured at Óbidos,
                                                                    which drains approximately 77 % (Callède et al., 2008) of
2     Data and methods                                              the Amazon Basin (Fig. 1). For the Tapajós catchment, runoff
                                                                    from Itaituba was gap-filled based on linear regression with
To capture a complete spectrum of ET estimates over the             data from the Buburé station, which is approximately 70 km
Amazon, we combined data from catchment-balance anal-               upstream (R 2 = 0.77, 15 data points in total). Details of the
ysis, flux towers, remote-sensing products, reanalysis, and         gauge stations used for the other basin river records are pro-
coupled climate models. The origins of these datasets are de-       vided in Table S1 in the Supplement.
scribed in the sections that follow.                                   Terrestrial water storage data were derived from the 0.5◦ ×
                                                                    0.5◦ Jet Propulsion Laboratory (JPL) RL06M Version 2.0
2.1    Catchment-balance ET                                         GRACE mascon solution, with coastline resolution improve-
                                                                    ment (CRI) filtering and land-grid scaling factors (derived
Catchment-balance ET provides the closest approximation to
                                                                    from the Community Land Model, CLM) applied (Watkins
a direct ET “measurement” over large spatial scales in this
                                                                    et al., 2015; Wiese et al., 2016, 2019). This dataset, which
study. Using this approach, ET is calculated as the difference
                                                                    has been processed to minimise measurement errors and
between terms in the water-budget equation that can be mea-
                                                                    optimise the signal-to-noise ratio, represents a new genera-
sured (within a margin of error), following Eq. (1):
                                                                    tion of GRACE solutions that do not require empirical post-
                dS                                                  processing to remove correlated errors and are, thus, consid-
ET = P − R −       ,                                         (1)    ered to be more rigorous than the previous GRACE land wa-
                dt
                                                                    ter storage estimates based on spherical-harmonic solutions
where P is area-weighted, catchment-mean precipitation; R           (Wiese et al., 2016).
is river runoff from the basin; and dS dt is the area-weighted,        To determine the change in water storage dS    dt , in units
basin-mean change in terrestrial water storage (S) over the         of millimetres per month, we calculated the difference be-
basin with respect to time (t), all in units of mm per month.       tween consecutive GRACE measurements for each grid cell,
Catchment-balance ET was calculated, first as the simple            divided by the time between measurements, as shown in
difference between precipitation and runoff (climatological         Eq. (2):
basin means only) and then using the more sophisticated ap-
                                                                    dS
proach that accounts for temporal variation in groundwater             = S[n] − S[n−1] /dt,                                     (2)
storage (Rodell et al., 2011; Long et al., 2014; Swann and          dt
Koven, 2017; Maeda et al., 2017; Sun et al., 2019).                 where S represents the land water storage anomaly (in mm),
   The catchment-balance approach was used to estimate cli-         n is the measurement number, and dt is the time between
matological annual mean ET for the Amazon Basin and 10              measurements [n] and [n − 1] in months. Following this, we
sub-catchments: the Solimões, Japurá, Negro, Branco, Jari,          calculated the area-weighted, basin-mean dS   dt for each catch-
Purus, Madeira, Aripuanã, Tapajós. and Xingu catchments             ment. Finally, to account for the uneven temporal sampling
(Fig. 1). Temporal variation in catchment ET was analysed           of GRACE data (due to battery management on the GRACE
for the Amazon Basin only. Basin domains were constructed           satellites), we used a linear spline to interpolate dS
                                                                                                                        dt values to
by aggregating sub-basin shapefiles that had previously been        the same temporal grid as the precipitation and runoff data,
identified using a digital elevation model (Seyler et al., 2009),   i.e. one value per month for the period from May 2002 to
making sure to include all sub-basins upstream of the rele-         December 2019.
vant river station.                                                    Previous work has shown that GRACE is less sensitive
   Precipitation data came from the 0.05◦ × 0.05◦ Cli-              at lower latitudes than at higher latitudes and may only be
mate Hazards Group InfraRed Precipitation with Station              capable of detecting monthly changes in groundwater stor-
(CHIRPS) version 2.0 dataset, which combines data from              age over regions larger than 200 000 km2 or seasonal changes
satellites and rain gauges (Funk et al., 2015). CHIRPS has          over areas greater than 184 000 km2 (Rodell and Famiglietti,
been validated against rain-gauge data from northeast Brazil,       1999). Three of the basins included in this analysis have ar-
including four Amazon stations, and has been found to have          eas smaller than these thresholds, namely Jari (49 000 km2 ),

Hydrol. Earth Syst. Sci., 25, 2279–2300, 2021                                        https://doi.org/10.5194/hess-25-2279-2021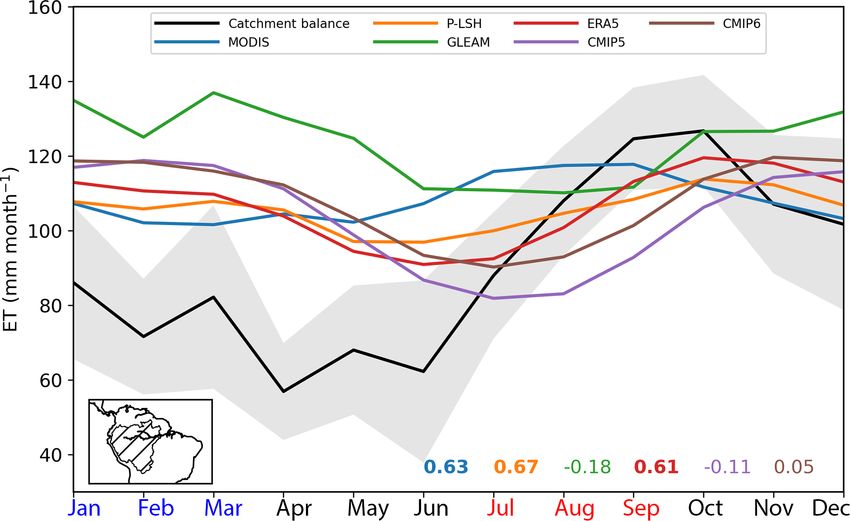
J. C. A. Baker et al.: Evapotranspiration in the Amazon                                                                         2283

Branco (131 000 km2 ), and Aripuanã (138 000 km2 , Ta-
ble S1). However, we only computed climatological means
over these basins, and the catchment-balance ET estimates
were in excellent agreement with ET calculated as the dif-
ference between precipitation and runoff (r = 0.997, p <
0.001; Fig. S1 in the Supplement). Therefore, we have confi-
dence that our results for these basins were not biased by the
inclusion of GRACE in the calculations.
   For the Amazon Basin only, we calculated catchment-
balance ET at the monthly timescale. We estimated the rela-
tive uncertainty of our ET estimates (υET ) by propagating er-
rors in each of the terms of the water-budget equation (Rodell     Figure 2. Comparison of annual Amazon evapotranspiration
et al., 2011), following Eq. (3):                                  (ET) estimates. Climatological mean Amazon ET estimated from
         r                                                         water-balance approaches (precipitation minus runoff, P − R, and
                         2
           σP2 + σR2 + σ dS                                        catchment-balance accounting for change in groundwater storage,
                          dt                                       P − R − dSdt ), satellites (MODIS, P-LSH, and GLEAM), ERA5 re-
υET =                          ,                            (3)    analysis, and climate models (CMIP5 and CMIP6). Data are from
              ET
                                                                   2003 to 2013 with the exception of CMIP5, for which data are
where σP , σR , and σ dS represent the absolute uncertainties in   from 1994 to 2004. Error bars represent the interannual standard
                     dt
                                                                   deviation for each dataset. For CMIP5 and CMIP6, the error bars
P , R, and dSdt respectively. Errors in precipitation were es-     represent the average standard deviation across all models. Data
timated as the random error (σP_random ) plus the systematic
                                                                   from satellites, reanalysis, and models were averaged over the re-
error (σP_bias ), combined in quadrature. Random errors were       gion shown in the inset map for a direct comparison with the water-
calculated following Eq. (4), from Huffman (1997):                 balance approaches.
                         1
              H −p             2
σP_random = r                      ,                        (4)
               pN                                                  culated with and without water storage estimates were sim-
                                                                   ilar (Figs. 1, 2). Data from August 2017 to June 2018 were
where r is the climatological mean precipitation over the
                                                                   removed due to anomalously low and possibly unreliable dS   dt
basin, H is a constant (1.5), p is the frequency of non-zero
                                                                   data over this period (Fig. S4c). We tested the sensitivity of
rainfall, and N is the number of independent precipitation
                                                                   our interannual trend analysis to the removal of these data
samples (defined as the number of Amazon pixels with fi-
                                                                   points and found it had no statistically significant impact on
nite P measurements in each month). For σP_bias , we used
                                                                   the reported results.
the value of −3.6 % estimated for CHIRPS from a valida-
tion analysis based on data from 21 meteorological stations        Flux tower ET
in northeast Brazil (Table 4 in Paredes-Trejo et al., 2017).
σR was estimated as 5 % of monthly river flow (Dingman,            To provide a ground-truth perspective, we used the 1999–
2015). Uncertainty in groundwater storage was quantified           2006 quality-assured, quality-controlled (QAQC), monthly
by combining GRACE measurement errors and leakage er-              flux tower ET observations from six flux towers in the LBA
rors (residual errors after filtering and rescaling) in quadra-    BrasilFlux database (Restrepo-Coupe et al., 2013; Saleska
ture. For these, we used Amazon-specific values from the           et al., 2013). These data have been processed to remove
literature (6.1 and 0.9 mm for measurement and leakage er-         unreliable or low-quality measurements and can be down-
rors respectively) that had been calculated after CRI filter-      loaded from the LBA website: https://daac.ornl.gov/LBA/
ing and CLM scaling factors had been applied (Table 1 in           guides/CD32_Brazil_Flux_Network.html (last access: April
Wiese et al., 2016). Finally, as dS  dt values were calculated     2019). We selected towers situated over land-cover types that
using data from two consecutive
                              √     months,  groundwater error     were representative of the surrounding area, including towers
values were multiplied by 2 to obtain σ dS (e.g. Maeda et          in forest, savanna, and floodplain sites, but we excluded tow-
                                              dt
al., 2017). We calculated a mean υET value of 16.1 % (stan-        ers in pasture sites where the dominant regional land cover
dard deviation = 9.2 %) for Amazon catchment-balance ET            was forest (see Table S3). The site locations are shown in
(Fig. S2). At the monthly timescale, the dS   dt and precipita-    Fig. 1. We calculated ET in units of millimetres per month
tion terms were found to be the dominant sources of un-            (kg m−2 per month) using Eq. (5):
certainty (σ dS = 8.7 mm, σP = 6.8 mm), followed by runoff
              dt
(σR = 4.9 mm; Table S2). Seasonal and interannual time se-         ET = (LE/λ),                                                   (5)
ries of precipitation, runoff, dS
                                dt and ET, and their associated
errors, are shown in Figs. S3 and S4. Due to small interannual     where LE is the monthly mean tower measurement of latent
variation in dS
              dt (Fig. S4), climatological estimates of ET cal-    heat flux (W m−2 = J s−1 m−2 ), scaled to joules per month

https://doi.org/10.5194/hess-25-2279-2021                                        Hydrol. Earth Syst. Sci., 25, 2279–2300, 2021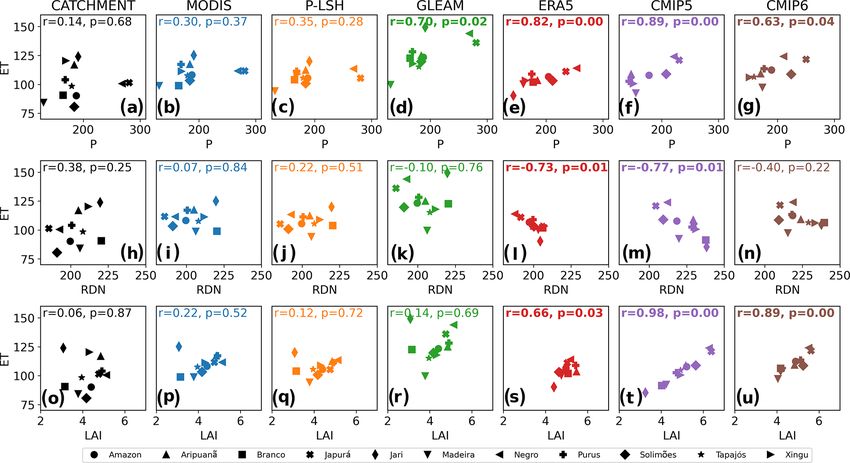
2284                                                                J. C. A. Baker et al.: Evapotranspiration in the Amazon

per square metre (J per month m−2 ), and λ is the latent heat      the many observations that are assimilated in the reanaly-
of vaporisation at 20 ◦ C (2.453 × 10⁶ J kg−1 ).                   sis, ERA5 ET is independent of the other ET datasets anal-
   In addition to the QAQC LBA data, we used a unique              ysed in this study. To permit a meaningful comparison be-
19-year record (1999–2017) from the K34 flux tower site            tween datasets, all satellite and reanalysis ET products were
(2.6◦ S, 60.2◦ W) near Manaus, Brazil. Unlike the other            re-gridded to 0.25◦ , analysed at a monthly timescale, and av-
tower sites, where data were only available for a few years        eraged over the common time period from 2003 to 2013 for
(Table S3), this extended record could be used to derive a         those analyses based on temporal means. A summary of the
robust seasonal cycle in ET. Half-hourly data were averaged        equations and datasets used to derive the satellite ET prod-
and scaled to obtain monthly means. To test the sensitivity of     ucts is presented in Table 1.
our results to missing data, we applied thresholds for the min-
imum number of hours or days required to calculate a mean          2.3   ET from coupled climate models
value each month. Seasonal results were found to be rela-
tively insensitive to minimum data requirement thresholds;         We obtained historical simulations of ET from models partic-
thus, we decided to include all monthly ET measurements in         ipating in CMIP5 and CMIP6 for the 1994–2004 and 2001–
our analysis (Table S4).                                           2014 periods respectively. We selected models that also pro-
                                                                   vided precipitation, surface shortwave radiation, and LAI
2.2    Satellite and reanalysis ET                                 output, in order to investigate model processes controlling
                                                                   ET. In total, we used data from 13 CMIP5 models and 10
Three global, satellite-derived ET products and one reanaly-       CMIP6 models (Tables S5, S6). Output was downloaded at a
sis dataset were included in this study. The Moderate Resolu-      monthly resolution from the Centre for Environmental Data
tion Imaging Spectroradiometer (MODIS) MOD16A2 Ver-                Analysis archives (http://archive.ceda.ac.uk, last access: Au-
sion 6 ET product (Mu et al., 2011, 2013; Running et               gust 2020), accessed via the JASMIN supercomputer. Where
al., 2019) was downloaded at a 500 m resolution from the           available, multiple realisations were used to derive an ensem-
NASA Earth Data website (https://earthdata.nasa.gov, last          ble mean for each model, otherwise a single run was used.
access: June 2020) for the period from 2001 to 2019. The           For basin-scale ET estimates, annual and seasonal climato-
MODIS ET algorithm is based on the Penman–Monteith                 logical means were calculated for each model separately, us-
equation (Monteith, 1965), which uses temperature, wind            ing native-resolution data (see Tables S5 and S6), and then
speed, relative humidity, and radiation data to approxi-           subsequently averaged across models. For CMIP5, clima-
mate net ET, but it is modified by scaling canopy con-             tologies were computed using data from 1994 to 2004 (the
ductance by LAI. The sinusoidal 500 m MODIS tiles were             most recent 11 years of available data), whereas CMIP6 cli-
merged and reprojected to a regular latitude–longitude grid        matologies were estimated using the same period as for ob-
(WGS84), using the Geospatial Data Abstraction Library             servations (i.e. 2003–2013). To visualise the spatial variation
software (GDAL/OGR Contributors, 2020) and resampling              in ET over the Amazon and make comparisons with site-level
via weighted averaging. We also obtained ET estimates from         ET measurements, multi-model ensemble means were also
the 8 km Process-based Land Surface ET/Heat Fluxes al-             computed for CMIP5 and CMIP6. To do this, we re-gridded
gorithm (P-LSH) product provided by the Numerical Ter-             ET from each model to the same 1◦ × 1◦ horizontal grid and
radynamic Simulation Group at the University of Montana            then calculated the ensemble mean across all models. Al-
(Zhang et al., 2010, 2015b) for the period from 1982 to            though not all models simulate the level of detail provided
2013. This ET product is also based on the Penman–Monteith         by a 1◦ × 1◦ grid (see Tables S5 and S6 for native resolu-
equation but uses an algorithm that incorporates remote-           tions), this resolution enabled us to extract data from each
sensing normalised difference vegetation index (NDVI) data         Amazon sub-basin with more accuracy than using a coarser
to estimate canopy conductance. Additionally, ET were re-          grid.
trieved from the satellite-constrained Global Land Evapora-
tion Amsterdam Model (GLEAM) v3.3b dataset (Martens et             2.4   Dataset intercomparison
al., 2017; Miralles et al., 2011) at 0.25◦ ×0.25◦ . This version
of GLEAM is based on satellite data only and is available for      We compared differences in ET magnitude, spatial variation,
the 2003–2018 period. GLEAM is based on the Priestley–             seasonality, and trends over the past 2 decades, identifying
Taylor framework (Priestley and Taylor, 1972), which uses          where estimates were in good agreement and where inconsis-
temperature and radiation to estimate potential ET (PET) and       tencies occurred. For annual comparisons, we computed cli-
a hydrological model to convert PET to actual ET. Finally,         matological means over the Amazon Basin (the area drained
0.25◦ × 0.25◦ ET data were retrieved for the 2001–2019 pe-         by Óbidos; Fig. 2) and its sub-catchments (Fig. 3), using
riod from the European Centre for Medium-Range Weather             an area-weighted averaging approach. We applied a two-
Forecasts ERA5 reanalysis, which incorporates observations         sample Kolmogorov–Smirnov test (Hodges, 1958) to iden-
into a model to provide a numerical description of histor-         tify whether monthly Amazon ET values from 2003 to 2013
ical climate (Hersbach et al., 2020). As ET is not among           from satellite, reanalysis, and climate models were drawn

Hydrol. Earth Syst. Sci., 25, 2279–2300, 2021                                       https://doi.org/10.5194/hess-25-2279-2021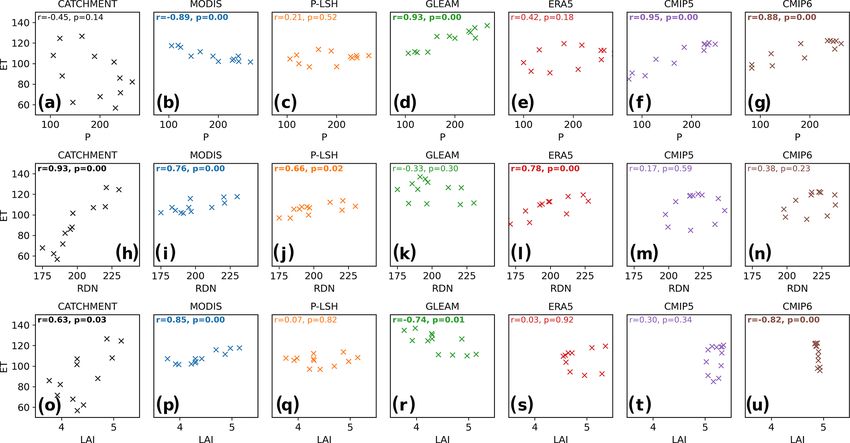
J. C. A. Baker et al.: Evapotranspiration in the Amazon 2285
Table 1. Details of the evapotranspiration (ET) datasets analysed in this study.
ET data Product(s) Core equation Input datasets References
Catchment balance Computed in ET = P − R – CHIRPS P Funk et al. (2015)
this study or – R from ANA HidroWeb (2018)
ET = P − R − dS/dt – GRACE S Wiese et al. (2019)
Satellite MODIS Penman–Monteith – MODIS land cover (MOD12Q1) Mu et al.
MOD16A2 v6 (Monteith, 1965) – MODIS FPAR/LAI (MOD15A2) (2007, 2011)
– MODIS albedo (MOD43C1) Running et
– GMAO v 4.0.0 reanalysis meteorology data al. (2019)
P-LSH Penman–Monteith – AVHRR GIMMS NDVI Zhang et al.
(Monteith, 1965) – NCEP/NCAR reanalysis meteorology data (2010, 2015b)
– NASA GEWEX radiation
– FLUXNET tower data to parameterise
– canopy conductance model
GLEAM v3.3b Priestley–Taylor – CERES L3 SYN1DEG Ed4A radiation Martens et
(Priestley and – AIRS L3 RetStd v6.0 air temperature al. (2017)
Taylor, 1972) – MSWEP v2.2 precipitation
– GLOBSNOW L3Av2 & NSIDC v01 snow water equivalent
– LPRM vegetation optical depth
– ESA-CCI 4.5 soil moisture
– MEaSUREs VCF5KYR_001 vegetation fractions
Reanalysis ERA5 Global model A full list of input datasets is provided at Hersbach et al. (2020)
https://confluence.ecmwf.int/display/CKB/ERA5%3A+data+
documentation#ERA5:datadocumentation-Observations
(last access: June 2020)
Climate model CMIP5 Global model 13 Earth system models (Table S5) Taylor et al. (2012)
CMIP6 Global model 10 Earth system models (Table S6) Eyring et al. (2016)
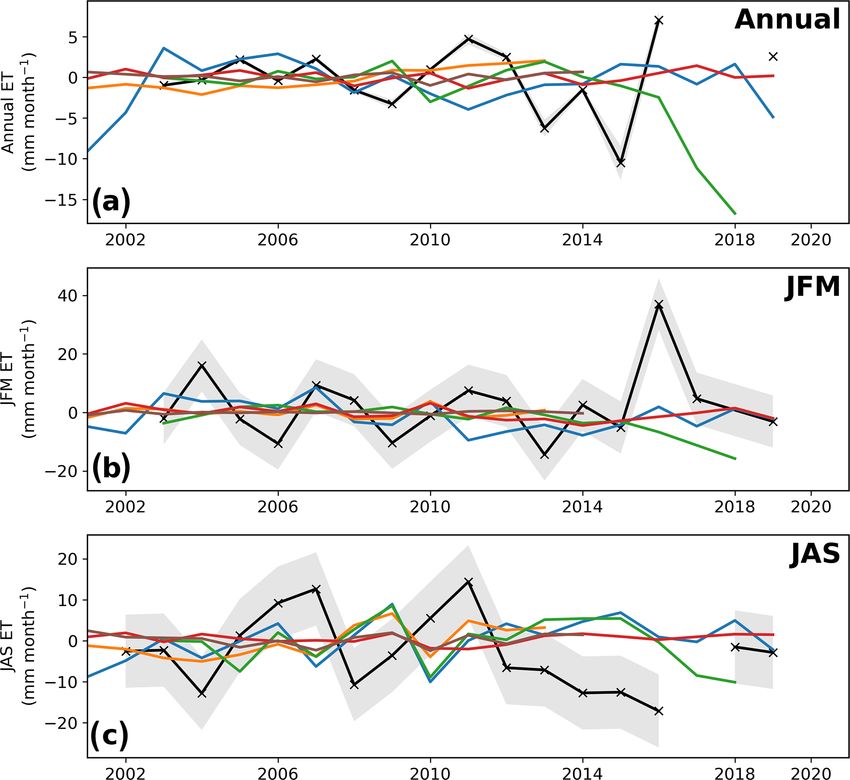
from the same distribution as the catchment-balance ET val- dinary least squares regression. Years with fewer than
ues. We examined how well each ET product was able to 10 months of data were excluded from the annual time series
capture spatial variation in Amazon ET, using comparisons (2017 and 2018), and years with any missing months in JFM
with catchment-balance ET estimates and flux tower mea- or JAS were excluded from the wet and dry season time se-
surements and by correlating basin-scale annual means with ries (2017 in JAS only). Trends were analysed over the time
catchment-balance ET (Table S7). ET products were also period common to all datasets (2003–2013) and across all
evaluated at the seasonal timescale over the Amazon catch- years with available data for each dataset.
ment and at the K34 flux tower site (Fig. 1). For comparisons
between flux tower and gridded ET data, we selected data 2.5 Investigating controls on Amazon ET
from the single grid cell containing the tower.
All data were analysed over the 2003–2013 period with
To better understand differences between ET products, we
the exception of CMIP5, which was analysed over the 1994–
analysed relationships with potential drivers of ET, including
2004 period. The Amazon hydrological cycle has intensi-
precipitation, surface radiation, and LAI. Satellite-based ET
fied between these periods, with increases in basin-mean P
estimates were compared with precipitation from CHIRPS,
(Gloor et al., 2013); therefore, we might expect CMIP5 ET
radiation from CLARA-A1 (CLoud, Albedo and RAdiation
to show some differences from other ET products. However,
dataset, AVHRR-based, version 1; Karlsson et al., 2013),
results from CMIP5 were largely consistent with results from
and LAI from the quality-controlled MODIS MOD15A2H
CMIP6, showing that any differences caused by the analysis
Collection 6 (C6) product provided by Boston University
time period were smaller than the differences between the
(Myneni et al., 2015; Yan et al., 2016a), which were all
models and other types of ET data. We acknowledge that the
re-gridded to 0.25◦ × 0.25◦ . MODIS LAI has been shown
period for evaluating Amazon ET is relatively short, although
to perform relatively well against ground-based LAI mea-
we were constrained by our reliance on satellite data and the
surements (R 2 = 0.7–0.77), although uncertainty regarding
availability of climate model output.
the validity of high LAI values (> 4 m2 m−2 ), such as those
We also analysed linear trends in Amazon Basin ET, us-
that occur over the Amazon, is larger due to there being
ing data averaged across all months (annual), the wettest
few ground measurements and the satellite reflectance signal
3 months (January–March, JFM), and the driest 3 months
reaching saturation over dense canopies (Yan et al., 2016b).
(July–September, JAS) over the past 2 decades using or-
Furthermore, the satellite-based MODIS ET product incor-
https://doi.org/10.5194/hess-25-2279-2021 Hydrol. Earth Syst. Sci., 25, 2279–2300, 20212286 J. C. A. Baker et al.: Evapotranspiration in the Amazon
Figure 3. Spatial variation in Amazon evapotranspiration (ET) from different approaches. Climatological mean annual ET from (a) dif-
ferencing precipitation and runoff, (b) catchment-balance analysis accounting for change in groundwater storage, (c–e) satellite-based ET
products, (f) ERA5 reanalysis, and (g, h) climate models. The coloured circles in each panel indicate ET measured at six flux tower sites. In
areas where there were multiple tower sites in close proximity, circles were plotted with an offset of 0.5◦ to improve data visualisation. Data
for panels (a–f) and (h) are from 2003 to 2013, data for panel (g) are from 1994 to 2004, and flux tower data are from the periods shown in
Table S3. Data in panels (c–h) are plotted as contour maps with contours at 25 mm intervals from 1000 to 1500 mm yr−1 . GLEAM data are
presented with an alternative scale in Fig. S6.
porates MODIS LAI (Table 1); thus, these datasets are not nally, to distinguish between the controls on seasonal varia-
fully independent of one another. CLARA-A1 radiation is tion in ET from the controls in interannual variation in ET,
independent of the ET datasets evaluated in this study and is we analysed relationships between ET and possible driving
estimated to have an accuracy of ≤ 10 W m−2 , although few variables at the climatological monthly timescale and at the
validation measurements were available over South Amer- interannual timescale. While this approach was useful to un-
ica and none were available in the Amazon region (Karlsson derstand the relative importance of controlling variables at
et al., 2013). Thus, there is some uncertainty in the accu- different timescales, it reduced the number of data points in
racy of these satellite products over the Amazon that must each analysis such that statistical power was correspondingly
be considered when interpreting the results. Reanalysis and low. This meant that when we did not detect a statistically
model ET were compared with reanalysis and model vari- significant signal then it could either be because there was no
ables respectively. For ERA5, we used the “high vegetation” signal to detect or because the signal-to-noise ratio was too
LAI field as the Amazon is predominantly covered with trop- low. This should be taken into consideration when assessing
ical forest, although repeating the analysis with “low vegeta- the analysis of controls on Amazon ET reported here.
tion” LAI made little difference to the results. For the K34
tower site, ET was compared against precipitation and radi-
ation data only. Half-hourly measurements of precipitation 3 Results and discussion
and incoming radiation from the tower site were averaged
and scaled to a monthly resolution, following the same pro- 3.1 Comparing estimates of annual ET over the
cedures as applied to the ET data. Due to missing data in Amazon
several years, climatological means and seasonal cycles for
Climatological annual Amazon ET estimates from water-
K34 were calculated using all data from 1999 to 2017.
balance approaches, satellite-based products, reanalysis, and
We analysed controls on spatial variation in ET by com-
two coupled-model ensembles are presented in Fig. 2. ET
paring catchment-mean values against catchment means of
from catchment balance was the lowest of all estimates
precipitation, radiation, and LAI. As there were only 11 data
(mean ± standard deviation = 1083 ± 37 mm yr−1 for 2003–
points in this analysis (representing the Amazon and 10 sub-
2013; Fig. 2, Table S7), which, given uncertainties, is in-
catchments), we also analysed the response of ET to spatial
distinguishable from the value obtained from differencing
variation in its potential drivers at the grid-cell level, fol-
precipitation and runoff (1102 ± 53 mm yr−1 ). This confirms
lowing a similar approach to Ahlström et al. (2017). This
that the GRACE-observed changes in groundwater storage
enabled us to better understand non-linear relationships be-
are relatively small over decadal timescales. Our mean an-
tween ET and its controlling variables. Mean annual ET val-
nual catchment-balance ET estimate for the Amazon was
ues from all Amazon grid cells were binned by annual pre-
very similar to that from a previous catchment-balance study
cipitation, radiation, and LAI using bin widths of 100 mm
(1058 mm yr−1 ), calculated over the same drainage region
yr−1 , 5 W m−2 , and 0.2 m2 m−2 respectively. Bins with fewer
(drained by Óbidos) but based on different precipitation
than five data points were excluded from the analysis. Fi-
data and an alternative GRACE solution (Swann and Koven,
Hydrol. Earth Syst. Sci., 25, 2279–2300, 2021 https://doi.org/10.5194/hess-25-2279-2021J. C. A. Baker et al.: Evapotranspiration in the Amazon 2287
2017), suggesting that the approach is relatively robust. The ET across the Amazon, in line with the catchment-balance
area drained by Óbidos excludes the far eastern Amazon, results presented in Fig. 3.
which our spatial catchment-balance analysis revealed to ET from ERA5, CMIP5, and CMIP6 bore no relation to
have the highest annual ET across the basin, decreasing to- catchment-balance ET, simulating the highest ET values in
wards the west and south (Fig. 3a, b). This may explain the northwest of the basin and decreasing to the east (Fig. 3e–
why our catchment-balance annual Amazon ET value was to- g). The CMIP models do not incorporate any observations
wards the lower end of previous estimates (Marengo, 2006). and, therefore, might not be expected to perform as well as
Annual Amazon ET from satellites, reanalysis, and cou- the other products analysed in this study. However, an analy-
pled models was 15 %–37 % higher than catchment-balance sis of Amazon precipitation in 11 CMIP5 models found that
ET, with GLEAM showing the largest bias (Fig. 2). With the most were able to capture spatial patterns relatively well, in-
exception of GLEAM, mean annual ET values from satel- cluding shifting distributions through the course of the sea-
lites, reanalysis, and coupled models were remarkably simi- sonal cycle (Yin et al., 2013). The poor representation of spa-
lar to one another (within 50 mm, or < 4 %), with a mean bias tial variation in Amazon ET in reanalysis and coupled models
of 18 % (relative to catchment-balance ET). ET from all of shown in Fig. 3 demonstrates a need for improvement of this
the products and models analysed showed statistically differ- key hydrological variable in these products.
ent distributions from catchment-balance ET (Kolmogorov– To understand the drivers of spatial variation in Amazon
Smirnov test; Fig. S5a), tending to show a narrower range ET, we compared catchment-scale estimates against catch-
and fewer low ET values (Fig. S5b). This substantial and ment means of precipitation, surface radiation, and LAI
consistent overestimation of annual Amazon ET across data (Fig. 4). As there were only 11 data points in the analysis
products and coupled models highlights that even basic fea- (representing the Amazon and 10 sub-catchments), statisti-
tures of the Amazon hydrological cycle are still not well cal power was relatively low. However, we found that spatial
characterised. variation in catchment-balance ET showed some indication
MODIS and P-LSH captured a northeast to southwest gra- of an influence from radiation (r = 0.38, p = 0.25; Fig. 4h)
dient in ET across the basin that was evident in the water- but not from precipitation (r = 0.14, p = 0.68; Fig. 4a) or
balance approaches, showing the highest ET over the Guiana LAI (r = 0.06, p = 0.87; Fig. 4o). This result tentatively
Shield in the north of the Amazon and decreasing southwest suggests that spatial variation in radiation explains more of
across the basin (Fig. 3c, d). Catchment-mean ET values the spatial variability in ET across Amazon sub-catchments
from these two products were strongly correlated with ET than other variables. None of the ET products and models
from the catchment-balance approach across the 11 basins analysed captured positive relationships between catchment-
analysed in this study (r = 0.84, p < 0.01 and r = 0.82, mean ET and radiation. ET from ERA5 and the CMIP en-
p < 0.01 for MODIS and P-LSH respectively), although spa- sembles instead showed negative associations with radiation
tial variability was weaker and interannual variability was (Fig. 4l–n) and, along with GLEAM ET, positive relation-
also strongly underestimated (Fig. S7, Tables 2 and S7). Flux ships with precipitation (Fig. 4d–g), indicative of water avail-
tower ET measurements, although spatially limited, appear ability influencing the spatial variation in ET (Fig. 4d–g).
to show an east–west gradient in Amazon ET, with the high- These results confirm that the reanalysis and climate models
est annual values over forest and seasonally flooded sites in analysed here struggled to capture spatial patterns in Ama-
the east of the basin (coloured circles in Fig. 3). However, zon ET due to misrepresentation of the controlling drivers,
the gradient in tower data should be interpreted with some specifically the relative importance of precipitation and net
caution, as variation in energy-balance closure between sites radiation. ET from ERA5 and the models also showed pos-
will affect the absolute ET values (da Rocha et al., 2009a; itive correlations between LAI and ET (Fig. 4s–u), which
Fisher et al., 2009). Furthermore, two nearby towers in the are not seen in the satellite observations. However, it should
northeast Amazon showed a clear difference in mean annual be noted that satellite LAI was generally slightly lower and
ET (K67 and K83), likely due to being located on different showed less spatial variability than other LAI datasets over
land-cover types (primary forest and selectively logged forest the Amazon (Fig. S8i–l), likely due to the satellite sensor be-
respectively; Table S5). ET from GLEAM, which exceeded ing insensitive to variation in LAI over areas of dense tropi-
1400 mm yr−1 over much of the Amazon, showed a north– cal forest (Yan et al., 2016b; Myneni et al., 2002). This could
south ET gradient (Fig. 3e, see Fig. S6 for an alternative hamper our ability to accurately assess the extent to which
scale) and a positive, although not statistically significant, LAI influences spatial variation in ET.
correlation with catchment-balance estimates (r = 0.51, p = For further insights into the validity of Amazon ET prod-
0.11; Fig. S7, Table S7). Previous studies based on flux tower ucts and the factors controlling ET, we evaluated ET re-
measurements (Fisher et al., 2009), water-budget analysis sponses to spatial variation in precipitation, radiation, and
(Zeng et al., 2012; Maeda et al., 2017; Sun et al., 2019), and LAI at the grid-cell level (Fig. 5). Differences between
a combination of satellites and flux towers (Paca et al., 2019) ET products were most apparent in their responses to an-
showed similar north/northeast–south/southwest gradients in nual precipitation (Fig. 5a). Above 2000 mm yr−1 , datasets
followed three patterns of behaviour: GLEAM ET contin-
https://doi.org/10.5194/hess-25-2279-2021 Hydrol. Earth Syst. Sci., 25, 2279–2300, 20212288 J. C. A. Baker et al.: Evapotranspiration in the Amazon
Table 2. Summary of comparative statistics. Datasets listed in the table were correlated with catchment-balance evapotranspiration (ET)
estimates (spatial, seasonal, and interannual), and interannual standard deviations (σ ) were calculated over the 2003–2013 period using data
standardised by the climatological mean over that period (in units of millimetres per month per year). Interannual analysis was performed
using data from all months (annual), January to March (JFM), and July to September (JAS). Statistically significant (p < 0.05) relationships
are shown in bold. Note that CMIP data were not correlated at the interannual scale because model years would not be expected to align with
real-world years.
ET dataset Spatial Seasonal Interannual variability, correlations with catchment balance, and trends
over 2003–2013 (millimetres per month per year)
Climatological Amazon Annual Wet (JFM) Dry (JAS)
catchment
means
σ r Slope σ r Slope σ r Slope
Catchment balance – – 2.90 – −0.09 8.89 – −0.74 8.92 – 0.15
MODIS 0.84 0.63 2.28 −0.24 −0.58 5.56 0.19 −1.30 5.01 −0.34 0.23
P-LSH 0.82 0.67 1.37 −0.11 0.41 1.83 0.00 −0.05 4.09 −0.09 0.88
GLEAM 0.51 −0.18 1.36 −0.42 0.09 1.82 −0.44 0.07 4.90 −0.36 0.41
ERA5 −0.28 0.61 0.65 0.13 0.05 1.91 0.01 −0.30 1.21 −0.51 −0.11
CMIP5 −0.06 −0.11 – – – – – – – – –
CMIP6 −0.14 0.05 0.48 – 0.02 0.37 – 0.05 1.48 – 0.07
ued to increase to approximately 1600 mm yr−1 ; ET from that the GLEAM model overestimates the dependence of ET
MODIS, P-LSH, and ERA5 remained relatively stable at on soil moisture in regions with high annual rainfall, high-
around 1300 mm yr−1 ; and CMIP5 and CMIP6 showed slight lighting a possible target for improvements to the GLEAM
reductions in ET with further increases in precipitation. The algorithm.
precipitation threshold of 2000 mm yr−1 has previously been Differences between ET products in their relationships
suggested as the level above which tropical forests are able with other variables were more subtle. ET dependence on ra-
to sustain photosynthesis during the dry season (Guan et diation was broadly similar among datasets, showing a peak
al., 2015) and as the breaking point between productiv- at approximately 200 W m−2 (Fig. 5b). This is consistent
ity in the Amazon being water (< 2000 mm yr−1 ) or ra- with low and high levels of radiation tending to correspond to
diation (> 2000 mm yr−1 ) limited (Ahlström et al., 2017). high and low levels of precipitation respectively (Fig. S8a–
Indeed, below 2000 mm yr−1 ET increased with increasing h) and ET peaking at an optimum between the two. LAI–ET
precipitation for all satellite, reanalysis, and model datasets relationships were also fairly consistent, with ET increasing
(lines in Fig. 5a), indicating a water limitation on ET. The relatively linearly with increasing LAI (Fig. 5c). GLEAM
two catchments in the northwest Amazon where P exceeds generally tended to overestimate ET relative to LAI, whereas
3000 mm yr−1 , Japurá and Negro, were most closely aligned CMIP5 underpredicted ET for a given LAI value, in com-
with the products that showed ET levelling off when pre- parison with ET from other products and catchment-balance
cipitation exceeded 2000 mm yr−1 (i.e. MODIS, P-LSH, and estimates. In general, radiation over the Amazon was sub-
ERA5), suggesting that these products represent the ET re- stantially higher in the models compared with satellite and
sponse to rainfall in very wet areas relatively well. For reanalysis datasets (Fig. S8a–h), and satellite-derived LAI
MODIS and P-LSH, this finding provides additional support values were uniformly lower than other estimates (Fig. S8a–
that spatial patterns in Amazon ET correspond well with spa- h), likely due to signal saturation (Myneni et al., 2007).
tial variation in its controlling variables. In contrast, although
ERA5 generally captured the correct ET response to precip- 3.2 Seasonal variation in Amazon ET
itation (Fig. 5a), there are spatial differences between satel-
lite and ERA5 precipitation datasets in Amazon regions with The mean seasonal cycle in Amazon ET was estimated from
rainfall above 2000 mm yr−1 (Fig. S8a–d). This explains why catchment-balance analysis, satellite, reanalysis, and model
relationships between ERA5 precipitation and ET differed at ET datasets for the whole Amazon Basin (Fig. 6). Ama-
the catchment (Fig. 4e) and the grid-cell (Fig. 5a) scales. In zon catchment-balance ET showed a strong seasonal cy-
the GLEAM model, the “stress factor” that is used to scale cle (standard deviation, σ = 22 mm per month), with annual
PET takes precipitation as an input variable to the soil mod- minima during April–June and maxima in August–October
ule (Table 1), which, in turn, controls the amount of water (Fig. 6). ET at the K34 tower site, located in the central
available for ET (Martens et al., 2017). Our results indicate Amazon, showed a similar seasonal pattern to that over the
wider basin (Fig. S9), although intra-annual variation was
Hydrol. Earth Syst. Sci., 25, 2279–2300, 2021 https://doi.org/10.5194/hess-25-2279-2021J. C. A. Baker et al.: Evapotranspiration in the Amazon 2289 Figure 4. Controls on spatial variation in Amazon evapotranspiration (ET). Annual mean ET (in millimetres per month) for the Amazon and 10 sub-catchments (Fig. 1) from catchment balance, satellites (MODIS, P-LSH, and GLEAM), ERA5 reanalysis, and climate models (CMIP5 and CMIP6), plotted against (a–g) precipitation (P , millimetres per month), (h–n) surface shortwave radiation (RDN, W m−2 ), and (o–u) leaf area index (LAI, m2 m−2 ). Satellite ET data are plotted against P from CHIRPS, RDN from CLARA-A1, and LAI from MODIS; ERA5 and climate model ET are plotted against ERA5 and model P , RDN, and LAI respectively. Data are from 2003 to 2013 with the exception of CMIP5, for which data are from 1994 to 2004. Note that the axes do not start at zero. Figure 5. Evapotranspiration (ET) response to spatial variation in controls. ET data from satellites (MODIS, P-LSH, and GLEAM), ERA5 reanalysis, climate models (CMIP5 and CMIP6), and catchment balance (black markers) are plotted against annual (a) precipitation (P ), (b) surface shortwave radiation (RDN), and (c) leaf area index (LAI). Shading represents the standard deviation of the mean. Satellite ET data are plotted against P from CHIRPS, RDN from CLARA-A1, and LAI from MODIS; ERA5 and climate model ET are plotted against ERA5 and model P , RDN, and LAI respectively. Data were extracted from the Amazon region indicated in the inset map in panel (a). The locations of the catchments and tower sites are indicated in Fig. 1. Data are from 2003 to 2013 with the exception of CMIP5, for which data are from 1994 to 2004. Note that the axes do not start at zero. https://doi.org/10.5194/hess-25-2279-2021 Hydrol. Earth Syst. Sci., 25, 2279–2300, 2021
2290                                                                   J. C. A. Baker et al.: Evapotranspiration in the Amazon

                                                                      tuations relatively well, these datasets underestimated the
                                                                      seasonal variability by 39 %–77 %, relative to catchment-
                                                                      balance ET (Fig. 6). Biases from catchment-balance ET were
                                                                      generally strongly positive from January to June and weakly
                                                                      negative in September and October. At K34, MODIS and
                                                                      ERA5 overestimated the seasonal ET range by 61 % and
                                                                      28 % respectively, whereas P-LSH underestimated the range
                                                                      by 26 % (Fig. S9). With such poor representation of the mag-
                                                                      nitude of seasonal variability, and inconsistencies in the di-
                                                                      rection of amplitude biases, ET from these satellite and re-
                                                                      analysis datasets may be of limited use for assessing long-
                                                                      term changes in the seasonality of the Amazon hydrological
                                                                      cycle (Gloor et al., 2013) or for evaluating seasonal ET rep-
Figure 6. Climatological seasonal cycles in evapotranspiration (ET)   resentation in coupled climate models.
over the Amazon. Mean seasonal cycle in ET from catchment bal-           ET from GLEAM, CMIP5, and CMIP6 neither correlated
ance, satellites (MODIS, P-LSH, and GLEAM), ERA5 reanalysis,          with seasonal catchment-balance Amazon ET nor captured
and climate models (CMIP5 and CMIP6) over the Amazon region           the correct seasonal amplitude (Figs. 6, 7, Table 2). Instead,
drained by Óbidos (region indicated in the inset map). Shading rep-   ET from these datasets followed the same seasonal cycle as
resents the monthly standard deviation of the mean. Correlations      precipitation, peaking during the wettest part of the year. A
with catchment-balance ET are shown, with bold numbers indicat-       previous study comparing Amazon ET estimates derived us-
ing statistical significance (p < 0.05). Data are from 2003 to 2013   ing different methods also observed that climate model and
with the exception of CMIP5, for which data are from 1994 to 2004.    reanalysis ET tended to follow the precipitation seasonal cy-
On the x axis, the three wettest months are indicated in blue and
                                                                      cle, with annual ET minima in the dry season (Werth and
three driest months are indicated in red. Note that the y axis does
not start at zero.
                                                                      Avissar, 2004). The authors suggested that this was due to a
                                                                      strong vegetation control on modelled ET due to downreg-
                                                                      ulation of stomatal conductance in the dry season, conclud-
                                                                      ing such a control to be as credible as a radiation control on
weaker (σ = 14 mm per month). Furthermore, we observed                Amazon ET. However, a subsequent study queried this asser-
strong, positive correlations between ET and radiation for the        tion, citing evidence from flux towers as proof that vegetation
Amazon Basin and the K34 tower site (r = 0.93, p < 0.001              controls on Amazon ET were secondary to environmental
and r = 0.68, p < 0.05 respectively; Figs. 7h, S10) as well           controls (Costa et al., 2004). Over the Congo, where ET fol-
as between ET and LAI for the basin (r = 0.63, p < 0.05;              lows the same seasonal cycle as precipitation, CMIP5 models
Figs. 7o, S11). These results agree with findings from da             were shown to capture the seasonality of ET but to overesti-
Rocha et al. (2009a), who made a detailed comparison of sea-          mate the magnitude of the flux, particularly during the two
sonal ET at seven flux tower sites in Brazil. They showed that        wet seasons (Crowhurst et al., 2020). The results presented
ET increased during the dry season at the four wet tropical           in Fig. 6 indicate a disconnect between our mechanistic un-
forest sites (including K34), contrasting with three transition-      derstanding of the controls on seasonal Amazon ET based on
forest and savanna sites where ET followed seasonal soil              catchment-balance analysis, and the algorithms used to pre-
moisture availability. The seasonal cycle in ET shown in              dict ET in GLEAM and the CMIP models.
Fig. 6 is consistent with studies reporting an increase in leaf          Northern and southern Amazon sub-basins were analysed
flush driving Amazon greening in the dry season (Lopes et             separately, due to differences in the timing of the seasonal
al., 2016; Saleska et al., 2016). Studies based on catchment-         precipitation cycle above and below the Equator. Uncertain-
balance analysis (Swann and Koven, 2017), and satellite ob-           ties in monthly ET estimates were higher over these areas
servations of vegetation photosynthetic properties (Guan et           than over the whole Amazon, although it was still possi-
al., 2015) also showed that ET and forest productivity peak           ble to detect differences between catchment-balance ET and
during the drier part of the year over the majority of the Ama-       other datasets (Fig. S12). The seasonal cycle in catchment-
zon. Finally, our results are in agreement with those from            balance ET was weaker in the north than in the south (σ = 16
Fisher et al. (2009), who identified radiation and NDVI as            and 26 mm per month respectively), following the pattern of
the primary and secondary controls on ET across the tropics           precipitation seasonality (σ = 69 and 115 mm per month in
based on analysis of flux tower measurements.                         northern and southern basins respectively). In general, satel-
   Monthly ET cycles from MODIS, P-LSH, and ERA5 cor-                 lite, reanalysis, and climate model ET related fairly well
related with Amazon catchment ET (r = 0.61–0.67, p <                  to seasonal catchment-balance ET in the northern Amazon
0.05; Table 2, Fig. 6) and captured positive relationships            (Fig. S12b) but showed much weaker relationships in the
with surface radiation (r = 0.66–0.78, p < 0.05; Fig. 7).             southern Amazon (Fig. S12c). The CMIP5 and CMIP6 mod-
However, despite representing the direction of seasonal fluc-         els, which were unable to capture seasonal ET variation over

Hydrol. Earth Syst. Sci., 25, 2279–2300, 2021                                          https://doi.org/10.5194/hess-25-2279-2021
You can also read