2018 The Sustainable Development Goals Report - the United ...
←
→
Page content transcription
If your browser does not render page correctly, please read the page content below
The Sustainable Development Goals Report
                                  2018

United Nations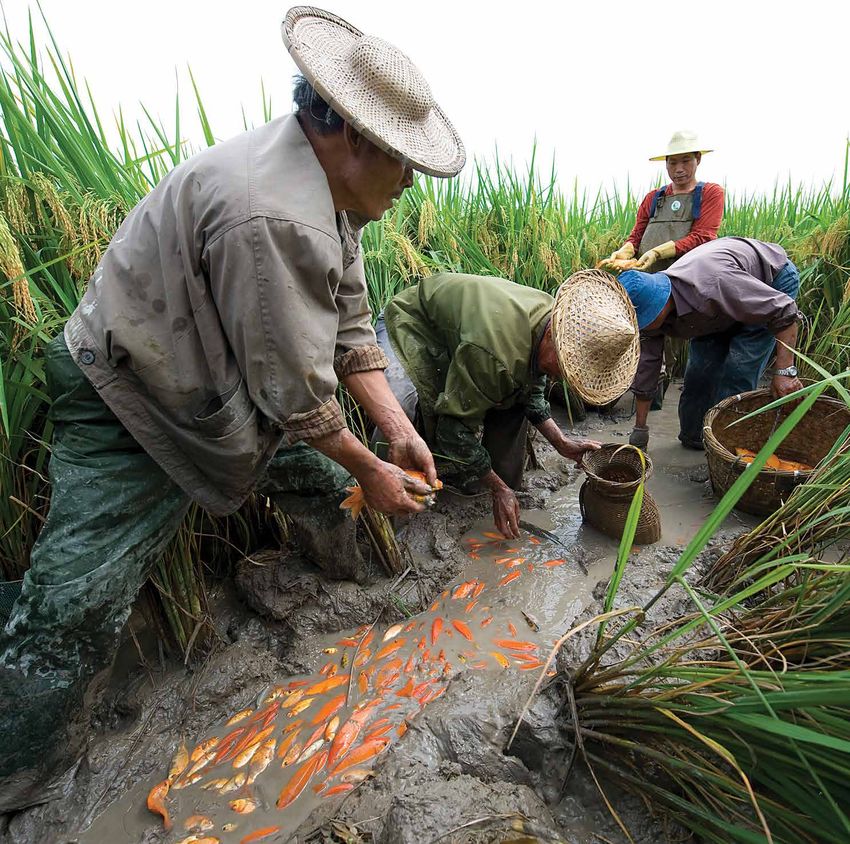
Contents
3    Foreword

4    Overview

16   A data revolution in motion

18   Goal 6: Clean water and sanitation

22   Goal 7: Affordable and clean energy

24   Goal 11: Sustainable cities and communities

26   Goal 12: Responsible consumption and production

28   Goal 15: Life on land

30   Goal 17: Partnership for the Goals

34   Note to the reader

35   Regional groupings
The Sustainable
                 Development
                 Goals Report
                 2018

United Nations
New York, 2018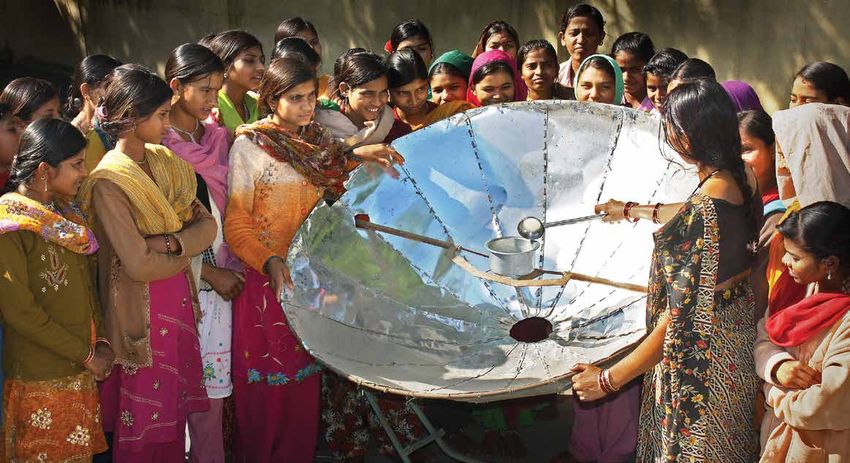
Foreword

The 2030 Agenda for Sustainable Development provides a global             Conflict, climate change and growing inequalities add additional
blueprint for dignity, peace and prosperity for people and the planet,    challenges. After a prolonged decline, the number of undernourished
now and in the future. Three years into the implementation of the         people rose from 777 million in 2015 to 815 million in 2016, mainly
Agenda, countries are translating this shared vision into national        due to conflicts and drought and disasters linked to climate change.
development plans and strategies.                                         In 2017, the North Atlantic hurricane season was the most costly ever,
                                                                          and the past five-year average global temperature is the highest on
The Sustainable Development Goals Report 2018 highlights progress         record.
being made in many areas of the 2030 Agenda. Since the turn of
the century, the maternal mortality ratio in sub-Saharan Africa has       Without evidence of where we stand now we cannot confidently chart
declined by 35 per cent and the under-five mortality rate has dropped     our path forward in realizing the Sustainable Development Goals.
by 50 per cent. In South Asia, a girl’s risk of marrying in childhood     To that end, this report also reflects on the challenges faced in the
has declined by over 40 per cent. And, in the least developed             collection, processing, analysis and dissemination of reliable, timely,
countries, the proportion of the people with access to electricity        accessible and sufficiently disaggregated data, and calls for better
has more than doubled. Globally, labour productivity has increased        evidence-based policymaking. Today’s technology makes it possible
and unemployment rate decreased. More than 100 countries have             to collate the data we need to keep the promise to leave no one
sustainable consumption and production policies and initiatives.          behind. But, we need political leadership, resources and commitment
                                                                          to use the tools now available.
However, the report also shows that, in some areas, progress is
insufficient to meet the Agenda’s goals and targets by 2030. This is      With just 12 years left to the 2030 deadline, we must inject a sense
especially true for the most disadvantaged and marginalized groups.       of urgency. Achieving the 2030 Agenda requires immediate and
Youth are three times more likely to be unemployed than adults.           accelerated actions by countries along with collaborative partnerships
Less than half of all children and adolescents meet minimum               among governments and stakeholders at all levels. This ambitious
standards in reading and mathematics. In 2015, 2.3 billion people         Agenda necessitates profound change that goes beyond business
still lacked even a basic level of sanitation service and 892 million     as usual. In doing its part, the United Nations has launched reform
people continued to practise open defecation. Close to 1 billion          initiatives to reposition the United Nations development system to
mostly rural people still lack electricity. In sub-Saharan Africa, the    deliver on the 2030 Agenda. The objective is to be more effective,
HIV incidence among women of reproductive age is 10 times the             cohesive and accountable. We stand ready to work with all Member
global average. Nine out of 10 people living in cities breathe polluted   States to make the Sustainable Development Goals a reality for
air. And, while some forms of discrimination against women and girls      everyone, everywhere.
are declining, gender inequality continues to hold women back and
deprives them of basic rights and opportunities.

                                                                          António GUTERRES
                                                                          Secretary-General, United Nations

                                                                                                                                            3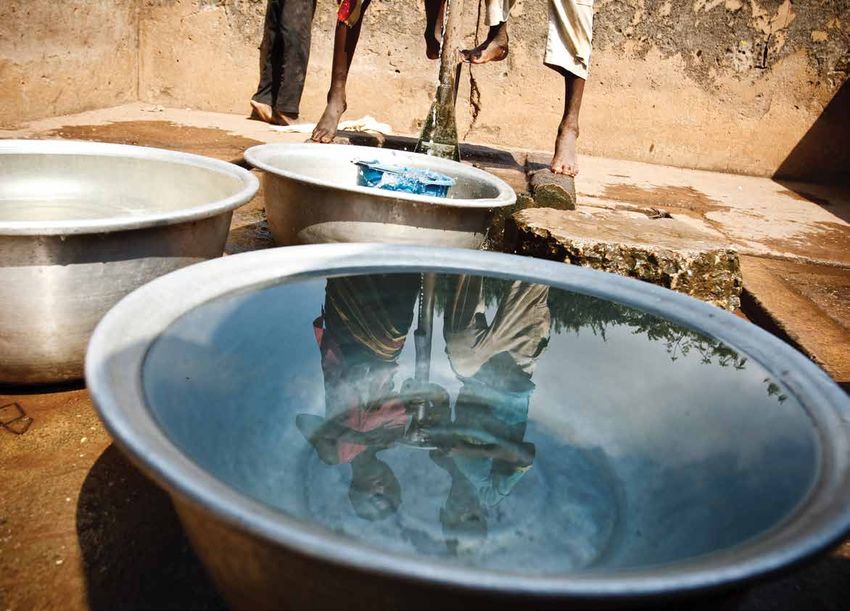
Overview

The Sustainable Development Goals Report 2018 reviews progress         While people overall are living better lives than they were a decade
in the third year of implementation of the 2030 Agenda for             ago, progress to ensure that no one is left behind has not been
Sustainable Development. This overview presents highlights of          rapid enough to meet the targets of the 2030 Agenda. Indeed, the
progress and remaining gaps for all 17 Sustainable Development         rate of global progress is not keeping pace with the ambitions of
Goals (SDGs), based on the latest available data, and examines         the Agenda, necessitating immediate and accelerated action by
some of the interconnections across Goals and targets. Subsequent      countries and stakeholders at all levels.
chapters focus in more depth on the six Goals under review at the
high-level political forum on sustainable development in July 2018.

  Goal 1: End poverty in all its forms everywhere

Only 45 per cent of the world’s population     While extreme poverty has eased considerably since 1990, pockets of the worst forms
    are covered by at least one social
         protection cash benefit
                                               of poverty persist. Ending poverty requires universal social protection systems aimed at
                                               safeguarding all individuals throughout the life cycle. It also requires targeted measures
                                               to reduce vulnerability to disasters and to address specific underserved geographic areas
                                               within each country.
                                                f
                                               fThe rate of extreme poverty has fallen rapidly: in 2013 it was a third of the 1990
                                                value. The latest global estimate suggests that 11 per cent of the world population, or
                                                783 million people, lived below the extreme poverty threshold in 2013.
                                                f
                                               fThe  proportion of the world’s workers living with their families on less than $1.90 per
 Economic losses attributed to disasters        person a day declined significantly over the past two decades, falling from 26.9 per cent
     were over $300 billion in 2017
                                                in 2000 to 9.2 per cent in 2017.
                                                f
                                               fBased on 2016 estimates, only 45 per cent of the world’s population were effectively
                                                covered by at least one social protection cash benefit.
                                                f 2017, economic losses attributed to disasters were estimated at over $300 billion.
                                               fIn
                                                This is among the highest losses in recent years, owing to three major hurricanes
                                                affecting the United States of America and several countries across the Caribbean.

  Goal 2: End hunger, achieve food security and improved nutrition and promote
           sustainable agriculture

   World hunger is on the rise again:          After a prolonged decline, world hunger appears to be on the rise again. Conflict, drought
815 million people were undernourished         and disasters linked to climate change are among the key factors causing this reversal in
  in 2016, up from 777 million in 2015
                                               progress.

                                                f
                                               fThe  proportion of undernourished people worldwide increased from 10.6 per cent in
                                                2015 to 11.0 per cent in 2016. This translates to 815 million people worldwide in 2016,
                                                up from 777 million in 2015.
      2000        2015     2016
                                                f 2017, 151 million children under age 5 suffered from stunting (low height for their age),
                                               fIn
   Stunting, wasting and overweight             51 million suffered from wasting (low weight for height), and 38 million were overweight.
    still affected millions of children
            under age 5 in 2017                 f to agriculture in developing countries totalled $12.5 billion in 2016, falling to
                                               fAid
                                                6 per cent of all donors’ sector-allocable aid from nearly 20 per cent in the mid-1980s.

                                                f
                                               fProgress has been made in reducing market-distorting agricultural subsidies, which were
        151                                     more than halved in five years—from $491 million in 2010 to less than $200 million in
       million                                  2015.

                                                f 2016, 26 countries experienced high or moderately high levels of general food prices,
                                               fIn
                   51
                          38                    which may have negatively affected food security.
                 million
                        million
      Stunting Wasting Overweight

  4          The Sustainable Development Goals Report 2018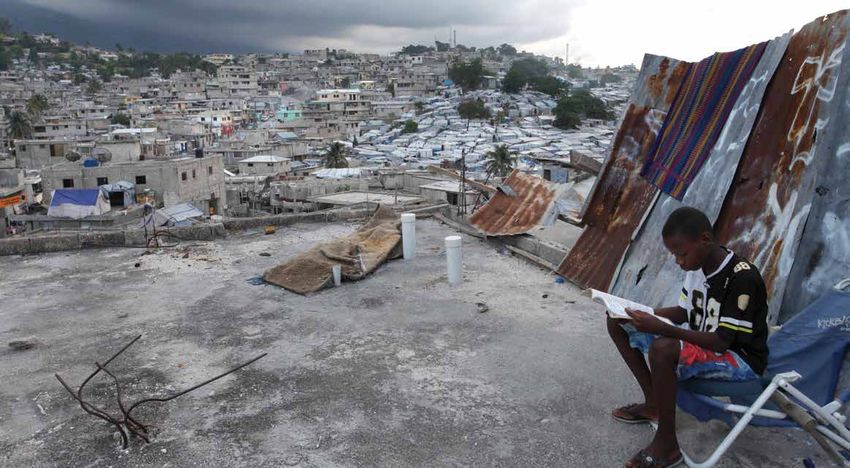
Goal 3:       Ensure healthy lives and promote well-being for all at all ages

Many more people today are living healthier lives than in the past decade. Nevertheless,            Births attended by skilled health
                                                                                                      personnel increased globally
people are still suffering needlessly from preventable diseases, and too many are dying
prematurely. Overcoming disease and ill health will require concerted and sustained                  2000-2005               2012-2017
efforts, focusing on population groups and regions that have been neglected.

Reproductive, maternal, newborn and child health
 f
fThe  maternal mortality ratio has declined by 37 per cent since 2000. Nevertheless, in
                                                                                                        62%                    80%
 2015, 303,000 women around the world died due to complications during pregnancy
 or childbirth. Over the period 2012–2017, almost 80 per cent of live births worldwide
 occurred with the assistance of skilled health personnel, up from 62 per cent in
 2000–2005.
 f
fGlobally, from 2000 to 2016, the under-5 mortality rate dropped by 47 per cent, and the
 neonatal mortality rate fell by 39 per cent. Over the same period, the total number of                   Under-5 deaths fell
 under-5 deaths dropped from 9.9 million to 5.6 million.                                                between 2000 and 2016
 f
fEven in the region facing the greatest health challenges, progress has been impressive.     2000

 Since 2000, the maternal mortality ratio in sub‑Saharan Africa has been reduced by                                                      9.9
                                                                                                                                         mill
 35 per cent, and the under-5 mortality rate has dropped by 50 per cent.
                                                                                             2016
 f 2018, the global adolescent birth rate is 44 births per 1,000 women aged 15 to 19,
fIn                                                                                                                                      5.6
 compared to 56 in 2000. The highest rate (101) is found in sub‑Saharan Africa.                                                          mill

Infectious diseases and non-communicable diseases
 f
fGlobally, the incidence of HIV declined from 0.40 to 0.26 per 1,000 uninfected people
 between 2005 and 2016. For women of reproductive age in sub‑Saharan Africa,
 however, the rate is much higher, at 2.58 per 1,000 uninfected people.                           HIV incidence rate for women of
                                                                                              reproductive age in sub-Saharan Africa
 f 2016, 216 million cases of malaria were reported versus 210 million cases in 2013.
fIn                                                                                          is 10 times higher than the global average
 There were 140 new cases of tuberculosis per 100,000 people in 2016 compared to 173
                                                                                             HIV incidence per
 cases per 100,000 in 2000. Hepatitis B prevalence declined among children under 5—          1,000 uninfected
                                                                                             people
 from 4.7 per cent in the pre-vaccine era to 1.3 per cent in 2015.
                                                                                             3.0
 f 2016, 1.5 billion people were reported to require mass or individual treatment and care
fIn
 for neglected tropical diseases, down from 1.6 billion in 2015 and 2 billion in 2010.
                                                                                             2.0
 f
fUnsafe  drinking water, unsafe sanitation and lack of hygiene continue to be major
 contributors to global mortality, resulting in about 870,000 deaths in 2016. These
                                                                                              1.0
 deaths were mainly caused by diarrhoeal diseases, but also from malnutrition and
 intestinal nematode infections.
                                                                                             0.0
 f
fGlobally, 32 million people died in 2016 due to cardiovascular disease, cancer, diabetes                0.26         2.58
 or chronic respiratory disease. The probability of dying from these causes was about
 18 per cent in 2016 for people between 30 and 70 years of age.
 f 2016, household and outdoor air pollution led to some 7 million deaths worldwide.
fIn

Health systems and funding                                                                            The world is not on track to
                                                                                                         end malaria by 2030
 f
fGlobally, almost 12 per cent of the world’s population (over 800 million people) spent
 at least one tenth of their household budgets to pay for health services in 2010, up from
                                                                                                                    216 million cases of
 9.7 per cent in 2000.
                                                                                                                    malaria in 2016
 f
fOfficial development assistance (ODA) for basic health from all donors increased by
 41 per cent in real terms since 2010, reaching $9.4 billion in 2016.
                                                                                                                    210 million cases of
 f
fAvailable data from 2005 to 2016 indicate that close to 45 per cent of all countries and                           malaria in 2013
 90 per cent of least developed countries (LDCs) have less than one physician per 1,000
 people, and over 60 per cent have fewer than three nurses or midwives per 1,000 people.

                                                                                                                      Overview                  5
Goal 4: Ensure inclusive and equitable quality education and promote lifelong
         learning opportunities for all

                              More than half    More than half of children and adolescents worldwide are not meeting minimum
                              of children and   proficiency standards in reading and mathematics. Refocused efforts are needed to
                              adolescents are   improve the quality of education. Disparities in education along the lines of gender,
                              not achieving
                              minimum           urban-rural location and other dimensions still run deep, and more investments in
                              proficiency       education infrastructure are required, particularly in LDCs.
           58%                in reading and
                              mathematics
                                                 f the global level, the participation rate in early childhood and primary education
                                                fAt
                                                 was 70 per cent in 2016, up from 63 per cent in 2010. The lowest rates are found in
                                                 sub‑Saharan Africa (41 per cent) and Northern Africa and Western Asia (52 per cent).
      More trained teachers are needed
            for quality education
                                                 f estimated 617 million children and adolescents of primary and lower secondary
                                                fAn
Percentage of trained
teachers in primary education
                                                 school age worldwide—58 per cent of that age group—are not achieving minimum
100                                              proficiency in reading and mathematics.
         85%
 80
                    71%                          f 2016, an estimated 85 per cent of primary school teachers worldwide were trained;
                                                fIn
                            61%
 60                                              the proportion was only 71 per cent for Southern Asia and 61 per cent for sub-Saharan
 40
                                                 Africa.

 20                                              f 2016, only 34 per cent of primary schools in LDCs had electricity and less than
                                                fIn
  0                                              40 per cent were equipped with basic handwashing facilities.
         World   Southern Sub-Saharan
                   Asia      Africa

Goal 5: Achieve gender equality and empower all women and girls

    Child marriage in Southern Asia             While some forms of discrimination against women and girls are diminishing, gender
    decreased by over 40 per cent               inequality continues to hold women back and deprives them of basic rights and
       between 2000 and 2017
                                                opportunities. Empowering women requires addressing structural issues such as unfair
                                                social norms and attitudes as well as developing progressive legal frameworks that
                                  40%           promote equality between women and men.

                                                 f
                                                fBased  on 2005–2016 data from 56 countries, 20 per cent of adolescent girls aged 15
                                                 to 19 who have ever been in a sexual relationship experienced physical and/or sexual
                                                 violence by an intimate partner in the 12 months prior to the survey.
         2000         2017
                                                 f
                                                fGlobally, around 2017, an estimated 21 per cent of women between 20 and 24 years of
                                                 age reported that they were married or in an informal union before age 18. This means
                                                 that an estimated 650 million girls and women today were married in childhood. Rates of
         3x                                      child marriage have continued to decline around the world. In Southern Asia, a girl’s risk
                                                 of marrying in childhood has dropped by over 40 per cent since around 2000.
                        Women spend
                        about three times
                        as many hours            f
                                                fAround  2017, one in three girls aged 15 to 19 had been subjected to female genital
                        in unpaid domestic       mutilation in the 30 countries where the practice is concentrated, compared to nearly
                        and care work
                                                 one in two around 2000.
                        as men
                                                 f
                                                fBased  on data between 2000 and 2016 from about 90 countries, women spend roughly
                                                 three times as many hours in unpaid domestic and care work as men.

                                                 f
                                                fGlobally, the percentage of women in single or lower houses of national parliament has
                                                 increased from 19 per cent in 2010 to around 23 per cent in 2018.

6            The Sustainable Development Goals Report 2018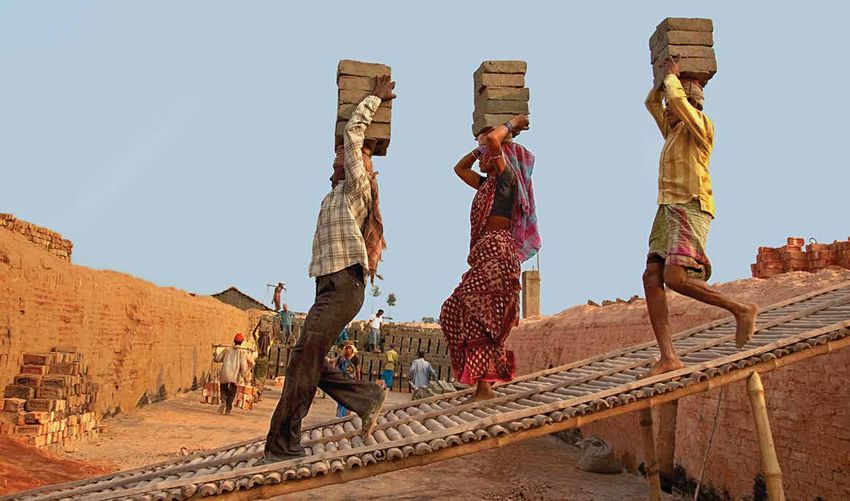
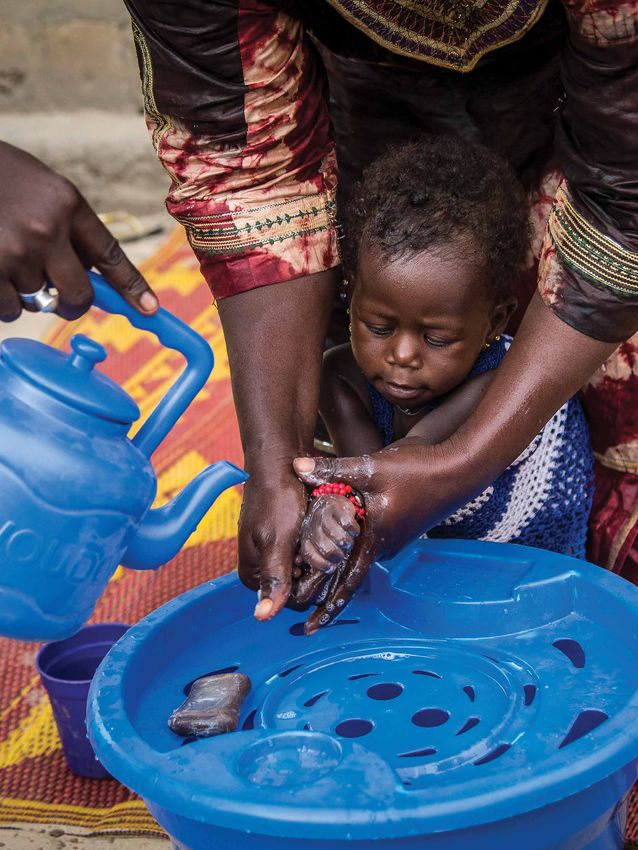
Goal 6: Ensure availability and sustainable management of water and sanitation for all

Too many people still lack access to safely managed water supplies and sanitation                     3 in 10 people lack access to
                                                                                                 safely managed drinking water services
facilities. Water scarcity, flooding and lack of proper wastewater management also
hinder social and economic development. Increasing water efficiency and improving water
management are critical to balancing the competing and growing water demands from
various sectors and users.

 f 2015, 29 per cent of the global population lacked safely managed drinking water
fIn
 supplies, and 61 per cent were without safely managed sanitation services. In 2015,
 892 million people continued to practise open defecation.                                              6 in 10 people lack access
                                                                                                  to safely managed sanitation facilities
 f 2015, only 27 per cent of the population in LDCs had basic handwashing facilities.
fIn

 f
fPreliminary estimates from household data of 79 mostly high- and high-middle-income
 countries (excluding much of Africa and Asia) suggest that 59 per cent of all domestic
 wastewater is safely treated.

 f 22 countries, mostly in the Northern Africa and Western Asia region and in the
fIn
 Central and Southern Asia region, the water stress level is above 70 per cent, indicating
 the strong probability of future water scarcity.
                                                                                                                        Data from
                                                                                                                        79 countries show
 f 2017–2018, 157 countries reported average implementation of integrated water
fIn                                                                                                                     59 per cent of all
 resources management of 48 per cent.                                                                                   wastewater is
                                                                                                                        safely treated
 f
fBased on data from 62 out of 153 countries sharing transboundary waters, the average
 percentage of national transboundary basins covered by an operational arrangement
 was only 59 per cent in 2017.

   Goal 7: Ensure access to affordable, reliable, sustainable and modern energy for all

Ensuring access to affordable, reliable and modern energy for all has come one step                55 per cent of renewable energy
closer due to recent progress in electrification, particularly in LDCs, and improvements in     was derived from modern forms in 2015
industrial energy efficiency. However, national priorities and policy ambitions still need to
be strengthened to put the world on track to meet the energy targets for 2030.

 f
fFrom  2000 to 2016, the proportion of the global population with access to electricity
 increased from 78 per cent to 87 per cent, with the absolute number of people living
 without electricity dipping to just below 1 billion.

 f the least developed countries, the proportion of the people with access to electricity
fIn
 more than doubled between 2000 and 2016.

 f 2016, 3 billion people (41 per cent of the world’s population) were still cooking with
fIn
 polluting fuel and stove combinations.                                                              4 in 10 people still lack access
                                                                                                to clean cooking fuels and technologies
 f
fThe  share of renewables in final energy consumption increased modestly, from
 17.3 per cent in 2014 to 17.5 per cent in 2015. Yet only 55 per cent of the renewable share
 was derived from modern forms of renewable energy.

 f
fGlobal energy intensity decreased by 2.8 per cent from 2014 to 2015, double the rate of
 improvement seen between 1990 and 2010.

                                                                                                                  Overview            7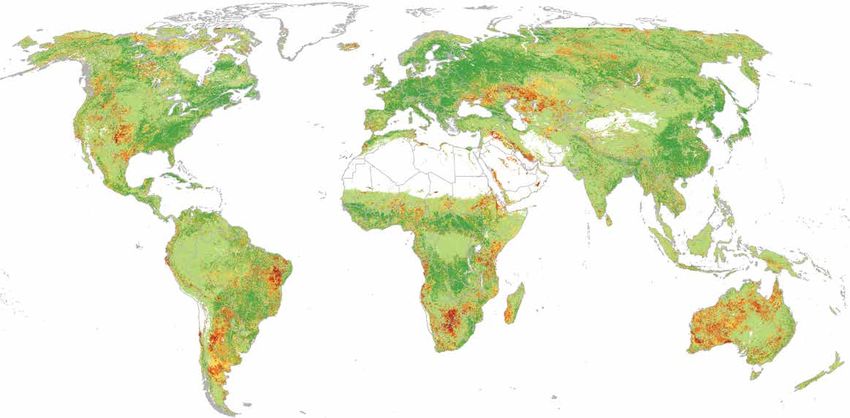
Goal 8: Promote sustained, inclusive and sustainable economic growth, full
           and productive employment and decent work for all

 Earning inequalities are still pervasive:      Globally, labour productivity has increased and the unemployment rate has decreased.
  men earned 12.5 per cent more than            However, more progress is needed to increase employment opportunities, especially for
women in 40 out of 45 countries with data
                                                young people, reduce informal employment and labour market inequality (particularly
                                                in terms of the gender pay gap), promote safe and secure working environments, and
                                                improve access to financial services to ensure sustained and inclusive economic growth.
                                                 f 2016, real gross domestic product (GDP) per capita grew at 1.3 per cent globally, less
                                                fIn
                                                 than the 1.7 per cent average growth rate recorded in 2010–2016. For LDCs, the rate fell
                                                 sharply from 5.7 per cent in 2005–2009 to 2.3 per cent in 2010–2016.
                                                 f
                                                fLabour productivity at the global level, measured as output produced per employed
                                                 person in constant 2005 US dollars, grew by 2.1 per cent in 2017. This is the fastest
                                                 growth registered since 2010.
   Youth were three times more likely
  to be unemployed than adults in 2017           f
                                                fGlobally, 61 per cent of all workers were engaged in informal employment in 2016.
                                                 Excluding the agricultural sector, 51 per cent of all workers fell into this employment
                                                 category.
Adults           4.3%                            f
                                                fData from 45 countries suggest that gender inequality in earnings is still pervasive: in
                                                 89 per cent of these countries, the hourly wages of men are, on average, higher than
                                                 those of women, with a median pay gap of 12.5 per cent.
                                                 f
                                                fThe  global unemployment rate in 2017 was 5.6 per cent, down from 6.4 per cent in
Youth                         13%
                                                 2000. The decline has slowed since 2009, when it hit 5.9 per cent. Youth are three
                                                 times more likely to be unemployed than adults, with the global youth unemployment
                                                 rate at 13 per cent in 2017.
                                                 f high-income countries, almost every adult has an account at a bank or other financial
                                                fIn
                                                 institution, compared to only 35 per cent of adults in low-income countries. Across all
                                                 regions, women lag behind men in this regard.

  Goal 9: Build resilient infrastructure, promote inclusive and sustainable
           industrialization and foster innovation

CO2 emissions intensity (kg CO2/USD)            Steady progress has been made in the manufacturing industry. To achieve inclusive
0.50                      Global carbon         and sustainable industrialization, competitive economic forces need to be unleashed to
                          intensity decreased   generate employment and income, facilitate international trade and enable the efficient
                          by 19 per cent
                          between 2000
                                                use of resources.
          0.38
                          and 2015
0.35                                             f
                                                fThe global share of manufacturing value added in GDP increased from 15.2 per cent in
                           0.31
                                                 2005 to 16.3 per cent in 2017, driven by the fast growth of manufacturing in Asia.

                                                 f
                                                fGlobally, the carbon intensity decreased by 19 per cent from 2000 to 2015—
0.20
          2000            2015
                                                 from 0.38 to 0.31 kilograms of carbon dioxide per dollar of value added.

                                                 f 2015, medium-high- and high-technology sectors accounted for 44.7 per cent of
                                                fIn
   Proportion of population covered by           total manufacturing value added globally. The value added reached 34.6 per cent in
   a 3G mobile broadband network was             developing economies, up from 21.5 per cent in 2005.
        lower in the LDCs in 2016
         LDCs                 Globally           f 2016, the proportion of the population covered by a third generation (3G) mobile
                                                fBy
                                                 broadband network stood at 61 per cent in the LDCs and 84 per cent globally.

         61%                      84%

  8             The Sustainable Development Goals Report 2018
Goal 10: Reduce inequality within and among countries
Efforts have been made in some countries to reduce income inequality, increase zero-tariff Products exported by SIDS facing
access for exports from LDCs and developing countries, and provide additional assistance zero tarrifs increased by 20 per cent
between 2010 and 2016
to LDCs and small island developing States (SIDS). However, progress will need to
accelerate to reduce growing disparities within and among countries.
f
fBetween 2010 and 2016, in 60 out of 94 countries with data, the incomes of the poorest
40 per cent of the population grew faster than those of the entire population.
f 2016, over 64.4 per cent of products exported by LDCs to world markets and
fIn
64.1 per cent of those from SIDS faced zero tariffs, an increase of 20 per cent since
2010. Developing countries overall had duty-free market access for about 50 per cent of
all products exported in 2016.
f 2016, receipts by developing countries from member countries of the Development
fIn Remittances to low- and middle-income
countries represented over 75 per cent
Assistance Committee of the OECD, multilateral agencies and other key providers of total global remittances in 2017
totalled $315 billion; of this amount, $158 billion was ODA. In 2016, total ODA to LDCs
and SIDS from all donors totalled $43.1 billion and $6.2 billion, respectively.
f
fBased on provisional data, among the $613 billion in total remittances recorded in 2017,
$466 billion went to low- and middle-income countries. While the global average cost of
$466 billion
sending money has gradually declined in recent years, it was estimated at 7.2 per cent in
2017, more than double the target transaction cost of 3 per cent.
Goal 11: Make cities and human settlements inclusive, safe, resilient and sustainable
Many cities around the world are facing acute challenges in managing rapid urbanization— In 2016, 4.2 million people died from
from ensuring adequate housing and infrastructure to support growing populations, ambient air pollution
to confronting the environmental impact of urban sprawl, to reducing vulnerability to
disasters.
f
fBetween 2000 and 2014, the proportion of the global urban population living in slums
dropped from 28.4 per cent to 22.8 per cent. However, the actual number of people
living in slums increased from 807 million to 883 million.
f
fBased on data collected for 214 cities/municipalities, about three quarters of municipal
solid waste generated is collected.
f 2016, 91 per cent of the urban population worldwide were breathing air that did not
fIn Damage to housing due to natural disasters
showed a statistically significant rise
meet the World Health Organization air quality guidelines value for particulate matter
between 1990 and 2013
(PM 2.5); more than half were exposed to air pollution levels at least 2.5 times higher
than that safety standard. In 2016, an estimated 4.2 million people died as a result of
high levels of ambient air pollution.
f
fFrom 1990 to 2013, almost 90 per cent of deaths attributed to internationally reported
disasters occurred in low- and middle-income countries. Reported damage to housing
attributed to disasters shows a statistically significant rise from 1990 onwards.
Overview 9Goal 12: Ensure sustainable consumption and production patterns
Decoupling economic growth from resource use is one of the most critical and complex
Globally by 2018, challenges facing humanity today. Doing so effectively will require policies that create a
108 countries
had national conducive environment for such change, social and physical infrastructure and markets,
policies on and a profound transformation of business practices along global value chains.
sustainable
consumption
and production
f
fThe per capita “material footprint” of developing countries grew from 5 metric tons in
2000 to 9 metric tons in 2017, representing a significant improvement in the material
standard of living. Most of the increase is attributed to a rise in the use of non-metallic
minerals, pointing to growth in the areas of infrastructure and construction.
f all types of materials, developed countries have at least double the per capita
fFor
footprint of developing countries. In particular, the material footprint for fossil fuels is
93 per cent of the more than four times higher for developed than developing countries.
world’s 250 largest
companies are now f 2018, a total of 108 countries had national policies and initiatives relevant
fBy
reporting to sustainable consumption and production.
on sustainability
f
fAccording to a recent report from KPMG, 93 per cent of the world’s 250 largest
companies (in terms of revenue) are now reporting on sustainability, as are three
quarters of the top 100 companies in 49 countries.
Goal 13: Take urgent action to combat climate change and its impacts
2017 was the most costly North Atlantic The year 2017 was one of the three warmest on record and was 1.1 degrees Celsius above
hurricane season on record the pre-industrial period. An analysis by the World Meteorological Organization shows
that the five-year average global temperature from 2013 to 2017 was also the highest on
record. The world continues to experience rising sea levels, extreme weather conditions
(the North Atlantic hurricane season was the costliest ever recorded) and increasing
concentrations of greenhouse gases. This calls for urgent and accelerated action by
countries as they implement their commitments to the Paris Agreement on Climate
Change.
f of 9 April 2018, 175 Parties had ratified the Paris Agreement and 168 Parties
fAs
(167 countries plus the European Commission) had communicated their first nationally
The majority of countries have ratified the determined contributions to the United Nations Framework Convention on Climate
Paris Agreement and provided nationally Change Secretariat.
determined contributions (NDCs)
175 168 f addition, as of 9 April 2018, 10 developing countries had successfully completed and
fIn
submitted the first iteration of their national adaptation plans for responding to climate
change.
f
fDeveloped country Parties continue to make progress towards the goal of jointly
mobilizing $100 billion annually by 2020 to address the needs of developing countries
in the context of meaningful mitigation actions.
Ratified Paris NDCs
Agreement
10 The Sustainable Development Goals Report 2018Goal 14: Conserve and sustainably use the oceans, seas and marine resources
for sustainable development
Advancing the sustainable use and conservation of the oceans continues to require Mean coverage of marine KBAs increased
effective strategies and management to combat the adverse effects of overfishing, growing between 2000 and 2018
ocean acidification and worsening coastal eutrophication. The expansion of protected 50
44%
areas for marine biodiversity, intensification of research capacity and increases in ocean
science funding remain critically important to preserve marine resources. 30%
f
fThe global share of marine fish stocks that are within biologically sustainable levels 25
declined from 90 per cent in 1974 to 69 per cent in 2013.
f
fStudies at open ocean and coastal sites around the world show that current levels of
0
marine acidity have increased by about 26 per cent on average since the start of the 2000 2018
Industrial Revolution. Moreover, marine life is being exposed to conditions outside
previously experienced natural variability. Open ocean sites show current levels
of acidity have increased by 26 per cent
f
fGlobal trends point to continued deterioration of coastal waters due to pollution and since the start of the Industrial Revolution
eutrophication. Without concerted efforts, coastal eutrophication is expected to
increase in 20 per cent of large marine ecosystems by 2050. CO2
CO2
f of January 2018, 16 per cent (or over 22 million square kilometres) of marine
fAs CO2
CO2
waters under national jurisdiction—that is, 0 to 200 nautical miles from shore—were
covered by protected areas. This is more than double the 2010 coverage level. The
mean coverage of marine key biodiversity areas (KBAs) that are protected has also
increased—from 30 per cent in 2000 to 44 per cent in 2018.
Goal 15: Protect, restore and promote sustainable use of terrestrial ecosystems,
sustainably manage forests, combat desertification, and halt and reverse
land degradation and halt biodiversity loss
Protection of forest and terrestrial ecosystems is on the rise, and forest loss has slowed. Land degradation threatens the security
That said, other facets of terrestrial conservation continue to demand accelerated action to and development of all countries
protect biodiversity, land productivity and genetic resources and to curtail the loss of species.
f
fThe Earth’s forest areas continue to shrink, down from 4.1 billion hectares in 2000 (or
31.2 per cent of total land area) to about 4 billion hectares (30.7 per cent of total land area)
in 2015. However, the rate of forest loss has been cut by 25 per cent since 2000–2005.
f
fAbout one fifth of the Earth’s land surface covered by vegetation showed persistent
and declining trends in productivity from 1999 to 2013, threatening the livelihoods
of over one billion people. Up to 24 million square kilometres of land were affected,
including 19 per cent of cropland, 16 per cent of forest land, 19 per cent of grassland and
28 per cent of rangeland. The Red List Index shows alarming
trend in biodiversity decline for mammals,
f
fSince 1993, the global Red List Index of threatened species has fallen from 0.82 to birds, amphibians, corals and cycads
0.74, indicating an alarming trend in the decline of mammals, birds, amphibians, corals
and cycads. The primary drivers of this assault on biodiversity are habitat loss from 1.0
unsustainable agriculture, deforestation, unsustainable harvest and trade, and invasive 0.9
alien species.
better
0.8
f
fIllicit poaching and trafficking of wildlife continues to thwart conservation efforts,
with nearly 7,000 species of animals and plants reported in illegal trade involving 0.7
worse
120 countries. 0.6
f 2016, bilateral ODA in support of biodiversity totalled $7 billion, a decrease of
fIn 0.5
21 per cent in real terms from 2015. 1980 1992 2004 2016
Overview 11Goal 16: Promote peaceful and inclusive societies for sustainable development,
provide access to justice for all and build effective, accountable and inclusive
institutions at all levels
More than 570 different trafficking Many regions of the world continue to suffer untold horrors as a result of armed conflict
in persons flows were detected between or other forms of violence that occur within societies and at the domestic level. Advances
2012 and 2014
in promoting the rule of law and access to justice are uneven. However, progress is
being made in regulations to promote public access to information, albeit slowly, and in
strengthening institutions upholding human rights at the national level.
f
fNearly 8 in 10 children aged 1 to 14 years were subjected to some form of psychological
aggression and/or physical punishment on a regular basis at home in 81 countries
(primarily developing), according to available data from 2005 to 2017. In all but seven of
these countries, more than half of children experienced violent forms of discipline.
f
fMore than 570 different flows involving trafficking in persons were detected between
Proportion of 2012 and 2014, affecting all regions; many involved movement from lower-income to
prisoners held
in detention higher-income countries.
without
32%
31% sentencing f 2014, the majority of detected trafficking victims were women and girls (71 per cent),
fIn
has remained and about 28 per cent were children (20 per cent girls and 8 per cent boys). Over
almost constant 90 per cent of victims detected were trafficked for sexual exploitation or forced labour.
in the last decade
2003–2005 2014–2016
f
fThe proportion of prisoners held in detention without being sentenced for a crime
remained almost constant in the last decade: from 32 per cent in 2003–2005 to
31 per cent in 2014–2016.
f
fAlmost one in five firms worldwide report receiving at least one bribery payment request
when engaged in regulatory or utility transactions.
Globally,
73 per cent f
fGlobally, 73 per cent of children under 5 have had their births registered; the proportion
of children is less than half (46 per cent) in sub‑Saharan Africa.
under 5 have
had their births f least 1,019 human rights defenders, journalists and trade unionists have been killed in
fAt
registered
61 countries since 2015. This is equivalent to one person killed every day while working
to inform the public and build a world free from fear and want.
f
fFreedom-of-information laws and policies have been adopted by 116 countries, with at
least 25 countries doing so over the last five years. However, implementation remains a
challenge.
f
fSince 1998, more than half of countries (116 of 197) have established a national human
rights institution that has been peer reviewed for compliance with internationally agreed
standards (the Paris Principles). However, only 75 of these countries have institutions
that are fully compliant.
12 The Sustainable Development Goals Report 2018Goal 17: Strengthen the means of implementation and revitalize the Global Partnership
for Sustainable Development
Goal 17 seeks to strengthen global partnerships to support and achieve the ambitious ODA for capacity-
targets of the 2030 Agenda, bringing together national governments, the international building and national
community, civil society, the private sector and other actors. Despite advances in certain planning was
$20.4 billion in 2016,
areas, more needs to be done to accelerate progress. All stakeholders will have to refocus which has been
and intensify their efforts on areas where progress has been slow. stable since 2010
f 2017, net ODA totalled $146.6 billion in 2017, a decrease of 0.6 per cent from 2016
fIn
in real terms. ODA as a share of donors’ gross national income (GNI) remained low, at
0.31 per cent.
LDCs’ share of world merchandise
f 2016, remittances to low- and lower-middle-income countries were more than three
fIn exports fell between 2013 and 2016,
times the amount of ODA they received. after a long period of increase
1.5
f LDCs, debt service as a proportion of exports of goods and services increased for five
fIn
consecutive years—from a low of 3.5 per cent in 2011 to 8.6 per cent in 2016. 1.1
0.9
f 2016, high-speed fixed-broadband reached 6 per cent of the population in developing
fIn
0.75
countries, compared to 24 per cent in developed countries.
0.6
f
fTotal ODA for capacity-building and national planning amounted to $20.4 billion in
2016, representing 18 per cent of total aid allocable by sector, a proportion that has been 0
stable since 2010. 2000 2013 2016
f
fThe developing regions’ share of world merchandise exports declined for two
consecutive years: from 45.4 per cent in 2014 to 44.2 per cent in 2016, a sharp contrast
to an average annual 1.2 percentage point increase between 2001 and 2012. For LDCs,
In 2015, developing countries received
the share of world merchandise exports decreased from 1.1 per cent to 0.9 per cent only 0.3 per cent of total ODA
between 2013 and 2016, compared to the rise from 0.6 per cent to 1.1 per cent between to support all areas of statistics
2000 and 2013.
0.3%
f 2017, 102 countries or areas were implementing national statistical plans.
fIn
Sub‑Saharan Africa remained in the lead, with 31 countries implementing such plans;
however, only three of them were fully funded.
ODA
f 2015, developing countries received $541 million in financial support from multilateral
fIn
and bilateral donors for all areas of statistics. This amount represented only 0.3 per cent
of total ODA, short of what is needed to ensure that countries in developing regions are
better equipped to implement and monitor their development agendas.
f
fDuring the decade from 2008 to 2017, 89 per cent of countries or areas conducted at
least one population and housing census.
Overview 13Interlinked nature of the Sustainable Development Goals
Three years after the adoption of the 2030 Agenda, countries Biodiversity loss is escalating. About one fifth of the Earth’s land
are taking bold actions to achieve the ambitious vision of this surface covered by vegetation showed persistent and declining trends
transformative plan. As they do so, they face daunting problems: a in productivity between 1999 and 2013. Urgent actions are needed
changing climate, conflict, inequality, persistent pockets of poverty to protect and restore ecosystems and the biodiversity they support.
and hunger, rapid urbanization and environmental degradation. These efforts can help mitigate climate change and provide increased
Policymakers in every country need to reflect on how societies can be resilience in the face of growing human pressures and mounting
made more resilient while confronting these challenges. A good place natural disasters.
to start is by establishing robust water and sanitation infrastructure, Sustainable and resilient societies will also require the establishment
ensuring access to clean and affordable energy, building safe and of strong national frameworks for sustainable consumption and
ecologically friendly cities, protecting ecosystems, and instituting production, environmentally sensitive business practices and
sustainable consumption and production patterns. consumer behaviour, and adherence to international norms on the
Transitioning towards more sustainable and resilient societies management of hazardous chemicals and wastes. By 2018, a total
also requires an integrated approach that recognizes that these of 108 countries had national policies and initiatives relevant to
challenges—and their solutions—are interrelated. This section sustainable consumption and production.
provides a perspective on the interlinked nature of the SDGs in the
context of the Goals and themes under review at the July 2018 high- Access to basic services is not only a fundamental
level political forum on sustainable development. human right, but also a stepping stone to sustainable
development
Transitioning towards sustainable and resilient
Every citizen has the right to safe drinking water, adequate sanitation,
societies hinges on responsible management
electricity or other forms of energy, safe transport, waste collection,
of finite natural resources
education and health care. Provision of these basic services goes
Land- and water-based ecosystems and the rich biodiversity they hand-in-hand with economic growth, social inclusion, poverty
support provide food, clean water and air, and raw materials that fuel reduction and equality. For example, reliable road and transport
economic growth. They provide natural sites for human settlements networks connect farmers in poor and remote communities to major
and mitigate climate change. However, population growth, agricultural markets, and make health and education services more
agricultural intensification, urbanization and industrial production are accessible.
creating competition for natural resources, including land and water. Globally, significant strides have been made in improving the quality
Overuse is contributing to their rapid depletion and consequent of and access to basic services, while making them more inclusive.
environmental degradation. However, in many countries, the poor and most vulnerable have been
More than 2 billion people are affected by water stress, which will left behind. In 2015, 4.5 billion people (61 per cent of the world’s
only increase with population growth and the effects of climate population) still lacked access to safely managed sanitation services,
change. Agriculture accounts for almost 70 per cent of global water and 892 million people—mostly in rural areas of Southern Asia and
withdrawal, which is projected to increase significantly to meet food sub‑Saharan Africa—practised open defecation.
needs. That same year, about 2.1 billion people (29 per cent of the world’s
This poses a fundamental challenge to sustainable development. population) lacked access to safely managed drinking water supplies.
Effective implementation of integrated water resources management In situations where water must be collected outside the home,
(IWRM) at all levels is critical to reversing this situation. In 2017, women bear primary responsibility. A study of 25 sub‑Saharan
157 countries reported average IWRM implementation of less than countries found that each day women spend a combined total
50 per cent, highlighting the need for accelerated action and of at least 16 million hours collecting drinking water, men spend
increased financing for water resources management. 6 million hours on this task, and children spend 4 million hours.
Forests cover 31 per cent of the world’s land area, and forested This burden leaves women less time to engage in other activities,
watersheds and wetlands supply almost 75 per cent of the world’s such as attending school or participating in the labour market. The
fresh water. Forests also play a central role in building and maintaining situation is much worse in areas affected by conflict, where walking
soil fertility, slowing land degradation, halting landslides in long distances to gather water or fuelwood often puts women and
mountainous areas and protecting against certain natural disasters. children in harm’s way.
Studies show that, in 2011, the economic value of forests globally was One billion people (13 per cent of the global population) are currently
an estimated $16.2 trillion. Deforestation and forest degradation are living without electricity. Rural residents make up 87 per cent of the
still a concern, pointing to the need to fully implement sustainable global deficit in access to electricity, which is strongly associated
forest and land management practices. with poverty. Access rates are four times higher in the wealthiest
14 The Sustainable Development Goals Report 201820 per cent of households compared to the bottom quintile in the A resilient society can deflect the threat of conflict
20 countries with the largest access deficits. Three billion people,
Over the last decade, the number of violent conflicts has increased
mostly women and children, are still cooking with polluting fuel and
significantly, leading to the forced displacement of millions of people
inefficient stoves, adversely affecting their health and well-being.
(the number in 2017 reached another record high of 68.5 million).
Improving the lives of the poor and most vulnerable requires According to recent analyses, one of the effects of conflict is a
significant investments in quality basic services. rise in hunger and food insecurity. And for the first time in more
than a decade, the number of people who are undernourished has
increased—from 777 million in 2015 to 815 million people in 2016.
Social protection systems provide a safety net Conflict is one of the main drivers of food insecurity in 18 countries,
for the vulnerable where 74 million people are in need of urgent humanitarian assistance.
Challenges to sustainability and resilience manifest themselves Forced displacement as a result of conflict also influences
differently for different population groups. Social protection systems urbanization patterns, particularly slum formation. In countries
can have a levelling effect. They help prevent and reduce poverty and around the world, from Asia to Africa, people displaced from
inequality at every stage of people’s lives and make societies more conflict are finding their way to slums, where even basic water and
inclusive and stable. Despite significant progress in many parts of the sanitation facilities are scarce, and where thousands of people live in
world in extending social protection, the human right to social security uninhabitable conditions.
is not yet a reality for most people. Based on 2016 estimates, only 45 While the causes of conflict vary widely, the effects of climate change
per cent of the world’s population were effectively covered by at least only exacerbate them. Climate-related events such as drought
one social protection cash benefit, leaving 4 billion people behind. threaten food and water supplies, increase competition for these and
other natural resources and create civil unrest, potentially adding fuel
In 2016, only 22 per cent of the unemployed received unemployment to the already-disastrous consequences of conflict.
cash benefits, 28 per cent of persons with severe disabilities collected
Investing in good governance, improving the living conditions of
disability cash benefits, 35 per cent of children were covered by
people, reducing inequality and strengthening the capacities of
some form of social protection, and 41 per cent of women giving birth
communities can help build resilience to the threat of conflict and
received maternity cash benefits. Although 68 per cent of people
maintain peace in the event of a violent shock or long-term stressor.
above retirement age received a pension, the benefits were often not
enough to lift older people out of poverty. Major work lies ahead to
ensure social protection for all who need it. Migration can work for all in building more inclusive
and sustainable societies
Globally, the number of international migrants reached an estimated
The path to resilient cities must address growing
258 million in 2017, up from 173 million in 2000. Migration
social, economic and environmental challenges
contributes to inclusive and sustainable economic growth and
Since 2008, more than half the world’s population has lived in urban development, in both countries of origin and destination. In 2017,
areas, a proportion that is expected to rise to 60 per cent by 2030. remittance flows to low- and middle-income countries reached
Cities and metropolises are engines of growth, generating nearly $466 billion, more than three times the amount of ODA they
80 per cent of global GDP. But they also face mounting problems: received that year. Remittances constitute a significant source
increasing air pollution, unplanned land use, growing populations of household income, improving the situation of families and
living in slums and lack of basic services. communities through investments in education, health, sanitation,
housing and infrastructure. Countries of destination also benefit, since
In addition, climate change has increased the frequency and severity migrants often fill critical labour gaps, create jobs as entrepreneurs,
of natural disasters. With their dense populations and growing and pay taxes and social security contributions. Rising above
concentration of economic activities, cities are becoming more adversity, many migrants become the most dynamic members of
vulnerable to such disasters. By 2050, an estimated 680 million society, contributing to the development of science and technology
people will be exposed to cyclones and 870 million to earthquakes— and enriching their host communities by adding to cultural diversity.
an increase from 310 million and 370 million, respectively, in 2000.
Nevertheless, many migrants remain highly vulnerable, and
Urban habitats in small island developing States are the fragile areas
investments in sustainable and resilient societies will benefit them
where urbanization, vulnerability to natural disasters, and climate
as well. Improving living conditions in countries of origin will help
change intersect, with often dire consequences. In the Caribbean for
minimize the adverse drivers that compel people to leave their homes.
instance, more than half the population live within 1.5 kilometres of
In countries of destination, providing universal access to basic services
the sea. This resulted in record economic losses in 2017’s catastrophic
such as education, health care and social protection ensures that the
North Atlantic hurricane season.
human rights of migrants will also be respected, empowering them to
With sound urban planning and management, cities can become become productive members of society. A win-win situation for all.
inclusive, safe, resilient and sustainable as well as dynamic hubs of
innovation and enterprise. Globally, 152 countries have national urban
policies in place to promote more coordinated and interconnected
urban development that sets the stage for sustainable urbanization.
More work is still needed to ensure effective implementation of such LIU Zhenmin
policies. Under-Secretary-General for Economic and Social Affairs
Overview 15A data revolution in motion
On 6 July 2017, the United Nations General Assembly adopted The first step in developing these plans or strategies for SDG
a global indicator framework to monitor the 2030 Agenda for indicators is an assessment of a country’s statistical capacity through
Sustainable Development as a voluntary and country-led endeavour. consultations with all members of the national statistical system.
The 232 global indicators are complemented by indicators at the The United Nations Statistics Division in the Department of Economic
regional and national levels developed by United Nations Member and Social Affairs carried out such an assessment as part of a pilot
States. Data from national statistical and data systems are the basis project in six countries—three in Africa and three in Asia. It revealed
for the compilation of global indicators. that, on average, data for only 40 of the applicable global SDG
indicators (20 per cent) are currently available; another 47 global
Such systems around the world have been the source of many
indicators (23 per cent) are considered easily feasible, meaning that
important initiatives to develop new tools and frameworks to
the data source is, in principle, available. Moreover, existing capacity
integrate new data sources, with the aim of fully harnessing the power
is heavily reliant on external assistance. Additional resources are
of the data revolution and achieving the Goals and targets of the
required to monitor additional indicators.
2030 Agenda. These efforts are especially important in identifying
those left furthest behind, since data are increasingly disaggregated
by income, sex, age, race, ethnicity, migratory status, disability, Standards for SDG data and metadata exchange will
geographic location and other characteristics. This type of detailed improve transparency and efficiency
information is the basis upon which effective policies are shaped.
Working with data for the full implementation and review of the
SDGs entails exchange and sharing of a large amount of data stored
Assessments of countries’ statistical capacities reveal in different databases maintained by the various producers. A
enormous challenges standard known as Statistical Data and Metadata Exchange (SDMX)
provides a common language and vocabulary for data sharing and
Since the adoption of the 2030 Agenda in September 2015,
consumption. Since October 2016, a group of experts from countries
developing countries have begun a process to mainstream the SDGs
and international agencies responsible for the development of the
into their national development plans and monitoring and evaluation
indicators have worked to develop an SDMX-based standard for SDG
frameworks. Countries have also developed indicator frameworks
data exchange.
to review progress towards the Goals. In many national statistical
systems, the data requirements for the SDG indicators are being The first draft data structure for the SDG indicators became available
added to existing work programmes and to national strategies for in early 2018. The national statistical offices of Cambodia and the
the development of statistics. The aim is to organize data producers, United Republic of Tanzania are currently piloting its use. Once
identify sources, draw attention to data gaps and launch necessary finalized, the SDMX standard is expected to be adopted by countries
capacity development activities. and international agencies to improve data exchange, dissemination
and transparency in the global and national reporting of the SDG
indicators. The standard for data will be complemented by a standard
for metadata.
Implementing a national monitoring framework
in Bangladesh
National reporting and dissemination platforms are
Since 2016, the Government of Bangladesh has actively key instruments for SDG implementation and review
implemented the SDG national monitoring framework. A
principal coordinator position was created within the Office Tools to gather, present and disseminate SDG data are key to
of the Prime Minister to spearhead the process and forge ensuring their extensive and effective use by policymakers. National
coordination. Many parts of the government, including the reporting and dissemination platforms for SDGs are indispensable to
General Economics Division of the Planning Commission and policymakers and, indeed, to all stakeholders for understanding where
the Bangladesh Bureau of Statistics have published reports progress is being made and informing future interventions. They also
to identify and map data gaps and integrate the global SDG serve a critical function in national data compilation, since they bring
indicators into the Seventh Five-Year Plan (2016–2020). together data and metadata from across the entire statistical system.
This helps ensure data quality and improve coordination of the
The data gap analysis found that data on 70 indicators are
national statistical system.
available, and 108 can be generated by modifying existing
censuses and surveys (for disaggregation). An additional In the past, initiatives to set up online national reporting and
63 indicators will require new surveys or censuses to generate dissemination platforms have delivered mixed results for users. A
information for measuring performance in reaching SDG targets. conference in early 2018 brought together more than 60 experts from
national statistical offices, international and regional organizations
16 The Sustainable Development Goals Report 2018that support reporting and dissemination platforms in countries, as
well as donors and other solution-providers. The conference focused Providing access to geospatial and statistical data
on users’ needs, reviewed best practices and showcased solutions and through an SDG data hub
possible ways forward for countries. The meeting produced principles
In November 2017, Ireland launched its national Hub for
and guidelines for the development and implementation of national
Sustainable Development Goals, an online platform that
reporting and dissemination platforms to guide countries in the
provides access to over 100 layers of geo-statistical data, data
establishment of their national platforms.
visualization tools and web applications relating to specific SDG
targets. The hub is part of a broader collaboration initiated in
September 2016 between the Central Statistics Office of Ireland
and Ordnance Survey Ireland. The hub provides open and
Designing a free, reusable and customizable transparent access to integrated geospatial and statistical data
national reporting platform for the SDGs in support of the government’s agenda for public-sector reform.
This collaboration is clearly a boon to all stakeholders, enabling
In 2016, the United States General Services Administration
synergies across national authorities responsible for the
collaborated with the Office of Management and Budget to
production and dissemination of geospatial and statistical data.
develop and launch an online national reporting platform for
At the same time, it demonstrates the value of visualizing SDG
the SDGs. The innovation behind the initiative is the adaptation
statistical data within a geospatial context and re-purposing
of an existing product with an established open-source
existing systems and architectures to combine text, graphs and
community, offering a solution that is country-led, free for any
maps to tell data stories. This tool is helping galvanize action for
country or organization to replicate and fully customizable. The
the implementation of the 2030 Agenda at local and national
Office for National Statistics in the United Kingdom further
levels. For more information, see: http://irelandsdg.geohive.ie/.
developed the tool and established it as its own national
reporting platform for the SDGs. New enhancements include
the ability to display disaggregated data for indicators—a The United Nations World Data Forum is bringing
feature that helps identify and prioritize those furthest behind. data communities together
Both online platforms are works in progress. The USA-UK
Bringing together different data communities of producers and users,
collaboration continues to support other countries in adopting
and harnessing the power of technology and other innovative tools
their platforms and developing additional features, such as
are essential to fulfilling the data demands of the 2030 Agenda. The
enhanced data visualization. For more information, see: https://
United Nations World Data Forum provides a space in which all data
sdg.data.gov/ and https://sustainabledevelopment-uk.github.io.
producers can come together as a community, have a productive
dialogue with users and policymakers, and identify ways to mobilize
the necessary resources for data development. The forum was
established by the United Nations Statistical Commission—an
Using geospatial data can ensure that no one
intergovernmental body comprising national statistical authorities
is left behind
from around the world—to allow all data producers, including those
Among the different categories of disaggregation called for in the outside the traditional statistical systems, to present innovative
2030 Agenda, “place”, or geographic location, is critical for ensuring approaches for data compilation, processing and communication.
that no one is left behind. Geographic location is needed to know Capacity development and resource mobilization for data are central
where a situation is present or where an event has occurred, and to to the activities of the United Nations World Data Forum. Capacity
allow decision makers to respond. Since 2011, the United Nations development is guided by the Cape Town Global Action Plan,
has made great strides in strengthening the global data ecosystem launched at the first forum in 2017. The results of a joint survey—
by establishing the United Nations Committee of Experts on Global undertaken by the Partnership in Statistics for Development in the
Geospatial Information Management. The geospatial community, 21st Century and the High-level Group for Partnership, Coordination
working closely with the statistical community, has investigated how and Capacity-Building for Statistics for the 2030 Agenda for
geospatial information can be used for improving the production of Sustainable Development—are a powerful reminder of the capacity
many SDG indicators. needs of developing countries. Countries report that at the top of their
list of most urgent needs are improved use of administrative data,
The integration of geospatial information with data and statistics for
better disaggregation by disability, among other dimensions, and
SDGs is also instrumental in enabling data inter-operability across
statistics related to income, poverty and the environment.
data ecosystems and linking data sets within and across countries.
National statistical offices and national geospatial agencies are now The second United Nations World Data Forum will take place in
collaborating to establish a Federated Information System for the October 2018 in Dubai, United Arab Emirates. It will build on the
SDGs. This hub will be a repository for national SDG information and success of the first forum, focusing on the following thematic areas:
will also transmit this information to a global data hub. ff New approaches to capacity development for better data
ff Innovations and synergies across data ecosystems
ff Leaving no one behind
ff Understanding the world through data
ff Building trust in data and statistics
ff How far have we come?
A data revolution in motion 17You can also read