AIR POLLUTION Opportunities to Better Sustain and Modernize the National Air Quality Monitoring System - Report to Congressional Requesters
←
→
Page content transcription
If your browser does not render page correctly, please read the page content below
United States Government Accountability Office
                Report to Congressional Requesters

November 2020

                AIR POLLUTION

                Opportunities to
                Better Sustain and
                Modernize the
                National Air Quality
                Monitoring System
                Accessible Version

GAO-21-38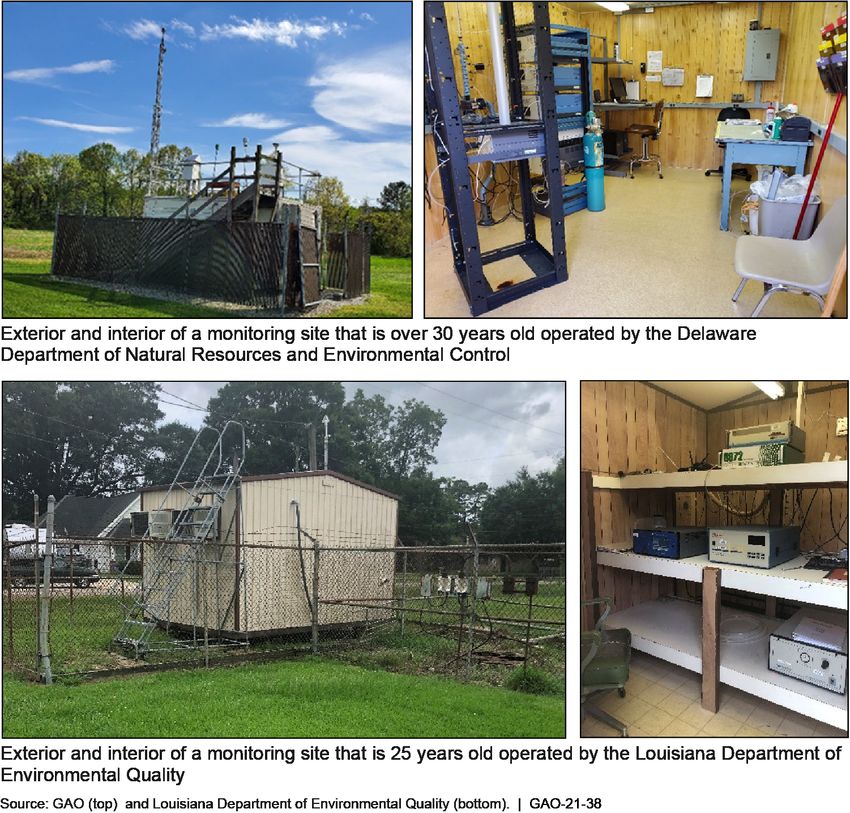
November 2020

                                                AIR POLLUTION

                                                Opportunities to Better Sustain and Modernize the
                                                National Air Quality Monitoring System
Highlights of GAO-21-38, a report to
congressional requesters

Why GAO Did This Study                          What GAO Found
The national ambient air quality                The ambient air quality monitoring system is a national asset that provides
monitoring system shows that the                standardized information for implementing the Clean Air Act and protecting public
United States has made progress in              health. The Environmental Protection Agency (EPA) and state and local agencies
reducing air pollution but that risks to        cooperatively manage the system, with each playing different roles in design,
public health and the environment               operation, oversight, and funding. For example, EPA establishes minimum
continue in certain locations. The              requirements for the system, and state and local agencies operate the monitors
system consists of sites that measure
                                                and report data to EPA.
air pollution levels around fixed
locations across the country using              Officials from EPA and selected state and local agencies identified challenges
specific methods. Since the system              related to sustaining the monitoring system. For example, they said that
began in the 1970s, air quality                 infrastructure is aging while annual EPA funding for state and local air quality
concerns have changed—such as                   management grants, which cover monitoring, has decreased by about 20 percent
increased concern about the health              since 2004 after adjusting for inflation (see fig.). GAO found inconsistencies in
effects of air toxics.                          how EPA regions have addressed these challenges. GAO’s prior work has
GAO was asked to evaluate the                   identified key characteristics of asset management, such as identifying needed
national air quality monitoring system.         resources and using quality data to manage infrastructure risks, which can help
This report examines the role of the            organizations optimize limited resources. By developing an asset management
system and how it is managed,                   framework that includes such characteristics, EPA could better target limited
challenges in managing the system               resources toward the highest priorities for consistently sustaining the system.
and actions to address them, and
needs for additional air quality                Annual Inflation-Adjusted EPA Funding for State and Local Air Quality Management Grants
information and actions to address
challenges in meeting those needs.
GAO reviewed literature, laws, and
agency documents; conducted a
demonstration of low-cost sensors;
and interviewed EPA officials,
selected state and local officials,
representatives from air quality                Air quality managers, researchers, and the public need additional information so
associations, and stakeholders.                 they can better understand and address the health risks from air pollution,
What GAO Recommends                             according to GAO’s review of literature and interviews GAO conducted. These
                                                needs include additional information on (1) air toxics to understand health risks in
GAO is making two recommendations               key locations such as near industrial facilities; and (2) how to use low-cost
for EPA to (1) establish an asset               sensors to provide real-time, local-scale air quality information. EPA and state
management framework for the                    and local agencies face persistent challenges meeting such air quality
monitoring system that includes key             information needs, including challenges in understanding the performance of low-
characteristics and (2) develop an air          cost sensors. GAO illustrated this challenge by collecting air quality data from
quality monitoring modernization plan           low-cost sensors and finding variability in their performance. EPA has strategies
that aligns with leading practices. In          aimed at better meeting the additional air quality information needs of managers,
written comments on the report, EPA
                                                researchers, and the public, but the strategies are outdated and incomplete. For
generally agreed with the
                                                example, they do not clearly define roles for meeting additional information
recommendations.
                                                needs. GAO’s prior work on asset management suggests that a more strategic
                                                approach could help EPA modernize the system to better meet the additional
                                                information needs. By developing a modernization plan that aligns with leading
                                                practices for strategic planning and risk management, such as establishing
                                                modernization goals and roles, EPA could better ensure that the system meets
View GAO-21-38. For more information,           the additional information needs of air quality managers, researchers, and the
contact J. Alfredo Gómez at (202) 512-3841 or   public and is positioned to protect public health.
gomezj@gao.gov.

                                                                                            United States Government Accountability Office
                                                                 DRAFT
Contents
Letter                                                                                                        1
                                     Background                                                               4
                                     The Air Quality Monitoring System Is a National Asset That
                                        Provides Information for Protecting Public Health and Is
                                        Cooperatively Managed by EPA and State and Local Agencies             9
                                     EPA and State and Local Agencies Face Challenges Related to
                                        Sustaining the Monitoring System, and EPA Has Opportunities
                                        to Address Them More Consistently                                    25
                                     Air Quality Managers, Researchers, and the Public Need
                                        Additional Information in Four Areas to Better Understand and
                                        Address the Health Risks from Air Pollution                          39
                                     EPA and State and Local Agencies Face Persistent Challenges
                                        Meeting Additional Information Needs, and a Strategic
                                        Approach to Modernizing the Monitoring System Could Help
                                        Address Outdated and Incomplete Planning Efforts                     45
                                     Conclusions                                                             58
                                     Recommendations for Executive Action                                    59
                                     Agency Comments                                                         60

Appendix I: Potential Topics for Future Air Pollution Oversight                                              62

Appendix II: Objectives, Scope, and Methodology                                                              64

Appendix III: Additional Information on Air Quality Monitoring Information Needs                             69

Appendix IV: Comments from the Environmental Protection Agency                                               76
                                     Agency Comment Letter                                                   80

Appendix V: GAO Contacts and Staff Acknowledgments                                                           85

Appendix VI: Accessible Data                                                                                 86
                                     Data Tables                                                             86

                                     Page i                                               GAO-21-38 Air Pollution
Tables
          Table 1: National Ambient Air Quality Monitoring System                  11
          Table 2: Potential Topics for Future Air Pollution Oversight             62
          Table 3: States and Local Monitoring Agencies by Environmental
                  Protection Agency (EPA) Region Selected for
                  Semistructured Interviews                                        65
          Table 4: National and Regional Associations Representing State
                  and Local Air Monitoring Agencies                                66
          Table 5: Organizations of Knowledgeable Stakeholders Selected
                  for Semistructured Interviews                                    67

Figures
          Figure 1: Nonattainment Areas for the Ozone National Ambient Air
                   Quality Standards (NAAQS)                                        8
          Figure 2: Number of Sites Monitoring Criteria Pollutants and Key
                   EPA Actions Driving Changes                                     13
          Figure 3: Location of National Air Toxics Trends Stations                14
          Figure 4: Near Real-time Air Quality Information from AirNow.gov         17
          Figure 5: Numbers of Monitoring Sites for Criteria Pollutants and
                   Air Toxics in the Networks of Selected State and Local
                   Air Quality Monitoring Agencies                                 20
          Figure 6: Examples of Air Monitoring Sites and Monitoring
                   Equipment                                                       21
          Figure 7: Annual EPA Grant Funding for State and Local Air
                   Quality Management, Which Includes Air Quality
                   Monitoring                                                      27
          Figure 8: Examples of Aging Monitoring Infrastructure                    31
          Figure 9: Low-Cost Sensors Deployed on the GAO Building                  42
          Figure 10: Satellite Information Tracking the Movement of Wildfire
                   Smoke                                                           44
          Figure 11: Differences in PM2.5 Sensor Measurements from Two
                   Sensors in the Same Location                                    50
          Figure 12: Example of a Mobile Air Quality Monitoring Unit               70
          Figure 13: Comparison of PM2.5 Data from a Low-Cost Sensor on
                   the GAO Building and an EPA-Overseen Monitor 2 Miles
                   Away                                                            74
          Figure 14: Local Influences on Measurements from a Low-Cost
                   Sensor on the GAO Building                                      75
          Data Table for Annual Inflation-Adjusted EPA Funding for State
                   and Local Air Quality Management Grants                         86

          Page ii                                               GAO-21-38 Air Pollution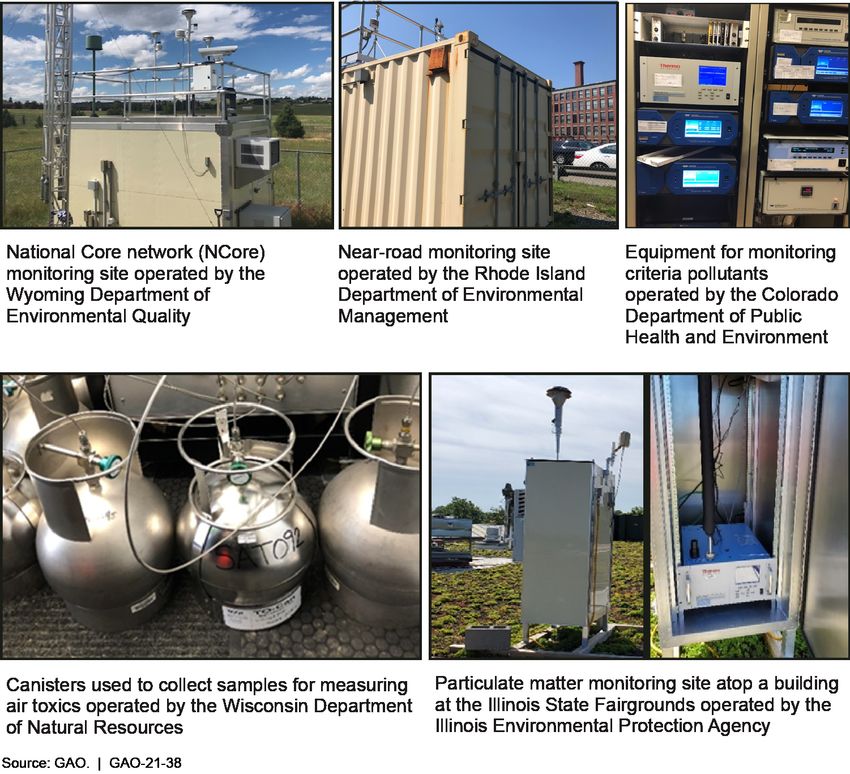
Data Table for Figure 2: Number of Sites Monitoring Criteria
        Pollutants and Key EPA Actions Driving Changes                   86
Data Table for Figure 5: Numbers of Monitoring Sites for Criteria
        Pollutants and Air Toxics in the Networks of Selected
        State and Local Air Quality Monitoring Agencies                  88
Data Table for Figure 7: Annual EPA Grant Funding for State and
        Local Air Quality Management, Which Includes Air
        Quality Monitoring                                               89

Page iii                                              GAO-21-38 Air Pollution
Abbreviations
AQI          Air Quality Index
CASTNET      Clean Air Status and Trends Network
COVID-19     Coronavirus Disease 2019
CSN          PM2.5 Chemical Speciation Network
EPA          Environmental Protection Agency
IMPROVE      Interagency Monitoring of Protected Visual Environments
IRIS         Integrated Risk Information System
NAAQS        National Ambient Air Quality Standards
NADP         National Atmospheric Deposition Program
NASA         National Aeronautics and Space Administration
NATTS        National Air Toxics Trends Stations
NOAA         National Oceanic and Atmospheric Administration
PAMS         Photochemical Assessment Monitoring Stations
PFAS         per- and polyfluoroalkyl substances
PM2.5        particulate matter less than or equal to 2.5 micrometers
             in diameter
PM10         particulate matter less than or equal to 10 micrometers
             in diameter
SLAMS        State and Local Air Monitoring Stations

This is a work of the U.S. government and is not subject to copyright protection in the
United States. The published product may be reproduced and distributed in its entirety
without further permission from GAO. However, because this work may contain
copyrighted images or other material, permission from the copyright holder may be
necessary if you wish to reproduce this material separately.

Page iv                                                            GAO-21-38 Air Pollution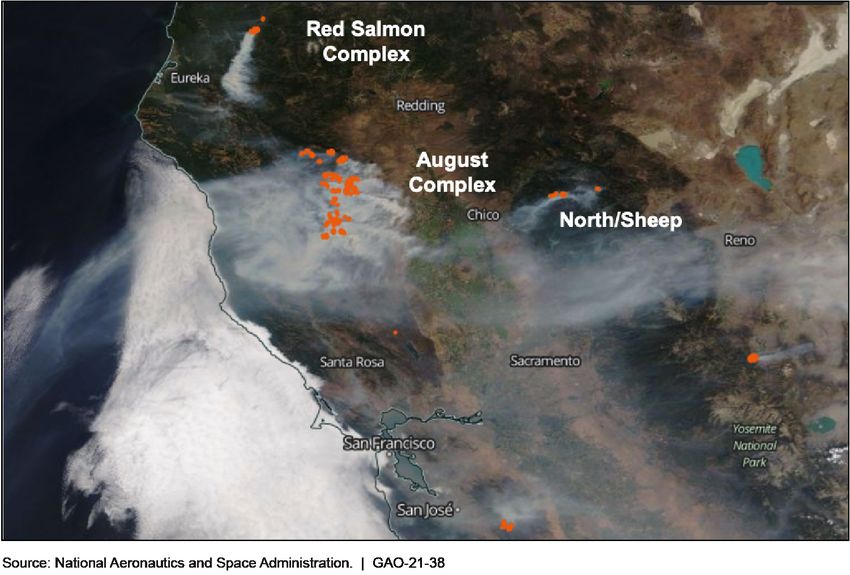
441 G St. N.W.
Washington, DC 20548

                       Letter

                       November 12, 2020

                       The Honorable Thomas Carper
                       Ranking Member
                       Committee on Environment and Public Works
                       United States Senate

                       The Honorable Sheldon Whitehouse
                       Ranking Member
                       Subcommittee on Clean Air and Nuclear Safety
                       Committee on Environment and Public Works
                       United States Senate

                       The Honorable Susan Collins
                       United States Senate

                       Data from the national ambient air quality monitoring system show that
                       the United States has made significant progress in reducing air pollution
                       levels since the 1970s but that air pollution continues to harm public
                       health and the environment in certain locations.1 The monitoring system
                       consists of sites that measure air pollution levels around fixed locations
                       across the country using methods and quality assurance procedures
                       approved by the Environmental Protection Agency (EPA). Air quality
                       managers, researchers, and the public use data from the national
                       ambient air quality monitoring system to characterize levels of pollution,
                       study the human health and ecological effects of air pollution, develop
                       strategies to reduce adverse health effects, and demonstrate progress in
                       addressing air quality issues over time.

                       EPA oversees the national ambient air quality monitoring system, and
                       state, local, and tribal air monitoring agencies generally own the

                       1“Ambient air” means that portion of the atmosphere, external to buildings, to which the
                       general public has access. 40 C.F.R. § 50.1(e).

                       Page 1                                                             GAO-21-38 Air Pollution
Letter equipment at the sites within the monitoring system.2 In fiscal year 2020, EPA provided about $225 million for air quality management programs that included ambient air monitoring, according to EPA data. By comparison, the nation’s ambient air quality monitoring system informs regulatory and compliance decisions that have associated costs and benefits totaling billions of dollars, including the costs of strategies for reducing air pollution and the benefits associated with reducing adverse health and ecological effects from poor air quality. Air quality concerns have changed since the national ambient air quality monitoring system was established by amendments to the Clean Air Act in the 1970s.3 For example, concerns have emerged about issues such as the health effects of air toxics; the localized effects of currently unregulated pollutants; and the international transport of pollutants from regions with emerging economies, such as East Asia. Finally, technologies for measuring air quality monitoring—including sensors and satellites—have improved since the inception of the nation’s air quality monitoring system, providing opportunities to enhance information on air quality. You asked us to evaluate the national ambient air quality monitoring system. This report examines (1) the role that the national ambient air quality monitoring system plays in managing air quality and how EPA and state and local agencies manage the system; (2) the challenges that EPA and selected state and local agencies face in managing the national ambient air quality monitoring system and the extent to which EPA has addressed and could better address these challenges; (3) what additional air quality monitoring information could help meet the needs of air quality managers, researchers, and the public; and (4) the challenges EPA and selected state and local agencies face in meeting air quality information needs and the extent to which EPA has addressed and could better address these challenges. 2The scope of this report does not include air quality monitoring on tribal lands. A 1998 EPA rule specifies the Clean Air Act provisions for which it is appropriate to treat Indian tribes in the same manner as states, establishes the requirements that Indian tribes must meet if they choose to seek such treatment, and provides for awards of federal financial assistance to tribes to address air quality problems. 63 Fed. Reg. 7254 (Feb. 12, 1998). We have ongoing work related to EPA grants for tribes and have identified air quality management on tribal lands as an area for potential future work. See app. I for additional information on this and other potential future oversight work related to air quality issues. 342U.S.C. §7401 et seq. The Clean Air Act was also significantly amended in 1977 and 1990. Page 2 GAO-21-38 Air Pollution
Letter

To address our objectives, we reviewed relevant documents and
literature. Specifically, we identified and reviewed federal laws and
regulations governing the national ambient air quality monitoring system;
EPA reports, guidance, and information on the oversight and operation of
the monitoring system; and 10 studies and articles, identified in a
literature review, which discussed the performance of the monitoring
system or emerging air pollution issues.

We also conducted a series of interviews with knowledgeable federal,
state, and local officials and representatives from air quality associations.4
We interviewed knowledgeable EPA officials from the Office of Air Quality
Planning and Standards within the Office of Air and Radiation; the Office
of Research and Development; and six regional offices. We selected EPA
regional offices in areas across the country with different characteristics
that might be associated with a range of monitoring needs and
considerations, such as different air quality concerns and population
densities. We also conducted semistructured interviews with officials from
14 state and local air quality monitoring agencies within the selected EPA
regions.5 We selected state and local agencies to include jurisdictions
with a range of characteristics potentially affecting the design and
operation of their air quality monitoring networks, such as different air
quality issues, population densities, and approaches to air toxics
monitoring. Our findings from these interviews cannot be generalized to
other EPA regions, states, or localities we did not include in our review.
Finally, we interviewed representatives from the two national and six
regional associations of state and local air quality agencies that represent
state and local areas across the country.

In addition, we used other methodologies to address specific objectives.
To examine the extent to which EPA could better address challenges in

4To  identify the number of interviewees who expressed particular views, we use the
following modifiers throughout the report: “some” represents two to four interviewees,
“several” represents five to eight interviewees, and “many” represents nine or more
interviewees. We considered officials from a state or local agency or representatives from
a national or regional association to be one interviewee, even though multiple officials or
representatives may have participated in the interview.
5Tribal  governments also partner with EPA to manage monitoring sites that are located on
tribal lands. According to the National Tribal Air Association, which was founded in 2002
through an EPA grant, 88 tribes operated air monitors in 2020. The scope of this report
does not include tribes’ management of air quality monitoring programs, and we did not
interview tribal air quality agencies for this report. We have ongoing work related to EPA
grants for tribes and have identified air quality management on tribal lands as an area for
potential future work (see app. I).

Page 3                                                              GAO-21-38 Air Pollution
Letter

managing the monitoring system and meeting air quality information
needs, we also reviewed our past work on asset management, strategic
planning, and risk management. To identify what additional air quality
monitoring information could help meet the needs of air quality managers,
researchers, and the public, we also interviewed 10 knowledgeable
stakeholders, selected based on their experience using air quality
information and their knowledge about the extent to which the monitoring
system produces needed air quality information. These stakeholders
included representatives of organizations focused on the health effects of
air pollution; academic faculty; and individuals from the private sector who
could discuss modern technologies for measuring air quality, including
low-cost sensor technologies. Our findings from these interviews cannot
be generalized to other stakeholders we did not interview. Finally, to help
identify challenges in meeting air quality information needs, we also
conducted our own demonstration of sensor technologies by purchasing
five low-cost air quality sensors and deploying them outside of the GAO
building in Washington, D.C. For additional details on our scope and
methodology, see appendix II.

We conducted this performance audit from March 2018 to November
2020 in accordance with generally accepted government auditing
standards. Those standards require that we plan and perform the audit to
obtain sufficient, appropriate evidence to provide a reasonable basis for
our findings and conclusions based on our audit objectives. We believe
that the evidence obtained provides a reasonable basis for our findings
and conclusions based on our audit objectives.

Background
This section describes the categories of air pollutants regulated under the
Clean Air Act and national air quality trends and issues.

Air Pollutants Defined by the Clean Air Act
The Clean Air Act provides the framework for protecting air quality in the
United States.6 Under the Clean Air Act, EPA sets different types of

6The  purposes of the Clean Air Act are to, among other things, to protect and enhance the
quality of the nation’s air resources so as to promote the public health and welfare and the
productive capacity of its population. 42 U.S.C. § 7401(b)(1).

Page 4                                                              GAO-21-38 Air Pollution
Letter

limits—ambient air standards and emissions standards—for two
categories of air pollutants.

The first category—the “criteria” pollutants for which EPA has established
standards for the allowable levels of each pollutant in the ambient air—
includes carbon monoxide, lead, ozone, particulate matter, nitrogen
dioxide, and sulfur dioxide.7 EPA sets these allowable standards—called
the National Ambient Air Quality Standards (NAAQS)—at levels intended
to protect public health, including the health of susceptible and vulnerable
populations such as people with asthma, children, and elderly people.8
Using information collected by the national ambient air quality monitoring
system, EPA classifies a geographic area that does not meet the NAAQS
for a criteria pollutant as a “nonattainment” area. When an area is in
nonattainment, the Clean Air Act requires that the relevant air quality
management agency develop plans to reduce air pollution to help bring
the area into attainment.

The criteria pollutants are commonly found throughout the United States
and can harm public health, harm the environment, and cause property
damage. Some criteria pollutants, such as sulfur dioxide, nitrogen dioxide,
carbon monoxide, and lead, can be directly emitted from sources such as
power plants, factories, and motor vehicles. Particulate matter can be
emitted directly from a source, such as a construction site, smokestack,
or fire, or formed in the atmosphere from the combination of so-called
“precursor” chemicals such nitrogen dioxide and sulfur dioxide. Ozone
forms in the atmosphere from the combination of precursors emitted from
sources such as motor vehicles and refineries in the presence of
sunlight.9

7EPA   calls these “criteria” air pollutants because EPA sets the standards based on health-
based criteria, which are characterizations of the latest scientific information regarding
their effects on health or welfare. EPA has established standards for two different sizes of
particulate matter: particulate matter less than or equal to 10 micrometers in diameter,
known as PM10, and particulate matter less than or equal to 2.5 micrometers in diameter,
known as PM2.5.
8In addition, EPA sets “secondary standards” to protect the public welfare from any known
or anticipated adverse effects associated with the presence of such air pollutant in the
ambient air.
9Ozone precursors include oxides of nitrogen, which are emitted from sources including
automobiles and power plants, and volatile organic compounds, which are emitted from
sources including refineries and chemical plants. Both PM2.5 and ozone are referred to as
secondary pollutants because they are formed as a result of atmospheric reactions.

Page 5                                                              GAO-21-38 Air Pollution
Letter

The second category of pollutants currently includes 187 pollutants listed
under the 1990 Clean Air Act Amendments and subsequent EPA
regulations as “hazardous air pollutants.”10 EPA also refers to these
pollutants as “air toxics.”11 For air toxics, EPA has not established
ambient air standards but regulates them by establishing standards that
limit the amount of emissions allowed from individual pollution sources.
The 1990 Clean Air Act amendments required EPA to identify categories
of industrial sources for the listed air toxics and require the sources to
take such measures as installing emissions controls or changing
production processes to meet the emissions standards. The 1990
amendments also require EPA to evaluate the remaining health risks in
each source category once emissions limits are met, to determine
whether the standards sufficiently protect public health.

Air toxics are pollutants known to cause or suspected of causing cancer,
birth defects, reproduction problems, and other serious illnesses. Air
toxics include pollutants such as benzene, found in gasoline, and
methylene chloride, which a number of industries use as a solvent and
paint stripper.12 The health risks of air toxics can vary considerably.
Therefore, small quantities of more harmful pollutants can pose greater
health risks than large quantities of less harmful pollutants. Air toxics can
originate from stationary sources such as factories, refineries, and power
plants; mobile sources such as cars, trucks, and buses; and indoor
sources such as some building materials and cleaning solvents.

10For a list of these pollutants, see EPA, Initial List of Hazardous Air Pollutants with
Modifications, accessed August 6, 2020.
https://www.epa.gov/haps/initial-list-hazardous-air-pollutants-modifications. On June 18,
2020, EPA published a notice in the Federal Register granting petitions to add one
additional air toxic—1-bromopropane, a solvent used in electronics and metal cleaning,
surface coatings, and dry cleaning—to the list of regulated hazardous air pollutants. Next,
EPA will take a separate regulatory action to add 1-bromopropane to the list, increasing
the total number of listed air toxics to 188.
11EPA  uses the term “hazardous air pollutants” for air toxics that are specifically listed as
relevant to programs in the Clean Air Act. Some air toxics are not included on the list of
hazardous air pollutants.
12Some   air toxics are also precursors to ozone formation. In addition, lead compounds are
air toxics, while lead is a criteria pollutant.

Page 6                                                                 GAO-21-38 Air Pollution
Letter

National Air Quality Trends and Issues
For criteria pollutants, since the passage of the Clean Air Act in 1970,
data reported by the national ambient air quality monitoring system has
shown improvements in the nation’s air quality. In its 2020 report on
national air quality trends, EPA reported that nationally, criteria air
pollutant levels have dropped significantly since 1990.13 For example,
according to the 2020 report, national averages of carbon monoxide and
sulfur dioxide have declined by 78 and 90 percent, respectively, since
1990.14 Cleaner-burning cars and trucks have led to the declines in
carbon monoxide levels, while reductions in emissions from coal-fired
power plants have contributed to declines in sulfur dioxide levels.

Even though the levels of criteria pollutants have declined nationally in
the past few decades, EPA reported in 2020 that some pollutants
continue to pose serious air quality problems in areas of the United
States. For example, many areas of the country remain out of attainment
of the NAAQS for ozone (fig. 1 shows ozone nonattainment areas).15
According to an EPA report based on 2010 population data,
approximately 130 million people in the United States live in a
nonattainment area for at least one of the criteria pollutants, which
amounts to around 40 percent of the U.S. population.16

13EPA,   Our Nation’s Air, accessed September 10, 2020. https://www.epa.gov/air-trends.
14Measured   as 8-hour averages of carbon monoxide and 1-hour averages of sulfur
dioxide.
15In addition, some areas of the country remain in nonattainment of the NAAQS for
particulate matter less than or equal to 2.5 micrometers in diameter (PM2.5), sulfur dioxide,
lead, and particulate matter less than or equal to 10 micrometers in diameter (PM10).
Since 2010, there have been no areas in nonattainment of the NAAQS for carbon
monoxide or nitrogen dioxide. A particle 2.5 micrometers in diameter is about 30 times
smaller than the diameter of an average human hair.
16This  information was current as of June 30, 2020. EPA, Summary Nonattainment Area
Population Exposure Report, accessed July 31, 2020.
https://www3.epa.gov/airquality/greenbook/popexp.html.

Page 7                                                               GAO-21-38 Air Pollution
Letter

Figure 1: Nonattainment Areas for the Ozone National Ambient Air Quality Standards (NAAQS)

                                        Note: The map shows areas in nonattainment based on EPA data as of September 2, 2020. The
                                        areas shown on the map were designated as nonattainment areas for either the 2008 ozone NAAQS
                                        (75 parts per billion (ppb), averaged over 8 hours) or the 2015 ozone NAAQS (70 ppb, averaged over
                                        8 hours). EPA estimates that, based on 2010 population data, approximately 122 million people live in
                                        an area in nonattainment of the 2015 ozone NAAQS.
                                        For air toxics, EPA’s 2014 National Air Toxics Assessment found that,
                                        nationwide, total emissions of air toxics were declining and that available
                                        monitoring data showed average levels of some air toxics trending
                                        downward.17 However, pollution from air toxics has raised public health
                                        concerns about air quality in communities across the country, and the

                                        17EPA,  2014 National Air Toxics Assessment, accessed April 9, 2020.
                                        https://www.epa.gov/national-air-toxics-assessment/2014-national-air-toxics-assessment.
                                        The 2014 National Air Toxics Assessment was released in August 2018. The assessment
                                        uses air toxics emissions data from 2014.

                                        Page 8                                                                    GAO-21-38 Air Pollution
Letter 2014 National Air Toxics Assessment identified many communities facing elevated health risks from air toxics. The pollutants driving risks across the country included benzene, ethylene oxide, and formaldehyde, which are used or produced in industrial facilities such as oil and gas wells, medical sterilization facilities, and incinerators. The Air Quality Monitoring System Is a National Asset That Provides Information for Protecting Public Health and Is Cooperatively Managed by EPA and State and Local Agencies The national ambient air quality monitoring system is a national asset that provides standardized information across the country that is essential for Clean Air Act compliance and other efforts to manage public health risks. EPA and state and local agencies cooperatively manage the monitoring system and play different roles in its design, operation, oversight, and funding. The Air Quality Monitoring System Is a National Asset That Provides Standardized Information for Implementing the Clean Air Act and Understanding Public Health Risks The ambient air quality monitoring system is a national asset, according to literature we reviewed, stakeholders, and officials from EPA and selected state and local agencies. It provides value to the nation by (1) producing standardized information across the country through a suite of networks and (2) supporting Clean Air Act implementation and the understanding of public health risks from air pollution.18 18While not specifically defined as such, the monitoring system has characteristics of critical infrastructure, including that it is essential in the protection of national public health. The Department of Homeland Security’s 2013 National Infrastructure Protection Plan defines critical infrastructure as those assets, systems, and networks that underpin American society. Department of Homeland Security, National Infrastructure Protection Plan 2013: Partnering for Critical Infrastructure Security and Resilience (Washington, D.C.: 2013). Page 9 GAO-21-38 Air Pollution
Letter

The Monitoring System Provides Standardized Air Quality
Information across the Country through a Suite of Networks

The ambient air quality monitoring system provides standardized
information across the country through a suite of networks focused on
different air quality issues. The networks have common methods for
producing data at their monitoring sites, allowing the comparison of data
across the country to provide a national perspective of various air quality
issues.19 Table 1 describes the networks within the national ambient air
quality monitoring system: (1) required State and Local Air Monitoring
Stations (SLAMS) networks, which measure levels of the criteria
pollutants and the precursor pollutants that mix to form criteria pollutants;
(2) voluntary networks designed to measure air toxics, including a
national network for establishing trends in air toxics and state and local
networks designed to target specific concerns about air toxics; and (3)
specialized networks focused on certain pollution issues, such as visibility
and deposition of pollutants from the atmosphere into ecosystems.

19Certainstate and local air toxics monitoring programs use common methods for
producing data. However, since these are not required networks, the use of common
methods across all state and local air toxics monitoring is not assured.

Page 10                                                         GAO-21-38 Air Pollution
Letter

Table 1: National Ambient Air Quality Monitoring System

 Network                              Purpose                                                                               Start year          No. of sitesa
 State and Local Air Monitoring Stations (SLAMS) network
 Criteria pollutant                   Provide air pollution data to the general public in a timely manner;                               1980               4,300+
 networks                             support compliance with the National Ambient Air Quality Standards
                                      (NAAQS) and emissions strategy development, and support air
                                      pollution research studies.
 Photochemical                        Measure ozone precursors to better characterize the nature and                                     1994                     69
 Assessment Monitoring                extent of ozone problems in nonattainment areas.
 Stations (PAMS)
 PM2.5 Chemical                       Provide data on the chemical composition of particulate matter less                                2002                    154
 Speciation Network                   than or equal to 2.5 micrometers in diameter (PM2.5) to assess trends,
 (CSN)                                develop emissions control strategies, and support health studies,
                                      among other things.
 Near-Road NO2                        Measure nitrogen dioxide (NO2) and other pollutants near roads in                                  2010                     74
 Network                              larger urban areas where peak hourly levels are expected to occur.
 National Core (NCore)                Support air quality model evaluations, long-term health assessments,                               2011                     78
 network                              compliance through comparison to the NAAQS, and ecosystem
                                      assessments.
 Networks for assessing air toxics
 National Air Toxics                  Identify trends in air toxics levels to assess progress toward emission                            2003                     24
 Trends Stations                      reduction goals, evaluate public exposure, and characterize risk.
 (NATTS) network
 State and local air toxics Support state and local air toxics programs and identify geographic                                          1985                   240+
 monitoring                 areas at high risk.
 Specialized networks
 Interagency Monitoring               Establish current visibility conditions in visibility-protected federal                            1985                    110
 of Protected Visual                  areas, identify emissions sources, document trends, and provide
 Environments                         regional haze monitoring.
 (IMPROVE)
 Clean Air Status and                 Assess environmental results of emissions reductions programs, such                                1991                     96
 Trends Network                       as a program to reduce acid rain, and pollutant impacts to sensitive
 (CASTNET)                            ecosystems and vegetation.
 National Atmospheric                 Provide data on the amounts, trends, and geographic distributions of                               1978                    473
 Deposition Program                   ammonia, mercury, and other pollutants found in precipitation that can
 (NADP)                               affect the environment.
Source: GAO analysis of Environmental Protection Agency information. | GAO-21-38
                                                                a
                                                                 These numbers include sites on tribal lands that report data to the Environmental Protection Agency.

                                                                Page 11                                                                    GAO-21-38 Air Pollution
Letter As shown in table 1, the vast majority of sites within the monitoring system are associated with the SLAMS networks and provide standardized information on criteria pollutants. These networks are required by EPA regulations and have evolved over time in response to regulatory changes under the Clean Air Act, including revisions to the NAAQS (see fig. 2), according to EPA officials.20 In some cases, these regulatory changes resulted in the development of new networks designed to address a particular air quality issue. For example, EPA has issued regulations requiring the establishment of the Photochemical Assessment Monitoring Stations (PAMS) network to obtain more comprehensive data on ozone pollution, including additional information on ozone precursors. In 2015, as a result of revisions to the ozone NAAQS, EPA revised the PAMS network to expand its geographic coverage. 20The Clean Air Act requires that EPA review NAAQS every 5 years and revise them if the review deems that a change is warranted. According to EPA officials, during these reviews, EPA also reviews the associated air quality monitoring networks and methods. Page 12 GAO-21-38 Air Pollution
Letter

Figure 2: Number of Sites Monitoring Criteria Pollutants and Key EPA Actions Driving Changes

                                        Note: One monitoring site may monitor multiple pollutants.
                                        For air toxics, EPA established the National Air Toxics Trends Stations
                                        (NATTS) network in 2003 to provide information of consistent quality on
                                        trends of certain air toxics in a limited number of locations across the
                                        country. The NATTS network began with 13 sites and grew to a maximum
                                        of 27 sites in 2008. The network currently includes 26 sites at urban and
                                        rural locations (see fig. 3). At a minimum, EPA asks that each NATTS site
                                        monitor 19 air toxics, including some widespread air toxics that present

                                        Page 13                                                      GAO-21-38 Air Pollution
Letter
potential health concerns across the country, to develop information on
trends.21 Typically, though, NATTS sites monitor over 100 air toxics.
Figure 3: Location of National Air Toxics Trends Stations
Finally, the national ambient air monitoring system includes specialized
networks designed to provide consistent information across the country
21Specifically,
at a minimum, each NATTS site monitors acrolein, benzene, 1,3-butadiene,
carbon tetrachloride, chloroform, perchloroethylene, trichloroethylene, vinyl chloride,
acetaldehyde, formaldehyde, benzo(a)pyrene, naphthalene, arsenic compounds, beryllium
compounds, cadmium compounds, lead compounds, manganese compounds, nickel
compounds, and ethylene oxide.
Page 14 GAO-21-38 Air PollutionLetter on pollution issues in certain environments or ecosystems.22 For example, these networks monitor pollution that impairs visibility in some national parks and wilderness areas or monitors air pollutants, such as mercury, that can affect ecosystems and water quality.23 While these specialized networks are a part of the national ambient air monitoring system, the remainder of this report does not focus on them because their sites are managed through different mechanisms than the criteria pollutant and air toxics networks.24 The Monitoring System Provides Information Essential for Implementing the Clean Air Act and Understanding Public Health Risks The national ambient air quality monitoring system provides information essential for assessing Clean Air Act compliance, according to some literature we reviewed and EPA and state and local agency officials we interviewed. EPA’s policy is to assure uniform enforcement of the Clean Air Act across the country, and the monitoring system plays a key role in this by providing data for comparison with the NAAQS to determine whether an area is in attainment.25 When an area does not attain the NAAQS, the monitoring system provides key measurements to evaluate strategies for cleaning up the air and to track progress toward NAAQS attainment. In addition to supporting Clean Air Act compliance, the national ambient air quality monitoring system provides information critical to help air quality managers, researchers, and the public to understand and manage health risks from air pollution, according to some literature we reviewed 22As shown in table 1, these specialized networks include the Interagency Monitoring of Protected Visual Environments (IMPROVE) network, the Clean Air Status and Trends Network (CASTNET), and the National Atmospheric Deposition Network (NADP). 23See app. I for potential additional work related to air quality impacts on ecosystems, which would involve some of these networks. 24IMPROVE is managed by a steering committee of representatives from six federal agencies, four air quality organizations, and three associate members—the Arizona Department of Environmental Quality, Environment Canada, and the South Korea Ministry of Environment. CASTNET is managed by EPA; the National Park Service; the Bureau of Land Management; and other federal, state, local, and tribal partners. NADP is managed by federal, state, tribal, and local government organizations; educational institutions; and nongovernmental agencies and institutions. 25EPA policy is to assure “fair and uniform application” by all regions of EPA criteria for enforcing the Clean Air Act. 40 C.F.R. § 56.3(a). Page 15 GAO-21-38 Air Pollution
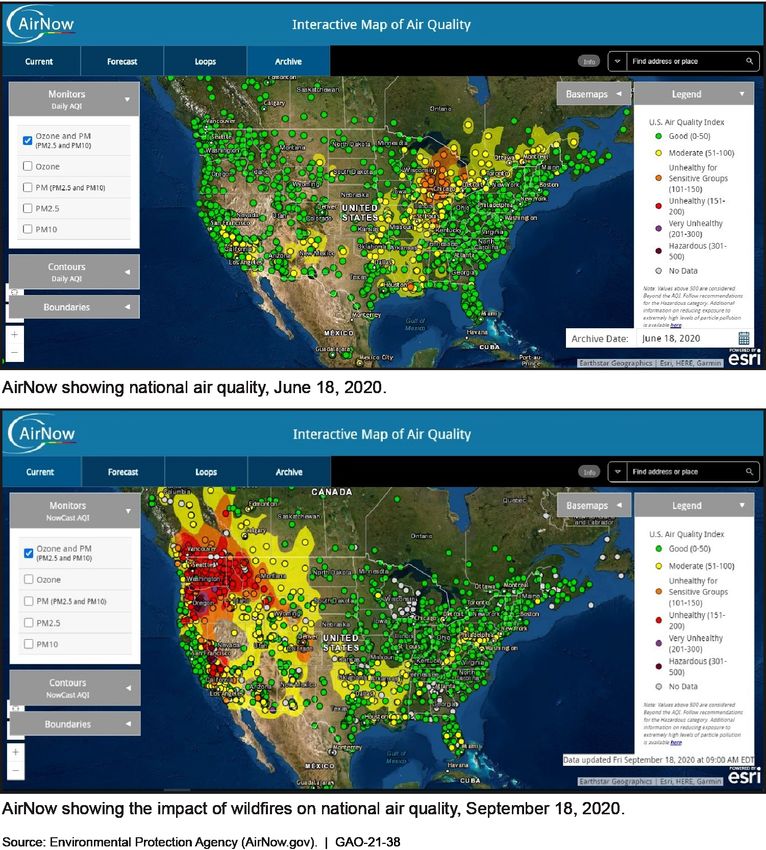
Letter

and stakeholders we interviewed. For example, information from criteria
pollutant networks forms much of the basis for studies on the health
effects of criteria pollutants that EPA uses to determine whether new
information warrants changes to the NAAQS to adequately protect public
health. In addition, information from NATTS and state and local air toxics
monitoring networks helps to identify air toxics trends, characterize local
air toxics problems, and track progress of air toxics reduction activities.

The monitoring system also provides reliable, “gold standard” information
that scientists and others can use to validate air quality measurements for
research or test new air quality measurement technologies that further the
understanding of health risks from air pollution, according to some
stakeholders. One stakeholder we interviewed had created detailed maps
of PM2.5 levels in the air for a region by calibrating satellite data with PM2.5
data that the monitoring system collected. Another stakeholder we
interviewed used monitoring system data to calibrate sensors worn by
individuals to measure their personal exposure to air pollution.

Finally, the national ambient air quality monitoring system provides some
near real-time air quality information for ozone and particulate matter,
which organizations and individuals can use to evaluate daily health risks
and change behaviors accordingly. EPA reports near real-time air quality
information from the monitoring system for locations across the United
States on its AirNow website using an Air Quality Index (AQI) (see fig. 4
for an example).26 EPA calculates the AirNow AQI based on monitoring
data for ozone and particulate matter and reports it in color-coded
categories based on the levels of health concern posed by the amount of
air pollution over certain time periods.27

26See    www.airnow.gov.
27Thecategories include good, moderate, unhealthy for sensitive groups, unhealthy, very
unhealthy, and hazardous.

Page 16                                                          GAO-21-38 Air Pollution
Letter

Figure 4: Near Real-time Air Quality Information from AirNow.gov

EPA and State and Local Agencies Cooperatively Manage
the National Air Quality Monitoring System
EPA and state and local agencies cooperatively manage the national
ambient air quality monitoring system. The agencies play different roles in
managing the system. Specifically, (1) EPA establishes requirements for
the design of the monitoring system; (2) state and local agencies design
and operate the networks within the monitoring system; (3) EPA
coordinates with state and local agencies on monitoring system oversight,

Page 17                                                      GAO-21-38 Air Pollution
Letter

technical assistance, and data management; and (4) EPA and state and
local governments provide funding for the monitoring system.

EPA Establishes Requirements for the Design of the Monitoring
System

EPA’s Office of Air Quality Planning and Standards—the office charged
with preserving and improving air quality in the United States—
establishes requirements for the design of the national ambient air quality
monitoring system. For the required SLAMS networks measuring criteria
pollutants, EPA issues regulations to establish the minimum design
criteria, which include requirements for what pollutants to measure, how
many monitoring sites a network needs, and where to locate sites.28

EPA has established different minimum monitoring requirements for
criteria pollutants based on factors such as population, pollutant levels,
and emissions. The requirements for ozone, PM2.5, and PM10 are based,
in part, on a combination of pollution levels and population. For these
criteria pollutants, EPA requires that state and local agencies operate a
minimum number of monitors based on an area’s population and on
pollution levels relative to the NAAQS. As an example, for ozone, EPA
requires that a state or locality have at least three monitors for a
metropolitan area with a combined population between 4 million and 10
million and ozone levels close to or above the NAAQS. By contrast, EPA
requires a minimum of one ozone monitor for another metropolitan area
of the same size, but with ozone levels significantly below the NAAQS.
For other criteria pollutants, the minimum number of monitors required
depends primarily on population for nitrogen dioxide, emissions for lead,
and both population and emissions for sulfur dioxide.

In addition to minimum criteria for the number of monitors for specific
pollutants, EPA has requirements for different types of monitoring sites for
each criteria pollutant that state and local agencies must include within
their networks. According to EPA documents, these site types are
designed to ensure that a state or local agency’s network covers specific
factors, including (1) the maximum pollutant levels expected to occur in
the area covered by the network; (2) typical pollutant levels in areas of
high population density; (3) the impact of significant air pollution sources
on air quality; (4) background pollution levels and the extent of regional

2840C.F.R. Part 58, Appendix D, establishes network design criteria for ambient air quality
monitoring of criteria pollutants. Appendix D notes that, in some cases, additional monitors
beyond those minimally required may be needed to meet monitoring objectives.

Page 18                                                             GAO-21-38 Air Pollution
Letter

    pollutant transport among populated areas; and (5) the impacts of air
    pollution on visibility or other welfare-based impacts, such as vegetation
    damage.

    Finally, EPA establishes the acceptable technologies and methods for
    measuring air pollution at monitoring sites to ensure that air quality
    monitoring data collected at different sites are gathered in a consistent
    manner and are reliable. EPA’s Office of Research and Development
    manages research programs to assess, develop, and validate these
    methods. For measuring criteria pollutants for comparison to the NAAQS,
    EPA approves specific methods for sampling and analyzing the ambient
    air for a pollutant and designates them as “federal reference methods” or
    “federal equivalent methods.”29 For measuring air toxics, EPA develops
    approved methods for various classes of air toxics.

    State and Local Agencies Design and Operate the Networks within
    the Monitoring System

    The national monitoring networks each consist of individual state and
    local monitoring networks. A state or locality’s network may include a
    combination of SLAMS sites, NATTS sites, and state and local air toxics
    sites.30 State and local agencies manage their air quality monitoring
    networks by performing several functions, including (1) designing,
    establishing, and modifying the networks; (2) purchasing and maintaining
    monitoring infrastructure; and (3) operating monitoring sites and
    implementing quality assurance programs.

·   Designing, establishing, and modifying the monitoring networks.
    State and local agencies design and establish monitoring networks within
    their jurisdictions. State and local networks vary significantly in terms of
    size and scope. Of the networks owned by our selected state and local
    agencies, the size and scope of the networks varied, along with
    differences in geographic scale, population, air quality issues, and
    available resources. As shown in figure 5, the networks of the 14
    selected state and local agencies ranged from 10 monitoring sites in the
    small state of Rhode Island to 148 monitoring sites in the large state of

    29EPA    designates these methods under 40 C.F.R. Part 53.
    30State and local agencies may also operate special purpose monitoring sites to fulfill very
    specific or short-term monitoring goals.

    Page 19                                                             GAO-21-38 Air Pollution
Letter
Texas, and they varied significantly in terms of the number of sites
monitoring air toxics.31
Figure 5: Numbers of Monitoring Sites for Criteria Pollutants and Air Toxics in the Networks of Selected State and Local Air
Quality Monitoring Agencies
Note: The data in the figure are based on the number of sites that provide data to the Environmental
Protection Agency (EPA) and do not include some voluntary toxics monitoring that is not reported to
EPA. Of the 113 criteria pollutant sites in Wyoming, 70 sites are associated with Wyoming’s program
to monitor particulate matter less than or equal to 10 micrometers in diameter (PM10) at specific
industrial sites—including in the Powder River Basin—as a part of their operating permits.
Per EPA requirements, state and local agencies develop annual
network plans to demonstrate that their monitoring networks meet
monitoring objectives and requirements, including minimum design
criteria. In these plans, state and local agencies document proposed
changes to their monitoring network design, such as new or
discontinued sites, and identify plans for meeting any new EPA
monitoring requirements, among other things. State and local
31These numbers are based on the number of sites that provide data to EPA and do not
include some voluntary toxics monitoring. For example, according to its website, the
Texas Council on Environmental Quality receives air toxics data from approximately 100
monitoring sites across Texas, mostly in urban and industrial areas.
Page 20 GAO-21-38 Air PollutionLetter
agencies must make the plans publicly available and submit the plans
to the applicable EPA regional office.
· Purchasing and maintaining monitoring infrastructure. State and
local agencies purchase and maintain the monitoring infrastructure within
their networks. Infrastructure within the national ambient air quality
monitoring system includes monitoring sites and the associated
equipment. A monitoring site typically consists of a shelter that houses
and protects the monitoring equipment. The equipment at a site varies,
depending on the pollutants that are monitored at the site, but may
include sample collection devices such as filter holder assemblies for
particulate matter or canisters for air toxics, equipment that analyzes air
samples using EPA-approved technologies, calibration equipment, data
loggers, computer systems, and heating and air conditioning systems.
Figure 6 shows examples of monitoring equipment at some of the
monitoring sites we visited.
Figure 6: Examples of Air Monitoring Sites and Monitoring Equipment
Page 21 GAO-21-38 Air PollutionLetter
State and local agencies make decisions about the type of equipment
they will purchase, criteria for replacing equipment, and strategies for
maintaining it. Some officials we interviewed from state and local
agencies said they often try to purchase most of their equipment from
one manufacturer to minimize the amount of training required for new
equipment, and look to other agencies and EPA for guidance and
information about different types of monitoring equipment.
· Operating monitoring sites and implementing quality assurance
programs. State and local air quality agencies operate the monitoring
sites within their networks. Among other functions, these agencies set up
the monitoring sites, including installing equipment, electricity, and
communications; develop and implement standard operating procedures;
calibrate equipment; and maintain equipment and shelters. State and
local agencies also establish and implement quality assurance programs
to ensure that their monitoring programs function as intended and meet
objectives for data quality.
EPA Coordinates with State and Local Agencies on Several
Monitoring System Functions
EPA coordinates with state and local agencies on several functions,
including monitoring system oversight, network assessment, technical
assistance, and data management, with various EPA offices playing
different roles. For example:
· Oversight. EPA’s Office of Air Quality Planning and Standards
establishes the quality assurance and oversight requirements for the
monitoring system and develops and documents the programs and
guidance for implementing these requirements. EPA’s regional offices
work directly with state and local agencies to evaluate compliance with
the requirements through mechanisms that include (1) reviewing and
approving state and local agencies’ annual network plans to ensure that
the networks comply with design requirements, and (2) conducting on-
site reviews and inspections—called technical systems audits—of state
and local agencies’ monitoring programs every 3 years to assess
compliance with the regulations governing the collection, analysis,
validation, and reporting of air quality monitoring data.
· Network assessment. EPA requires that state and local agencies
perform and submit to the EPA regional offices an assessment of their
monitoring network every 5 years to determine whether it meets the
regulatory monitoring objectives, whether new sites are needed or
existing sites are no longer needed and can be terminated, and whether
new technologies are appropriate for incorporation into the network. EPA
Page 22 GAO-21-38 Air PollutionLetter
regional offices review the 5-year network assessments to understand
how the networks are performing, according to some EPA regional
officials we interviewed.
· Technical assistance. EPA’s Office of Air Quality Planning and
Standards and EPA regional offices communicate with state and local
agencies and provide information and technical assistance through
scheduled monthly calls hosted by EPA and quarterly calls hosted by
national air quality associations, according to EPA officials. In addition,
EPA hosts a biennial national air quality monitoring conference to provide
training and presentations on various aspects of the monitoring system.32
Finally, according to EPA officials, staff from EPA’s regional offices
regularly communicate with the state and local agencies within their
regions to answer technical questions and provide support and guidance.
Officials we interviewed from all of the 14 selected state and local
agencies said their agencies had good working relationships with EPA.
· Data management. EPA’s Office of Air Quality Planning and Standards
and regional offices coordinate with state and local agencies to manage
the data that the monitoring networks collect. State and local agencies
are responsible for collecting, assessing, validating, and delivering air
quality monitoring data to EPA. State and local agencies submit most
monitoring data quarterly to EPA’s Air Quality System—the centralized
database for air quality data from the monitoring system. State and local
agencies also transfer some monitoring data hourly to EPA’s AirNow
website, which reports near real-time air monitoring data. EPA’s regional
offices are responsible for assessing the quality of data from the state
and local agencies within their regions, and EPA’s Office of Air Quality
Planning and Standards oversees and operates the Air Quality System
and makes air quality information available to the public.
EPA and State and Local Governments Provide Funding for the
Monitoring System
The national ambient air quality monitoring system relies on funding from
federal, state, and local government sources. While EPA does not track
all funding for monitoring, EPA officials estimated, based on their
knowledge of state and local agency activities, that state and local
agencies used between approximately $150 million and $170 million each
32EPA has hosted this conference in conjunction with the National Association of Clean Air
Agencies and the Association of Air Pollution Control Agencies. As a part of this work, we
attended the 2018 National Ambient Air Monitoring Conference held in Portland, OR.
Page 23 GAO-21-38 Air PollutionLetter year from federal, state, and local sources for air quality monitoring activities. EPA provides federal funding for the monitoring system through grants to state and local agencies under the Clean Air Act for a range of state and local air quality management activities, including air quality monitoring.33 EPA regional offices administer and oversee the federal grants to state and local agencies. In fiscal year 2020, EPA allocated a total of approximately $225 million for air quality management grants using two different authorities, according to EPA data.34 First, Section 103 of the Clean Air Act authorizes EPA to award grants for specific air quality-related activities, including research, demonstrations, and training. In fiscal year 2020, EPA allocated approximately $50 million for Section 103 grants for activities including PM2.5 monitoring, operation of NATTS sites, and Community Scale Air Toxics monitoring grants, according to EPA officials.35 Section 103 does not require that state and local agencies provide matching amounts. Next, under Section 105 of the Clean Air Act, EPA awards grants to state and local agencies for continuing air quality management activities, including developing and operating ambient air quality monitoring networks, developing and implementing air pollution emissions reduction measures, and implementing programs for improving visibility in national parks and wilderness areas. Grants that EPA awards under Section 105 may fund up to 60 percent of the cost of a state or local agency’s air quality management program, and they require the state or local agency to provide matching funding for at least 40 percent of a program’s cost. In fiscal year 2020, EPA allocated approximately $174 million for Section 105 grants, according to EPA data. State and local air monitoring networks are also funded through state and local appropriations, revenue raised through fees and penalties, and other 33EPA provides guidance on the use of these grants for the ambient air quality monitoring system in its National Program Manager Guidance – Monitoring Appendix (see https://www.epa.gov/amtic/national-program-manager-npm-guidance-monitoring- appendix, accessed Oct. 30, 2020). According to EPA officials, this document offers direction and sets priorities for ambient air monitoring. 34According to EPA officials, this amount includes funding available for state, local, and tribal agencies. Of this total, EPA allocated approximately $12 million for tribal agencies in fiscal year 2020, according to the National Tribal Air Association. 35EPA periodically awards Community Scale Air Toxics Ambient Monitoring grants to help state, local, and tribal air agencies conduct air quality monitoring projects to address localized air toxics issues. Page 24 GAO-21-38 Air Pollution
You can also read