Towards Narrative Medical Visualization - arXiv
←
→
Page content transcription
If your browser does not render page correctly, please read the page content below
Eurographics Workshop on Visual Computing for Biology and Medicine (2021), pp. 1–14
                                         S. Oeltze-Jafra, N. N. Smit, and B. Sommer (Editors)

                                                                             Towards Narrative Medical Visualization

                                                                                   M. Meuschke1,2 , L. Garrison, N. Smit, S. Bruckner, K. Lawonn2 , B. Preim1
                                                                                        1 Department    of Simulation and Graphics, University of Magdeburg, Germany
                                                                                                  2 Instituteof Computer Science, University of Jena, Germany
arXiv:2108.05462v1 [cs.CY] 11 Aug 2021

                                                 Abstract
                                                 Narrative visualization aims to communicate scientific results to a general audience and garners significant attention in various
                                                 applications. Merging exploratory and explanatory visualization could effectively support non-expert understanding of scientific
                                                 processes. Medical research results, e.g., mechanisms of the healthy human body, explanations of pathological processes, or
                                                 avoidable risk factors for diseases, are also interesting to a general audience that includes patients and their relatives.
                                                 This paper discusses how narrative techniques can be applied to medical visualization to tell data-driven stories about diseases.
                                                 We address the general public comprising people interested in medicine without specific medical background knowledge. We
                                                 derived a general template for the narrative medical visualization of diseases. Applying this template to three diseases selected
                                                 to span bone, vascular, and organ system, we discuss how narrative techniques can support visual communication and facilitate
                                                 understanding of medical data. Other scientists can adapt our proposed template to inform an audience on other diseases. With
                                                 our work, we show the potential of narrative medical visualization and conclude with a comprehensive research agenda.
                                                 CCS Concepts
                                                 • Applied computing → Life and medical sciences; • Human-centered computing → Visualization;

                                         1. Introduction                                                                          ing data this may comprise labeled visualizations and animations
                                                                                                                                  highlighting relevant anatomical structures, e.g., vessel branch-
                                         Medical visualization research to date has focused primarily on
                                                                                                                                  ing around an associated pathological structure. Visualizations of
                                         supporting medical experts (radiologists, pathologists, surgeons in
                                                                                                                                  population-based data that indicate the most frequent tumor lo-
                                         diagnosis and treatment and—to a lesser extent—to medical stu-
                                                                                                                                  cations or metastasis pathways may also interesting to the pub-
                                         dents, in particularly for anatomy education. Medical information
                                                                                                                                  lic. Moreover, visualizations of health survey data demonstrating
                                         and research, however, are also interesting to non-experts, i.e., a
                                                                                                                                  avoidable lifestyle-related risk factors for diseases can motivate the
                                         general audience that comprises patients and their relatives along
                                                                                                                                  public to adopt healthier lifestyles.
                                         with those with an interest in science. Interactive medical visual-
                                         ization aiming at this type of audience requires different design ap-
                                         proaches with easy to understand representations [BKV*20] than in                           While “scientific outreach” is already an essential topic for the
                                         systems such as radiology workstations that are aimed at experts.                        visualization of astronomy data [BAC*19], climate data [Böt20],
                                                                                                                                  and cell biology data [KIK*21], the same has not been true for
                                            Narrative visualization combines storytelling techniques with in-                     interactive medical visualization research. Exceptions include epi-
                                         teractive graphics to appeal to a general audience [SH10]. It aims                       demiological data, e.g., the COVID-19 Dashboard by Johns Hop-
                                         to present the data in a traceable progression that is memorable                         kins University which supports map-based visualization, a selec-
                                         and easier to understand [Fig14b]. There are two types of story-                         tion of interesting countries, and time-based visualization of cases
                                         telling: synchronous and asynchronous storytelling [LRIC15]. In                          and fatalities. Early limited authoring tools were developed for gen-
                                         synchronous storytelling, the narrator is in direct contact with the                     erating interactive medical stories based on volume data [Woh06;
                                         audience, e.g., live presentations, whereas asynchronous stories do                      WH07]. However, medical data also includes other data types, e.g.,
                                         not require direct audience contact. These stories take the form of                      clinical images, 3D models, and flow data.
                                         recorded videos, static graphics, or visually guided tours through
                                         complex processes with interactive visualizations.
                                                                                                                                     Several techniques for visualizing medical imaging data lend
                                           Ynnerman et al. [YLT18] coined the term exploranation for                              themselves well to narrative medical visualization storytelling prin-
                                         merging exploratory visualizations that are traditionally made for                       ciples with limited freedom for exploration. These include clip-
                                         experts with explanatory visualization techniques. While this sup-                       ping planes which are automatically moved, cutaways or automated
                                         ports visual knowledge acquisition for non-experts, it requires more                     ghosted views based on structure selection, and automatically gen-
                                         guidance and automatically-generated content. For medical imag-                          erated animated transitions. However, concept-driven content, e.g.,

                                         submitted to Eurographics Workshop on Visual Computing for Biology and Medicine
                                         (2021)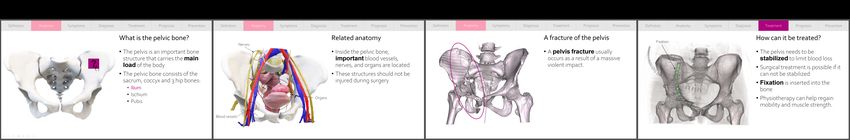
2                     M. Meuschke, L. Garrison, N. Smit, S. Bruckner, K. Lawonn, B. Preim / Towards Narrative Medical Visualization

informative infographics, may be highly valuable to engage general             Personalized education     General Public
                                                                               Strong doctor-patient
                                                                               connection                 Patients              Allied Health Professionals
audiences in scientific communication [RKO*20].
                                                                               Patient-specific data      Patients’ relatives   Epidemiologists        Health
Scope of this Paper. In this work, we discuss the potential of in-             available                                                               Professionals
                                                                                                                                Dental assistants
                                                                               Broad education            General interest      Social workers         Physicians
cluding interactive exploration of medical data in narrative visual-           No specific doctor-patient in medicine
                                                                               connection                                       Paramedics             Medical students
ization for a general audience, i.e., members of the general public
                                                                               Investigating general                            Therapists             Nurses
who are interested in understanding diseases and their treatment               knowledge:                                       Dietitians
but lack detailed medical knowledge or familiarity with scientific             Symptoms       Treatment                         Optometrists
                                                                               Diagnosis      Prognosis
visualizations. We further identify three general public subgroups:
Patients with a direct link to a specific disease, patient relatives, and      Figure 1: Audiences affected by narrative medical visualization.
people interested in medicine, see Figure 1. Following an asyn-
chronous storytelling method, we show how to leverage narrative
                                                                               pattern to support the author’s communication goal. General goals
techniques to present medical data in a way that is both compelling
                                                                               include to inform or entertain the audience. In the following, we
and understandable. Our proof-of-concept focuses on the suitability
                                                                               summarize existing techniques to generate and transition between
and arrangement of narrative techniques to tell stories about three
                                                                               scenes. In addition, we summarize genres and design patterns with
common diseases that are related to three important structures of
                                                                               suggestions for their use in medical visualization.
the human body: organs, vessels, and bones. Our inspiration for
these disease stories draws in part from health websites such as
WebMD and UpToDate. Similar to other works dealing with narra-                 2.1. Generating and Transitioning Narrative Scenes
tive scientific visualization, we choose touch screen as a medium
                                                                               Segel and Heer [SH10] derive general design elements of narrative
such that the user can interact with the data during the story.
                                                                               visualizations and examine the range of user guidance and interac-
   In narrative visualization, stories can be mainly data-driven               tion. Hullman and Diakopoulos [HD11] build on this work to an-
or concept-driven. We follow the suggestions by Segel and                      alyze 51 narrative visualizations, examining the rhetorical devices
Heer [SH10] that data should enrich the story while memorable                  used. Stolper et al. [SLRS16] extend this summary by novel data-
visuals and interesting storytelling are the main components of the            driven storytelling techniques. Based on these ground-breaking
story. Our key contributions are the following:                                works in the field of narrative visualization, we summarize exist-
                                                                               ing story elements, how to connect them to form scenes, how to
• We provide an overview of existing work in narrative visualiza-
                                                                               transition between scenes and how to construct a scene path.
  tion and based on an analysis of a corpus of 30 medical stories
  propose a template to structure medical visualization stories.
                                                                               2.1.1. Story Elements
• We present three proof-of-concept medical stories that are en-
  riched with interactive medical data visualization components to             Visualizations are best complemented by other means of communi-
  explain information around selected example diseases.                        cation and highlighting techniques need to guide the user through
• We identify promising areas for future research in narrative med-            a story [KM13].
  ical visualization.
                                                                               Text narration. Text is the simplest way to explain data. Long-form
Organization. Section 2 summarizes general narrative techniques                texts can be used to explain key points in detail and to introduce or
based on seminal works in this field. Then, Section 3 gives a brief            summarize a topic. Headlines or captions can serve to draw atten-
insight which other scientific visualization areas have used narra-            tion to a story. Tooltips can provide details when a user hovers their
tive techniques and how. Here, we also describe the associated tran-           cursor over an element [Fig14b]. Text can also be used in the form
sition from scientific visualization designed for experts to scientific        of annotations or labels to designate important structures.
visualizations for the general public, as well as challenges which
                                                                               Audio narration can be used to enhance visualizations [SH10].
arise in this process. Section 4 then describes the core of our pa-
                                                                               This allows the viewer to focus more on the visuals, since the nar-
per. Based on the summary in Section 2, we show how narrative
                                                                               rative is temporally linked to the visual elements.
techniques can be applied to medical data to generate stories for
the general public. We then discuss various aspects of our concep-             Moreover, graphical properties can be used to draw the reader’s
tualized medical stories in Section 5 and identify a research agenda           attention. Elements can be highlighted using wrapped shapes, spe-
that highlights promising aspects for future work in medical narra-            cific colors or techniques such as motion or close ups [SH10].
tive visualization in Section 6. The paper is concluded in Section 7.
                                                                               2.1.2. Connection of Story Elements
2. Ingredients of Narrative Visualization                                      To understand the explanatory nature of the interplay between story
                                                                               elements, connections must be made between them. Stolper et
A visual data story is composed of a series of specific facts, called
                                                                               al. [SLRS16] found three basic types to connect story elements.
story pieces, that are supported by data [LRIC15]. These story
pieces are visualized to convey important messages to the audi-                Interaction is an efficient way to connect story elements. Interac-
ence. Visualizations are enriched with story elements such as la-              tivity refers to the different ways a user can manipulate the visual-
bels, arrows, links, and textual explanations to clearly emphasize             ization, e.g., filtering, hovering, zooming, rotating, and translating
these messages and avoid ambiguity. The story pieces should be ar-             and also to how the user learns these methods (explicit instruction,
ranged into scenes on the basis of a meaningful genre and design               tacit tutorial, initial configuration) [SH10; SLRS16].

                                                                                     submitted to Eurographics Workshop on Visual Computing for Biology and Medicine (2021)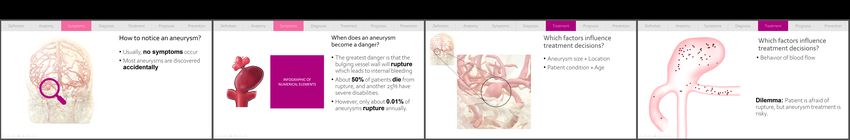
M. Meuschke, L. Garrison, N. Smit, S. Bruckner, K. Lawonn, B. Preim / Towards Narrative Medical Visualization                       3

                                  Figure 2: General genres of narrative visualization according to Segel and Heer [SH10].

   The level of interaction ranges from passive narration, where                            Commonly used techniques to navigate through a story are
no interaction is provided, to free exploration, where the user has                      next/previous buttons and scrolling. Flowchart arrows can help to
no interaction constraints [WH07]. Passive narration can be inter-                       convey the intended narrative structure of the story. To navigate to
rupted and the user can temporarily take control and change the                          a specific location, menu selections or interactive maps can be pro-
presentation, e.g., by using dynamic queries to change the visual                        vided. To show the user where s/he is in the story section header
style of an object. Afterwards, the passive narration continues.                         buttons, breadcrumbs in the form of points, and timelines in the
                                                                                         form of progress bars or checklists are often used.
Color is another option to link story elements. Consistent colors
should be used to represent objects or attributes that appear in mul-
tiple visualizations [SLRS16]. Color can also be used to connect                         2.2. Selecting Narrative Genres
text and visualizations by assigning text the same color as the as-                      To communicate the story in an understandable way, consideration
sociated visualized objects. However, the choice of color schemes                        must be given to how story elements are arranged and combined.
and the design of the color map play a crucial role. Crameri et                          Segel and Heer [SH10] have defined seven genres: magazine style,
al. [CSH20] presented guidelines to design color charts for scien-                       annotated chart, partitioned poster, flow chart, comic strip, slide
tific data, including perception effects to be considered.                               show, and film/video/animation, as depicted in Figure 2. These gen-
Animations can also be used to link objects that help users relate                       res differ in the number of scenes shown, and the arrangement of
complex processes in an understandable way. Care must be taken                           story elements within a scene. The choice of genre depends on the
to ensure that the user does not lose the focus while context infor-                     data complexity, as well as the intended audience and medium.
mation is needed for orientation. Therefore, smooth transitions be-                         For narrative medical visualization, magazine styles, where a 2D
tween different camera positions are required, where focus objects                       image is embedded in text, could be adapted to integrate 3D mod-
should be visually emphasized.                                                           els, with the text around explaining visible structures. In contrast,
                                                                                         flow charts can be used to show medical processes such as dis-
2.1.3. Defining Scene Transition                                                         ease treatment in an abstract way. Annotated charts can be used to
                                                                                         present statistical information, e.g., the prognosis as a function of
Moving within and between visual scenes without disorienting the
                                                                                         the selected therapy. The combination of images and diagrams in a
user is a fundamental aspect of storytelling. Segel and Heer [SH10]
                                                                                         partitioned poster is well suited to provide overviews or summaries
identified six types of transitions. One way is to keep the object
                                                                                         of medical explanations. Slide shows are commonly used in busi-
change between scenes to a minimum, maintaining object conti-
                                                                                         ness presentations. For the application to medical data, the user’s
nuity. The number and style of objects should not be fundamen-
                                                                                         attention should be kept by interactive components, where the s/he
tally changed between two cuts. Related to this is the concept of
                                                                                         is encouraged to interactively explore the data. Comic strips con-
familiar objects, which states that commonly used symbols should
                                                                                         sist of highly abstracted illustrations that contain only brief anno-
be used to represent facts. Another category involves meaningful
                                                                                         tations. An interesting scenario would be the cartoon-style illustra-
movement of the virtual camera. The view angle of the camera
                                                                                         tion of medical aspects for children. Videos, and animations would
should change between two scenes or when moving within a scene,
                                                                                         be well suited to support the exploration of 3D medical data. Op-
but not so much that completely different views are created. Also,
                                                                                         timal views on surfaces, such as vessels and organs, could show
strong changes in the camera movement speed between adjacent
                                                                                         structures of interest, e.g., the resection of a tumor.
scenes should be avoided. Continuity editing is an established tech-
nique from the film industry which creates the impression that the
story was shot in one piece without cuts. Another option is to use                       2.3. Selecting Narrative Design Patterns
animated transitions. Based on morphological transformations, ob-                        Depending on author intent and the audience, a story can be told
jects of one scene can be changed into objects of another scene.                         in different ways. Bach et al. [BSB*18] described eighteen narra-
                                                                                         tive design patterns that can be used individually or in combination
2.1.4. Defining a Scene Path                                                             to tell data stories. Each pattern has a specific purpose, with five
                                                                                         overarching groups. There are argumentative, structuring, framing,
Data-driven stories are usually characterized by an author-specified
                                                                                         emotional, and engaging patterns.
order. The story is thus given a structure that is supported by fre-
quent navigation aids. In addition to the specification of a strict                         Argumentative patterns include comparisons, concretizations,
path (linear story), there is the possibility to provide the user with                   and repetitions, to present, support, reinforce, contradict, or discuss
several paths to choose from (user-directed story) [SH10].                               a particular statement. They can be used, for example, to compare

submitted to Eurographics Workshop on Visual Computing for Biology and Medicine (2021)
4 M. Meuschke, L. Garrison, N. Smit, S. Bruckner, K. Lawonn, B. Preim / Towards Narrative Medical Visualization
treatment options, to present information that users should remem- defined as precisely as possible [BKV*20]. The background knowl-
ber (e.g., preventable risk factors), or to present the benefits of pro- edge and the goals of the audience are decisive for the design, the
tective measures, such as vaccinations. Structuring patterns include level of interaction allowed and how strongly the audience is guided
concepts such as revealing, slowing down, and speeding up. Fram- through the story. With regard to medical data, different audience
ing patterns determine how the story content is perceived through groups such as scientists, students, patients, health care providers,
techniques such as creating familiar settings, making guesses, de- or policymakers are conceivable, as shown in Figure 1.
familiarization, breaking conventions, hiding data, and using phys-
ical metaphors. Structuring and framing patterns are important to
present medical data, which usually contains different data types, 3.2. Challenges in Narrative Visualization
such as volume data, 3D models, quantitative values and qualita- Several challenges need to be considered when designing narrative
tive flow information. To communicate this data to general audi- visualizations for rich scientific data [BAC*19; YLB20]. We sum-
ences, it must be simplified, details must be omitted, and interest- marize the main challenges and their relation to medical data.
ing aspects, e.g., in statistical diagrams, should be revealed. Slow-
ing down, and speeding up could, e.g., be used to show blood flow Varying Spatial-Temporal Scales. In scientific data, the spatial
animations. In time ranges where interesting flow occurs, the ani- and temporal scales of objects can vary greatly [BAC*19]. Naviga-
mation is slowed down and in less interesting ranges the animation tion and interaction aids are needed that identify points of interest
is sped up [KPV*14]. Emotional patterns such as directly assessing both spatially and temporally. In medical data, the sizes of struc-
the audience and presenting individual stories are designed to help tures can vary greatly. For example, organs, such as the liver, are
understand and share important feelings in the story. To engage the several centimeters in diameter, while embedded structures, such
user into the story, techniques such as rhetorical questioning, call as vessels or cells, are many times smaller. Similarly, time scales
to action, and interactive exploration can be used. can range from hours that a treatment needs to years in long-term
follow-up of diseases.
3. Narrative Visualization of Scientific Data Varying Data Sources. Another problem are different types of data
coming from different sources [BAC*19]. Medical data can include
Numerous works combined narrative techniques and information
radiological and histological image data, numerical values, and sta-
visualization [TRB*18; GP01]. In contrast, there is little research
tistical information, which can be acquired with different devices,
on combining scientific visualization with narratives [MLF*11]. In
e.g., different scanners. Moreover, biomedical simulation data may
this section, we summarize the transition from expert-driven visual-
be relevant.
izations of scientific data, i.e., spatio-temporal data, to non-expert
visual representation of these data. We also provide insights into Data Access Issues. Another challenge that is particularly relevant
the challenges that arise during this transfer, especially for medical to medical data is making data available to the general public. From
data. Finally, we present selected scientific applications outside of an ethical point of view, mere anonymization of data is not suffi-
medicine, where narrative techniques have already been used. cient for their use in public scenarios. One solution to this could be
to use data derived from data donors.
3.1. From Scientific to General Audience Interaction and Navigation. The exploration of medical data by
Traditionally, visualizations were used by experts to gain detailed the general public requires to reduce complexity in terms of inter-
insights into complex data. Experts have a deep background knowl- action and navigation compared to systems for experts [YLB20].
edge of the respective domain and are able to evaluate and interact Otherwise, users can lose their desire to use the visualizations. The
with complex visualizations. design of the user interface should be tailored to the communication
goal of the story without noticeably restricting the exploration.
In contrast, a general audience includes people with varying
levels of expertise who differ in terms of age and cultural back- Occlusion management. In 3D scenes, special attention must be
grounds [BKV*20]. Bringing scientific results to a general audi- paid to resolve object occlusion. Virtual X-ray approaches and vol-
ence is challenging, as it [...] “is quite a different matter to compel umetric probes to adapt the opacity of occluding objects either au-
attention and understanding in a diverse, hurried, skeptical popula- tomatically or interactively [ET08] are suitable for narrative med-
tion of readers than to communicate with an eager, familiar group ical visualization. Whenever interesting objects are occluded in
of associates” [DiB90]. Therefore, the purpose of the visualization medical data, often smart visibility techniques, such as ghosted
should be clearly defined in the context of the target audience in views and cut away techniques, are applied [LSBP18].
order to fulfill the intended communication goals [BKV*20]. Storytelling and Exploration. To not overwhelm people with vi-
Results from cognitive science show that embedding data in a sual exploration opportunities, they should be guided through the
narrative makes it more exciting and memorable [MLF*11]. For story [YLB20]. In 3D medical visualization, this can be realized
this purpose, complex scientific results need to be reduced, summa- through automatic views, limited rotation capabilities, or prede-
rized and generalized by means of simplified and understandable fined parameter settings. The user should always know where s/he
visualizations. Compromises have to be made in terms of accuracy is in 3D space.
and completeness, since showing too many details can make it dif-
Flexibility and Performance. Due to different data types and
ficult to convey a clear message [BKV*20].
many possible scenarios, a system to interactively explore medical
To create a narrative visualization, the target audience must be data should be flexible regarding the integration of new interactions
submitted to Eurographics Workshop on Visual Computing for Biology and Medicine (2021)M. Meuschke, L. Garrison, N. Smit, S. Bruckner, K. Lawonn, B. Preim / Towards Narrative Medical Visualization 5
and rendering styles. In addition, robustness is important to make define an example scenario where the target audience comes into
software available to the general public. contact with medical data. Then, we select three common diseases
for story generation, discussed in Section 4.3, followed by explain-
ing the story preparation including data preprocessing and selection
3.3. Selected Examples of Narrative Scientific Visualization of an authoring tool in Section 4.4. Based on the defined template
Typical places where the general public comes into contact with and selected diseases, finally the medical stories are designed and
scientific data are museums, planetariums, exhibitions, and science presented in Section 4.5.
centers. Ma et al. [MLF*11] described projects of NASA’s Scien-
tific Visualization Studio in which narrative visualizations commu-
4.1. A Template for Narrative Disease Visualization
nicate investigations recorded with various instruments and sen-
sors. Further details are provided by captions, sound or live demon- Many university hospitals, scientific institutes or online encyclope-
strations. Media comprise UltraHD displays and hyperwalls, Dome dias put freely accessible blogs online to inform a general audience
shows, mobile, and 360 projections. about the development, diagnosis and treatment of various diseases.
We analyzed a total of 30 blogs for three selected diseases: Liver
Krone et al. [KSH*17] present design considerations of a scien-
cancer [0]-[0], brain aneurysm [0]-[0], and pelvic fracture [0]-[0]
tific exhibition in the Carl-Zeiss-Planetarium Stuttgart to inform a
according to their basic structure, since we have the same commu-
general audience about computer simulations comprising industrial
nication goal and want to address the same audience.
and molecular simulation examples. In different interactive scenar-
ious, the users are educated what simulation is, how they are com- The basic structure of these blogs is very similar. First, a short
puted and how the results can be visualized. A Microsoft Kinect and understandable definition of the disease is provided, and sta-
and Leap Motion are used as input device. For validation, the vis- tistical aspects such as the annual incidence and age-related distri-
itors could provide feedback using questionnaires about different bution between men and women are described. Next, an anatomi-
aspects of the exhibition. Although only a few visitors left feed- cal overview shows the location and function of the structures af-
back, this was very positive with regard to the comprehensibility fected by the disease. This provides the baseline for understanding
and engagement of the presentations shown. what is normal before introducing the disease itself. Using the ex-
ample of liver cancer, schematic sketches are used to explain where
Recently, Ynnerman et al. [YLB20] summarized how story-
the liver is located, its function, and important nearby structures.
telling is used in the Norrköping Visualization Center C. In addi-
tion to dome projections and VR setups, users can explore volume Subsequently, typical symptoms are explained usually as textual
data using multi-touch displays. These data comprise full-body CT enumeration. Afterwards, the diagnosis is explained. This com-
scans, which are visualized by direct volume rendering (DVR). prises frequently used examination methods, e.g., MRI, as well as
From a pre-defined image gallery, the visitors can select a transfer their sequence and reliability in order to make a diagnosis. The
function, which should be applied to the data. Visitors can interact procedure of each diagnostic method is briefly summarized and as-
directly with the visualizations, they can perform single and multi sociated inconveniences for the patient are explained.
touch gestures, e.g, rotate the volume or cut through it, but they can-
The diagnosis is typically followed by an overview of possi-
not select objects very precisely. Similar setups are used to explore
ble treatment options. Therapeutic procedures are summarized
a virtual human mummy [YRA*16] and biological structures that
including treatment risks and the associated chance of cure is es-
would not be visible to the naked eye [HSFT18]. However, besides
timated. Typically, 5-year prognoses are provided.
pre-defined transfer functions, textual descriptions, and videos no
further guidance through the complex data is provided. Finally, disease prevention is explained, where risk factors for
the development are summarized. A distinction is usually made be-
Narrative techniques have also been used to communicate poten-
tween preventable and congenital/genetic risk factors. This con-
tial future climate changes to the general public based on simulated
cluding consideration of risk factors serves as an appeal and clar-
data [BKV*20]. In order for the user to draw conclusions, various
ification that one’s own behavioral patterns can have a strong in-
visualization aspects must be taken into account. The choice of ap-
fluence on the development of life-threatening disease. The reader
propriate color scales is important to draw the user’s attention. Fur-
should be sensitized to think about their own habits and to adapt
thermore, combinations of visualization techniques, such as color
their lifestyle in a positive way.
and contour lines to show correlations, must be carefully explained,
e.g., by audio guidance. Based on this analysis, we derived a sequence of seven stages
forming a template, as shown in Figure 3, that can be used as a
basic pattern for applying narrative techniques to disease data.
4. Narrative Medical Visualization Concepts
In this section, we describe how narrative techniques can enrich
4.2. General Public Information
medical visualization so that users are able to easily understand,
absorb, and interact with the data. Our intended communication People interested in medicine come typically into contact with
goal is to inform people interested in medicine about a disease. medical data either in museums or science centers or through In-
To demonstrate the potential of narrative medical visualization, we ternet research on their home computers, where no specific doc-
first derive a template comprising potential stages of a story about tor patient connection exists. Similar to the Visualization Center in
disease data, as detailed in Section 4.1. Next, in Section 4.2, we Norrköping [YLB20], asynchronous storytelling based on a touch
submitted to Eurographics Workshop on Visual Computing for Biology and Medicine (2021)6 M. Meuschke, L. Garrison, N. Smit, S. Bruckner, K. Lawonn, B. Preim / Towards Narrative Medical Visualization
Figure 3: Derived template for narrative medical visualization of disease data that comprises seven stages.
display could be used to interactively inform about diseases. While has a higher incidence in young males, while in older populations
users at home would probably be more likely to use a tablet or their is more associated with women.
phone, larger interactive displays could be used in a science center
or museum. We show how narrative techniques can help medically
interested people to inform themselves about diseases at home or in 4.4. Medical Story Preparation
a science center. This is an asynchronous scenario where the user
interactively explores the data on their own. The goal is to give a For medical story design, some data preprocessing was necessary,
general overview of a disease, not focusing on anatomical varia- which we detail in Section 4.4.1. Essentially, this involves prepara-
tions or severity of a disease. tion of radiological image data. We also had to choose an authoring
tool to create scenes and define transitions between them, as dis-
cussed in Section 4.4.2.
4.3. Selected Disease Examples
For selecting example diseases, we oriented ourselves to the ba- 4.4.1. Data Preprocessing
sic structures of the human body, which are visible in radiological
image data: organs, vessels, and bones. Below, we outline our mo- For each story, an anonymous patient data set was used, comprising
tivation for selecting three specific disease examples. different radiological data types, such as ultrasound, MRI, and CT
images. As this data was anonymized, we had no access to patient-
Liver Cancer. Regarding organ diseases, we selected liver cancer. related meta information. Therefore, any introductory patient infor-
The number of new cases of liver cancer has doubled in the last 35 mation at the beginning of each story is fictitious. In the following,
years [LJY*19]. Accordingly, the interest in learning more about we shortly describe our data sets and necessary preprocessing steps.
this disease on the part of the general public is likely increasing.
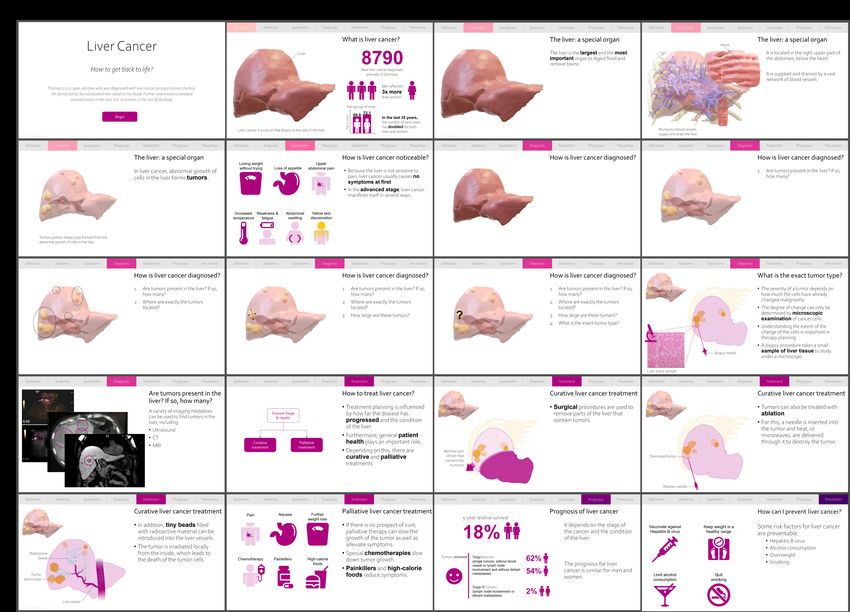
In Germany, approximately 8790 people (6160 men, 2630 women) Liver Cancer. We used a data set of a patient with a stage 1 liver
are newly diagnosed with liver cancer each year. The average age carcinoma provided by our clinical partners as sample data. In this
of onset is 69.9 years for men and 72.1 years for women. The in- data, small and medium-sized tumors without lymph node involve-
crease in annual new cases is associated with an increasing number ment and metastases were diagnosed in the liver based on ultra-
of patients with liver cirrhosis, the high rate of new hepatitis B in- sound and CT Angiography (CTA). In addition, the liver showed
fections, and increasingly frequent obesity. no cirrhotic changes. Due to multiple tumors, surgical removal was
not an option. Instead, the tumors should be treated with ablation.
Brain Aneurysms. For vessel diseases, we selected brain Based on the CTA data, the liver as well as the tumors were seg-
aneurysms, which are localized dilations of the brain vessels. In ad- mented using HepaVision [BSL*02]. Moreover, other surrounding
dition to older people, younger people are also frequently affected, structures such as the heart and ribs were segmented and trans-
making this condition of interest to the general public. About 3-5 % formed to 3D surfaces.
of all people likely have a brain aneurysm [BRR*17]. In most cases,
these aneurysms are found by chance and remain asymptomatic. Brain Aneurysms. For brain aneurysms, we used a data set from
Brain aneurysms are more common in people over the age of 40, Berg et al. [BRB*15], where a brain aneurysm was incidentally
where women are affected more often than men by a ratio of 5:3. found during CTA. The vasculature was segmented using the
Their greatest danger is that the vessel wall ruptures, which leads to pipeline presented by Mönch et al. [MNP11] and converted into
internal bleeding. The low incidence of rupture suggests that 80 % a volume grid. Computational fluid dynamics (CFD) simulations
to 85 % of all brain aneurysms will never rupture [SMC*09]. Due were used to calculate the blood flow behavior. Finally, particles are
to the low rupture rate and the existing treatment risks for the pa- traced in the resulting vector field to depict the blood flow. All sim-
tient, physicians must limit treatment to high-risk patients. ulation details can be found in the work by Berg et al. [BRB*15].
Pelvic Fracture. For bone-related diseases, we used a data set Pelvic Fracture. We obtained a CT dataset of a woman
showing a pelvic fracture, which is a break in any of the bones that with a pelvic fracture including pre-operative and post-operative
form the ring of bones at hip-level [GFJ*18]. Severe cases show scans. We performed direct volume rendering (DVR) in 3D
multiple fractures and/or an unstable fracture. This can occur as a Slicer [KPV14] in order to generate videos and images to support
result of high-energy trauma, e.g., car accident (20-22 %), or in frail our story. In addition, we provide interactive 3D scenes based on
or older patients from minor trauma, such as a fall (5-30 %). High- the Virtual Surgical Pelvis (VSP) model [SLK*16], which is in use
energy trauma-related pelvic fractures often come with accompa- as a virtual educational tool to teach pelvic anatomy [SHK*16].
nying injuries that require immediate treatment. Pelvic fractures The VSP consists of anatomical surface models based on expert
represent 3 % of skeletal injuries, with 5-16 % mortality (unstable segmentation of a cryosection data set. Selected VSP structures
pelvic fractures 8 %). All age groups can be affected, but trauma were embedded as interactive 3D models.
submitted to Eurographics Workshop on Visual Computing for Biology and Medicine (2021)M. Meuschke, L. Garrison, N. Smit, S. Bruckner, K. Lawonn, B. Preim / Towards Narrative Medical Visualization 7
4.4.2. Authoring Tool Selection Anatomy. Again, we use the magazine style to describe the
anatomy scenes. We describe the anatomical structures that are
We created the stories using PowerPoint 365 MSO version 2105.
necessary to understand disease development. These facts include
PowerPoint offers numerous possibilities to combine and visually
the location, importance, and function of the key anatomical struc-
arrange narrative elements. Animations and transitions can be de-
ture(s). Finally, we introduce the disease by super- or juxtaposing
fined and different file formats, such as images, videos and inter-
the pathology on the normal anatomy with a crossfade transition.
active 3D models, can be integrated. PowerPoint thus offers all the
functionalities we need to design basic concepts that show the po- Continuing the liver cancer story, the anatomical stage defines
tential of narrative visualizations for medical data. In addition, the four key facts: (1) the liver is the largest and the most important
wide availability of PowerPoint makes it a good choice for an in- organ to digest food and remove toxins, (2) it is located in the right
teractive narrative visualization intended for a general audience. upper part of the abdomen, below the heart, (3) it is supplied and
drained by a vast network of blood vessels, and (4) in liver cancer,
abnormal growth of cells in the liver forms tumors. We use several
4.5. Medical Story Design scenes to represent these key facts.
We use the derived stages shown in Figure 3 as the basic structure First, an automatic rotation of the 3D liver model gives an
for designing our medical stories. Thus, some scenes for the three overview of its anatomical shape, where a long-form textual de-
diseases are very similar. To avoid redundancy, we use the exam- scription with highlighted keywords provides more details. Follow-
ple of liver cancer to show a complete design of a medical story. ing familiar objects and object continuity concepts, the story transi-
For the two remaining diseases, we focus on illustrating disease- tions to show anatomical context around the liver: labeled 3D mod-
specific aspects. Visual placeholders are inserted for parts of the els of the ribs, heart, and liver vasculature. The last scene transi-
stories whose design is similar to the liver scenario. We attached all tions to show the disease: surrounding structures fade away and
created stories as supplemental material. the fully-opaque liver becomes translucent to reveal tumors within.
We have chosen the slideshow format as basic design genre. For The accompanying text discusses development of a liver tumor due
each stage, one or multiple slides are prepared as scenes. Within to abnormal cell growth.
the scenes, other narrative genres such as magazine style or par- The aneurysm and pelvic fracture stories both follow a similar
titioned poster are used. Smooth transitions are defined between introduction and flow of elements. However, a unique character-
scenes, with the timeline of stages visible in each scene. This way istic is the complex anatomical structure of the pelvis with mul-
the user always knows s/he is in the story. tiple bones and closely related vessels, organs, and nerves. In ad-
dition, for this patient we have pre- and post-operative data avail-
All three stories introduce a patient case to capture the user’s
able, which makes it possible to show treatment effects on real data.
attention. This consists of a catchy headline and a long-form tex-
To communicate these anatomical peculiarities and the treatment
tual description of the patient case, see Figure 4 (A1). In addition,
process, we combine hotspots, 3D models, and DVR, see Figure 5.
the patient description is read aloud as a voiceover. This patient
The user can interactively explore anatomical structures by clicking
description should help the audience to relate to the case and mo-
on the hotspots (A) by highlighting the corresponding anatomical
tivate them to continue with the story. By pressing the start button,
name in the text description or clicking on a structure of interest.
the user begins the actual story. Below, we provide detailed insights
into the scenes. Symptoms. Using the partitioned poster genre, a visual overview
of frequently-occurring symptoms is provided. For each symptom,
Disease Definition. Within the first scene, we use the magazine
we artistically create an icon with an accompanying caption. The
style to introduce the affected anatomy by an interactive 3D model
use of icons as opposed to purely text-based listings aims to in-
to provide an initial orientation to the topic. Inspired by the work of
crease memorability of symptoms.The symptoms are displayed one
Garcia [ASB*16], statistical parameters of the disease are depicted
after the other to give the user time to process each icon.
as information graphics with icons and laddered text to quickly ab-
sorb information. We exclude visual representations of the disease For liver cancer, we create icons and accompanying text for the
at this stage to avoid overwhelming the user. Via voice narration, following critical symptoms in advanced liver cancer: unexplained
the user is encouraged to rotate the model using their fingers. Since weight loss, loss of appetite, pain/pressure in the upper abdomen,
free rotation of 3D objects is difficult to handle for inexperienced increased temperature, weakness/fatigue, abdominal swelling, and
users, we limit rotation around a vertical axis with a finger move- yellowing of the skin, see Figure 4 (B2). We also identify key symp-
ment from left to right. toms of pelvic fracture, with the same storytelling mechanisms.
In the liver cancer story, we embed an interactive 3D liver model We had to adjust the aneurysm story, since we focus on acciden-
alongside textual components and information graphics, see Fig- tally detected aneurysms without symptoms. Treatment bears con-
ure 4 (B1). We do not yet show 3D models of the tumors or unnec- siderable risks, which can exceed natural rupture risk. Therefore,
essary surrounding anatomy. One of the most important statistical the aneurysm story communicates how rupture-prone aneurysms
parameters is the annual incidence, which is emphasized by the can be detected as shown in Figure 6. The first scene shows a
larger font size. Other parameters, such as the distribution between 3D aneurysm model representing an incidental finding (see Fig-
men and women and their average age of onset, are represented by ure 6 (A)). An illustrative superimposed magnifying glass helps
annotated information graphics and icons to aid recognition and to quickly see the aneurysm in the complex vascular tree. Next,
memorability. We apply similar concepts to the other two stories. aneurysm rupture is shown illustratively (see Figure 6 (B). Using
submitted to Eurographics Workshop on Visual Computing for Biology and Medicine (2021)8 M. Meuschke, L. Garrison, N. Smit, S. Bruckner, K. Lawonn, B. Preim / Towards Narrative Medical Visualization
information graphics and textual descriptions, arranged in maga- To the right, we detail the key aspects that determine treatment in
zine style, it should be made clear that a rupture occurs very rarely list form. This includes: the number of tumors present, their size,
but is very dangerous. Here, the information graphics are only in- whether they have grown into blood vessels or into surrounding
dicated by a placeholder, as these would be similar to the graphics tissue, whether they have already metastasized, how functional the
of the liver definition stage. liver still is, and the patient’s general health. On selection of the
curative therapy chart element, the user is directed through the set
Diagnosis. The diagnosis is discussed using a variety of media.
of curative therapies. Here, the user learns that the goal of curative
Key to this stage is informing the audience on how the diagnosis is
therapy is to cure the cancer, methods of which include (1) surgi-
achieved comprising diagnostic questions and imaging modalities.
cal removal of the tumor(s), (2) ablation, in which the tumor(s) is
Each diagnostic question is illustrated as an individual scene using
destroyed by heat or microwaves, and (3) radiation (Figure 4 (C4-
the magazine style. Important questions for liver cancer include,
A5)). The user then is taken through the palliative treatment scenes.
e.g., the size and location of tumors as well as the the exact tumor
We use icons to indicate alleviation of symptoms that were intro-
type. For this purpose, the 3D translucent liver model including the
duced earlier in the story, as well as new icons, such as those for
tumors is shown. The tumors are enriched by glyphs and annota-
chemotherapy, cytostatic drugs, and high calorie foods that may
tions to visually communicate the the main aspect of each related
prolong the patient’s life and relieve symptoms (see Figure 4 (B5)).
question (see Figure 4 (C2-C3)). Simple and clean vector illustra-
tions describe diagnostic procedures, e.g., liver biopsy to determine Prognosis. In addition to general statistics, the prognosis of a dis-
the exact tumor type (see Figure 4 (D3)). Procedures with anatomi- ease also includes several parameters depending on the severity and
cal views different than previously presented include a rotating 3D the chosen treatment. Since a detailed presentation of all dependen-
navigator model of the organ that helps for view orientation. cies and resulting parameters would overwhelm the general user,
The size and location of aneurysms in the brain vessels is also we limit ourselves to the most important parameters to give insight
a critical diagnostic question, which we handle slightly differently into the liklihood of a cure. Based on the partitioned poster genre,
(see Figure 6 (C)). This entails beginning with a localizing overall we produce an infographic-style illustration that makes use of color
view of the brain vessels with the translucent surrounding skull be- and laddered text to aid in information absorption and memory re-
fore a zoom and rotation transformation focuses the camera tightly tention of key prognostic information. We use glyphs for men and
on the aneurysm to emphasize its location and shape. Panning and women to convey that, unlike incidence, there are no significant
zooming allows the user to get even closer to the aneurysm, a de- prognostic differences between men and women.
tail view is shown in the form of a 3D aneurysm model, with blood
The prognosis for liver cancer depends on the cancer stage and
flow suggested by animated particles, see Figure 6 (D).
the condition of the liver [ASS*20]. We emphasize the relative 5-
Additional scenes give an impression of diagnostic imaging year survival, which is around 18 % for men and women, in the
modalities used. Here, the magazine style is again used to com- largest typeface with an attention-drawing accent color along with
bine image and text information. For each modality, a real image is icons indicating men and women (see Figure 4 (C5)). We use a
incorporated as an example, e.g., ultrasound, CT, and MRI in liver smiley symbol to indicate the group where tumor removal often ex-
cancer, where in each the tumors are highlighted by contours, see periences a positive outcome. For stage I tumors, the 5-year relative
Figure 4 (A4). We use similar concepts to show imaging modalities survival is around 62 % in women and around 54 % in men. In stage
employed in brain aneurysm and pelvic fracture diagnosis. IV, however, it is only 2 %. We repeat the use of larger typeface
with accent color for the survival with gender symbols at a slightly
Treatment. The treatment stage provides an overview of typical
smaller size. For both the aneurysm and pelvic fracture stories we
therapy options and key aspects that influence treatment decisions.
use a similar presentation of laddered text with accent colors for
We do not consider rarely performed treatments that can only be
percentages with symbols to indicate affected genders.
done in special centers.
The first treatment scene uses a flow chart combined with long- Prevention. In this stage, we focus on illustrating avoidable risk
form textual descriptions. The chart in form of a directed graph de- factors to give the user a sense of agency. Risk factors such as age
scribes the basic treatment approaches and their key aspects. By or genetic factors that a person cannot influence are excluded since
clicking on one of its nodes, the user gets more information in they are not actionable for the user. Similar to the symptoms, we
a magazine style about the selected treatment. Each treatment is use the partitioned poster genre and utilize icons to better recognize
shown as a 2D vector illustration of its key moment to provide clar- and understand the presented information, e.g., a martini glass for
ity. We again use a navigator icon with labels to indicate key as- the recommendation to reduce alcohol consumption.
pects of the procedure. An exception to this are the metal implants
The main risk factor for liver cancer is cirrhosis, caused typi-
used in fracture treatment, such as in the pelvis data (see Figure 5
cally by chronic hepatitis B virus infection, depicted with a syringe
(D)). Similar to bones in a CT scan, these can be easily visualized
and caption to vaccinate against hepatitis B, or high alcohol con-
by DVR, where optimal views from different perspectives can be
sumption, which we depict with an alcoholic beverage icon and a
shown. In case of palliative treatments where the target is more to-
caption to limit alcohol consumption (Figure 4 (D5)). Another risk
wards symptom alleviation, we use icons to create consistency and
factor is obesity which is depicted by a scale symbol with an arrow
repetition between this stage and the earlier symptom stage.
indicating increasing weight along with the caption “Keep weight
For example, in liver cancer there are essentially two treatment in a healthy range.”. Smoking also increases the risk of the disease,
strategies, curative and palliative [ASS*20] (see Figure 4 (B4)). which we depict with a barred cigarette icon with the caption “Quit
submitted to Eurographics Workshop on Visual Computing for Biology and Medicine (2021)M. Meuschke, L. Garrison, N. Smit, S. Bruckner, K. Lawonn, B. Preim / Towards Narrative Medical Visualization 9
Figure 4: All scenes of the liver cancer story covering the seven derived stages. The narrative sequence is A1, B1, ..., D1, A2 and so on.
Figure 5: Excerpts from the pelvic fracture story. A unique characteristic is the complex anatomical structure of the pelvis with multiple
bones and closely related vessels, organs, and nerves. Hotspots, 3D models, and DVR are combined to highlight these aspects and treatment.
smoking.” We can similarly use such icons to show risk factors for Content production. For our purposes of showing an initial con-
the brain aneurysm and pelvic fracture stories. cept for narrative medical visualization, the functionality of Pow-
erPoint for story creation was sufficient. However, its content pro-
duction feature set remains limited, with significant manual effort
5. Discussion
required to integrate multiple media types to tell a comprehensive
In the following, we outline general issues that arise during medical story. We used several external tools to bridge this gap, includ-
story creation. We cover principle decisions regarding scene design, ing Adobe Illustrator to produce icons and treatment illustrations.
such as story element style and underlying design patterns. Fur- While PowerPoint is able to embed 3D surface models, medical
thermore, we discuss necessary story adaptations to address other
diseases or other communication goals, e.g., education.
submitted to Eurographics Workshop on Visual Computing for Biology and Medicine (2021)10 M. Meuschke, L. Garrison, N. Smit, S. Bruckner, K. Lawonn, B. Preim / Towards Narrative Medical Visualization
Figure 6: Excerpts from the aneurysm storyboard. There is a trade-off between the rupture risk and the treatment risk. 3D models, concept-
driven visualizations, and blood flow depictions are combined to communicate this dilemma.
image feature extraction and advanced visualization, e.g., DVR, are rable icons convey avoidable risk factors. Our aim is to raise aware-
not supported, which led to a need to use additional software. ness of a disease and to encourage taking action and adopting a
healthier lifestyle.
Scene design. Following the suggestion of Böttinger et
al. [BKY20] to make scenes "as simple as possible without
risking scientific credibility," we extract as much information as Evaluation of Medical Stories. Our stories were designed by sci-
possible from real medical image data to generate data-driven entists with many years of experience in the visualization of med-
stories. However, for creating simple and clearly understandable ical data. One of our co-authors is a medical illustrator and thus
scenes for our target audience, visual abstraction and easy-to-use brings a lot of experience regarding the design of illustrations for
interaction techniques are necessary [VCI20]. We used textual and the general public. In this forward-looking paper, we have basically
verbal descriptions and avoided technical terms where possible. conceptualized what medical stories could look like. We have not
We added 2D vector illustrations to show important treatment yet done any evaluation with the intended audience which is funda-
concepts in a simplified way. While 3D data-driven models with mental for future work.
surgical instruments would also be possible, this creates visually
complex scenes that we felt may overwhelm or scare the user. Communication goals. In addition to informing, educating an au-
dience would be another important communication goal. For ex-
For touch-based interaction, we use interaction types that do not
ample, one possible scenario would be to teach students about var-
require a high degree of accuracy. These include single-touch ges-
ious medical conditions. The use of engaging patterns in the form
tures, e.g., rotation around a predefined axis and clicking on ob-
of interactive exploration to maintain students’ enjoyment during
jects, as well as familiar multi-touch gestures, such as panning and
the learning process is particularly important [RKO*20]. An op-
zooming. Such interactions take advantage of user familiarity with
tion could be to integrate an interactive quiz, where the user could
everyday objects such as smartphones and tablet PCs without re-
check how much they have learned from the story. Moreover, argu-
quiring extra equipment, such as a mouse or keyboard.
mentative patterns such as spaced repetition should be used to help
To select an appropriate narrative genre, there are currently no the user remember the most important facts.
guidelines on which genre is most suitable for a given context.
Since, we want an interactive and multi-media environment for our Furthermore, details on demand would be useful for learning. In
stories, slideshows seemed most appropriate. Within the scenes, we currently available apps, such as "language learning apps", the re-
often combine 2D/3D representations with textual descriptions ar- spective topic is explained using a meaningful example. In addition,
ranged in the magazine style to explain disease stages in a short and the user has the option of viewing further language-specific exam-
memorable way. In principle, we could also use another genre for ples to consolidate the learning material. This details-on-demand
the story or parts of the story, such as comics. Thus, a validation principle could be applied to medical data. Upon request, the user
and derivation of guidelines of contextual genre recommendations could see additional records, e.g. a stage IV liver cancer dataset,
is an important point for future research. with other anatomical features.
To inform the general public about a disease, we use all design
patterns defined by Bach et al. [BSB*18] (cf. Section 2.3). The two Application to other diseases. In this paper, we focus on diseases
most important patterns in our stories are framing by hiding data which can be diagnosed based on radiological image data. How-
and structuring by revealing data. For example, within the 3D mod- ever, several diseases require other technologies for diagnosis. Ex-
els only the most important structures are depicted while structures amples are respiratory diseases such as asthma, heart rhythm dis-
irrelevant to the story are excluded, e.g., other abdominal organs orders, or infectious diseases such as HIV, which are diagnosed by
in the liver scenario. In addition, combinations of 3D structures, pulmonary function tests, electrocardiogram, and blood tests, re-
annotations/glyphs, and textual descriptions are revealed sequen- spectively. While our basic division into the seven stages can also
tially to avoid confronting the user with a visual overload. We use be applied to such diseases, the media used must be adapted accord-
emotional and engaging patterns to capture and maintain the user’s ingly. For example, 3D models based on real data cannot be gen-
attention. We use an initial patient description to help users relate erated for infectious diseases. Similarly, treatment options would
to the story, and incorporate interactive components encouraging have to be adapted. The division into curative and palliative meth-
users to take action. Argumentative patterns in the form of memo- ods is not always possible, since many diseases cannot be cured.
submitted to Eurographics Workshop on Visual Computing for Biology and Medicine (2021)You can also read