Modeling gas exchange and biomass production in West African Sahelian and Sudanian ecological zones
←
→
Page content transcription
If your browser does not render page correctly, please read the page content below
Geosci. Model Dev., 14, 3789–3812, 2021
https://doi.org/10.5194/gmd-14-3789-2021
© Author(s) 2021. This work is distributed under
the Creative Commons Attribution 4.0 License.

Modeling gas exchange and biomass production in West African
Sahelian and Sudanian ecological zones
Jaber Rahimi1 , Expedit Evariste Ago2,3 , Augustine Ayantunde4 , Sina Berger1,5 , Jan Bogaert3 ,
Klaus Butterbach-Bahl1,6 , Bernard Cappelaere7 , Jean-Martial Cohard8 , Jérôme Demarty7 , Abdoul Aziz Diouf9 ,
Ulrike Falk10 , Edwin Haas1 , Pierre Hiernaux11,12 , David Kraus1 , Olivier Roupsard13,14,15 , Clemens Scheer1 ,
Amit Kumar Srivastava16 , Torbern Tagesson17,18 , and Rüdiger Grote1
1 Karlsruhe   Institute of Technology, Institute of Meteorology and Climate Research, Atmospheric Environmental Research
(IMK-IFU), Garmisch-Partenkirchen, Germany
2 Laboratoire d’Ecologie Appliquée, Faculté des Sciences Agronomiques, Université d’Abomey-Calavi, Cotonou, Benin
3 Biodiversity and Landscape Unit, Université de Liège Gembloux Agro-Bio Tech, Gembloux, Belgium
4 International Livestock Research Institute (ILRI), Ouagadougou, Burkina Faso
5 Regional Climate and Hydrology Research Group, University of Augsburg, Augsburg, Germany
6 International Livestock Research Institute (ILRI), Nairobi, Kenya
7 HydroSciences Montpellier, Université Montpellier, IRD, CNRS, Montpellier, France
8 IRD, CNRS, Université Grenoble Alpes, Grenoble, France
9 Centre de Suivi Ecologique (CSE), Dakar, Senegal
10 Satellite-based Climate Monitoring, Deutscher Wetterdienst (DWD), Offenbach, Germany
11 Géosciences Environnement Toulouse (GET), CNRS, IRD, UPS, Toulouse, France
12 Pastoralisme Conseil, Caylus, France
13 CIRAD, UMR Eco&Sols, BP1386, CP18524, Dakar, Senegal
14 Eco&Sols, Université Montpellier, CIRAD, INRAE, IRD, Institut Agro, Montpellier, France
15 LMI IESOL, Centre IRD-ISRA de Bel Air, BP1386, CP18524, Dakar, Senegal
16 Institute of Crop Science and Resource Conservation, University of Bonn, Bonn, Germany
17 Department of Geosciences and Natural Resource Management, University of Copenhagen, Copenhagen, Denmark
18 Department of Physical Geography and Ecosystem Sciences, Lund University, Lund, Sweden

Correspondence: Rüdiger Grote (ruediger.grote@kit.edu)

Received: 11 December 2020 – Discussion started: 5 February 2021
Revised: 23 April 2021 – Accepted: 12 May 2021 – Published: 24 June 2021

Abstract. West African Sahelian and Sudanian ecosystems           of phenology, we introduced soil-water availability as a com-
provide essential services to people and also play a signif-      mon driver of foliage development and productivity for all of
icant role within the global carbon cycle. However, climate       these systems. The new approach was tested by using a sam-
and land use are dynamically changing, and uncertainty re-        ple of sites (calibration sites) that provided NEE from flux
mains with respect to how these changes will affect the           tower observations as well as leaf area index data from satel-
potential of these regions to provide food and fodder re-         lite images (MODIS, MODerate resolution Imaging Spectro-
sources or how they will affect the biosphere–atmosphere ex-      radiometer). For assessing the simulation accuracy, we ap-
change of CO2 . In this study, we investigate the capacity of a   plied the calibrated model to 42 additional sites (validation
process-based biogeochemical model, LandscapeDNDC, to             sites) across West Africa for which measured aboveground
simulate net ecosystem exchange (NEE) and aboveground             biomass data were available. The model showed good per-
biomass of typical managed and natural Sahelian and Suda-         formance regarding biomass of crops, grass, or trees, yield-
nian savanna ecosystems. In order to improve the simulation       ing correlation coefficients of 0.82, 0.94, and 0.77 and root-

Published by Copernicus Publications on behalf of the European Geosciences Union.
3790                                                         J. Rahimi et al.: Modeling gas exchange and biomass production

mean-square errors of 0.15, 0.22, and 0.12 kg m−2 , respec-             Several modeling approaches, which concentrated on
tively. The simulations indicate aboveground carbon stocks          land-use management (Boone et al., 2004) or population dy-
of up to 0.17, 0.33, and 0.54 kg C ha−1 m−2 for agricultural,       namics (Tews et al., 2006; Tews and Jeltsch, 2004), have been
savanna grasslands, and savanna mixed tree–grassland sites,         used to describe savanna ecosystem processes and semiarid
respectively. Carbon stocks and exchange rates were par-            cropland development over the past decades. If physiological
ticularly correlated with the abundance of trees, and grass         processes were covered, they were treated with very coarse
biomass and crop yields were higher under more humid cli-           resolution (Scheiter and Higgins, 2009) or for herbaceous
matic conditions. Our study shows the capability of Land-           species only (Delon et al., 2019; Grote et al., 2009b). Few
scapeDNDC to accurately simulate carbon balances in natu-           terrestrial modeling approaches have been evaluated against
ral and agricultural ecosystems in semiarid West Africa un-         field observations in order to assess their ability to simu-
der a wide range of conditions; thus, the model could be used       late ecosystem C dynamics and the biosphere–atmosphere
to assess the impact of land-use and climate change on the re-      exchange of savanna-type ecosystems (e.g., Whitley et al.,
gional biomass productivity.                                        2016, 2017). It has been specifically highlighted that it is
                                                                    crucial to represent the plant phenological development for
                                                                    semiarid systems with strong seasonal variations in plant wa-
                                                                    ter availability, which is something that most models fail to
1   Introduction
                                                                    achieve (Pitman, 2003). Indeed, the phenology of deciduous
Land-cover and land-use changes significantly affect water,         plants including most crops is usually related to tempera-
carbon (C), and energy exchange processes between the bio-          ture development, which is generally the limiting factor in
sphere and the atmosphere and, thus, climate change (Massad         temperate ecosystems (Vitasse et al., 2011; Wesolowski and
et al., 2019; Pielke et al., 2011). Within the larger biomes, sa-   Rowinski, 2006). For tropical (and sometimes also boreal)
vanna or semiarid grassland systems have been highlighted           regions, which are assumed to be evergreen, phenology is
as being of particular importance: on the one hand, they            often forced or completely neglected (Mougin et al., 1995;
are assumed to store large amounts of C (Elberling et al.,          Saleska et al., 2003). In savannas, however, the growth of
2003; Scholes and Hall, 1996); on the other hand, they ex-          new tissues in grass and trees is often related to the onset of
perience large C exchanges (Ahlström et al., 2015). Addi-           the rainy season, indicating that water availability is a cru-
tionally, savannas are vulnerable to climate change, specifi-       cial determinant (Kucharik et al., 2006). Models that account
cally to changing rainfall patterns or increasing fire intensity    for this influence are still rare. However, water supply has
or frequency (Grossiord et al., 2017; Livesley et al., 2011).       been included in a few models as a direct impact on budburst,
In particular, the role of West African savanna systems in          which defines the start of growth for grasses in semiarid re-
global C cycling has attracted increasing attention over the        gions (Akponikpè et al., 2010; Ivanov et al., 2008; Loustau et
last decade (Quenum et al., 2019; Bocksberger et al., 2016;         al., 1992). Moreover, Yuan et al. (2007) used simulated soil
Sjöström et al., 2011) due to considerable changes in climate       moisture values as a driver to modify the phenological devel-
but also owing to considerable changes in land cover, such          opment of the grass layer of a semiarid steppe, and Jolly and
as the extension of agriculture and the intensification of for-     Running (2004) defined the onset of budburst for a grass-
est logging (Odekunle et al., 2008). These changes may al-          dominated Kalahari ecosystem as the date on which daily
ready have and will further affect the C exchange rates be-         precipitation exceeded potential evaporation and the start of
tween semiarid West African savanna ecosystems and the at-          leaf senescence as the point at which soil moisture falls be-
mosphere, which might not only affect biomass production            low a defined threshold. Nevertheless, while important for
but may also threaten biodiversity as well as the livelihood of     grasses, most trees do not seem to be bound to a minimum
people (Dimobe et al., 2018; Hartley et al., 2016; Dayamba          water content of the upper soil layers for leaf flushing, possi-
et al., 2016).                                                      bly because they have access to deeper water reserves (Do et
   Hence, in order to better understand the impacts of cli-         al., 2005).
mate and land-use change on biosphere–atmosphere interac-               Thus, the simulation of C balances in semiarid tropical
tions across West Africa, it is important to improve our un-        systems such as those found in West Africa requires a close
derstanding of ecosystem C cycling and C exchange with the          and consistent link between rainfall, soil, and vegetation pro-
atmosphere. This can be done by using existing knowledge            cesses (Boke-Olén et al., 2016). Moreover, as many of the
to set up ecosystem models and to test if these models are          ecosystem types found in this region are composed of a
able to (a) realistically represent the sensitive responses of      tree–shrub layer and a layer of ground vegetation (mainly
semiarid ecosystems to climatic variation and land-use man-         grasses, sometimes also crops), models should be able to dis-
agement, and (b) accurately represent C exchange processes          tinguish between different vegetation types and their compe-
as well as (c) the distribution of above- and belowground C         tition for light and other resources. In addition, it needs to
pools.                                                              be considered that many of the savanna ecosystems are used
                                                                    by pastoralists or mixed crop–livestock farmers for grazing

Geosci. Model Dev., 14, 3789–3812, 2021                                             https://doi.org/10.5194/gmd-14-3789-2021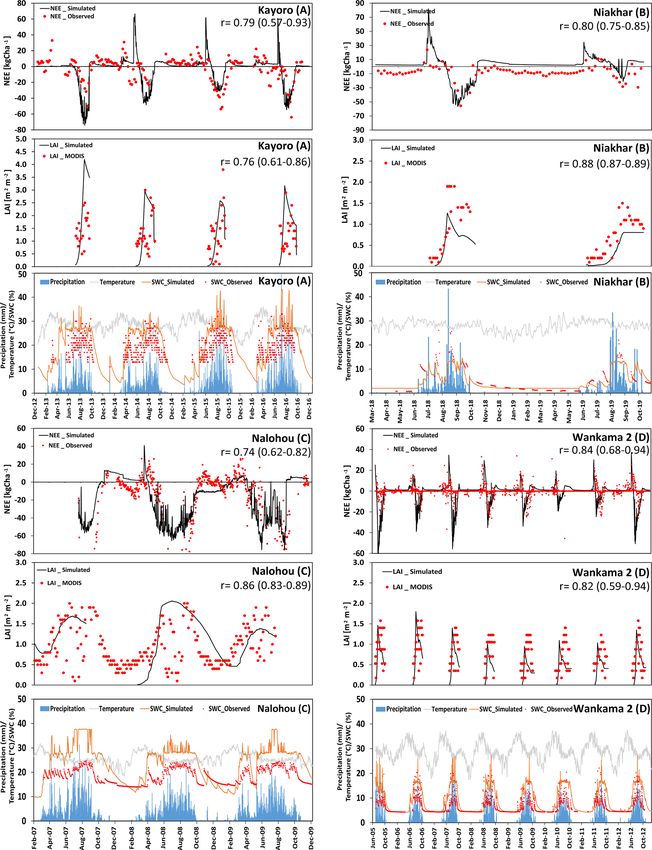
J. Rahimi et al.: Modeling gas exchange and biomass production                                                              3791

and cropping (Ker, 1995). Thus, these management options          temperatures vary between 25 and 31 ◦ C and the annual pre-
should also be represented in the model.                          cipitation is between 150 and 600 mm. The length of dry sea-
   In this study, we parameterized, complemented, and eval-       son lasts for 7–9 months annually and the monthly precipita-
uated LandscapeDNDC (Haas et al., 2013), a model frame-           tion maximum is in August. The Sudanian zone, which cov-
work that uses the soil C processes, nitrogen (N) pro-            ers approximately 1.7×10⁶ km2 , is cooler (22–29 ◦ C), wetter
cesses, and water processes derived from the original DNDC        (600–1200 mm yr−1 ), and the dry season length is around 4–
(DeNitrification-DeComposition) model (Li et al., 1992).          7 months with monthly maximum precipitation also occur-
The framework can be combined in a flexible manner with           ring around August (NASA POWER climate dataset, https:
cohort-based ecosystem models (Grote et al., 2011b) as well       //power.larc.nasa.gov/, last access: 16 June 2021).
as crop growth models (Kraus et al., 2016). So far, the
model framework and its predecessors have been used and           2.2     Datasets for simulation and evaluation
applied to various natural and managed temperate and trop-
ical ecosystems such as forests, grasslands, or rice paddies
(Kraus et al., 2016), including savanna grasslands (Grote et      2.2.1    Initialization, climate, and deposition
al., 2009b). However, to date, it has never been tested for its
suitability to simulate C fluxes over a wide range of different   As model input data, initial soil and vegetation properties
managed and natural savanna ecosystems including different        as well as daily climate data are required. Land manage-
vegetation types.                                                 ment needs to be prescribed as boundary conditions. The
   For this analysis, a literature review was first carried out   soil parameters were bulk density (kg m−3 ), pH, soil texture
to find suitable parameters for the physiological processes       (i.e., clay, silt, and sand content), organic C and N content
of typical grass and tree species in Sahelian and Sudanian        (kg kg−1 ), and soil hydrological parameters (i.e., field capac-
savanna ecosystems. Furthermore, thresholds of soil-water         ity, wilting point; in mm m−3 ). These were gathered from
availability for leaf development and senescence, which were      available literature sources for each site and complemented
derived from 12 sites with ample data available for several       by information from the principal investigators (PI) of these
years, were introduced. Finally, the model was evaluated          sites. In a few cases, soil information was complemented by
against data from other sites representative of the region, in-   data from ISRIC-WISE (International Soil Reference and In-
cluding eddy flux measurements, satellite data, and in situ       formation Centre – World Inventory of Soil Emission Poten-
biomass measurements for both managed and natural ecosys-         tials) soil dataset (Batjes, 2008). Similarly, vegetation was
tems.                                                             initialized using data of the amount of grass biomass, tree
   The objective of this paper is to test the ability of the      sizes (average height and breast height diameter), and num-
LandscapeDNDC model in its current form to simulate C             ber of trees per hectare as recorded at the sites.
fluxes and stocks for various representative savanna ecosys-         Input climate data were maximum and minimum temper-
tem types with varying human management activities within         ature (◦ C), precipitation (mm), relative humidity (%), solar
the Sahelian and Sudanian regions.                                radiation (W m−2 ), and wind speed (m s−1 ). These data were
                                                                  either obtained directly from measurements at the sites or
                                                                  were sourced from the NASA POWER climate dataset. Ex-
2     Material and methods                                        cept for Kelma, all sites were assumed to have no ground wa-
                                                                  ter access down to their maximum rooting depth of 1 m. For
2.1    Study area                                                 the Kelma site, a flooding period was prescribed for 2005–
                                                                  2007, according to published water content data (Timouk et
West African semiarid drylands are located between 15◦ E–         al., 2009; de Rosnay et al., 2009). Management was also pre-
16◦ W and 7–19◦ N (between the Sahara and the Guinean             scribed for both agricultural sites and savanna grasslands that
zone) and are spread over 11 countries (Benin, Burkina Faso,      were occasionally grazed with cattle. Fire impacts were not
Côte d’Ivoire, Gambia, Ghana, Guinea, Mali, Niger, Nige-          considered.
ria, Senegal, and Togo; Fig. 1). Following a transect of de-         In addition to climate, daily input of dry and wet depo-
creasing precipitation from south to north, there is a gradual    sition of oxidized and reduced N compounds (nitrate, am-
transition from forest, woodland, savanna woodland, savanna       monia, nitric acid, and nitrogen oxide) were provided for
grassland, to semi-desert grassland (Kaptue Tchuente et al.,      the model runs. These were derived from the field mea-
2010). Along this gradient, the degree of ground cover and        surements within the IGAC/DEBITS/AFRICA (International
the proportion of woody species (trees, shrubs, and bushes)       Global Atmospheric Chemistry/Deposition of Biogeochem-
decreases and the vegetation becomes shorter. This region         ically Important Trace Species/AFRICA) project, in which
is classified into two distinct ecological zones, “Sahelian”      some of our investigation sites were also included (Agoufou,
and “Sudanian”, which differ mainly in terms of precipita-        Banizoumbou, Djougou, and Katibougou). According to this
tion amount and dry season length. In the Sahelian ecological     dataset, the total wet deposition of N was estimated to be
zone which extends over 1.3 × 10⁶ km2 , the average annual        around 3.2 kg, and dry deposition was estimated to be around

https://doi.org/10.5194/gmd-14-3789-2021                                             Geosci. Model Dev., 14, 3789–3812, 2021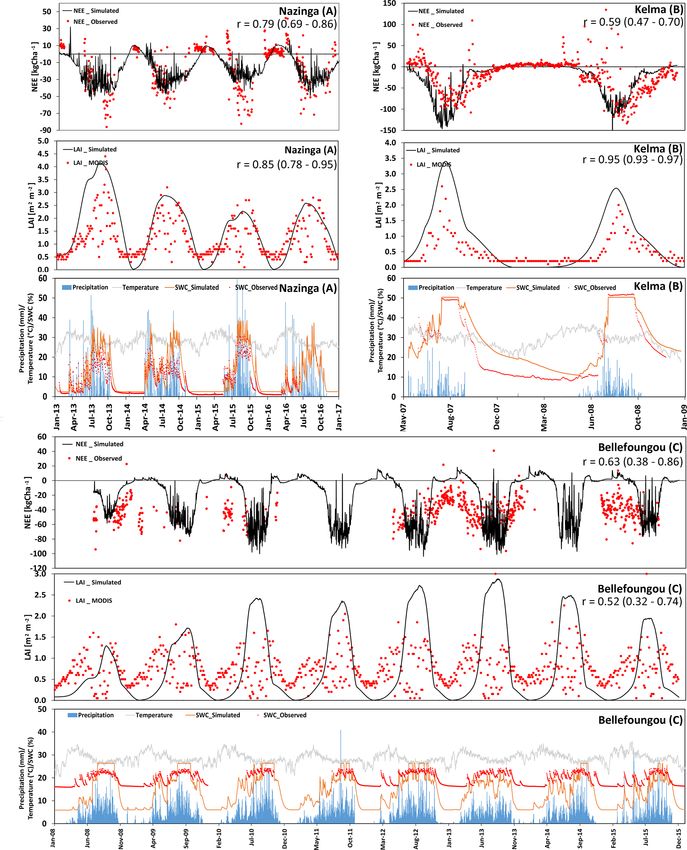
3792 J. Rahimi et al.: Modeling gas exchange and biomass production
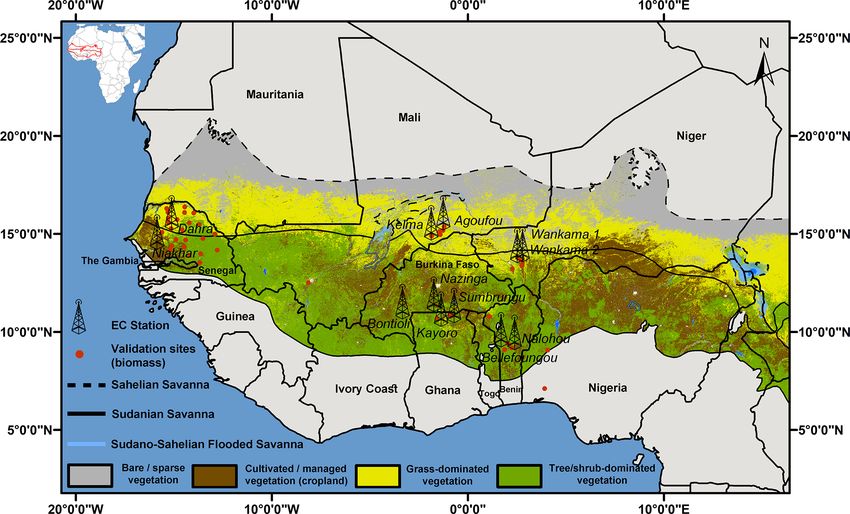
Figure 1. Map of West Africa showing the Sudanian and Sahelian vegetation zones that were derived following Buchhorn et al. (2020).
Locations of measurements are indicated as towers (eddy-covariance flux stations) or red dots (biomass production).
3.6 kg N ha−1 yr−1 , with only little variation between Sahe- helian ecological zones covering grassland savannas (from
lian and Sudanian ecosystems (Galy-Lacaux et al., 2014). sparse grasslands to shrublands), woodlands (including sea-
sonally flooded, open, and dense forests), and cultivated land
2.2.2 Carbon flux and soil moisture measurements types (with major crops including maize, Zea mays; mil-
let, Pennisetum glaucum; sorghum, Sorghum bicolor; peanut,
We collected net ecosystem C exchange (NEE) measure- Arachis hypogaea; and cassava, Manihot esculenta (Fig. 1;
ments from 12 flux tower sites, hereinafter called the Table 1). Five sites are located in the Sahelian ecologi-
core sites, in the Sudanian and Sahelian ecological zones. cal zone (Dahra, Senegal; Kelma, Mali; Agoufou, Mali;
These data were used for calibrating the new phenologi- Wankama-1 and -2, Niger), and seven in the Sudanian eco-
cal routine of the LandscapeDNDC model and to evalu- logical zone (Sumbrungu, Ghana; Bontioli, Burkina Faso;
ate simulations for crop-dominated, tree-dominated grass- Kayoro, Ghana; Nalohou, Benin; Nazinga, Burkina Faso; Ni-
land/woodland, and grass-dominated ecosystems. These akhar, Senegal; Bellefoungou, Benin). For more information,
eddy-covariance measurements were carried out within see Table 1 and the references therein.
the CARBOAFRICA (http://www.carboafrica.eu, last ac- In addition, soil moisture data measured close to the flux
cess: 16 June 2021), AMMA-CATCH (African Monsoon towers were used for evaluation of simulations. These mea-
Multidisciplinary Analysis – Coupling the Tropical At- surements took place mostly within the first 30 cm (CS616
mosphere and the Hydrological Cycle) observatory (http: soil moisture probes, Campbell Scientific Inc., USA), al-
//www.amma-catch.org, last access: 16 June 2021), and though deeper soil horizons were also considered at the
AMMA (http://www.amma-international.org, last access: AMMA sites. In few cases, only moisture of the uppermost
16 June 2021) projects, or by the WASCAL (West African layers were recorded for comparison with estimates from
Science Service Centre on Climate Change and Adapted satellite observations. Thus, in order to be consistent across
Land Use) research center (http://wascal.org, last access: sites, we use values recorded for the first 10 cm, which are
16 June 2021). also those with the most complete records.
The spatial distribution and characteristic of the core
sites show that they are well distributed across the ma-
jor natural and agricultural areas in the Sudanian and Sa-
Geosci. Model Dev., 14, 3789–3812, 2021 https://doi.org/10.5194/gmd-14-3789-2021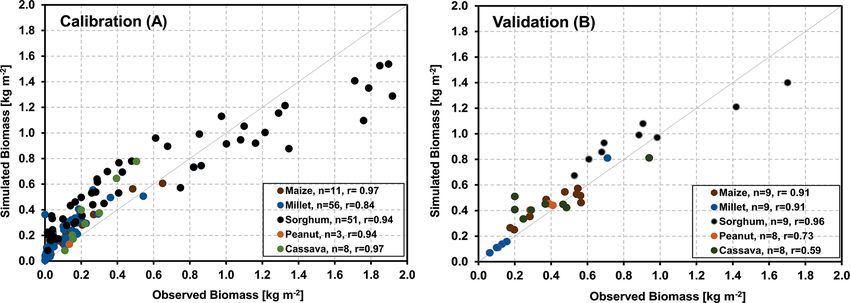
J. Rahimi et al.: Modeling gas exchange and biomass production                                                               3793

2.2.3   Aboveground biomass and leaf area
        measurements

Aboveground herbaceous biomass and crop yield were avail-
able from sampled measurements for all core sites except for
two of the Sudanian cultivated sites (Kayoro and Nalohou).
For the Kayoro site, biomass was assumed to equal that at
the Vea site in Ghana, and for the Nalohou site, maize data
were taken from the Dassari site in Benin and the Wa site in
Ghana, sorghum was taken from the Samanko site in Mali,
and cassava was taken from the Ikenne site in Niger, because
these sites have a similar climate.
   In addition, 42 sites representing cropland (11), grassland
savanna (27), and grassland ecosystems with significant tree
contributions (4) from which biomass data are available were
used for validating the revised model (Fig. 1). These sites are
located in Senegal, Benin, Mali, Ghana, Niger, and Burk-
ina Faso covering overall 70 years of observations within         Figure 2. Comparison between field LAI measurements and
the 1984–2018 period (not continuous for all sites). A total      MODIS (MCD15A3H) LAI estimation at different eddy-covariance
of 24 sites in Senegal (20 grassland and 4 savanna wood-          sites.
lands) that were monitored between 1999 and 2017 were
provided by the Centre de Suivi Ecologique (CSE; Diouf et
al., 2015). Data from four sites with contributions of trees as   from the MODerate resolution Imaging Spectroradiometer
well as grasses (Eguerit, Hombori Hondo, Tara, and Timba-         (MODIS) satellite data (MCD15A3H; Myneni et al., 2015).
dior) and one millet site (Bilantao) were obtained from the       Only pixels where the core sites are located were used. Previ-
Gourma region in Mali, representing a precipitation gradient      ous investigations of MODIS data have found them to be the
from 300 to 450 mm yr−1 . These field measurements cover          most suitable for representing the seasonality of vegetation
the period between 2005 and 2016 and were gathered within         dynamics (Gessner et al., 2013; Mougin et al., 2019). We un-
the African Monsoon Multidisciplinary Analysis (Mougin et         dertook an additional investigation using any data that field
al., 2019, 2009). Three more fallow and grassland sites are       site managers could provide, and our findings generally sup-
located in the Fakara region in western Niger (Banizoum-          ported the abovementioned view (Fig. 2). However, MODIS
bou, Tigo Tégui, and Kodey). Measurements here began in           data are somewhat higher than site measurements when LAI
1994, taken by the International Livestock Research Institute     is small and are lower when LAI is large. The reasons for
(ILRI; Hiernaux and Ayantunde, 2004), and continued until         this include particularly large fractions of missing data dur-
1999 under the responsibility of the AMMA-CATCH obser-            ing high-LAI episodes (Gessner et al., 2013), the size of the
vatory (Cappelaere et al., 2009). Furthermore, we gathered        pixels that often include a tree contribution at sites treated as
biomass production and yield data covering all major crops        agricultural or grassland sites here (Kahiu and Hanan, 2018),
of the core sites from three sources. The first dataset, con-     as well as other specific reasons that are addressed in the dis-
taining data for maize, millet, and sorghum for 2004, 2005,       cussions of the results for the specific sites.
2010, 2015, and 2016 (with different fertilization treatments
and different crop-sowing windows), consists of one site in       2.3     The LandscapeDNDC model
Benin (Dassari), two sites in Ghana (Vea and Wa), and sites
in Mali (Samanko) and Niger (Sadore) (Faye et al., 2018).         2.3.1    Description and parameterization
The second dataset, obtained in Upper Ouémé catchment
in the Republic of Benin (for 2001, 2002, and 2003), pro-         LandscapeDNDC is a framework for one-dimensional bio-
vides information on total aboveground biomass for three          geochemical models, which mainly simulate C, water, and N
sites (Dogue, Beterou, and Wewe) for peanut, maize, and           cycling between the atmosphere, vegetation, and soil at daily
sorghum production with different managements (e.g., dif-         to sub-daily temporal resolution for various ecosystems, i.e.,
ferent fertilization types/amounts) (Dagbenonbakin, 2005).        arable, grassland, and forest (Haas et al., 2013). We used ver-
The third dataset, used for validating LandscapeDNDC, was         sion 1.30.4 of this model (https://ldndc.imk-ifu.kit.edu/, last
from cassava fields from the Ikenne and Oke-Oyi sites in          access: 16 June 2021) including the MeTrx sub-model for
Nigeria (Sobamowo, 2016).                                         soil biogeochemistry and soil respiration (Kraus et al., 2015),
   Leaf area index (LAI; the one-sided leaf area per unit         the ECM sub-model for microclimate (Grote et al., 2009a),
ground area) data for comparison with measurements were           and the original DNDC routines to describe the water cy-
taken at a 4 d temporal and a 500 m spatial resolution            cle (Li et al., 1992; Kiese et al., 2011). For grasslands and

https://doi.org/10.5194/gmd-14-3789-2021                                            Geosci. Model Dev., 14, 3789–3812, 2021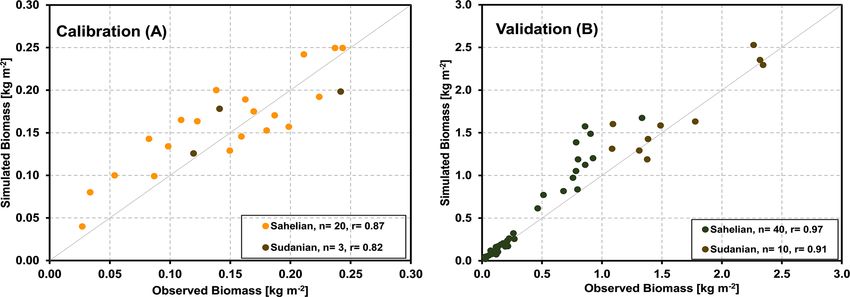
J. Rahimi et al.: Modeling gas exchange and biomass production
https://doi.org/10.5194/gmd-14-3789-2021
Table 1. Characteristics of eddy-covariance sites used in this study (MAT is mean annual temperature, MAP is mean annual precipitation, and the Zone column refers back to Fig. 1).
Site name Country Lat, long Zone Ecosystem Model category MAT MAP Soil type Overall water Overall water Period of flux Reference for
(◦ C) (mm) content at content at tower measure- description
field capacity wilting point ments
(mm m−3 ) (mm m−3 )
Agoufou Mali 15.34◦ N, 01.48◦ W Sahelian, grass Open grassland with Grass, grazed 30.2 374 Sand 178.9 42.8 2007-2008 Merbold et
dominated sparse shrubs al. (2009),
Mougin et
al. (2009)
Dahra Senegal 15.40◦ N, 15.43◦ W Sahelian, grass Grassland/Shrubland Grass, grazed 28.0 404 Sand 191.2 44.6 2015–2017 Tagesson et
dominated al. (2015)
Kelma Mali 15.22◦ N, 01.57◦ W Sahelian, grass Seasonally flooded Trees and grass 29.6 380 Clay-loam 295.4 98.7 2007–2008 Merbold et
dominated open woodland al. (2009),
Mougin et
al. (2009)
Wankama-1 Niger 13.65◦ N, 02.63◦ E Sahelian, grass Fallow land with Grass 29.5 510 Sand 178.9 42.8 2005–2012 Velluet et
dominated bushes al. (2014)
Wankama-2 Niger 13.64◦ N, 02.63◦ E Sahelian, culti- Cultivated land Agriculture (millet) 29.5 510 Sand 178.9 42.8 2005–2012 Velluet et
vated al. (2014)
Bellefoungou Benin 9.79◦ N, 01.72◦ E Sudanian, Protected woodland Trees and grass 27.0 1624 Loamy-sand 292.4 96.5 2008–2015 Ago (2016)
tree–shrub
dominated
Bontioli Burkina Faso 10.88◦ N, 03.07◦ W Sudanian, Grassland/Shrubland Grass 24.9 926 Sandy-loam 367.4 178.8 2004–2006 Brümmer et
tree–shrub al. (2008)
dominated
Kayoro Ghana 10.92◦ N, 01.32◦ W Sudanian, culti- Cultivated land Agriculture (sorghum, 28.0 994 Loamy-sand 149.4 54.1 2013–2016 Quansah et
vated peanut, millet) al. (2015),
Bliefernicht et
al. (2018)
Geosci. Model Dev., 14, 3789–3812, 2021
Nalohou Benin 9.74◦ N, 01.61◦ E Sudanian, culti- Cultivated savanna Agriculture (maize, 27.0 1190 Loamy-sand 292.4 96.5 2007–2009 Ago et
vated sorghum, peanut, al. (2014)
cassava)
Nazinga Burkina Faso 11.15◦ N, 01.58◦ W Sudanian, Pristine woody savanna Trees and grass 27.1 961 Sandy-loam 221.8 90.0 2013–2016 Quansah et
tree–shrub al. (2015),
dominated Bliefernicht et
al. (2018)
Niakhar Senegal 14.50◦ N, 16.45◦ W Sudanian, culti- Cultivated land Agriculture (peanut, 26.9 578 Sand 225.0 20.0 2018–2019 Roupsard et
vated millet) al. (2020)
Sumbrungu Ghana 10.85◦ N, 00.92◦ W Sudanian, grass Savanna grassland Grass, grazed 28.3 978 Loamy-sand 157.7 66.5 2013–2016 Quansah et
dominated al. (2015),
Bliefernicht et
al. (2018)
3794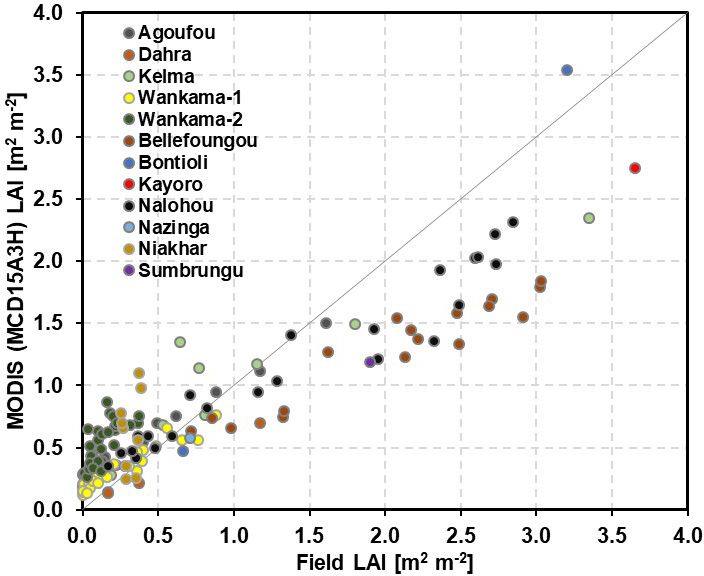
J. Rahimi et al.: Modeling gas exchange and biomass production                                                               3795

grass/woodlands, the PSIM physiological simulation module          conductance were iteratively calculated based on the Ball–
(Grote et al., 2011a; Werner et al., 2012) was used, which         Berry approach (Ball et al., 1987) using a scaling parameter
has been widely applied for forests, including sites where         (GSA, see Table 2) and the species-specific maximum con-
ground vegetation needed to be considered (Lindauer et al.,        ductance as parameters (minimum conductance is generally
2014; Dirnböck et al., 2020), as well as for savanna grass-        set to 10 mmol H2 O m−2 s−1 ). If relative soil-water avail-
lands (Grote et al., 2009b). However, the model does not           ability is lower than a threshold value, either the stomatal
consider the production of fruits or similar. Therefore, we        conductance (PSIM) or the photosynthesis itself (PlaMox )
applied the PlaMox module (Kraus et al., 2016; Liebermann          was linearly reduced (Leuning, 1995; Knauer et al., 2015).
et al., 2020), which has been developed particularly to de-        The threshold is defined as the species-specific parameter
scribed crop growth based on the same physiological pro-           H2OREF_GS or H2OREF_A, respectively (Tables 2, 3). In-
cesses as PSIM, for the agricultural plants.                       terception was calculated from LAI, which is the product of
   While parameters for agricultural crops were mostly de-         specific leaf area and foliage biomass, and specific intercep-
fined in a species-specific manner in the model already, in-       tion capacity following Gash et al. (1995). For soil-water
formation about physiological properties of savanna grass          availability, we assumed a rooting soil depth of 1 m for all
and tree species were newly collected from literature. Some        sites, with no difference between trees and grasses (according
properties were assumed to be ubiquitous for savanna trees         to the ISRIC soil database available at https://www.isric.org/
and grasses, but we also recognized some species-specific          explore/wise-databases, last access: 16 June 2021). Fine-root
differences between the Sudanian and Sahelian ecosystems.          abundance decreased exponentially with depth, with roots of
Therefore, we selected Acacia (in particular A. tortilis, also     grasses slightly more concentrated in the upper soil layers
known as Vachellia tortilis) as the dominant tree genus and        than tree roots (February and Higgins, 2010).
Cenchrus biflorus as the dominant grass species for the Sa-           Leaf flushing was assumed to begin when a threshold cu-
helian zone. For the Sudanian ecoregion, we chose Burkea           mulative daily temperature sum (growing degree days) had
africana as the dominant tree species and Andropogoneae (in        been reached and persisted for a defined period of days. The
particular Andropogon gayanus) as the dominant grass type          newly grown foliage was assumed to be fully shed after a
(Bocksberger et al., 2016; Geerling, 1985; Sotelo Montes et        period defined by the leaf longevity, and the shedding also
al., 2014). The parameters describing the specific physiolog-      needed a defined period of days (Grote, 2007). In order to
ical properties of each species are given in Table 2 for natural   account for the close relationship between leaf flushing of
species and in Table 3 for agricultural species.                   savanna grasslands and rainfall events, we included a con-
   Both vegetation models (PSIM and PlaMox ) used the Far-         straint that foliage only started to grow if the RWC was above
quhar approach (with the extension for C4 photosynthesis           a threshold value. Similarly, we also included a restriction
by Collatz) (Farquhar et al., 1980; Collatz et al., 1992),         so that drought-related senescence could only occur after fo-
which requires several parameters related to enzyme activ-         liage was at least 90 % developed. All phenological parame-
ities (also see Tables 2 and 3). Respiration was differentiated    ters were defined as the best fit to all Sahelian and Sudanian
into growth respiration and maintenance respiration. Growth        core sites for natural as well as agricultural systems, respec-
respiration was estimated as a fixed fraction of net photosyn-     tively (Tables 4, 5).
thesis (25 %). Maintenance respiration was calculated using
a linear relationship to N content but was modified by tem-        2.3.2   Model setup and initialization
perature and the relative depletion of C reserves as done by
Thornley and Cannell (2000). Carbon was allocated into the         All simulations used a 3-year spin-up to account for an un-
different plant tissues according to Grote (1998), with leaf       certain initialization of carbon and nitrogen pools that are ad-
expansion determined by growing degree sum (see below)             justing to general environmental conditions during this time.
and C supplied from previous-year storages.                        At agricultural sites, identical planting schemes are deployed
   Evapotranspiration was driven by potential evapotranspi-        with tilling always occurring before the planting date, mean-
ration, calculated with a modified Thornthwaite approach           ing that all straw and grasses that remained on the field were
(Camargo et al., 1999; Pereira and Pruitt, 2004; Thornth-          transferred to the soil and incorporated into the soil C and N
waite, 1948) that depends on temperature and day length and        pools. No additional irrigation nor fertilization was reported
drives transpiration demand except in periods with wet sur-        at any site and, thus, is also not simulated. Grasslands are
faces. Actual transpiration, however, is constrained by soil-      initialized with a total biomass of 1000 kg ha−1 at the begin-
water availability down to rooting depth (weighted by root         ning of the simulations at all sites and adjusted during spin-
mass density) as well as transpiration requirements for pho-       up years to a value that accounts for the competition on light
tosynthesis (calculated using a water use efficiency coeffi-       and water at the sites.
cient, WUEC; see Tables 2 and 3). WUEC is considered to
increase with decreasing relative available soil-water content
(RWC) for grasses and trees, but it is constant for crops.
Without soil-water restrictions, photosynthesis and stomatal

https://doi.org/10.5194/gmd-14-3789-2021                                             Geosci. Model Dev., 14, 3789–3812, 2021
3796                                                       J. Rahimi et al.: Modeling gas exchange and biomass production

Agricultural sites                                                3     Results and discussion

For Kayoro, peanut was planted first each year (June–July),       3.1    Agricultural sites
followed by pearl millet or sorghum that was harvested
in October. At the Niakhar site, pearl millet was sown on         Figure 3 shows measurements and simulation results for
15 May 2018 (sowing density of 0.8 m−2 ) and harvested on         NEE and LAI for the four core sites that are used for agricul-
12 October. In 2019, peanut was planted on 5 July (sow-           ture (Kayoro, Niakhar, Nalohou, and Wankama-2). It should
ing density of 8.33 m−2 ) and harvested at end of November.       be noted that LAI simulations are only shown during the
Wankama-2 had been under continuous millet cultivation,           crop-growing period and are otherwise assumed to be zero.
which was generally planted after the start of the wet sea-          For Kayoro in northern Ghana, the predominant cropping
son (around 10 July; sowing density of around 10 000 pock-        pattern between 2013 and 2016 is peanut in rotation with
ets per hectare) and harvested when precipitation had ceased      pearl millet (2013, 2015) or peanut in rotation with sorghum
(mid-October). At Nalohou, the landscape was more hetero-         (2014, 2016). Simulated seasonal dynamics and magnitudes
geneous and eddy flux measurements were influenced by             of NEE and LAI are well in accordance with measurements
both mixed crops and fallow bush. All crops at this site          (r = 0.79 and 0.76, respectively, Fig. 3). However, in 2013,
were planted/grown during the wet season (between April           the model overestimated LAI and, therefore, C uptake dur-
and September–October). The results were post-processed           ing the crop-growing period (−55.5 kg C ha−1 d−1 was es-
according to the footprint analysis (which indicates the con-     timated from measurements, whereas −72.1 kg C ha−1 d−1
tribution of each vegetation type to the measured flux for the    was simulated). A possible reason for this may have been the
wet and dry season), percentage of area planted by each crop,     occurrence of weeds, which may have prevented peanut and
and cropping pattern provided by Ago et al. (2014).               millet from growing to their full potential, or that the fetch
                                                                  of the eddy-covariance tower extended beyond the investiga-
Savanna sites                                                     tion area where less productive plants or bare land resulted in
                                                                  a reduction in the average data from measurements (Quansah
Grasslands were supposed to be fully covered with ei-
                                                                  et al., 2015).
ther the Sudanian or Sahelian grass type, whereas mixed
                                                                     At Niakhar, a representative site for the so-called “ground-
grass/woodlands were simulated by considering grass and
                                                                  nut basin” of Senegal, either pearl millet (2018) or peanut
tree species as different cohorts within the same simulation
                                                                  (2019) was grown in an annual rotation. LAI for millet and
run (Grote et al., 2011b). Therefore, competition effects be-
                                                                  peanut was underestimated by the model, both by approxi-
tween the plant groups depended on the abundance of trees
                                                                  mately 30 %. This is likely due to trees in the region (Roup-
which was characterized by a ground cover of 80 % in Belle-
                                                                  sard et al., 2020) that are considered in the observations but
foungou, 72 % in Nazinga (Sudanian), and 25 % in Kelma
                                                                  not simulated. Nevertheless, the deviations between mea-
(Sahel). This was initialized by first defining the dimension
                                                                  sured and modeled NEE were relatively small (r = 0.80). A
(height and diameter at 1.3 m) of the average tree at the
                                                                  possible uncertainty at this site is the presence of Faidherbia
specific site, calculating the ground cover according to al-
                                                                  albida trees (6.8 trees ha−1 ) that typically show a different
lometric relations described in Grote et al. (2020), and carry-
                                                                  phenology which explains a negative NEE (C uptake) during
ing out parametrization with data from the literature (Buba,
                                                                  the dry season that was not considered by the simulations.
2013). These calculations do not assume a difference be-
                                                                     At Nalohou, located in the Ara watershed in the northern
tween species allometry. The total number of trees at the
                                                                  part of Benin, four crops were planted sequentially and pe-
site was adjusted in order to reach the measured total ground
                                                                  riodically and several crops even grew simultaneously, ex-
cover.
                                                                  plaining the rather irregular shape of NEE and LAI (includ-
2.4    Statistical analysis                                       ing a continuous cover throughout the dry season in 2009).
                                                                  Nevertheless, simulations of both terms generally agree with
To identify the relationship between the simulated and mea-       measurements, showing average correlation coefficients of
sured NEE and LAI, a Pearson correlation coefficient (r)          0.74 and 0.86, respectively. Uncertainties are related to the
analysis was performed. The correlation coefficient measures      vegetation distribution. For example, a footprint analysis pre-
the strength of the linear relationship between two variables     sented by Ago et al. (2014) showed that crops contribute only
(here, between the simulated and measured NEE and LAI             about 77 % of the C exchange fluxes, whereas the rest is at-
during the crop-growing period for the agricultural sites and     tributed to natural savanna. Variation between years also oc-
for the entire year for savanna grasslands and savanna mixed      cur due to different climate conditions, such as the precipi-
tree–grassland sites).                                            tation that was about 25 % higher in 2009 than in 2008. The
                                                                  relatively high precipitation, which was above long-term av-
                                                                  erage in both years, may partly explain the insensitivity of
                                                                  NEE to the underestimation of water storage in the simu-
                                                                  lations. This underestimation mainly originates from a field

Geosci. Model Dev., 14, 3789–3812, 2021                                            https://doi.org/10.5194/gmd-14-3789-2021
J. Rahimi et al.: Modeling gas exchange and biomass production 3797
Table 2. Plant parameters affecting the C and water exchange in the PSIM vegetation model used for simulating biomass growth of natural
savanna ecosystem types.
Variable name Description Savanna trees Savanna grasses (C4 )
Sahelian Sudanian Sahelian Sudanian
(A. tortilis) (B. africana) (C. biflorus) (A. gayanus)
Parameters related to C gas exchange
AEJM Activation energy for electron transport rate 79 500a 77 900b
(J mol−1 )
AEKC Activation energy for Michaelis–Menten con- 79 430a 64 200c
stant for CO2 (J mol−1 )
AEKO Activation energy for Michaelis–Menten con- 36 380a 10 500c
stant for O2 (J mol−1 )
AERD Activation energy for dark respiration (J mol−1 ) 46 390a 50 967d
AEVC Activation energy for Rubisco carboxylation 65 330a 78 000c
(J mol−1 )
AEVO Activation energy for Rubisco oxygenation 37 530e 55 300c
(J mol−1 )
HDJ Deactivation energy (J mol−1 ) 201 950a 210 000c
SDJ Entropy term (kJ K−1 mol−1 ) 650a 645c
KC25 Michaelis–Menten constant for CO2 at 25 ◦ C 275a 650f
(µmol mol−1 )
KO25 Michaelis–Menten constant for O2 at 25 ◦ C 420a 450f
(µmol mol−1 )
THETA Convexity term for electron transport (–) 0.9g 0.7f
QJVC Ratio between electron transport rate and car- 3.65h 2.27i 9.80h 6.60j
boxylation capacity (–)
QRD25 Ratio between dark respiration and carboxyla- 0.03k 0.03k 0.026l 0.038m
tion capacity (–)
VCMAX25 Max. Rubisco activity at 25 ◦ C 49.6h 32.2i 40.7h 23.9m
Parameters related to water balance
GSMAX Max. stomatal conductivity 125n,h 230o
(mmol H2 O m−2 s−1 )
GSA Change rate of stomatal conductance with as- 9.5s 4.0s
similation (mmol H2 O µmol CO−1
2 )
H2OREF_GS RWC below which stomatal conductance is de- 0.3p 0.4p
creased (–)
MWFM Specific interception capacity of foliage 0.05q 0.5r 0.35q
(mm m−2 LAI)
SLA Specific leaf area (m2 kg−1 ) 10.8h 8.1t 13.1u 10.6v
WUEC Min. and max. water use efficiency 1.6–5.3w 1.0–5.0x
(mg CO2 g H2 O−1 ), linearly related to RWC
a Chen et al. (2008), b Massad et al. (2007), c Boyd et al. (2015), d Collatz et al. (1992), e Martin et al. (2000), f Von Caemmerer (2000), g Thornley (2002), h Sibret
(2018), i Kgope and Musil (2004), j Kim and Verma (1991), k Fürstenau Togashi et al. (2018), l Sonawane et al. (2017), m Feng and Dietze (2013), n Ullmann (1989),
o Simioni et al. (2000), p Baldocchi et al. (2004), q de Jong and Jetten (2007), r Running and Coughlan (1988), s Baldocchi and Meyers (1998), t Guenther et al. (1996),
u Chandra and Dubey (2008), v Setterfield et al. (2018), w Kebbas et al. (2015), and x Snyman (2005).
https://doi.org/10.5194/gmd-14-3789-2021 Geosci. Model Dev., 14, 3789–3812, 20213798 J. Rahimi et al.: Modeling gas exchange and biomass production
Table 3. Plant parameters affecting the C and water exchange in the PlaMox vegetation model used for simulating biomass growth and yield
at the agricultural sites.
Variable name Description C4 crops C3 crops
Maize Sorghum Millet Peanut Cassava
(Z. mays) (S. bicolor) (P. glaucum) (A. hypogaea) (M. Esculenta)
Parameters related to C gas exchange
AEJM See Table 2 77 900a 45 000b
AEKC See Table 2 59 430c 59 356d
AEKO See Table 2 36 000c 35 948d
AERD See Table 2 50 967e 66 405d
AEVC See Table 2 52 000f 36 000f 47 000f 58 520d
AEVO See Table 2 55 300i 37 530j
HDJ See Table 2 200 000k
SDJ See Table 2 630f 646k
KC25 See Table 2 650g 270h
KO25 See Table 2 450g 165h
THETA See Table 2 0.7g 0.9g
QJVC See Table 2 6.7g 2.0l 1.7m
QRD25 See Table 2 0.02e 0.01d
VCMAX25 See Table 2 100m 50n 50o 150 p 100q
Parameters related to water balance
GSMAX See Table 2 350r 340s 210t 650u 200t
GSA See Table 2 4v 10.4w
H2OREF_A RWC below which photosyn- 0.45x 0.5x
thesis is decreased (–)
MWFM See Table 2 0.05y
WUEC Water use efficiency 7.2z 5.0a1 6.0a2 3.0a3 9.0a4
(mg CO2 g H2 O−1 )
a Massad et al. (2007), b Groenendijk et al. (2011), c Yu et al. (2001), d Farquhar et al. (1980), e Collatz et al. (1992), f Sonawane et al. (2017), g Von Caemmerer (2000),
h Bernacchi et al. (2002), i Boyd et al. (2015), j Martin et al. (2000), k Kattge and Knorr (2007), l Ainsworth and Rogers (2007), m Caldararu et al. (2017), n Vico and
Porporato (2008), o Kothavala et al. (2005), p Pallas and Samish (1974), q de Souza Nóia Júnior et al. (2020), r Gleason et al. (2017), s Körner et al. (1979), t Da Matta et
al. (2001), u Vu (2005), v Sellers et al. (1996), w Baldocchi and Xu (2005), x from FAO database
(http://www.fao.org/3/X0490E/x0490e0e.htm#total%20available%20water%20(taw), last access: 16 June 2021), y Running and Coughlan (1988), z Holá et al. (2010),
a1 Ünlü and Steduto (2000), a2 Vitkauskaitė and Venskaitytė (2011), a3 Kalariya et al. (2015), and a4 Yao and Goué (1992).
As there is a certain variability for this parameter (H2OREF_A) with respect to species and sites, we conducted an additional analysis to assess how sensitive biomass
production of each crop species responds to this parameter. To do this, we varied H2OREF_A from 0.30 to 0.70 at each site and for each species. Results indicated that
when applying the upper limit of 0.7, productivity was lower than the standard value for C3 (0.5) and C4 (0.45) crops by 6.4 % for peanut, 3.9 % for millet, 1.9 % for
cassava, 0.78 % for sorghum, and 0.11 % for maize. Conversely, applying the lower limit of 0.3 increased productivity relative to the standard value by 3.8 % for peanut,
1.5 % for millet, 1.1 % for cassava, 0.07 % for sorghum, and 0.05 % for maize. Thus, the overall sensitivity of biomass production to the RWC threshold value of
photosynthesis decline was judged to be low.
capacity that has been initialized with a relatively small value over, simulated patterns of biomass development closely
based on site measurements and, thus, does not allow for the matched observations. The simulated C sink was on aver-
high moisture values that have actually been observed. It is age 810 kg C ha−1 yr−1 , whereas estimates based on mea-
obvious that the mismatch is caused by the small-scale het- surements were 720 kg C ha−1 yr−1 . However, the simula-
erogeneity of upper-soil conditions at this site. Overall, the tions indicate a larger variability in yields than indicated by
long vegetation period of Nalohou caused it to become a sub- measurements, leading, for example, to smaller than aver-
stantial C sink of 2814 kg C ha−1 yr−1 . age yields during 2009–2010 (0.12 kg m−2 compared with an
For Wankama-2, located in the southwest of the Repub- average of 0.21 kg m−2 ). These years were somewhat dryer
lic of Niger, annual rotations with pearl millet remained un- than average (320 mm of annual precipitation in 2009–2010,
changed throughout the 7-year study period (2005–2012). whereas the normal amount is around 410 mm yr−1 ), indi-
Simulated values were highly correlated with NEE and cating that the model seems to be too sensitive to changes
LAI, with coefficients of 0.84 and 0.82, respectively. More-
Geosci. Model Dev., 14, 3789–3812, 2021 https://doi.org/10.5194/gmd-14-3789-2021J. Rahimi et al.: Modeling gas exchange and biomass production 3799
Table 4. Plant parameters related to new phenological processes used in the PSIM model for describing dynamics in natural savanna ecosys-
tem types, derived from measurements at the core sites of the investigation.
Variable Description Savanna trees Savanna grasses
Sahelian Sudanian Sahelian Sudanian
(A. tortilis)a (B. africana)b (C. biflorus)c (A. gayanus)d
DLEAFSHED Leaf longevity (period from leaf flush to total 380 380 365 320
leaf loss; in days)
GDDemerg Threshold of cumulative temperature sum (◦ C) 2000 1000 4000 3300
H2OREF_FLUSH Min. RWC required to start flushing 0 0 0.1 0.4
H2OREF_SENES RWC at which senescence is induced 0 0 0.8 0.4
MFOLOPT Optimum amount of foliage biomass from re- 1.5 1.2 0.2 0.1
serves or seeds (kg m−2 )
NDFLUSH Period of leaf expansion (days) 150 150 80 80
NDMORTA Period of leaf senescence (days) 160 180 80 120
a Mougin et al. (2019), Timouk et al. (2009), and Sjöström et al. (2013); b Quansah et al. (2015) and Ago et al. (2016); c Delon et al. (2015), Hiernaux et al. (2009), Timouk et
al. (2009), Baup et al. (2007), Tagesson et al. (2016), Boke-Olén et al. (2016), and Velluet et al. (2014); and d Quansah et al. (2015) and Berger et al. (2019)
Table 5. Plant parameters that describe phenology and ontology/yield in the PlaMox vegetation model for agricultural simulations (taken
from the WOFOST model v.6.1 http://github.com/ajwdewit/WOFOST_crop_parameters, last access: 16 June 2021).
Variable name Description C4 crops C3 crops
Maize Sorghum Millet Peanut Cassava
(Z. mays) (S. bicolor) (P. glaucum) (A. hypogaea) (M. Esculenta)
Parameters related to phenology
SLA See Table 2 9 35 20 25 25
GDDemerg See Table 4 110 70 60 120 10
GDDflow GDD for flowering 860 670 1000 720 60
GDDgrain GDD for grain filling 780 820 1100 836 70
GDDmatur GDD for maturity 1560 1400 1800 1672 360
GDDbasetemp Base temperature for GDD calculation 10 11 10 10 0
in soil-water availability. Other uncertainties are potentially Wankama-1) and Sudanian (panels d–e: Sumbrungu and
varying planting densities and the occurrence of weeds. Bontioli) regions.
The results of the agricultural core sites were obtained The Agoufou site is located in the southern part of the
by calibrating the parameters that determine the maximum Gourma region in Mali, which is a typical Sahelian grass-
biomass and yield values separately for all five crops using land with 2 %–3 % tree cover (that was neglected in the sim-
observations. Accordingly, the deviation between measured ulation) on which occasional livestock grazing occurs. Corre-
and simulated biomass/yield values across all sites has been lation coefficients between the measured and modeled NEE
minimized, resulting in an overall correlation coefficient of and LAI over the period from 2007 to 2008 were 0.80 and
0.93 (Fig. 4a). Simulating biomass production for six further 0.88, respectively. Nevertheless, the impact of drought on
sites (17 years) across West Africa with the derived parame- NEE in autumn 2007 was overestimated, probably because
ters and no further adjustment yielded an overall correlation the simulated water content is lower than indicated by the
coefficient of 0.82 (Fig. 4b), indicating that the model was measurements (Fig. 5a, bottom panel). We attribute this un-
very suitable for representing the development of the major derestimation to a mismatch between the plot where initial-
crops throughout the investigated area. ization data were taken and the location of the measurements
similar to what we observed at Nalohou, although not only
3.2 Savanna grasslands the field capacity but also the wilting point is underestimated
in this case. Some small deviations after a sudden LAI de-
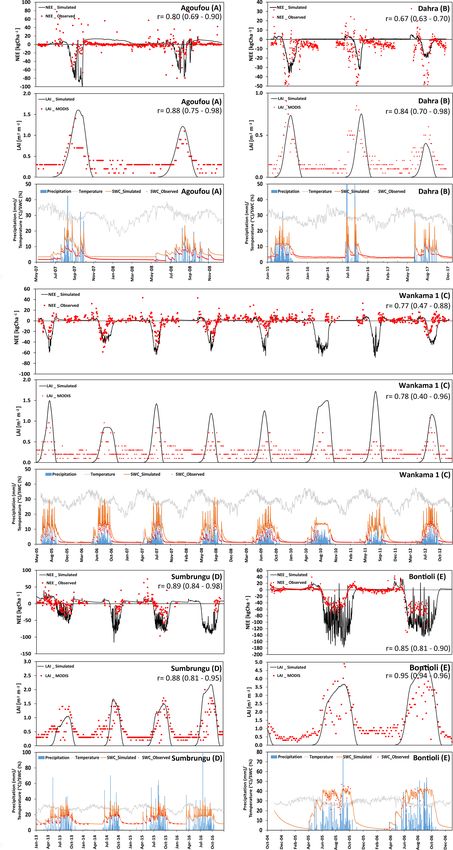
Figure 5 shows the comparison of measured and simulated crease in the middle of the first vegetation period can be seen
NEE and LAI for the five grass-dominant core sites used (Fig. 5a, middle panel). This was most likely caused by a
for calibration. They are differentiated according to their dry spell in September that triggered wilting of herbaceous
location in the Sahelian (panels a–c: Agoufou, Dahra, and
https://doi.org/10.5194/gmd-14-3789-2021 Geosci. Model Dev., 14, 3789–3812, 20213800 J. Rahimi et al.: Modeling gas exchange and biomass production Figure 3. (a–d) Time series of the observed and modeled NEE (kg ha−1 ; negative values represent a flux into the biosphere, and positive values represent a flux towards the atmosphere), LAI (m2 m−2 ), and soil-water content (at 10 cm depth). In addition, precipitation and temperature at four different crop-dominated sites in the Sahelian (d) and Sudanian (a–c) ecological zones are presented. Geosci. Model Dev., 14, 3789–3812, 2021 https://doi.org/10.5194/gmd-14-3789-2021
J. Rahimi et al.: Modeling gas exchange and biomass production                                                                      3801

Figure 4. (a) Observed and simulated annual biomass/yield production for crop-dominated sites involved in the calibration process over all
18 investigated years; panel (b) is the same as panel (a) but for 17 years at six additional validation sites.

vegetation but not of the grasses taken as representative veg-         and LAI were 0.77 and 0.78, respectively. However, in some
etation here. On the one hand, this indicates that care has to         years such as 2006 and 2012, the model assumed longer
be taken when selecting representative vegetation for a larger         vegetation periods and, thus, higher NEE which might be
region; on the other hand, it shows that satellite data are of         caused by a mismatch between physiological properties of
limited use when carrying out a comparison with estimates              assumed and actual species or an unusually intensive grazing
for specific sites. Belowground respiration also seems to be           that has not been adequately considered in the simulations
overestimated after the end of this vegetation period, which           (Fig. 5c). The average simulated NEE for Wankama-1 was
might be caused by the model assuming litter decomposi-                an uptake of 1894 kg C ha−1 yr−1 (the measured value indi-
tion of grass material that was fully or partly removed by             cates 1505 kg C ha−1 yr−1 but major data gaps prevent the
management activities. Overall, measurements indicate that             calculation of a meaningful annual average).
the Agoufou site acted as a C sink of 890 kg C ha−1 yr−1 ,                Regarding the Sudanian ecozone, the first core site is Sum-
whereas the net C sequestration according to simulations was           brungu, located in Ghana’s Upper East Province. The overall
761 kg C ha−1 yr−1 .                                                   correlation between NEE measurement and model simula-
   At the Dahra site, which is in the northern part of Sene-           tions was high (r = 0.89), even though simulations seemed
gal, the footprint of the eddy-covariance tower is also largely        to slightly overestimate the fluxes. According to the simu-
dominated by grass vegetation with occasional trees, lead-             lations, the maximum C uptake was in August and Septem-
ing to a negligible tree cover of 3 % (Tagesson et al., 2015).         ber at a rate of 29.3 kg C ha−1 d−1 . The average C loss over
There was general good agreement with NEE data (r =                    the dry period varies considerably from 4320 kg C ha−1 (in
0.67), even though the simulations did not capture the peak            2013) to 1487 kg C ha−1 (in 2015), correlating strongly with
net C uptake rates during the wet periods. Phenology also              the annual precipitation (679 mm of annual precipitation in
started too late, particularly in 2016 (Fig. 5b). The underes-         2013, whereas the normal precipitation amount is around
timation could be related to this site being more productive           978 mm yr−1 ).
than average with respect to this region because of its rela-             The second Sudanian site is Bontioli in the southwest of
tively high nutrient availability (Tagesson et al., 2016). Nev-        Burkina Faso. Here, absolute values of NEE were again over-
ertheless, both measurements and simulations indicate that             estimated by the model during the wet season. Nevertheless,
Dahra was a substantial C sink for all years (2015–2017).              simulations did capture the transition phase from dry and
   The Wankama-1 site in the southwest of the Republic of              wet period (Fig. 5d), although the simulated vegetation pe-
Niger is known as a fallow savanna (herbs and shrubs) where            riod was about 2–3 weeks longer than indicated by the eddy-
the land use remained unchanged from 2005 to 2012. The                 covariance measurements. However, there was a good corre-
relatively high abundance of shrubs (Boulain et al., 2009)             lation between measured and simulated LAI (r = 0.95), pos-
that are evergreen but have shading impacts on the surround-           sibly indicating that the efficiency of the plants in capturing
ing grass cover is not represented in the model and leads              C was underestimated. This might be caused by higher N
to an overestimation of grass LAI during the vegetation pe-            availability than indicated by the deposition regime – for ex-
riod and an underestimation during the rest of the year. Cor-          ample, due to the deposition of fertile ash from nearby fires
relation coefficients between measured and simulated NEE               (Bauters et al., 2018).

https://doi.org/10.5194/gmd-14-3789-2021                                                   Geosci. Model Dev., 14, 3789–3812, 2021
3802                                                            J. Rahimi et al.: Modeling gas exchange and biomass production

Figure 5. (a–e) Time series of the observed and modeled NEE (kg ha−1 ; negative values represent a flux to the biosphere, and positive
values represent a flux to the atmosphere), LAI (m2 m−2 ), and soil-water content (at 10 cm depth). In addition, precipitation and temperature
at different grass-dominated sites in Sahelian zone are presented.

Geosci. Model Dev., 14, 3789–3812, 2021                                                    https://doi.org/10.5194/gmd-14-3789-2021
J. Rahimi et al.: Modeling gas exchange and biomass production                                                                      3803

Figure 6. Correlations between the observed and modeled biomass production at different grass-dominated sites in the Sahelian and Sudanian
ecological zones for the calibration (a) and validation (b) data.

   Similar to the core crop sites, we used the parameters ob-          ally well simulated by the model, although the onset of the
tained for the core sites for the validation of the model’s            vegetation period was estimated somewhat too early by the
ability to represent grassland savanna sites. In Fig. 6a, the          model (Fig. 7b). Furthermore, measurements indicated high
aboveground biomass production simulated by the Land-                  levels of ecosystem respiration occurring at the end of the
scapeDNDC model is compared with field observations of                 dry period in 2007, which could not be fully represented by
23 samples from the five core sites. It demonstrates that the          the model. Such rewetting events are assumed to be related
simulated aboveground biomass production generally agreed              to increased decomposition and have been observed before
with the observations for all studied sites in the Sahelian and        (Epron et al., 2004; Grote et al., 2009b), but they remain
Sudanian ecological zones (correlation coefficient of 85 %).           challenging for soil C models to capture (see Fraser et al.,
The validation exercise with additional 27 grass-dominated             2016).
sites across Sahelian and Sudanian ecological zones is shown              In contrast, LAI at Bellefoungou in the Djougou district,
in Fig. 6b. It should be noted that some biomass yields in the         located in the northern part of Benin, was overestimated dur-
validation sites are considerably larger than those found in           ing the peak of the wet season and underestimated during
any of the core sites.                                                 transition phases (Fig. 7c), resulting in a relatively small
                                                                       correlation coefficient between the simulated and measured
3.3   Savanna mixed tree–grassland sites                               NEE and LAI (0.63 and 0.52, respectively). Again, this may
                                                                       be related to a relatively high density of (tree) species or
We also investigated the NEE and LAI of three grassland                to a mismatch between the selected tree and grass species
sites with a considerable but different tree contribution. Two         and the actual species composition (Ago, 2016; Mamadou,
of these sites are located in the Sudanian zone (Nazinga               2014). On-site observations show that the different species
and Bellefoungou) and one is located in the Sahelian zone              renew or keep their leaves throughout the dry season, in-
(Kelma). For the Nazinga site in southern Burkina Faso the             dicating that trees have access to deep ground water reser-
model was able to simulate the fluctuations in NEE and LAI             voirs, which is not considered in our simulations. There-
over time series well (correlation coefficient of 0.79 and 0.85,       fore, simulations cannot represent the continuous abundance
respectively). However, the model underestimated ecosys-               of LAI and carbon sequestration throughout the dry season
tem respiration during the dry period (especially in 2013),            (Fig. 7c). It should also be noted that MODIS estimates are
whereas LAI values (for both trees and grasses) were well              not very reliable at this site during the wet seasons because
simulated (Fig. 7a). The high variability in measured fluxes           of fog formation which impacts infrared and visible remote
showed C releases during wet periods, indicating that some             sensing measurements. Nevertheless, the simulated NEE in-
uncertainty exists with respect to species properties and the          dicated a similar cumulative annual NEE budget of about
measured footprint, possibly involving other species during            −5660 kg C ha−1 yr−1 as compared to measurements.
specific periods (Bliefernicht et al., 2018).                             As measured foliage or aboveground biomass data of
   The Kelma site, a facility located in the southern part of          trees were unavailable, we compare measured and simulated
the Gourma region in Mali, is specific with respect to its             herbaceous biomass, as harvested at the peak of the vegeta-
water supply because it is a seasonally flooded open wood-             tion period only (Fig. 8). For the five sites and across the two
land. Patterns and magnitudes of NEE and LAI were gener-               climate zones, simulations and measurements were highly

https://doi.org/10.5194/gmd-14-3789-2021                                                   Geosci. Model Dev., 14, 3789–3812, 2021
You can also read


