Differential spatiotemporal development of Purkinje cell populations and cerebellum-dependent sensorimotor behaviors
←
→
Page content transcription
If your browser does not render page correctly, please read the page content below
RESEARCH ARTICLE

                                    Differential spatiotemporal development
                                    of Purkinje cell populations and
                                    cerebellum-dependent sensorimotor
                                    behaviors
                                    Gerrit Cornelis Beekhof1†, Catarina Osório1†, Joshua J White1,
                                    Scott van Zoomeren1, Hannah van der Stok1, Bilian Xiong1,
                                    Ingo HMS Nettersheim1, Willem Ashwin Mak1, Marit Runge1,
                                    Francesca Romana Fiocchi1, Henk-Jan Boele1,2, Freek E Hoebeek1,3,
                                    Martijn Schonewille1*
                                    1
                                     Department of Neuroscience, Erasmus MC, Rotterdam, Netherlands; 2Princeton
                                    Neuroscience Institute, Princeton, United States; 3Department for Developmental
                                    Origins of Disease, University Medical Center Utrecht Brain Center and Wilhelmina
                                    Children’s Hospital, Utrecht, Netherlands

                                    Abstract Distinct populations of Purkinje cells (PCs) with unique molecular and connectivity
                                    features are at the core of the modular organization of the cerebellum. Previously, we showed that
                                    firing activity of PCs differs between ZebrinII-positive and ZebrinII-negative cerebellar modules
                                    (Zhou et al., 2014; Wu et al., 2019). Here, we investigate the timing and extent of PC differentiation
                                    during development in mice. We found that several features of PCs, including activity levels,
                                    dendritic arborization, axonal shape and climbing fiber input, develop differentially between
                                    nodular and anterior PC populations. Although all PCs show a particularly rapid development in the
*For correspondence:                second postnatal week, anterior PCs typically have a prolonged physiological and dendritic
m.schonewille@erasmusmc.nl          maturation. In line herewith, younger mice exhibit attenuated anterior-dependent eyeblink
†
 These authors contributed          conditioning, but faster nodular-dependent compensatory eye movement adaptation. Our results
equally to this work                indicate that specific cerebellar regions have unique developmental timelines which match with
                                    their related, specific forms of cerebellum-dependent behaviors.
Competing interests: The
authors declare that no
competing interests exist.
Funding: See page 26                Introduction
Received: 01 October 2020           The parasagittal organization of the cerebellum is fundamental to confer specificity to the coordina-
Accepted: 10 May 2021               tion and adaptation of behavior. This organization is based on cerebellar modules, that is, anatomi-
Published: 11 May 2021              cal and functional units (Apps and Hawkes, 2009; Voogd, 1964; White and Sillitoe, 2013), known
                                    to control specific tasks such as limb and finger movement (Horn et al., 2010; Martin et al., 2000),
Reviewing editor: Ronald L
Calabrese, Emory University,
                                    compensatory eye movements (De Zeeuw and Yeo, 2005; Graham and Wylie, 2012; Voogd et al.,
United States                       2012; Sugihara et al., 2004), and associative motor learning (Attwell et al., 2001; Hesslow and
                                    Ivarsson, 1994; Jirenhed et al., 2007; Mostofi et al., 2010; Raymond et al., 1996). Purkinje cells
   Copyright Beekhof et al. This
                                    (PCs) from different modules not only express different levels of molecular markers (Apps and
article is distributed under the
                                    Hawkes, 2009; Cerminara et al., 2015), such as ZebrinII (Brochu et al., 1990), but also have differ-
terms of the Creative Commons
Attribution License, which          ent physiological properties (Xiao et al., 2014; Zhou et al., 2014), project to discrete targets in cer-
permits unrestricted use and        ebellar and vestibular nuclei (Garwicz and Ekerot, 1994; Sugihara et al., 2009), receive climbing
redistribution provided that the    fiber (CF) input from unique subnuclei of the inferior olive (Sugihara and Shinoda, 2004;
original author and source are      Sugihara and Shinoda, 2007a; Voogd and Ruigrok, 2004), are linked to specific muscle groups
credited.                           (Ruigrok, 2011; Ruigrok et al., 2008) and are differentially predisposed to degeneration in

Beekhof, Osório, et al. eLife 2021;10:e63668. DOI: https://doi.org/10.7554/eLife.63668                                              1 of 34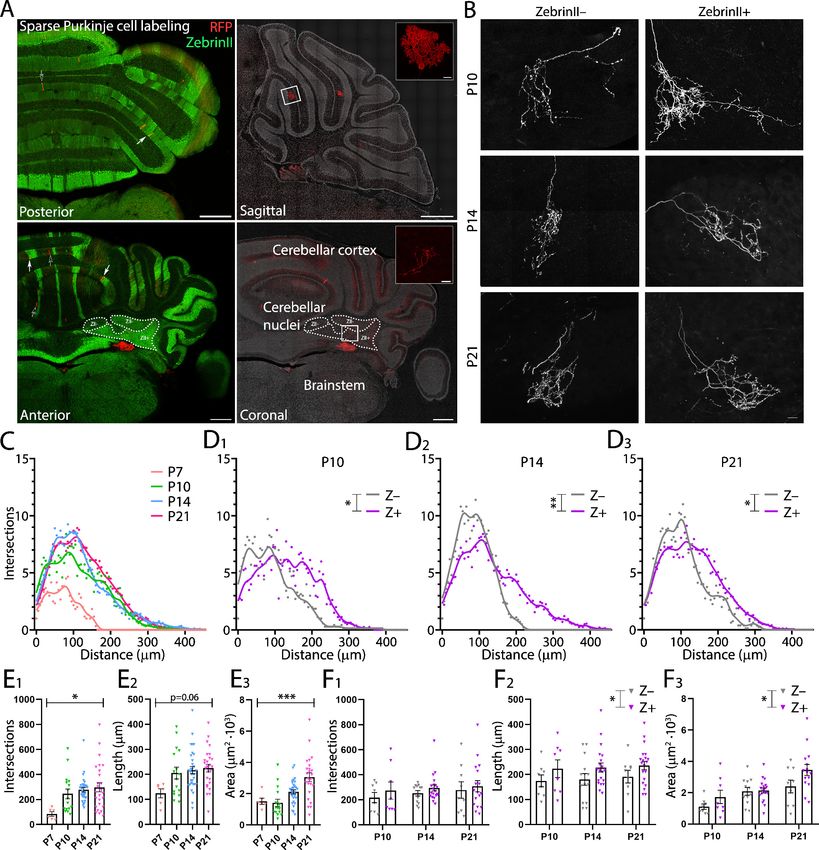
Research article                                                                             Developmental Biology Neuroscience

                                    neurodegenerative mouse models (Sarna and Hawkes, 2003). Although the role of PCs in cerebellar
                                    circuitry and motor behavior has been explored extensively in the adult, the mechanisms underlying
                                    early circuitry formation and its impact in early motor function have not been systematically investi-
                                    gated. Understanding earlier circuitry formation is crucial to deciphering the relationship between
                                    functional zones and cerebellum-dependent behavior.
                                        PCs are general orchestrators of cerebellar circuit development (Fleming and Chiang, 2015). For
                                    example, PCs contribute to the proliferation of granule cells through the release of Sonic Hedgehog
                                    (Lewis et al., 2004), as well as the parasagittal organization of afferents (Arsénio Nunes et al.,
                                    1988) and interneurons (Sillitoe et al., 2008). Concurrent to influencing this variety of developmen-
                                    tal processes, PCs undergo their own migration, monolayer organization and growth of their large
                                    planar dendritic trees and axonal arbors. Recent evidence suggests that transient disruptions in PC
                                    development can have lasting effects and influence the development of other brain areas
                                    (Badura et al., 2018; Wang et al., 2014). However, there is still a great deal unknown about the
                                    normal developmental timeline of the cerebellar principal neuron, the Purkinje cell. The timing of the
                                    PC birth is related to its ultimate placement in the cerebellar cortex, with earlier born PCs settling
                                    generally more laterally than later born PCs (Hashimoto and Mikoshiba, 2003; Namba et al., 2011;
                                    Sillitoe et al., 2009). Additionally, a precise reorganization from embryonic clusters of PCs into the
                                    parasagittal stripes of the mature cerebellum is indicative of a very straightforward process from
                                    embryonic origins into mature modules (Fujita et al., 2012). Ultimately, the anatomical location of a
                                    PC has a large impact on its function within the circuit, correlates with its intrinsic properties and is
                                    developmentally determined.
                                        Here, we sought to test the hypothesis that cellular and physiological differences in subpopula-
                                    tions of PCs in mice are established early in postnatal development and contribute to the formation
                                    of early cerebellar sensorimotor function. In vivo recordings revealed that by postnatal day (P) 12 it
                                    is possible to observe ZebrinII expression-related differences in firing rate of both simple (SSs) and
                                    complex spikes (CSs), and in vitro recordings in ZebrinII-positive (Z+) lobule X and ZebrinII-
                                    negative (Z–) lobule III confirmed that these differences are intrinsically driven as reported in the
                                    adult mouse and rat (Xiao et al., 2014; Zhou et al., 2014). Furthermore, we show that both PC pop-
                                    ulations also differ in their timeline of dendritic (from P18) and axonal (from P14) maturation. CF
                                    translocation appears to occur earlier in the nodular regions (by P7) further suggesting differences of
                                    developmental timelines between distinct cerebellar regions. Finally, we show that young animals
                                    (P21-P25), compared to adults, display more effective adaptation of compensatory eye movements,
                                    which is controlled by Z+ modules in the vestibulocerebellum (Zhou et al., 2014; Sanchez et al.,
                                    2002). In contrast, young animals show a reduction in their learning rate during eyeblink condition-
                                    ing, which is linked to anterior Z– modules (Hesslow and Ivarsson, 1994; Mostofi et al., 2010), fur-
                                    ther supporting the emerging concept of differences in circuitry maturation in distinct cerebellar
                                    regions. Overall, this study shows for the first time that PC subpopulations’ developmental timelines
                                    shape unique cerebellar circuitries that underlie different maturational profiles of specific cerebellar
                                    functions.

                                    Results
                                    Developing Purkinje cells operate at different rates depending on their
                                    cerebellar location
                                    Following our previous work (Zhou et al., 2014), we investigated when the differences between Z–
                                    and Z+ PC activity emerge during development. We first performed extracellular recordings in vivo
                                    in PCs of Slc1a6-EGFP or C57BL/6J awake mice (Figure 1A1). Slc1a6-EGFP mice express enhanced
                                    green fluorescent protein (EGFP) under the Slc1a6 promotor, an expression pattern that correlates
                                    with high levels of ZebrinII (aldolase C) (Gincel et al., 2007; Gong et al., 2003). PCs were identified
                                    during the recording by the presence of SSs and CSs, while the consistent presence of a pause in SS
                                    following each CS (i.e. climbing fiber pause [CF pause]) confirmed that the recording was obtained
                                    from a single unit (De Zeeuw et al., 2011; Figure 1A2-Figure 1—figure supplement 1A1). Addi-
                                    tionally, it was confirmed that CSs cause a pause in SS activity as the interval between CSs and the
                                    following SS was longer than the interval between two SSs in virtually all recorded cells (Figure 1—
                                    figure supplement 2A). PC recording locations were determined with biocytin or Evans blue, and

Beekhof, Osório, et al. eLife 2021;10:e63668. DOI: https://doi.org/10.7554/eLife.63668                                               2 of 34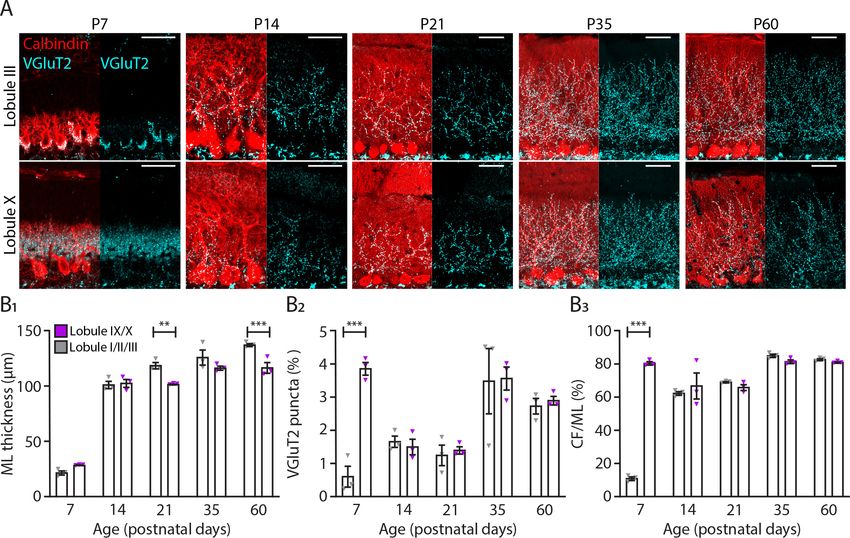
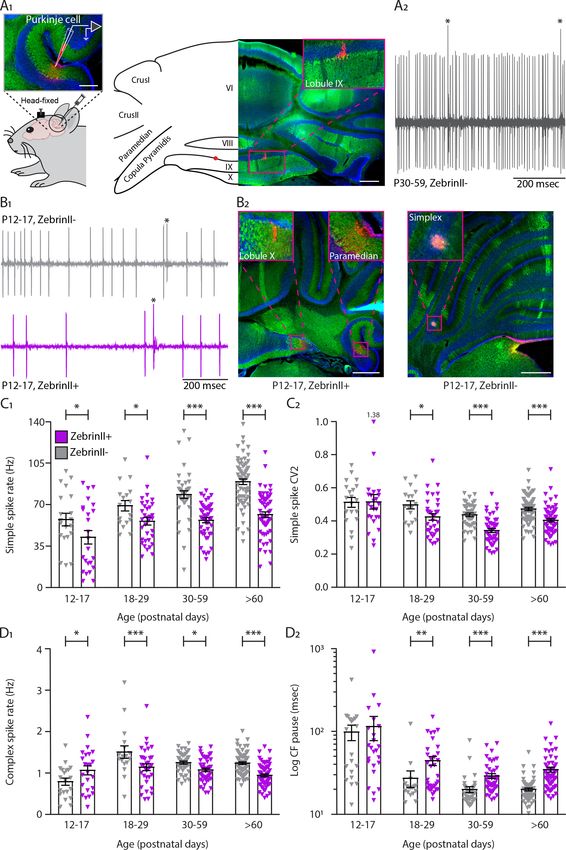
Research article                                                                                         Developmental Biology Neuroscience

Figure 1. Simple and complex spike activity develops differently between ZebrinII-related Purkinje cell populations. (A1) Schematic illustration of single
unit cerebellar extracellular recordings in Purkinje cells of awake head-fixed mice (left). Schematic representation of a cerebellar coronal section and
respective image showing lobules VI, VIII, IX and X, Crus I, Crus II, Paramedian, and Copula Pyramidis. Cerebellar coronal section with PCs labeled with
Aldolase C (green). Inset showing recording site marked with biocytin (red) in lobule IX (right). (A2) Example trace of in vivo P30-59 ZebrinII– Purkinje cell
Figure 1 continued on next page

Beekhof, Osório, et al. eLife 2021;10:e63668. DOI: https://doi.org/10.7554/eLife.63668                                                               3 of 34
Research article                                                                                        Developmental Biology Neuroscience

Figure 1 continued
recording identified by its hallmark feature, the occurrence of complex spikes (asterisks) and simple spikes. (B1) Example traces of extracellular Zebrin–
and Zebrin+ Purkinje cell recordings at P12-17 with clearly distinguishable simple spikes and complex spikes (asterisks). (B2) Photomicrographs of
coronal sections with examples of ZebrinII+ (left) and ZebrinII– (right) P12-17 Purkinje cells in lobule X, Paramedian, and Simplex, respectively.
Purkinje cells are labeled with Aldolase C (green). Insets showing recording sites marked with biocytin (red) in lobule X, Paramedian (left) and Simplex
(right). (C1) Purkinje cell simple spike firing rate, (C2) coefficient of variation 2 (CV2) for simple spikes, (D1) complex spike firing rate and (D2)
Climbing fiber pause recorded in vivo for ZebrinII– Purkinje cells (gray) and ZebrinII+ Purkinje cells (purple) in four age groups. Age groups: P12-17,
P18-29, P30-59, and >P60. Error bars represent SEM., for values see Supplementary file 1. * denotes p
Research article                                                                             Developmental Biology Neuroscience

                                    elimination is known to be completed at this mature stage. Our results confirmed our hypothesis.
                                    While there is no significant difference in CF pause in young cells P12-P17 (Z–: 81.1 ± 12.7 msec; Z+:
                                    79.6 ± 13.8 msec, p=0.94), there is a significant increase in CF pause of Z+ PCs when compared with
                                    Z– PCs at P18, after synapse elimination, that is maintained into adulthood (>P60, Z–: 20.0 ± 0.8
                                    msec; Z+: 34.5 ± 2.4 msec, pP60), CV2 is significantly decreased in Z+ PCs when compared with Z– PCs (Z–: 0.84 ± 0.01; Z+:
                                    0.81 ± 0.01, p=0.034) (Figure 1—figure supplement 1C1). As for SS, the CS regularity index
                                    decreases with age in both groups, but no significant difference between Z– PCs and Z+ PCs was
                                    observed (all p>0.40; Figure 1—figure supplement 1C2).
                                       Although recordings were grouped based on ZebrinII expression, the observed developmental
                                    timeline could potentially also correlate with other factors. To examine this, we further subdivided
                                    recordings based on lobular identity. In adult mice, PCs in anterior, largely Z–, lobules I to III have
                                    higher SS firing rates than those in the nodular, largely Z+, lobules IX and X (Figure 1—figure sup-
                                    plement 3A1, Supplementary file 1). For PCs recorded at P30-59 the pattern is similar, suggesting
                                    that in the latter stages of development, PC SS activity is also coupled to ZebrinII identity (Figure 1—
                                    figure supplement 3A2, Supplementary file 1). For the P18-P29 and P12-P17 groups the sample
                                    sizes are insufficient to draw strong conclusions (Figure 1—figure supplement 3A3–4). Hence, we
                                    employed a second approach, comparing the development of SS activity in two Z– regions, anterior
                                    lobules I to V vs. Z– hemisphere, and two Z+ regions, nodulus vs. flocculus regions. Although the
                                    number of samples prohibits strong conclusions, the developmental pattern of SS firing rate in the
                                    anterior and hemispheric region appears largely comparable, with significant increases toward adult
                                    levels, also after P12-P17 (Figure 1—figure supplement 3 B1). The development of activity is similar
                                    between the nodulus and flocculus as well, and best described by a stepwise increase from P12-P17
                                    to P18-P29, after which the levels remain stable (Figure 1—figure supplement 3 B2). Thus, sample
                                    sizes hamper strong conclusions, as it is technically challenging to record PC activity in vivo without
                                    anesthesia, in for example P12-P17 mice. Finally, because some of the data set appear to be
                                    bimodal in this youngest group, we examined if at P12-P17 specifically there was any association
                                    between the PCs locations and their electrophysiological properties. Therefore, we mapped the
                                    location of P12-P17 PCs in the cerebellar cortex and their correspondent SS rate (Figure 1—figure
                                    supplement 4A), CS rate (Figure 1—figure supplement 4B), SS CV2 (Figure 1—figure supplement
                                    5A), and SS CV values (Figure 1—figure supplement 5B). We find no evidence for bimodal distribu-
                                    tions of data based on location of PCs.
                                       Taken together, these results are in line with previous analyses in which we and others demon-
                                    strated the presence of differences across lobules in adult mice (Xiao et al., 2014; Zhou et al.,
                                    2014; Chopra et al., 2020). Our results suggest that differences in SS firing rate between Z– and Z+
                                    PCs arise during development as early as P12 and the CS firing rate and CF pause settle at adult lev-
                                    els after the period of synapse elimination at P18. Overall, the firing rate of ZebrinII-identified PC
                                    populations differentiates from early postnatal ages, and reached a stable, adult level in Z+ PCs first.

                                    Developing Purkinje cells of distinct cerebellar regions have different
                                    intrinsic activity
                                    PCs are intrinsically active in the absence of excitatory and inhibitory synaptic inputs (De Zeeuw
                                    et al., 2011; Raman and Bean, 1999; Womack and Khodakhah, 2002). In our previous work, we
                                    found that the difference in PC SS firing rate recorded in vivo was primarily the result of intrinsic
                                    activity of PCs in the adult mouse (Zhou et al., 2014). Next, we asked what is the contribution of
                                    intrinsic activity to the activity of developing PCs and when during development the differences in
                                    intrinsic activity arise among different populations of PCs. To answer these questions, we performed
                                    in vitro electrophysiological recordings on sagittal cerebellar sections of P3 to adult mice to measure
                                    the intrinsic properties of PCs throughout cerebellar development (Figure 2—figure supplement
                                    1A). Because ZebrinII parasagittal patterning is only complete around P12-P15 (Brochu et al., 1990;
                                    Lannoo et al., 1991) and ZebrinII labeling is ambiguous before P12, we focus our in vitro studies on
                                    lobules III and X (Brochu et al., 1990; Zhou et al., 2014; Sugihara and Quy, 2007b; Figure 2A1),
                                    which can be readily identified in the cerebellum at all ages, are oriented in such a way that it is pos-
                                    sible to record from them in a single sagittal slice and have previously been demonstrated to be

Beekhof, Osório, et al. eLife 2021;10:e63668. DOI: https://doi.org/10.7554/eLife.63668                                               5 of 34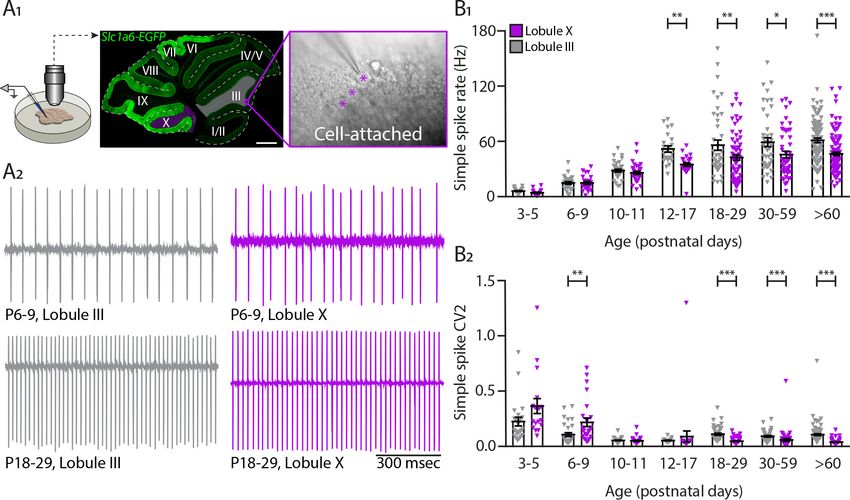
Research article                                                                                             Developmental Biology Neuroscience

Figure 2. Intrinsic activity develops differently between lobule III and lobule X Purkinje cell populations. (A1) Cell-attached recordings in vitro in Slc1a6-
EGFP mice that express eGFP in Purkinje cells. Recordings of intrinsic Purkinje cell activity were made in lobules III and X. Purkinje cells were identified
by the size of the soma (asterisk) clearly visible in the Purkinje cell layer. (A2) Example traces of cell-attached recordings of lobule III and X Purkinje cells
at P6-9 and P18-29. (B1) Purkinje cell intrinsic simple spike rate and (B2) coefficient of variation 2 (CV2) recorded in vitro for lobule III Purkinje cells (gray)
and lobule X Purkinje cells (purple) in seven age groups. Age groups: P3-5, P6-9, P10-11, P12-17, P18-29, P30-59, and >P60. Error bars represent SEM,
for values see Supplementary file 1. * denotes p
Research article Developmental Biology Neuroscience
irregularity in lobule III PCs from P18 when compared with lobule X PCs (CV2, LIII: 0.11 ± 0.01; LX:
0.05 ± 0.00, pP60, CV2, LIII: 0.11 ± 0.01; LX:
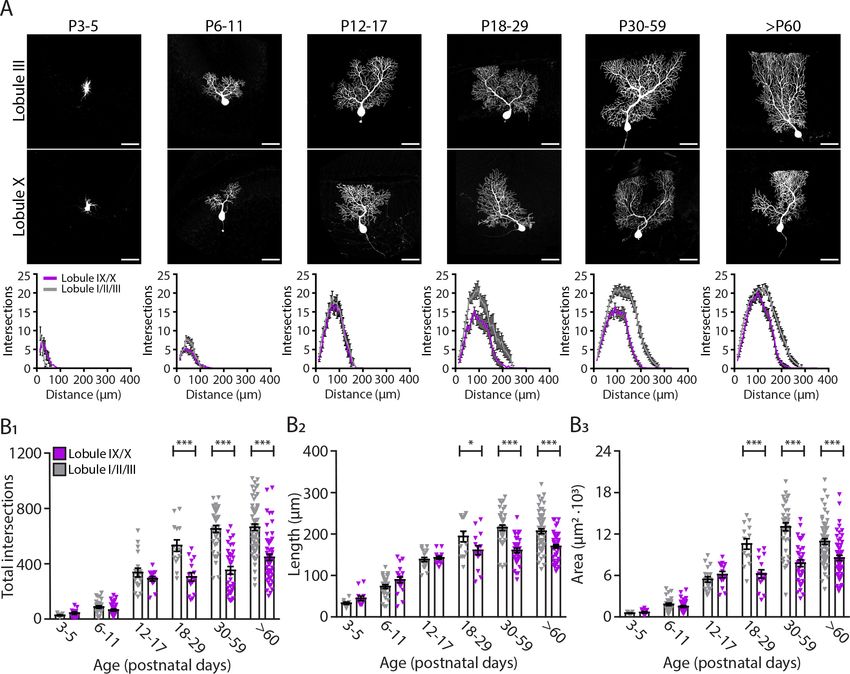
0.04 ± 0.00, pResearch article Developmental Biology Neuroscience Figure 3. Purkinje cells located in the lobule III display a larger and elaborated dendritic tree. (A) Photomicrographs of Purkinje cells filled with biocytin in lobule III and X (top panel); and sholl analysis of Purkinje cells located in lobules I/II/III (gray) or IX/X (purple) in six age groups (lower panel). (B1) Total number of intersections, (B2) longest dendrite length and (B3) area analysis for lobules I/II/III Purkinje cells (gray) and lobules IX/X Purkinje cells (purple) in six age groups. Age groups: P3-5, P6-11, P12-17, P18-29, P30-59, and >P60. Error bars represent SEM, for values see Supplementary file 1. * denotes p
Research article                                                                                         Developmental Biology Neuroscience

Figure 4. Translocation of climbing fibers occurs earlier in the nodular regions of the cerebellum. (A) Photomicrographs of lobule III and lobule X
regions depicting climbing fiber (VGluT2 staining, cyan) and Purkinje cell (calbindin, red) development in five age groups. (B1) Molecular layer (ML)
thickness, (B2) VGluT2 puncta per area of region of interest and (B3) climbing fiber (CF) extension per ML thickness quantification for lobules I/II/III (gray)
and lobules IX/X (purple) in five age groups. Age groups: P7, P14, P21, P35, and P60. Error bars represent SEM, for values see Supplementary file 1. *
denotes p
Research article                                                                               Developmental Biology Neuroscience

                                    anterior lobules I, II, and III pointing to another difference in the maturation of the cerebellar circuit-
                                    ries in different cerebellar regions.

                                    Purkinje cell axonal complexity increases during the second postnatal
                                    week
                                    Our data demonstrate that intrinsic physiology of PCs as well as their input structure, the dendritic
                                    tree, develop differentially between anterior/Z– and nodular/Z+ populations as well as exhibiting a
                                    stark growth period beginning in the second half of the second postnatal week. We next asked
                                    whether the PC output structure, the axonal arbor, matches this developmental timeline. The PC
                                    axon is a large structure that targets specific cerebellar nuclei based on their location and ZebrinII
                                    identity (Sugihara et al., 2009). PC axons are present in the cerebellar nuclei as early as embryonic
                                    day (E) 15.5 in mice (Sillitoe et al., 2009) and E18 in rats (Eisenman et al., 1991). Targeting to the
                                    correct cerebellar subnuclei is also already in place at very early points in cerebellar development
                                    (Sillitoe et al., 2009). In culture, PC axons exhibit a multi-step developmental process (de Luca
                                    et al., 2009). However, the developmental process of PC axons in vivo is not known. Taking advan-
                                    tage of the Pcp2-creERT2;Ai14 mouse model, we sparsely labeled PCs with red fluorescent protein
                                    (RFP) and searched for isolated axonal arbors within the cerebellar nuclei (Figure 5A). Labeling was
                                    optimal between P10 and P21, although it was sometimes possible to identify well-isolated axons at
                                    P7 as well. We therefore analyzed axon arbor morphology as a total group at P7, P10, P14, and P21,
                                    while comparisons between Z– and Z+ subnuclei were restricted to P10, P14 and P21 (Figure 5B).
                                    Labeled PCs were randomly distributed throughout the cerebellar cortex (Figure 5—figure supple-
                                    ment 1). We performed three-dimensional sholl analysis on single axon arbors with the first branch-
                                    ing point as the center. This analysis revealed significant differences across age of PC axon arbor
                                    maximum length and complexity, as both parameters increase from P7 to P14 and then decrease at
                                    P21 (number of intersections, P7: 84.2 ± 18.2; P10: 254.4 ± 40.5; P14: 277.4 ± 17.5; P21:
                                    296.4 ± 37.9, p=0.013; length, P7: 124.2 ± 17.8 mm; P10: 212.7 ± 24.4 mm; P14: 216.4 ± 14.3 mm2;
                                    P21: 225.2 ± 16.1 mm2, p=0.060, Figure 5C,E1, E2). Area taken up by the axon arbors, however, con-
                                    tinued to increase with age (area, P7: 1.52 ± 0.20 mm2103 P10: 1.47 ± 0.25 mm2103; P14:
                                    2.26 ± 0.19 mm2103; P21: 3.07 ± 0.29 mm2103, p
Research article Developmental Biology Neuroscience Figure 5. ZebrinII+ Purkinje cell axons are larger and less dense at all early postnatal ages. (A) Photomicrographs of cerebellar sections demonstrating sparse labeling of Purkinje cells. Left panels are stained with antibodies against ZebrinII as well as red fluorescent protein (RFP) to label Purkinje cells expressing RFP. Right panels are stained with DAPI and RFP to show examples of Purkinje cells and Purkinje cell axon arbors (top inset and bottom inset, respectively) in sagittal and coronal cerebellar sections (top and bottom right panels, respectively). (B) Photomicrographs of example ZebrinII– and ZebrinII+ axon arbors from P10, P14, and P21 mice. (C) Sholl analysis of all axon arbors at P7, P10, P14, and P21, average crosses are indicated with points and fitted with a smoothed line. (D1-3) Sholl analyses of ZebrinII– and ZebrinII+ groups of axons at P10, P14, and P21, respectively. (E1) Total number of intersections, (E2) longest dendrite length and (E3) axon arbor area analysis for all axons at different ages. (F1) Total number of intersections, (F2) longest dendrite length and (F3) axon arbor area analysis for ZebrinII– (gray) and ZebrinII+ axon arbors (purple) at P10, P14, and P21. Error bars Figure 5 continued on next page Beekhof, Osório, et al. eLife 2021;10:e63668. DOI: https://doi.org/10.7554/eLife.63668 11 of 34
Research article                                                                                   Developmental Biology Neuroscience

Figure 5 continued
represent SEM., for values see Supplementary file 1. * denotes p
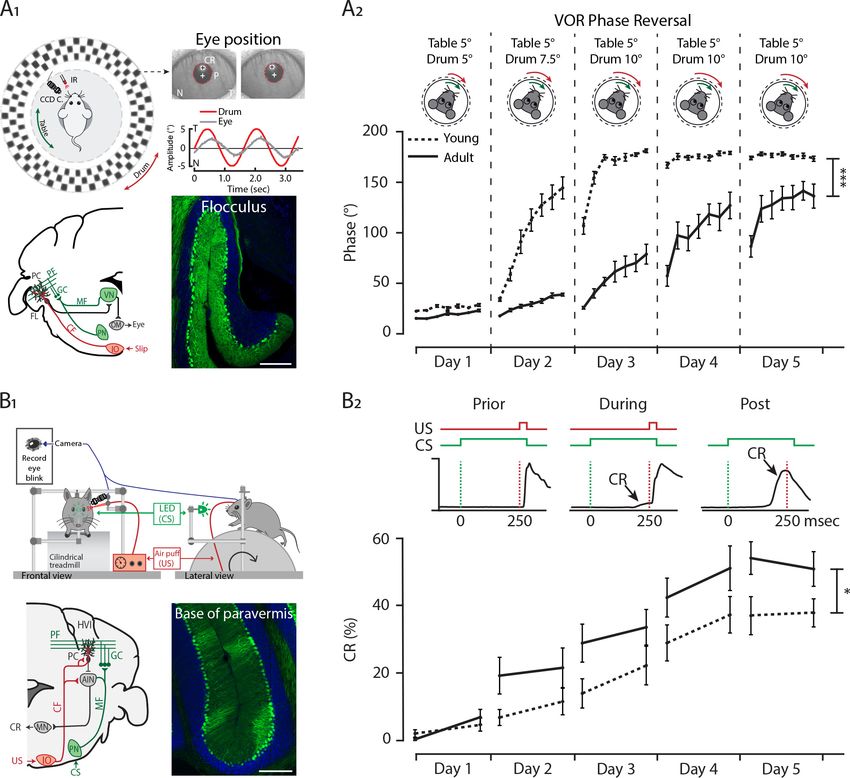
Research article                                                                                         Developmental Biology Neuroscience

Figure 6. Differential development of cerebellar regions impacts the maturation of cerebellar-specific behaviors. (A1) Schematic illustration of eye
movement recording setup. Mice are head-fixed in the center of a turntable (green arrow) for vestibular stimulation and surrounded by a random
dotted pattern drum (red arrow) for visual stimulation. A CCD camera was used for infrared (IR) video-tracking of the left eye (top left). Examples of
nasal (N) and temporal (T) eye positions. Red circles = pupil fit; black cross = corneal reflection (CR); white cross = pupil (P) center. Example trace of eye
position (gray) with drum position (red), during stimulation at an amplitude of 5˚ and frequency of 0.6 Hz (top right). Cerebellar circuitry controlling
compensatory eye movements and their adaptation. Purkinje cells in the flocculus (FL) receive vestibular and visual input via the mossy fiber (MF) -
parallel fiber (PF) system (green) and climbing fiber which influence eye movements via the vestibular nuclei (VN) and the oculomotor (OM) neurons.
PN, pontine nuclei; GC, granule cell (bottom left). Photomicrograph of the flocculus a ZebrinII+ Purkinje cell predominant region; Purkinje cells labeled
with Aldolase C (green) (bottom right). (A2) Results of 5 days of vestibule-ocular reflex (VOR) phase reversal training, probed by recording VOR (in the
dark before, between and after sessions) with mice kept in the dark in between experimental sessions in young (P21-25, dotted line) and adult (P70-
90, full line) mice. (B1) Schematic illustration of the eyeblink conditioning setup. Head-fixed mice on a freely moving treadmill, are presented a green
LED light (conditioned stimulus, CS) followed several hundred milliseconds later by a weak air-puff on the eye (unconditioned stimulus, US). Eyelid
movements were recorded with a camera (top). Cerebellar circuitry controlling eyeblink conditioning. Purkinje cells in the paravermal region around the
primary fissure receive inputs carrying sensory information from for example the pontine nuclei (PN) through the mossy fiber-parallel fiber (MF-PF)
Figure 6 continued on next page

Beekhof, Osório, et al. eLife 2021;10:e63668. DOI: https://doi.org/10.7554/eLife.63668                                                              13 of 34
Research article                                                                                       Developmental Biology Neuroscience

Figure 6 continued
pathway and the error signal from the inferior olive (IO) through the climbing fiber (CF). These Purkinje cells in turn influence eyelid muscles via the
anterior interposed nucleus (AIN) and motor nuclei (MN) (bottom left). Photomicrograph of the base of paravermis a ZebrinII– Purkinje cell predominant
region; Purkinje cells labeled with Aldolase C (green) (bottom right). (B2) As a result of repeated conditioned stimulus (CS)-unconditioned stimulus (US)
pairings, mice will eventually learn to close their eye in response to the conditioned stimulus (CS), which is called the conditioned response (CR) (top).
Percentage of conditioned response (CR%) in young (dotted line) and adult (full line) mice during 5 days of training (bottom). Error bars represent SEM.,
for values see Supplementary file 1. * denotes p
Research article Developmental Biology Neuroscience
e.g. lobule III, cerebellum (Figure 7). In line with this observation, we found a relative underperform-
ance of juvenile mice in the EBC, linked to anterior cerebellar regions (Figure 6B2).
Distinct developmental trajectories of specific cerebellar circuitries
PCs are generated in the ventricular zone at the base of the fourth ventricle (Morales and Hatten,
2006; Hoshino et al., 2005; Yamada et al., 2014). Cerebellar compartmentalization has been
shown to correlate with PCs birth dates: early-born (E10-E11.5) will become adult Z+ PCs and late-
born (E11.5-E13) will become adult Z– PCs (Hashimoto and Mikoshiba, 2003; Namba et al., 2011;
Larouche and Hawkes, 2006). Thus, there is a strong relationship between embryonic compart-
ments and adult zonal patterning associated with the modular organization of the olivo-cortico-
nuclear circuit (Brochu et al., 1990; Sugihara and Shinoda, 2004; Sugihara and Shinoda, 2007a;
Voogd and Ruigrok, 2004; Voogd et al., 2003; Pijpers and Ruigrok, 2006). The maturation of the
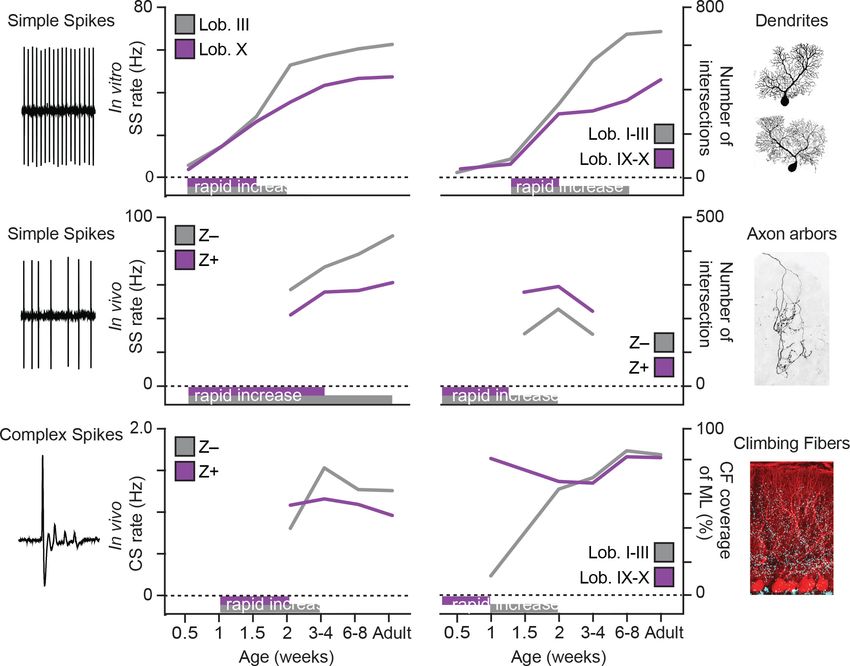
Figure 7. Summary of developmental timelines of Purkinje cell activity and morphology. Left, selected features for physiological activity, represented by
simple spike firing rate in vitro, simple spike rate in vivo and complex spike rate in vivo. Below the graphs periods of rapid development are indicated,
either based on our data or by extrapolation when first recorded levels are already high, see e.g. simple spike rate in vivo. Right, selected
morphological features, represented by dendritic shape, axonal shape (both as total number of intersections) and climbing fibers (as % of climbing
occupation of molecular layer). Note that, although not all data points are available and extrapolation is required, the general trend emerging is that of
rapid development in the second postnatal week (P7 to P14) and that Lobule III/ZebrinII– PCs typical complete rapid development later. Z– = ZebrinII
negative, Z+ = ZebrinII positive, SS = simple spike, CS = complex spike.
Beekhof, Osório, et al. eLife 2021;10:e63668. DOI: https://doi.org/10.7554/eLife.63668 15 of 34Research article Developmental Biology Neuroscience
zonal phenotype is only complete around P12-P15, based on the molecular markers ZebrinII
(Brochu et al., 1990; Lannoo et al., 1991) or PLCb4 (76). Although this patterned organization of
heterogeneity is a unique feature of the cerebellum, its impact on early cerebellar circuitry assembly
was unknown. In our studies, developmental electrophysiological and morphological analyses
revealed that lobule X/Z+ PCs reached adult stable properties earlier than anterior lobule III/Z– PCs
(Figure 7), particularly when it comes to simple and complex spike activity, as well as dendritic mor-
phology. This suggests that the configuration of mature PCs follows directly from their development,
which is a consequence of their birthdate. In vivo recordings followed by post-mortem analysis
allowed us to group PC acquired throughout the cerebellum into Z+ and Z– subpopulations. Signs
of ZebrinII-related differentiation in the electrophysiological properties, similar to those observed in
firing rate of SS in the adult mouse in vivo (Zhou et al., 2014), could already be detected in the end
at the second postnatal week from P12 (Figure 1C1). When examined across lobules, rather than in
direct relation to ZebrinII, the slower development appears most obvious in lobules I-II, III, VI-VII and
the Z PCs in the hemispheres, while particularly lobule X and the flocculus appear to reach adult
levels at P18-P29 (Figure 1—figure supplement 3A–B), but prohibit us from making conclusive
statements. As also found in adult mice based in in vitro recording from lobules III and X
(Zhou et al., 2014; Wu et al., 2019), the difference at P12-P19 is, at least in part, caused by differ-
ences in intrinsic activity (Figure 2B1). We focus our in vitro studies of intrinsic activity on lobule III in
the anterior vermis and lobule X in the nodular vermis (Brochu et al., 1990; Zhou et al., 2014;
Sugihara and Shinoda, 2007a; Figure 2A1), as these regions can be readily identified in the cerebel-
lum at all ages, are oriented in such a way that it is possible to record from them in a single sagittal
slice and have previously been demonstrated to be representative of the Z– and Z+ PC populations
(Zhou et al., 2014; Wu et al., 2019). Z+ PCs demonstrate early maturation of their physiological
properties by reaching a SS activity level in vivo at P18 that is not significantly different from that in
adulthood. Contrarily, in PCs from anterior regions of the cerebellum the activity continues to gradu-
ally increase until adulthood (Figure 1—figure supplement 3). Similarly, CS activity, which results
exclusively from the activity of neurons in the inferior olive, also showed reduced activity of Z+ PCs
compared with Z– PC CSs from P18-P27 (Figure 1D1). Overall, physiological differences in two pop-
ulations of PCs are first detected at the end of the second postnatal week and result from intrinsic
differences combined with an input component (Figure 2—figure supplement 2).
Previous reports have shown that, in rats, changes in physiological properties during develop-
ment match the time course of dendritic growth, without differentiating subtypes (McKay and
Turner, 2005). Indeed, we observed a marked dendritic growth around the second and third week
in the mouse. Starting from P18, PCs of the anterior lobule III continue to grow and develop a larger
dendritic area and more elaborated dendritic tree when compared with the nodular lobule X PCs.
Similar to our physiology data, PCs in the nodular lobule X region appear to reach their adult stage
at P18, although a smaller growth is still present from the adolescent to adult stage. This suggests
that in some populations of PCs their maturation is not only linked with their location in the cerebel-
lum (Altman, 1972), but also coupled to their physiological development. The development of cere-
bellar circuits is not solely dependent on an intrinsic genetic code that regulates cell autonomous
early activity and early morphologic features. During development, different types of afferents target
specific regions of the cerebellum rearranging its circuitry. In particular, mossy fiber (Sotelo and
Wassef, 1991; Voogd and Ruigrok, 1997; Ji and Hawkes, 1995; Armstrong et al., 2009) and CF
(Voogd and Ruigrok, 1997; Chédotal et al., 1997; Sotelo and Chedotal, 2005) afferents terminate
into parasagittal domains that align with the ZebrinII domains. CF development has been carefully
described (Watanabe and Kano, 2011; Hashimoto et al., 2009; Kano et al., 2018). Our results
revealed a unique temporal development of the functional differentiation of the CF synapses. Con-
comitantly with early maturation of the nodular lobule X described previously also CF translocation
occurs earlier in this cerebellar region (Figure 4). Additionally, CS activity in vivo shows that differen-
ces between Z– and Z+ PCs are evident by P12 but in the juvenile age group (P18-P29) they resem-
ble the direction observed at adult mature stages. This period, P12-P18, is known to be the late
phase of CF elimination (Kano et al., 2018). Although PCs during development are innervated by
multiple CFs (Hashimoto et al., 2009; Hashimoto and Kano, 2005), the CS rate has never been
found to be higher during development than in adulthood (Arancillo et al., 2015; Sokoloff et al.,
2015; Kawamura et al., 2013), and we verify that here for both Z+ and Z– populations. Our data
also reveal that CF pause duration is normalized after the period of synapse elimination at P18
Beekhof, Osório, et al. eLife 2021;10:e63668. DOI: https://doi.org/10.7554/eLife.63668 16 of 34Research article Developmental Biology Neuroscience
(Figure 1D2). Initial dendritic outgrowth is known to be independent of input signals (Sotelo and
Arsenio-Nunes, 1976; Alvarado-Mallart and Sotelo, 1982; Dusart et al., 1997). However, CFs are
necessary to complete PC dendritic growth and synapse maturation (Sotelo and Arsenio-Nunes,
1976; Sotelo, 2004). Moreover, positional cues from PCs are necessary for the correct CF-PC con-
nection (Chédotal et al., 1997). When during development these molecules are expressed in diverse
PCs subtypes could partially explain specific levels of CF maturation. During the second postnatal
week features substantial changes in PC axon arbors as well. Complexity and length both signifi-
cantly increase between P7 and P10 and P14. However, between P14 and P21, morphological prun-
ing appears to take place (Figure 5). PC axons in culture also feature a multi-step development, first
extending neurites and then switching to an arborizing phase (de Luca et al., 2009). However, this
development had not been examined in vivo. PC axons in the adult feature differences between sub-
nuclei of the cerebellar nuclei (Sugihara et al., 2009). While axons within the dentate nucleus exhibit
very compact arbors, axons within the medial nucleus are not dense. We were able to detect signa-
tures of this inter-nuclear difference in the developing mouse cerebellum. However, the intra-nuclear
differences are subtle in the development of Z– and Z+ axon arbors. The differences between the
subpopulations appear to be set early on and growth takes place within that difference already
existing.
Developmental patterning of SS and CS rates in vivo, as well as that of the axonal projection fea-
tures, were analyzed across the populations of Z– and Z+ PCs. SS activity in vitro, dendritic develop-
ment and CF innervation were taken from virtually exclusively Z– anterior and Z+ nodular lobules,
because ZebrinII is not expressed at the earlier time points tested for these parameters and the
need for coronal slicing hinders analyzing multiple time points. The possibility that some of the
observed differences are related to lobules or transverse zones cannot be excluded (Kim et al.,
2009; Hawkes and Eisenman, 1997; Armstrong et al., 2001), particularly for the morphological
changes. However, this selection of lobules is commonly used for comparisons (Kim et al., 2012)
and have consistently been confirmed with targeted recordings (Zhou et al., 2014; Wu et al.,
2019). Differentiation in the translocation of input(s) further supports the concept that cerebellar cir-
cuitries develop at specific and precise timelines that correlate with the subtype of PC and their
physical location.
Spatiotemporal aspects of gene expression patterns and
developmental trajectories
There are several lines of evidence that support the concept of spatial regulation of the cerebellum.
In mammals, the cerebellar cortex is divided rostrocaudally into four transverse zones (anterior, cen-
tral, posterior, and nodular) and mediolaterally into parasagittal stripes (Hawkes and Eisenman,
1997; Ozol et al., 1999; Armstrong and Hawkes, 2000; Armstrong et al., 2000). Both transverse
and parasagittal compartments can be distinguished by gene expression. Analyses of the meander
tail (Ross et al., 1990) and lurcher (Tano et al., 1992) mutant mice have revealed a genetic compart-
mental boundary between nodular and anterior lobules. Consistent with this notion, a recent single-
cell RNA-sequencing study has shown gene expression correlated or anti-correlated with the ZebrinII
pattern (Rodriques et al., 2019). A second spatial gene expression pattern was identified related to
the vestibulocerebellar region (lobules IX and X), in which genes are exclusively expressed within or
outside this region (Rodriques et al., 2019). But what is the developmental profile of these spatial
expression differences, and what drives the differentiation? Studies suggest that specification of PC
subpopulations (both transversal and parasagittal subtypes of PCs) is regulated by cell autonomous
mechanisms, more so than activity or afferent dependent, starting from the birth of the PCs
(Hashimoto and Mikoshiba, 2003; Namba et al., 2011; Larouche and Hawkes, 2006;
Chung et al., 2008). Hashimoto and Mikoshiba, 2003 PC birthdating experiments revealed that, in
contrast with the expression of the markers available at the time, the eight clusters of PCs the
authors identified embryonically were unchanged until adulthood. Although ZebrinII is a ‘late-onset’
parasagittal marker, others, such as neurogranin (Larouche et al., 2006), were shown to be
expressed from E14.5 in a pattern that was maintained until P20. While Slc1a6 expression is similar
to that of ZebrinII in adult mice, its mRNA can already by detected from embryonic ages and immu-
nohistochemical analysis supports a patterned, selective expression in the caudal cerebellum from
embryonic day 18 (Yamada et al., 1997). Additionally, PLCb4 expression is restricted to the Z– cells
and its expression also begins just before birth. The PLCb4-positive clusters in the neonate are
Beekhof, Osório, et al. eLife 2021;10:e63668. DOI: https://doi.org/10.7554/eLife.63668 17 of 34Research article Developmental Biology Neuroscience
complementary with the Z– neurons (Marzban et al., 2007). With the use of mouse genetics
(Sillitoe et al., 2009) or adenovirus tracing (Namba et al., 2011) it was possible to verify that the
birth date-related PCs correlated with the zonal pattern of ZebrinII. Finally, it is known that the nodu-
lus (vermal lobule X) and the flocculus are distinct divisions of the cerebellum at an early age
(Fujita et al., 2012). Our electrophysiological data add to this notion that differences in physiologi-
cal properties result from intrinsic properties of PCs (Figure 2) early in development. Intrinsic activity
could be observed as early as P3 and differences between PC subpopulations become apparent
starting from P12. Moreover, we observed that the influence of extrinsic inputs, the net effect of
excitatory and inhibitory inputs, is relatively small in the second week, but starts to drive activity at
P18. While this influence remains relatively stable in nodular lobule X/Z+ PCs, the net driving effect
of extrinsic inputs increases over time for anterior lobule III/Z– PCs until the cells reach their full mat-
uration in the adult (Figure 2—figure supplement 2). It should be noted, however, that the methods
we employed do not allow us to determine the individual contributions of each input, except that of
the CFs, and that this maturation could also be the result of a shift in the balance between excitation
and inhibition (Jelitai et al., 2016).
While the precise molecular mechanism underlying these differences is not well-defined, several
lines of evidence suggest gene expression differences in subtypes of PCs may explain this phenome-
non. For instance, Z– PCs have a higher expression of TRPC3 (44) and its ablation decreases their fir-
ing rate to make them more similar to the firing rate of Z+ PCs with behavioral consequences.
Additionally, the TRPC3 channel molecular cascade includes proteins expressed in parasagittal
bands such as mGluR1b (Mateos et al., 2000), IP3R1 (Furutama et al., 2010), PLCb3/4
(Sarna et al., 2006), and PKCd (Barmack et al., 2000). Recently, specific ATPases and potassium
channels were identified in Z– PCs that can also contribute to explain intrinsic differences
(Rodriques et al., 2019). The physiology and morphology of PCs have striking interaction effects.
As described previously (McKay and Turner, 2005; Bradley and Berry, 1979), from the second
postnatal week PCs develop their characteristic dendritic tree coupled with functional transitions
(Dusart and Flamant, 2012). Our data show for the first time that coupled with their electrophysio-
logical properties, nodular lobule X PCs reach maturity of their dendritic tree faster than anterior
lobule III PCs (Figure 3).
During the second postnatal week of development also the complexity of the PC axonal arbor
increases significantly (Figure 5). Corticonuclear topography is related with the topography of the
olivocerebellar pathway (Sugihara et al., 2009; Sugihara and Shinoda, 2007a), in that Z+ PCs typi-
cally project to the lateral/caudoventral cerebellar nuclei while Z– neurons typically project to the
medial/rostrodorsal parts of the cerebellar nuclei. In adult rats, PC axon arbors have been shown to
vary morphologically based on their location within the cerebellar nuclei with more Z+ subnuclei con-
taining denser, more complex PC axonal arbors (Sugihara et al., 2009). Our data shows for the first
time the existence of a similar pattern of distinct morphology of PC axons in the different subnuclei
during development (Figure 5). Although neuronal subtypes of the related vestibular nuclei have
been identified (Shin et al., 2011), neither the subtypes in the cerebellar nuclei nor the pattern of
PC to cerebellar nuclei neuron projections have been comprehensively studied. Linking the projec-
tion pattern of Z+ and Z– PCs to genetically identified neuronal subpopulations of each
cerebellar nuclei is a crucial future step in understanding the development and functioning of the oli-
vocerebellar circuit.
Differential ontogeny of cerebellar-sensorimotor functions
Unique timelines in the maturation of cerebellar microcircuitries sparked the hypothesis that corre-
lated behaviors are impacted and have distinct developmental profiles as well. Although the list of
cerebellum-related behaviors is long, only few tasks have been directly linked to specific, restricted
cerebellar regions. The difference in developmental timeline of PC SS activity, which directly influen-
ces downstream targets, is comparable between flocculus and nodulus, as well as between Z– PCs in
the hemispheres and anterior cerebellum (Figure 1—figure supplement 3B). Therefore, we exam-
ined VOR adaptation and EBC as proxies for Z+ and Z cerebellar module-related behaviors,
respectively. VOR adaptation and EBC are regulated by different modules in the cerebellum: VOR
adaptation is controlled by the flocculus of the vestibulocerebellum, which is a Z+ region
(Zhou et al., 2014; Sugihara and Quy, 2007b; Lisberger, 1988; Ito, 2002; Fujita et al., 2014), and
EBC is controlled by the hemispheric lobule VI, which is predominantly a Z– region (Mostofi et al.,
Beekhof, Osório, et al. eLife 2021;10:e63668. DOI: https://doi.org/10.7554/eLife.63668 18 of 34Research article Developmental Biology Neuroscience
2010; Boele et al., 2010; Thompson and Steinmetz, 2009; Heiney et al., 2014; Hesslow, 1994a;
Hesslow, 1994b). Our data show that different elements of the nodular Z+ circuitry mature, that is
reach their adult levels at the juvenile (P21) stage, earlier than anterior Z– circuitries and hence we
hypothesize that this differentiation would manifest itself in the ability to perform related learning
tasks. We found that young animals, compared to adult mice, start with a similar OKR baseline simi-
lar, but a lower VOR baseline (Figure 6—figure supplement 1). A similar attenuation of VOR gain,
but more specifically for lower to midrange frequencies, was observed previously, while we were not
able to replicate the higher OKR gain at 1.0 Hz visual stimulation observed in that work
(Faulstich et al., 2004). Taken together, both studies suggest a delayed maturation of the VOR with
a potential compensatory role for an ‘overactive’ OKR system. As OKR gain is attenuated by loss or
dysfunctional cerebellar input, the VOR gain typically increases in those conditions
(Schonewille et al., 2010; van Alphen and De Zeeuw, 2002) and hence these results argue against
any impairments due to incomplete development of the floccular region. When challenged with a
learning paradigm, the VOR phase reversal, the younger animals adapted faster than adult animals.
These results support our hypothesis that the flocculus circuitry at P21 is functional and suggests
that it even allows for faster learning, a form of immature hyperplasticity, comparable to known
forms of enhanced neural plasticity in development (Wiesel and Hubel, 1965; Hensch and Bilimo-
ria, 2012; Cai et al., 2014). Additionally, when comparing the simple spike rate development in the
flocculus with the nodular regions of the cerebellum (Figure 6—figure supplement 3B2), even with
limited data points, data suggests that by P18-29 these PCs have reached their adult firing rate
stage. In contrast, younger animals have a poorer performance in the CR of the EBC paradigm com-
pared to adult animals. Functional immaturity of the eyeblink response has been suggested to be
due to immaturity of the afferent pathway when using an auditory cue (Nicholson and Freeman,
2000). However, the fact that we use a visual cue and compare the results with visual stimulus-driven
OKR and VOR adaptation, argue against the role of an immature afferent pathway, while the pres-
ence of normal URs rejects the premise that an inability to blink is the cause. At P21 the firing rate of
anterior Z– PCs in the eyeblink region (Figure 1—figure supplement 3A3,B1), is reduced when com-
pared to adult counterparts (Figure 1—figure supplement 3A4,B1), which can likely contribute to
the impaired CR in young animals (Wu et al., 2019; ten Brinke et al., 2015). Evidence suggests that
Z– and Z+ PCs utilize different forms of synaptic plasticity, but there is still no consensus on which
plasticity mechanisms underlie VOR adaptation and EBC. Long-term depression (LTD) was the first
type of synaptic plasticity implicated in cerebellar motor learning (Ito, 2000). LTD has been sug-
gested to participate in the EBC response (Grasselli and Hansel, 2014; Freeman, 2015) and this
form of plasticity is known to occur on Z– lobule III PCs while in Z+ lobule X PCs is not detected
(Paukert et al., 2010; Wadiche and Jahr, 2005). Interestingly, blocking TRPC3 function eliminates
LTD plasticity (Kim, 2013) and, we recently showed that, TRPC3 loss-of-function in mice showed an
impaired EBC response (Wu et al., 2019), but normal VOR adaptation. LTD can be readily induced
in the anterior regions of juvenile PCs (Kim, 2013) and LTD-deficient mice do not have impaired
EBC, arguing against a central role for LTD in the EBC impairment in juvenile mice. Intrinsic excitabil-
ity is increased after EBC (Schreurs et al., 1997; Titley et al., 2020) and deletion of calcium-acti-
vated potassium channel SK2 ablated this plasticity of intrinsic excitability (intrinsic plasticity) and
resulted in impaired EBC, but enhanced VOR adaptation (Grasselli et al., 2020), a phenotype that is
in line with the juvenile phenotype (Hesslow, 1994b). Thus, a lack of ability to reach higher levels of
excitability by young anterior Z– PCs could explain the lower performance in the P21 animals. The
latter example suggests that the temporal difference in the emergence of cerebellum-sensorimotor
behaviors (Figure 6), could result from a distinct cell-autonomous excitability regulation in distinct
PCs populations. Future studies will have to determine the precise parameters for induction of the
difference forms of plasticity in each region, and their respective timelines.
Overall, this study highlights the heterogeneity within the cerebellum during development. Key
parameters such as CF input, dendritic and axonal shape and intrinsic firing rate reach mature levels
at different moments in postnatal development, depending on the subtype of PC and the regional
location. The evolutionary advantage to have distinct developmental timelines in different cerebellar
regions is likely to be related with their function. Increasing evidence has shown that in addition to
sensorimotor processing the cerebellum has a role in cognitive functions (White and Sillitoe, 2013;
Ito, 2008) and early cerebellar dysfunction has been implicated in neurodevelopmental disorders
(Wang et al., 2014; Martin and Albers, 1995; Kern, 2002). Recently, a comprehensive study has
Beekhof, Osório, et al. eLife 2021;10:e63668. DOI: https://doi.org/10.7554/eLife.63668 19 of 34Research article Developmental Biology Neuroscience
shown that the diverse motor and non-motor functions of the cerebellar vermis are mediated by dif-
ferent groups of fastigial output neurons with specific connections. The authors identified two major
classes of fastigial glutamatergic projection neurons: small neurons innervated by Z+ PCs, projecting
to circuits associated with sensory processing, motor preparation and behavioral, cognitive, affective
and arousal responses to novel or unexpected events, while large neurons innervated by Z– PCs con-
nect with circuits associated with control of motor and autonomic functions (Fujita et al., 2020).
Thus, uncovering the mechanisms underlying early circuitry formation in the developing cerebellum
is imperative to understand the basis of cerebellum circuitry and associated disorders. Additional
experiments are necessary to clarify developmental stages of other elements of cerebellar circuits
such as mossy fiber or interneurons. Nevertheless, our results demonstrate that the emergence of
cerebellar sensorimotor functions are tightly coupled with distinctive PC properties.
Materials and methods
Key resources table
Reagent type (species) or
resource Designation Source or reference Identifiers Additional information
Strain, strain background Slc1a6-EGFP Gong et al., 2003 MMRRC: 012845-UCD (Tg(Slc1a6-EGFP)
(Mus musculus) HD185Gsat/Mmucd)
Strain, strain background Pcp2-creERT2 Institut Clinique de la MGI:97508; ICS: 0273 (Tg(Pcp2-creERT2)17.8.ICS)
(Mus musculus) Souris, France Jackson
Laboratory
Strain, strain background Ai14 The Jackson Laboratory JAX: 007908 (Gt(ROSA)26Sortm14(CAG-
tdTomato)Hze
(Mus musculus) /J)
Strain, strain background C57BL/6 The Jackson Laboratory JAX: 00055
(Mus musculus) Janvier Labs Janvier: C57BL/6JRj
Charles River CR: C57BL/6NCrl
Antibody Goat anti-ZebrinII/ Santa Cruz Biotechnology Cat# sc-12065 1:1000
Aldolase C (Goat RRID:AB_2242641
polyclonal) RRID:AB_2315622
Antibody Mouse anti- Calbindin Swant Cat# 300 1:10,000
D-28K (Mouse monoclonal) RRID:AB_10000347
Antibody Guinea pig anti-VGluT2 Millipore Cat# AB2251-l 1:2000
(Guinea pig polyclonal) RRID:AB_2665454
Antibody Rabbit anti-RFP (Rabbit Rockland Cat# 600-401-379 1:1000
polyclonal) RRID:AB_2209751
Antibody Cy3 Streptavidin Jackson ImmunoResearch Cat# 016-160-084 1:1000
RRID:AB_233724
Antibody Cy3-AffiniPure Donkey Jackson ImmunoResearch Cat# 715-165-150 1:1000
anti-Mouse (Mouse RRID:AB_2340813
polyclonal)
Antibody Alexa Fluor 488-AffiniPure Jackson ImmunoResearch Cat# 706-545-148 1:1000
Donkey anti-Guinea Pig RRID:AB_2340472
(Guinea pig polyclonal)
Antibody Donkey anti-goat Daylight Jackson ImmunoResearch Cat# 705-486-147 1:500
488 (Goat polyclonal) RRID:AB_2616594
Antibody Cy3-AffiniPure Donkey Jackson ImmunoResearch Cat# 711-165-152 1:500
Anti-Rabbit (Rabbit RRID:AB_2307443
polyclonal)
Chemical compound, drug 4’,6-Diamidine-2’- Thermo Fisher Scientific Cat# D3571
phenylindole RRID:AB_2307455
dihydrochloride (DAPI)
Chemical compound, drug Paraformaldehyde (PFA) Millipore Cat# 104005 4%
Chemical compound, drug Biocytin Sigma-Aldrich Cat# B4261 1%
Chemical compound, drug Evans Blue Sigma-Aldrich Cat# E2129 0.5%
Chemical compound, drug Picrotoxin Hello Bio Ltd Cat# HB0506 100 mM
Continued on next page
Beekhof, Osório, et al. eLife 2021;10:e63668. DOI: https://doi.org/10.7554/eLife.63668 20 of 34Research article Developmental Biology Neuroscience
Continued
Reagent type (species) or
resource Designation Source or reference Identifiers Additional information
Chemical compound, drug NBQX Hello Bio Ltd Cat# HB0442 10 mM
Chemical compound, drug D-AP5 Hello Bio Ltd Cat# HB0225 50 mM
Chemical compound, drug Mineral oil Sigma-Aldrich Cat# M3516
Chemical compound, drug Tamoxifen Sigma-Aldrich Cat# T5648
Software, algorithm FIJI (ImageJ) National Institute of Health RRID:SCR_002285
Software, algorithm MATLAB 2008, 2016 MathWorks RRID:SCR_001622
Software, algorithm ZEN digital Imaging for ZEISS RRID:SCR_013672
Light Microscopy
Software, algorithm Leica Application Suite X Leica Microsystems RRID:SCR_013673
(LAS X)
Software, algorithm Clampfit 10 Molecular Devices RRID:SCR_011323
Software, algorithm Patchmaster HEKA Electronics RRID:SCR_000034
Software, algorithm GraphPad Prism GraphPad Software RRID:SCR_002798
Software, algorithm Compensatory eye Schonewille group https://github.com/
movements analysis MSchone
wille/iMove
Software, algorithm Eyeblink conditioning Neurasmus B.V. Rotterdam RRID:SCR_021043
analysis
Other Leica SM2000 R sliding Leica Biosystems RRID:SCR_018456
microtome
Other P-1000 Puller Sutter Instrument RRID:SCR_021042
Other LSM 700 laser scanning ZEISS RRID:SCR_017377
confocal
Other SP5 confocal Leica Microsystems RRID:SCR_020233
Other SP8 confocal Leica Microsystems RRID:SCR_018169
Other Axio Imager.M2 ZEISS RRID:SCR_018876
Mice
All animals in this study were handled and kept under conditions that respected the guidelines of
the Dutch Ethical Committee for animal experiments and were in accordance with the Institutional
Animal Care and Use Committee of Erasmus MC (IACUC Erasmus MC), the European and the Dutch
National Legislation. All animals were maintained under standard, temperature controlled, labora-
tory conditions. Mice were kept on a 12:12 light/dark cycle and received water and food ad libitum.
The following transgenic mouse lines were used in this study: Slc1a64-EGFP (Tg(Slc1a6-EGFP)
HD185Gsat/Mmucd) (Gong et al., 2003), Pcp2-creERT2 (Tg(Pcp2-creERT2)17.8.ICS) (Wu et al., 2019),
and Ai14 (B6;129S6-Gt(ROSA)26Sortm14(CAG-tdTomato)Hze/J) (Madisen et al., 2010). The following
primer sequences were used for routine genotyping: Slc1a6-EGFP (5’-TTCCTGATTGCTGGAAAGA
TTCTGG 3’; 5’-AGTTCAGGGAAAGGCCA TACCTTGG-3’; 5’-GGATCGGCCATTGAACAAGATGG-
3’; 5’-AAGTTCATCTGCACCACCG-3’; 5’-TCCTTGAAGAAGATG GTGCG-3’), Pcp2-creERT2 (5’-CCA
TGGTGATACAAGGGACATCTTCC-3’; 5’-CATGTGAAATTGTGCTG CAGGCAGG-3’; 5’-GCTATGAC
TGGGCACAACAGACAATC-3’; 5’-CAAGGTGAGATGACAGGAGATC CTG-3’), and Ai14 (5’-CTG
TTCCTGTACGGCATGG-3’; 5’-CCGAAAATCTGTGGGAAGTC-3’; 5’-GGCATTAAAGCAGCGTATCC-
3’; 5’-AAGGGAGCTGCAGTGGAGTA-3’). Both male and female mice were used in all experiments.
In vivo extracellular recordings and analysis
The in vivo extracellular recordings were performed in a total of 161 mice with an age range from
P12 to P269. We used either Slc1a6-EGFP (Dehnes et al., 1998) or C57BL/6J mice to record PCs.
Briefly, mice were maintained under general anesthesia with isoflurane/O2 (4% induction and 1–5–
2% maintenance) while five holes were drilled using a high-speed diamond-tipped drill (Foredome,
Bethel, CT, USA, RRID:SCR_021046). To obtain electrocorticogram (ECoG) signals, five pure silver
Beekhof, Osório, et al. eLife 2021;10:e63668. DOI: https://doi.org/10.7554/eLife.63668 21 of 34Research article Developmental Biology Neuroscience
ball-tipped electrodes (custom-made from 0.125 mm diameter silver wire; Advent research materials
LTD, Eynsham, Oxford, United Kingdom, RRID:SCR_021045) were placed on the meningeal layer of
the dura mater. Two silver electrodes were positioned bilateral above the primary cortex (M1, 1 mm
rostral; 1 mm lateral; relative to Bregma), two were placed above the primary sensory cortex (S1, 1
mm caudal; 3.5 mm lateral; relative to Bregma), and one in the interparietal bone (1 mm caudal; 1
mm lateral; relative to Lambda). UV-sensitive composites, a layer of Optibond (Kerr, Bioggio, Swit-
zerland) and Charisma Flow (Heraeus Kulzer, Hesse, Germany), were used to fix the silver electrodes
and a pedestal in the mouse head. To obtain extracellular recordings a craniotomy was made in the
occipital bone and temporarily closed with Kwik-Cast sealant (World Precision Instruments Inc, Sara-
sota, FL, USA, RRID:SCR_008593) to prevent cooling of the brain. In the end of the surgery, mice
received 0.1–0.2 ml saline for hydration and 0.2 l O2/min. ECoG and extracellular recordings were
sampled at 20 kHz (setup 1: Digidata 1322A, Molecular Devices LLC., Axon instruments, Sunnyvale,
CA, USA, RRID:SCR_021041), amplified, and stored for offline analysis (CyberAmp and Multiclamp
700A, Molecular Devices, RRID:SCR_021040) or at 50 kHz (setup 2: ECoG: adapted MEA60, Multi-
channel system, Reutlingen, Germany, RRID:SCR_021039; extracellular: Multiclamp 700B amplifier,
RRID:SCR_018455, with a Digidata 1440; Molecular Devices, RRID:SCR_021038). Single-unit record-
ings started two hours after the termination of isoflurane application, only when the ECoG looked
normal for an active mouse in an alert status. We recorded using borosilicate glass pipettes (Harvard
apparatus, Holliston, MA, USA, RRIDSCR_021037) with 0.5–1.0 mm tips and a resistance of 6–12 MW.
Glass pipettes were filled with internal solution containing (in mM): 9 KCl, 3.48 MgCl2, 4 NaCl, 120
K+-Gluconate, 10 HEPES, 28.5 Sucrose, 4 Na2ATP, 0.4 Na3GTP in total pH 7.25–7.35, osmolarity
290–300 mOsmol/Kg (Sigma-Aldrich, Merck KGaA, Darmstadt, Germany, RRID:SCR_008988); and
1% biocytin or 0.5% Evans Blue. At the recording location biocytin was released with iontophoresis
with 1 s pulses of 4 mA for 3 min (custom-built device, Erasmus MC, Rotterdam, The Netherlands,
RRID:SCR_002737) or Evans blue was injected with pressure. This procedure was done to identify
the location of the recordings. In our analysis, we included only the cells that we could identify the
recording location by the use of the injection spot. For spike analysis of the PCs, only cells with a
recording length of at least 90 s were included in the study (duration: 214 ± 160 s). All in vivo record-
ings were analyzed using a MATLAB (MathWorks, Natick, MA, USA, RRID:SCR_001622) code to
detect spikes using threshold and principal component analysis (Aminov et al., 2012) and a custom
build MATLAB code to analyze inter spike variables. The CV is the variation in inter-spike-intervals
(ISI) during firing and was calculated by dividing the standard deviation by the mean of ISIs. The CV2
represents the variance on a spike-to-spike base, it is less sensitive for a single outlier and was calcu-
lated as 2*|ISIn + 1-ISIn| / (ISIn + 1 + ISIn). The regularity index was calculated by extracting regular
spike patterns, using a CV2 threshold of P60 PCs data set localized in the flocculus used in this study has also been used in a
previous study (Zhou et al., 2014).
In vitro extracellular recordings and analysis
The in vitro extracellular recordings were performed in a total of 49 mice with an age range from P3
to P378. We used either Slc1a6-EGFP (Gong et al., 2003; Dehnes et al., 1998) or C57BL/6J mice to
record PCs. As previously described (Wu et al., 2019), the brain was quickly removed and placed in
ice-cold slice solution (continuously carbogenated with 95% O2 and 5% CO2) containing the follow-
ing (in mM): 240 Sucrose, 2.5 KCl, 1.25 NaH2PO4, 2 MgSO4, 1 CaCl2, 26 NaHCO3, 10 D-glucose.
Acute sagittal slices 250 mm thick of vermal cerebellar tissue were cut in ice-cold slicing solution
using a vibratome (VT1000S, Leica Biosystems, Wetzlar, Germany, RRID:SCR_016495) with a ceramic
blade (Campden Instruments Ltd, Manchester, United Kingdom, RRID:SCR_021036). Directly after
slicing, the slices were transferred to a recovery bath and were incubated in oxygenated artificial
cerebrospinal fluid (ACSF) and maintained at 34˚C for one hour. The ACSF was continuously carbo-
genated with 95% O2 and 5% CO2 and consisted of (in mM): 124 NaCl, 5 KCl, 1.25 Na2HPO4, 2
MgSO4, 2 CaCl2, 26 NaHCO3, 20 D-glucose. After incubation period, slices were transferred to
room temperature. To record the individual slices, these were transferred to a recording chamber
and maintained at 34 ± 1˚C with a feedback temperature controller with heater (Scientifica, Uckfield,
United Kingdom, RRID:SCR_021035) under continuous superfusion with the oxygenated ACSF.
For all the recordings, slices were bathed with ACSF supplemented with synaptic receptor block-
ers, NMDA receptor antagonist D-AP5 (50 mM, Hello Bio Ltd, Bristol, United Kingdom, RRID:SCR_
Beekhof, Osório, et al. eLife 2021;10:e63668. DOI: https://doi.org/10.7554/eLife.63668 22 of 34You can also read