Situation and Outlook for Primary Industries - June - MPI
←
→
Page content transcription
If your browser does not render page correctly, please read the page content below
Situation and
Outlook for
Primary Industries
      June
Contents
Acknowledgements
Natasha Abram, Paul Berentson, Annette Carey,                          Overview                                                              4
Sarah Clough, Matt Dilly, Loretta Dobbs, Daniel Hamill,
Geoff King, Claudia Riley, Wido van Lijf, Jenny Wilkinson

                                                                       Dairy                                                              16
Notes
Annual figures are for the year ended June, unless
otherwise noted. Currency figures are in New Zealand
dollars, unless otherwise noted. Some totals may not add               Meat and Wool                                                      24
due to rounding.
MPI welcomes feedback on this publication via
SOPI@mpi.govt.nz.                                                      Forestry                                                           32
Publisher
Ministry for Primary Industries                                        Horticulture                                                       38
Economic Intelligence Unit
Charles Fergusson Building, 34-38 Bowen Street
PO Box 2526, Wellington 6140, New Zealand
Tel: 0800 00 83 33
                                                                       Seafood                                                            48
This publication is available on the
Ministry for Primary Industries website at
www.mpi.govt.nz
                                                                       Arable                                                             54
Further copies may be requested from
SOPI@mpi.govt.nz
                                                                       Other primary sector                                               58
ISBN No. 978-1-98-859467-5 (online)
ISBN No. 978-1-98-859468-2 (print)                                     exports and foods

Disclaimer
While care has been used in compiling this document, the Ministry for Primary Industries do not give any prediction, warranty or
assurance in relation to the accuracy of or fitness for any particular purpose, use or application of any information contained in this
document. To the full extent permitted by law, Ministry for Primary Industries nor any of its employees, shall not be liable for any cost
(including legal costs), claim, liability, loss, damage, injury or the like, which may be suffered or incurred as a direct or indirect result of the
reliance by any person on any information contained in this document.

This work is licensed under the Creative Commons Attribution 3.0 New Zealand licence. In essence, you are free to copy, distribute
and adapt the work, as long as you attribute the work to the Crown and abide by the other licence terms.
To view a copy of this licence, visit http://creativecommons.org/licenses/by/3.0/nz/. Please note that no departmental or
governmental emblem, logo or Coat of Arms may be used in any way which infringes any provision of the Flags, Emblems, and
Names Protection Act 1981. Attribution to the Crown should be in written form and not by reproduction of any such emblem, logo or
Coat of Arms. Photographs may not be reproduced without permission.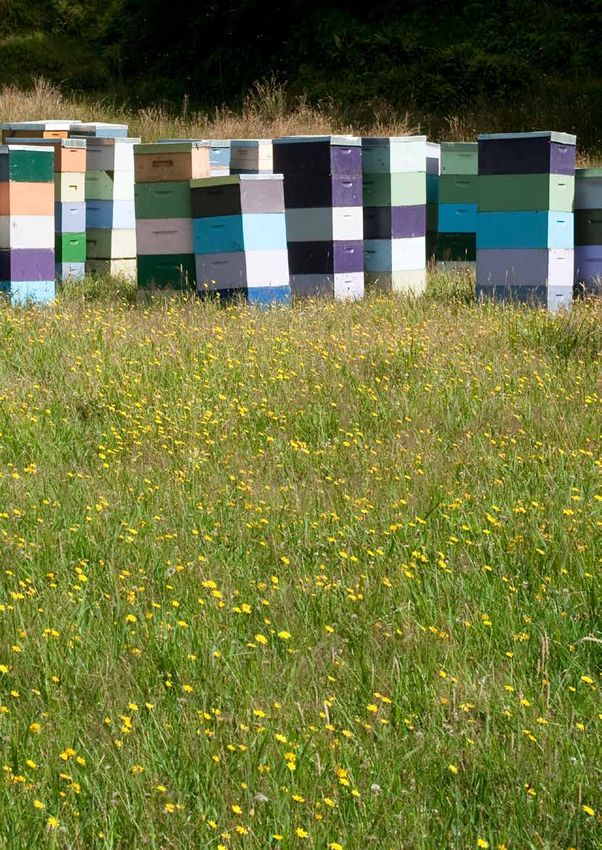
Minister's foreword

I am very pleased to release the latest Situation and Outlook for Primary
Industries (SOPI) for June 2019. In a global environment characterised by
increasing uncertainty, the primary sectors are continuing to thrive and
deliver.
Primary industry export revenue is expected to jump by more than 7
percent this year to $45.6 billion, largely due to strong growth in
horticulture and forestry exports. Excellent harvest volumes across most
horticulture crops coupled with strong global prices is driving horticulture
export revenue higher, while strong demand for logs out of China is
pushing forestry export revenue ahead.
Growth in our primary industry exports depends on an economy that is both environmentally sustainable and
delivering high value. Collaboration between the government and primary sector remains key to maximising
exports, improving productivity, protecting our environment, and growing the economy. The Government is
focusing on a range of initiatives to support the primary sector, the communities they operate in and our global
brand around sustainability, innovation, and premium products.
As an example, primary industry businesses will be given certainty to invest and innovate in the growing
organics sector, with a national standard for organic production to be introduced this year. With SOPI
predicting gold kiwifruit exports will grow to $1.9 billion by 2024, this legislation will provide a sound platform
for the growth of organic kiwifruit exports.
The Government has also introduced a Research and Development tax credit which will help to improve the
attractiveness of investment in developing new varieties and new ways of operating. MPI continues to support
initiatives such as the New Zealand Avocados Go Global innovation programme, which included research and
development funding, and used a collaborative approach with working groups made up of growers, scientists
and rural professionals to equip industry with tools to increase productivity and develop new markets.
Last year I appointed a Primary Sector Council for the sole purpose of establishing a shared vision for the future
of our primary sectors. The Council has begun engaging on its draft vision and I anticipate a final version being
presented later this year. While the vision won’t have all the answers, I expect it to spark the conversations that
will encourage the food and fibre sectors to grasp the opportunities and work together with the Government on
how to get there.
Through Budget 2019, as part of our vision for thriving rural communities, the Government is providing more
than $122 million towards supporting more sustainable land use practice in our agriculture sector and shifting
to higher value production. This funding will support the agriculture sector to make meaningful change at the
right pace and bolster New Zealand’s continued strong reputation as a world leader in sustainable agricultural
practices and a producer of high value food and fibre.
SOPI provides forecasting and analysis that informs how we can face upcoming challenges and ensure our
primary industries and rural communities continue to grow and thrive.

Hon Damien O’Connor
Minister of Agriculture

                                                                                                 SOPI
                                                                                                  SOPIJUNE  2019••11
                                                                                                       JUNE2019
Director-General’s
                         introduction
                         The Situation and Outlook for Primary Industries (SOPI),
                         from MPI’s Economic Intelligence Unit, draws on expertise
                         from across MPI and various primary industry stakeholders.
                         This quarterly publication presents the current state of
                         New Zealand’s primary industries and their prospects for
                         growth over the next four years.
                         This June report is our most comprehensive analysis of the
                         year, representing an expansive analysis of sector
                         performance, as well as the opportunities and challenges
                         ahead for primary producers. I am pleased to report that this
                         current edition reflects the ongoing success of the primary industries. With export revenues
                         forecast to rise 7.1 percent for the year ended June 2019, and further growth forecast
                         across all our sectors over the next four years, the outlook remains positive.
                         The food and fibre sectors make an enormous contribution to the wellbeing of New
                         Zealanders. The work we do at MPI, from managing the biosecurity system to ensuring our
                         high-value products have access to overseas markets, is some of the most important in
                         New Zealand. Our decisions and actions affect what it is like to live in New Zealand today
                         and what the country will be like for generations to come.
                         Since I joined MPI in November last year, the importance of this work has been reinforced
                         to me by issues such as the Mycoplasma bovis eradication effort, the Tasman fires and
                         biosecurity responses to stink bug and fruit fly. These events have shone a light on how we
                         operate and, most importantly, how our partners in industry and in communities across
                         New Zealand interact with us. Having met with farmers and growers, iwi representatives,
                         fishers, industry leaders, conservation organisations, and our own staff around the country,
                         I have seen first-hand both our challenges and successes.
                         I am pleased to observe that in the main, industry and sector leaders are supportive of our
                         work. There is still potential for MPI to be more open, more visible regionally and easier to
                         access. This has motivated us to establish the Agriculture and Investment Services branch
                         in MPI, a service that will partner with the sector to team up and respond to emergent
                         issues and sponsor investment in ideas and innovation. As Director-General, I want to
                         make sure MPI is in the best position to direct our focus appropriately, deploy resources
                         where needed, and build the trust and confidence of New Zealanders in the work we do.
                         Through this, MPI will be able to deliver on its ambition to help New Zealand’s primary
                         industries to achieve not only their potential for value-based export growth, while valuing
                         the land that is our primary resource, and also navigating the challenges and opportunities
                         of our dynamic global trading environment.

                         Ray Smith
                         Director-General, Ministry for Primary Industries

2 • MINISTRY FOR PRIMARY INDUSTRIES
Dairy
New Zealand’s dairy export revenue is forecast to increase 5.7 percent to $17.6 billion in 2019, supported by
strong milk production and sustained global demand. Milk production for the 2018/19 season is forecast to rise
2.3 percent, supported by favourable weather promoting strong pasture growth. Global price volatility for key
commodities impacted export prices, subduing early season export revenues in 2018/19, but have since
recovered.
Meat and Wool
Meat and wool export revenue is forecast to reach $10.2 billion for the year to June 2019, up 6.4 percent from
the previous year. The main reason for this increase is strong red meat prices: they have remained high now for
the past two years. Beef and deer livestock numbers have also risen over the past two years, supported by high
prices, but are expected to continue drifting lower in the coming years.
Forestry
Forestry revenue is forecast to reach $6.9 billion for the year ended June 2019, an increase of 7.8 percent since
2018. Much of this growth can be traced to increased Chinese demand for New Zealand logs. Forestry harvest
volumes are expected to hit a record 37 million cubic metres for the year ended March 2019 due to continuing
high prices incentivising harvesting. Wood processing volumes increased 2.3 percent in the past year, supported
by strong domestic and export demand.
Horticulture
Horticulture revenue is forecast to rise 13.7 percent for the year ending June 2019 to $6.1 billion. Export
revenue for the 2018/19 marketing years has been lifted by excellent harvest volumes across kiwifruit, wine, and
apples and pears. Harvest volumes for 2019/20 are likely to be similar or slightly lower than last year due to less
favourable conditions in the main growing regions, despite increases in the planted area. Export prices and
on-farm profitability remain strong across the horticultural sector, incentivising further investment and expansion.
The shortage of labour, including skilled permanent and seasonal labour, is a constraint on the growth and
potential productivity of several fruit sectors.
Seafood
Seafood export revenue is forecast to rise 7.3 percent to $1.9 billion for the year ending June 2019. The main
driver for this growth is rising prices and a more favourable exchange rate. While prices are forecast to continue
rising, production is expected to remain fairly stable due to sustainability constraints. Aquaculture volumes are
expected to increase moderately over the outlook period to 2023.
Arable
Arable export revenue is expected to fall 4 percent for the year ending June 2019 to $235 million due to poor
quality and lower yields in the 2018 harvest. But a better 2019 harvest, which also had its challenges, should lift
export revenue for 2020. In the longer term, gradual export growth is forecast for both prices and volumes.
Although grain prices, except for milling wheat, have fallen over the past six months, they are still well up on the
same time last year.
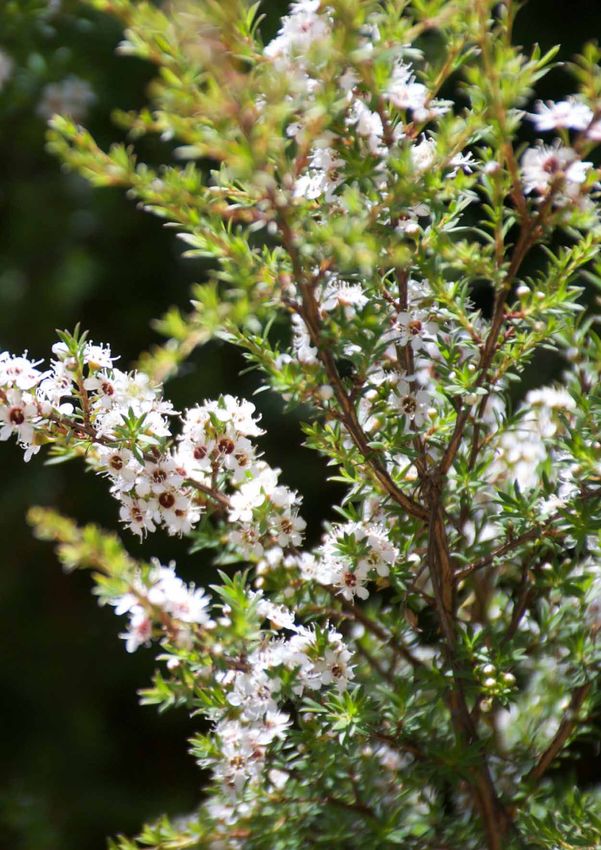
Other primary sector exports
Export revenue from New Zealand’s other primary sector exports and foods is expected to reach $2.8 billion for
the year to June 2019, up 3.5 percent from 2018. The primary driver is a 17 percent increase in other products
supported by a 4 percent increase in honey. The UK is set to take over from the US as New Zealand’s largest
export partner for honey in 2019, with exports since July 2018 valued at $45 million. This sector is expected to
continue to grow slowly to reach $3 billion by 2023.
SOPI JUNE 2019 • 3
Overview
Exports up $7.5 billion over two years                                                    markets. Given this uncertain backdrop, and despite recent
Amidst a global trade environment characterised by increasing                             strong export performances by our primary sectors, the
uncertainty, New Zealand’s primary sectors have continued to                              downside risks to the current forecast will be heightened over
grow their export revenues. For the year ended June 2019,                                 the next few years.
New Zealand’s primary industry exports are forecast to increase                           Outlook for 2020 and Beyond
by 7.1 percent to $45.7 billion.                                                          Because current exceptional price levels are forecast to soften
This is the second straight year of substantial export growth,                            for New Zealand’s lamb exporters, and as volume growth slows
with significant gains across most primary industry products                              in the larger export sectors, we are forecasting export revenues
(Figure 1). Generally favourable weather conditions, promoting                            to soften slightly in the year ending June 2020 before gaining
strong pasture growth, have boosted production in the dairy                               moderate momentum over the medium term, supported by the
and red meat sectors, with average export prices remaining at                             dairy, meat, and horticultural sectors.
historically high levels.                                                                 Sustained demand out of China and South East Asia continues
Horticultural export volumes in the current year also benefited                           to support strong prices, and the continued weakness of the
from good weather and high production in the previous 2018                                New Zealand dollar (NZD) is expected to continue supporting
season. In particular, kiwifruit production rose 25 percent in                            export returns. Strength in prices, supported by an increasing
the 2018 harvest. In addition, strong price growth and an                                 proportion of higher value products, is expected to sustain
improving export product mix will see horticulture export                                 growth in dairy export revenue, despite constraints on milk
revenues rise to a record $6.1 billion in the year ending June                            production growth.
2019.                                                                                     While prices are expected to remain robust across our major
Log demand from China continues to support strong prices for                              horticultural products, we do not expect the weather to be as
our forestry exports, incentivising an increase in harvest                                beneficial as in the previous year. Early reports for 2019
volumes to record levels. Seafood export revenue is forecast to                           horticulture harvests indicate production will be similar to or
increase 7.3 percent as growth in the aquaculture sector                                  slightly below last year. Although this will constrain export
continues to outpace wild capture export revenue and prices                               revenue growth in the year ending June 2020, momentum is
have risen.                                                                               expected to return to this sector over the medium term through
                                                                                          high profitability and continued investment.
This export performance by New Zealand’s primary sector
producers is all the more impressive, considering the
weakening global economic environment and high degree of
uncertainty, which have created tension across international

   Figure 1: Export prices and volumes have both increased from 2017 to 2019.

                                 16.0%

                                                                                   Forestry
                                 14.0%

                                 12.0%

                                 10.0%                              Horticulture
                                                                                                                     Meat and wool

                                  8.0%
      Change in volume

                                             Other
                                  6.0%                                                                     Arable
                                                                                                                                     Dairy
                                  4.0%

                                  2.0%

                                  0.0%
        -4.0%            -2.0%        0.0%           2.0%   4.0%   6.0%            8.0%        10.0%         12.0%   14.0%       16.0%       18.0%
                                 -2.0%
                                                                                                       Seafood

                                 -4.0%
                                                                    Change in price

   Primary industry export growth by price and volume, year ended June 2017–19
   Source: Stats NZ and MPI.

4 • MINISTRY FOR PRIMARY INDUSTRIES
Good spring weather sustained 2018/19 pastoral production through a dry late summer
 1 December 2018                                          15 January 2019                                    1 March 2019
                                                                                                                                                                   NZDI
                                                                                                                                                                     1.75

                                                                                                                                                                     1.50

                                                                                                                                                                     1.25

                                                                                                                                                                     1.00

                                                                                                                                                                     0.75
   Dry        Very dry        Extremely dry           Drought           Extreme drought
                                                                                             Source: National Institute of Water & Atmospheric Research (NIWA)

 Weather good for pasture, average for                                                       However, as a weak El Niño weather pattern began to develop,
 horticulture                                                                                New Zealand recorded its third-warmest summer on record,
 Above-average temperatures and rainfall, promoting strong                                   with impacts on many horticultural crops. The Nelson region
 pasture growth across many New Zealand regions, have                                        was most affected by dry conditions over summer, with drought
 supported production in the red meat and dairy sectors in                                   conditions, and large wild fires covering 2,350 hectares, leading
 2018/19. For the main horticulture regions, cool spring                                     MPI to declare a medium-scale adverse event in February
 conditions at significant times affected pollination across some                            2019. The full costs are yet to be established. Plantation
 horticultural and arable crops, which, followed by a hot dry                                forestry was a significant land use within the affected area, and
 summer, limited the yield potential of the most recent harvests.                            the resulting water restrictions also affected fruit and vegetable
                                                                                             growers on the Waimea plains.
 Spring brought above-average rainfall across Otago and
 Canterbury, as well as to the eastern part of the North Island,                             Although an El Niño pattern is forecast to continue through to
 which disrupted arable plantings in those regions. However, as                              July 2019, the National Institute of Water and Atmospheric
 benign temperatures across most of the country continued,                                   Research (NIWA) is indicating that its influence may weaken
 pasture growth was very strong through spring and summer.                                   over the course of the coming year. Temperatures are forecast
 This has resulted in increased average slaughter weights for the                            to be above average in the north and east of the North Island
 red meat sector and higher milk collections by dairy processors.                            and east of the South Island and likely to be near average in all
                                                                                             remaining regions. NIWA is also forecasting rainfall at or below
 While the weather was favourable for pasture, cool conditions                               normal levels in the North Island and in the north and east of
 during the critical flowering period in the important                                       the South Island. However, the weak El Niño may bring
 Marlborough region for wine and across some kiwifruit regions                               increased rainfall to western areas of the South Island over the
 impacted pollination and fruit set, ultimately setting the season                           coming months.
 up for slightly reduced yields for the 2019 harvest.

Table 1: Primary industries export revenue 2015-23 (NZ$ million)

                                                                   Actual                                                       Forecast

  Year to 30 June                             2015              2016             2017      2018          2019          2020          2021          2022           2023

  Dairy                                  14,050             13,289             14,638     16,655       17,610        17,820        18,190       18,510           18,820

  Meat & wool                                 9,000             9,200            8,355     9,542       10,150         9,900        10,000       10,090           10,190

  Forestry                                    4,683             5,140            5,482     6,382        6,880         6,820         6,940         7,000           7,080

  Horticulture                                4,185             5,000            5,165     5,376        6,110         6,130         6,360         6,610           6,960

  Seafood                                     1,562             1,768            1,744     1,777        1,910         1,860         1,970         2,030           2,100

  Arable                                       181               210               197      243           235           250           255           260            265

  Other primary sector exports*               2,417             2,714            2,638     2,706        2,800         2,870         2,940         3,000           3,060

  Total exports                          36,079             37,323             38,219     42,682       45,695        45,650        46,655       47,500           48,475

  % Change                                    -6.8%             +3.4%           +2.4%     +11.7%       +7.1%          -0.1%        +2.2%         +1.8%           +2.1%

Source: Stats NZ and MPI.
* Other Primary Sector Exports and Foods includes live animals, honey, and processed foods.

                                                                                                                                                   SOPI JUNE 2019 • 5
Global markets remain unsettled

    The Comprehensive and
                                                                                                               Primary industry
    Progressive Trans-Pacific                      The New Zealand dollar is on                                exports are
    Partnership entered into                       track to fall 2 percent this                                performing well,
    force in December 2018,                        year, supporting increased                                  despite global           $
    giving our exporters more                      export returns.                                             trade tensions and
    opportunities to maximise
                                                                                                               rising uncertainty.
    returns.

New Zealand’s current run of export success over the past two     country gross domestic product (GDP), only the North
years has occurred despite a rising sense of uncertainty in       American Free Trade Agreement and the European Single
global markets. This is partly because the products we trade in   Market are larger multinational trade zones.
have not been directly affected so far, and partly because the
NZD has fallen over the past two years (Figure 2), supporting
                                                                  Brexit postponed
                                                                  The United Kingdom (UK) and European Union (EU) have
export returns.
                                                                  agreed to a “flexible extension” for Brexit until 31 October
However, these issues provide an increasingly uncertain           2019. The flexible extension means that the UK can exit the EU
backdrop to the otherwise positive outlook for New Zealand’s      earlier, should the negotiated Withdrawal Agreement be passed
primary industry exports. This includes slowing global economic   by the UK Parliament. If the UK Parliament does not pass the
growth expectations, rising protectionist sentiment, and          Withdrawal Agreement by 31 October, it must come to an
uncertainty as shown by Brexit and trade tensions between the     alternative agreement with the EU on a way forward, or leave
United States (US) and China, and outbreaks of African swine      without a deal on 31 October. We expect existing conditions for
fever (ASF).                                                      primary sector trade between New Zealand and the UK to stay
                                                                  the same during the extension period.
The ongoing trade dispute between the US and China does not
include increasing tariffs on products directly relevant to       There remains significant uncertainty in the UK regarding the
New Zealand’s primary industries, but has disrupted some          Brexit process, with a wide range of outcomes possible. Primary
markets, such as soybeans. Meanwhile, the United Kingdom’s        sector exporters should therefore ensure they have contingency
(UK’s) planned exit from the European Union (EU) has been         plans in place, in case the UK leaves the EU after October
delayed to later in 2019 (see below), further extending this      without a deal.
source of uncertainty. The larger concern for New Zealand and
                                                                  MPI (and other ministries) has worked closely with UK
other exporting countries is a potential impact on consumer
                                                                  counterpart agencies to put in place arrangements to preserve
demand within the UK, US, and China if those economies are
                                                                  continuity in our trade conditions with the UK once it leaves the
negatively affected.
                                                                  EU. An example of this is the signing of the Veterinary
Another source of uncertainty is the impact of ASF outbreaks in   Agreement and Mutual Recognition Agreement, which are
Europe and China, in particular. China is by far the world’s      important milestones in New Zealand’s preparedness for Brexit.
largest producer and consumer of pork, and loss estimates         Both agreements roll over existing trade agreements with the
range between 5 and 30 percent of the country’s pigs. See         EU and the Veterinary Agreement helps provide certainty for
page 31 for details.                                              New Zealand companies that export animal products to the UK.
New Zealand has also taken steps to diversify export              The MPI website will continue to provide updates to exporters
opportunities by pursuing free trade agreements with current      on Brexit and preparation measures that can be taken.
and future trade partners. Most notably, the 11-country
Comprehensive and Progressive Trans-Pacific Partnership
(CPTPP) came into force on 30 December 2018, providing            Figure 2: New Zealand dollar has fallen for two straight years,
New Zealand’s primary sector exporters with more opportunities    boosting export returns
to develop markets overseas. This agreement has the potential
                                                                                            85
to deliver an estimated $222 million of tariff savings annually
                                                                                            83
and open up new export destinations. In terms of member
                                                                                            81
                                                                                            79
                                                                    Trade -weighted index

                                                                                            77
                                                                                            75
                                                                                            73
                                                                                            71
                                                                                            69
                                                                                            67
                                                                                            65
                                                                                                 2015   2016     2017    2018    2019

                                                                  New Zealand trade-weighted index, July 2014 to April 2019
                                                                  Source: Reserve Bank of New Zealand.

6 • MINISTRY FOR PRIMARY INDUSTRIES
Top 10 export destinations
Year ended March 2019
EU
(excl. UK) China
$3,320m $13,550m
Japan
$2,542m
South
UK Korea
$1,199m $1,325m
Malaysia Taiwan
$978m $1,149m
Hong Kong US
$1,031m $4,112m
Australia
$4,556 Total
export revenue
$ million %
Product (March 2019) of Total
Dairy 17,689 39%
Meat and Wool 10,184 22%
Forestry 6,837 15%
Horticulture 5,874 13%
Seafood 1,870 4%
Arable 216 0%
Other primary sector 2,700 6%
Total primary industries 45,370 100%
Top markets ($NZ millions, year ended March 2019)
All exports Dairy Meat and Wool Forestry
China 30% China 31% China 30% China 50%
Australia 10% Australia 7% US 20% Australia 10%
US 9% Japan 4% EU (excl. UK) 15% Sth Korea 7%
EU (excl. UK) 7% Malaysia 4% UK 6% Japan 6%
Japan 6% US 4% Japan 4% India 5%
Sth Korea 3% Philippines 4% Australia 4% US 4%
UK 3% UAE 3% Taiwan 3% Indonesia 3%
Taiwan 3% Indonesia 3% Sth Korea 2% Thailand 2%
Hong Kong 2% Thailand 3% Canada 2% Malaysia 2%
Malaysia 2% Hong Kong 3% Indonesia 1% Hong Kong 2%
All Other 26% All Other 35% All Other 13% All Other 10%
0 2,000 4,000 6,000 8,000 10,000 12,000 14,000 0 1,000 2,000 3,000 4,000 5,000 6,000 0 500 1,000 1,500 2,000 2,500 3,000 0 500 1,000 1,500 2,000 2,500 3,000 3500
Horticulture Seafood Arable Other
EU (excl. UK) 18% China 32% EU (excl. UK) 40% Australia 44%
Australia 14% Australia 13% Australia 17% China 12%
US 13% US 13% US 7% Japan 7%
China 12% EU (excl. UK) 13% Japan 7% Hong Kong 5%
Japan 12% Japan 6% Switzerland 5% South Korea 5%
UK 9% Hong Kong 3% South Africa 4% Singapore 5%
Taiwan 4% Taiwan 3% Chile 4% US 5%
Canada 3% Sth Korea 2% Sth Korea 3% UK 3%
Sth Korea 3% Canada 2% UK 2% EU (excl. UK) 2%
Hong Kong 2% Singapore 1% China 2% Canada 1%
All Other 12% All Other 12% All Other 9% All Other 11%
0 200 400 600 800 1,000 1,200 0 100 200 300 400 500 600 700 0 10 20 30 40 50 60 70 80 90 0 200 400 600 800 1,000 1,200 1,400
SOPI JUNE 2019 • 7
Positioning for success
       New Zealand’s future                                      We want to make sure New Zealand’s farmers and growers are
                                                                 well-positioned for the future so that our agriculture practices
       wellbeing depends                                         are world-leading and our rural communities continue to
                                                                 thrive. MPI is working across a range of areas to achieve this,
       on an economy that is                                     including:

       both environmentally
       sustainable and delivering                                                  Examining market structures through the

       high value. The agriculture                                                 Dairy Industry Restructuring Act review

       sector continues to be
                                                                                   Exploring how farmers can reduce
       the engine room of our                                       CH4     N
                                                                                   emissions and adapt to climate change

       economy. Last year it
       contributed more than                                                       Addressing challenges around water
       $42 billion in export                                                       quality and Farm Debt Mediation; and

       revenue, employing over
       350,000 people.                                                             Providing incentives for planting more
                                                                                   trees.
There are challenges ahead; we are living in a world
characterised by disruption. Consumer preferences are
changing; we’re facing more competition in export markets;
we’re reaching environmental limits in some areas; the pace of
technological change is increasing; and global demographics          The following pages provide a snapshot across some of
are changing.                                                        this work.

     8 • MINISTRY FOR PRIMARY INDUSTRIES
Review of the Dairy Industry
Restructuring Act 2001
Government’s objectives and the DIRA review Birth of Fonterra
In 2001 the New Zealand dairy
industry underwent historic
The Government is committed to 1. Still operates in the long term reform when the Dairy Industry
addressing long-term challenge like interests Restructuring Act 2001 (DIRA) was
sustainable economic development, passed to enable the creation of
of New Zealand dairy farmers,
increased value for exports, decent consumers, and the regional and Fonterra.
jobs paying higher wages, a healthy wider economy
environment, and a fair society. The DIRA’s purpose was to create a
co-operative dairy company with the
Given the dairy sector is one of scale required to be a truly effective
New Zealand’s two largest export competitor in international markets.
2. Now gives rise to consequences
earners, it is important that the DIRA
that the Act did not intend to cause
rules continue to deliver a productive, As Fonterra controlled 96 percent
sustainable and inclusive dairy And if so to what extent do they arise. of all domestic farmers’ milk
industry. production when it was formed,
the DIRA contained provisions to
In May 2018, the Minister of manage risks arising from the lack
Agriculture announced a review 3. Remains relevant and fit-for- of competitive pressure its market
of the DIRA’s impact since 2001, purpose dominance resulted in.
which focuses on whether the DIRA
regulatory regime:
MPI’s efforts to date
In preparing reviews, MPI undertook the
following consultation steps:
Early Economic Discussion Public consultation Submissions Cabinet Select
engagement analysis document (2nd Nov 2018 to 8 Feb 2019) considered decisions committee
13 22 188
Conducted Independent Review of the Public 1-on-1 Submissions (Feb-May Based on Further
with key report DIRA and it’s meetings meetings with: received 2019) reviews opportunity
stakeholders commissioned impact on the presented in for public
Dairy processors
dairy industry submissions comment
Representatives
of farmers (June/July (Sept-Dec
2019) 2019)
Environmental
groups
Māori interests
group
SOPI JUNE 2019 • 9Essential Freshwater programme
Launched in October 2018, the Essential
Freshwater Programme aims to deliver
long-term improvements via efforts to
stop further degradation, reverse past
damage, and address nutrient discharge.
Environment Aotearoa 2019 states that waterways
in farming areas are polluted by excess nutrients,
sediment and pathogens. For example:
70%
of river length in pastoral farming
areas has nitrogen levels that may
affect aquatic species 1
3
90%
of river length in urban areas is
not suitable for swimming due to
risk of infection by pathogens
concentration levels are 2 to 15 times higher
MEDIAN (depending on the pollutant) in farmed areas
2
POLLUTION compared to waterways in more natural settings
REACTIVE Of 145 monitored pastoral river sites, phosphorus
1 Nutrients 2 Sediment 3 Pathogens
trends were improving at 46 percent of sites and
PHOSPHORUS
worsening at 21 percent of sites (1994–2013) E.g. nitrogen and E.g. run off from Disease-causing
IMPROVEMENTS
phosphorus farms, forests microorganisms –
and urban areas e.g. E. coli
These forms of pollution above degrade cultural well-
being (for example it can also have a detrimental affect
the mana associated with an iwi or hapū).
The Essential Freshwater Programme’s Scope
A discussion document 1 2 3 4
is expected to be Reinforcing good
Stopping and reversing Better management Protecting ecosystem
released in July-August farm practices like
damage in at-risk riparian setbacks, farm of high risk activities health, wetlands, and
on changes to the (e.g. winter grazing, streams
catchments environment plans,
Freshwater National and stock exclusion feedlots and
Policy Statement, a new intensification)
Freshwater National
Environmental Standard
and fair allocation of
freshwater resources.
5 6 7 8
The work programme
Fair and efficient
is wide ranging and will Reducing excessively Consideration of Māori Reducing sediment
allocation of nutrient
consider long term and high nitrogen leaching rights and interests loss
discharge
interim options for:
10 • MINISTRY FOR PRIMARY INDUSTRIESThe Essential Freshwater programme’s scope cont...
Some land and water users in Te Kāhui Wai Māori Science and
more highly polluted catchments
Māori land and water users,
Technical Advice
will have to make changes to meet
advocates, and scientists who Group
the new objectives for healthy
advise on a range of issues Includes 16 scientists who
freshwater. with a focus on te Mana o Te are overseeing the scientific
Any new rules and requirements Wai – the mana of the water evidence for freshwater policy
– an overarching framework development, including all
must be practical and enduring; aspects of ecosystem health.
that underpins policy, practice,
which means they need to be
and decision-making.
science-based, reflect mātauranga
Māori, be predictable, understood
by the public, and underpinned
by effective regulation and Freshwater Regional Sector
enforcement. Leaders Group Water Group
To help achieve this, an advisory Primary sector leaders, land This group of Regional Council
network is involved in testing and and water users, advocates, leaders and staff is facilitating
and scientists who provide engagement between regional
advising on policy options. More
advice and input on all aspects and central government on
stakeholders will be involved during
of the policy programme, with the work programme, and
consultation.
a focus on how the elements providing other relevant
This advisory network is made up interact to achieve the goal of advice.
of the following groups: healthier freshwater.
Farm Debt Mediation
Last December, the New Zealand Cabinet gave policy approval to establish a statutory
scheme for the mediation of farm debt in New Zealand.
Background Why we are doing this? Upcoming developments
The scheme would require secured The scheme is intended to provide The draft Bill is likely to be
creditors, such as banks and a mechanism for farmers and introduced in coming months
secondary lenders, to offer farm creditors to: (mid-2019) and is intended to be
debt mediation before taking passed by the end of the year. The
• have equitable and
enforcement action for debt held public will have an opportunity to
constructive discussion about
over eligible farm businesses. submit on the Bill during the Select
options for farm business
Eligible farmers will be able to Committee process in the second
turnaround;
request mediation at any time. half of 2019.
• provide for a timely and
dignified exit for farmers
where these options do not
exist.
SOPI JUNE 2019 • 11One Billion Trees
What is the One Billion Trees Generate sustainable Support Māori values
regional economic and aspirations and
programme? create opportunities
growth, employment
and workforce to maximise the
The Government has set development potential of their
a goal to plant one billion land and resources
trees by 2028. The One
Billion Trees programme
Mitigate climate Optimise land use
will deliver improved social, change
environmental, and economic
outcomes for New Zealand.
Led by Te Uru Rākau (Forestry
Protect the Support
New Zealand) and funded by the
environment and New Zealand’s
Provincial Growth Fund, the programme
increase indigenous transition to a low
aims to:
biodiversity emissions economy
What does the One Billion Tree The Programme is focused on making it easier to plant a mix of permanent and
plantation forestry trees that involve exotics and natives by lowering the planting
programme do? barriers currently faced by landowners and, supporting the right trees, in the right
place, for the right purpose.
MPI’s efforts to date? With a focus on better integrating trees into the landscape, the One
Billion Trees Programme has a range of tools to support landowners
to achieve this:
nt
me
rn
l
ve
ita
Direct investment in joint ventures
Go
p
Ca
Joint
Venture To kick-start the One Billion Trees programme, Crown Forestry is entering into forestry
right arrangements (‘joint ventures’) with landowners, with a target of planting up to
wn n d
ers
L
a
24,000 hectares.
do
L an
12 • MINISTRY FOR PRIMARY INDUSTRIESMPI’s efforts to date
continued:
Direct landowner grants: simple and accessible grants for
landowners
The One Billion Trees Fund provides grants to landowners to contribute to the cost of
Per-Hectare
Grants new tree planting to support a range of goals including erosion control, better land
For land owners productivity, and income diversification. The aim is for two-thirds of trees funded
through grants to be native species. The focus is on trees integrated into farms, rather
than whole-farm conversions. The Fund is expected to see up to 60 million trees
planted over the three years of its operation.
Partnership funding: for initiatives critical to enabling One
Billion Tree planting
These partnerships will support an increase in planting by promoting innovation,
Partnerships
Co-funding special
research, and workforce initiatives. They will also look at options to scale-up native
projects regeneration projects.
What’s next for the The focus of Te Uru Rākau for 2019 is implementing the One Billion Trees Fund,
including working with regional councils, the nursery sector, Māori landowners, and
One Billion Trees
community groups.
Programme?
Key changes to the Emissions Trading Scheme later in 2019 are expected to drive an
increase in tree planting, see page 14.
This year Te Uru Rākau will develop a Forest Strategy for New Zealand, to set the
direction for the forestry sector over the next 20-30 years and establish a path for
achieving the Government’s broader forestry aspirations. The Forest Strategy will be
developed collaboratively with sector participants.
SOPI JUNE 2019 • 13Agriculture and the Emissions
Trading Scheme
The agricultural sector is not currently Biological emissions
required to pay for the biological
greenhouse gas that it produces. In
April last year, the Government tasked
the Interim Climate Change Committee
(ICCC) – an independent ministerial
advisory group – to look at whether/
Methane Plant material in Methane
how emissions from this sector could be
priced via the New Zealand Emissions CH4 CH4
Trading Scheme or another mechanism.
Nitrous oxide
The Interim Committee delivered a report
outlining its recommendations on this, N2O
and other options to reduce emissions
from agriculture, to Ministers on 30
April 2019. They are now assessing
the report. Consultation on the ICCC
recommendations and the Government’s Microbial digestion Microorganisms
response is due in the next few months.
Changes expected from averaging in the
Emissions Trading Scheme
Later this year, a simpler way to count Practically what this means for foresters Carbon accounting practices
the carbon that trees store is being is that they will be able to sell all the
introduced to the NZ Emissions Trading carbon units they earn, without having to 1200
Scheme (ETS). This new “averaging pay some of them back when they harvest Mature forest
accounting” approach will be optional for their forests. Previously, many foresters harvest
new registrations of post-1989 forestry held back a significant proportion of their
NZU/ha
into the scheme until 31 December 2020, units in order to cover harvest liabilities.
and compulsory for new registrations
from 1 January 2021. We expect that the reduced harvest
liabilities will increase the incentive to 0
planting
Averaging accounting allows post-1989 afforest and, as a result, more new land Forest age
forestry participants to account for the being planted in forestry. At current
averaged amount of carbon stored in their carbon prices we expect that the Averaging
forests over the long run, rather than afforestation rate will increase by close to Current accounting
basing calculations on the cyclical peaks 70 percent. During the One Billion Trees
and troughs that occur during harvest 10-year target period to 2027, this will
and regrowth. amount to another 78,000 hectares of
forestry planted, or 89 million trees.
14 • MINISTRY FOR PRIMARY INDUSTRIESSOPI JUNE 2019 • 15
Dairy
                                                                                              Global price volatility
                                                                                              for key commodities
                             Export revenues are forecast to                                  impacted export
                             increase 5.7 percent to                                          prices, subduing                     $
                             $17.6 billion in 2019, supported                                 early season export
                             by strong milk production and                                    revenues in 2018/19.
                             sustained global demand.

                              Milk production for 2018/19                                     All-company average
                              forecast to rise 2.3 percent,                                   farmgate payout
                              supported by                                                    forecast lifted to $6.46
                              favourable                                                      for 2018/19 as
                              weather, promoting                                              commodity prices
                              strong pasture                                                  recover, boosting
                              growth.                                                         on-farm profitability.

                                                                                                                                                2023
                                                                                                                               2022
                                                                                                                 2021                           18,510
                                                                                                    2020                       18,190
                                                                                   2019                          17,160
                                                                                                    17,820
                                                                                   17,610
                                                                  2018
                                                                  16,655

                                                2017
            2015                                14,638
            14,050            2016
                              13,289

Table 2: Dairy export revenue 2015–23 (NZ$ million)
                                                             Actual                                                    Forecast
 Year to 30 June                           2015           2016             2017       2018           2019      2020        2021         2022        2023
 Whole milk powder                         5,385          4,609            5,271      5,818         6,430      6,080       6,110        6,190      6,260

 Butter, AMF, and cream                    2,219          2,378            2,794      3,812         3,650      3,690       3,750        3,820      3,870

 Skim milk & butter milk powder            1,762          1,347            1,385      1,228         1,310      1,570       1,580        1,600      1,620

 Casein & protein products                 2,129          1,834            1,735      1,601         1,490      1,550       1,610        1,630      1,650

 Cheese                                    1,557          1,720            1,830      1,905         1,930      1,980       2,010        2,030      2,060

 Infant formula                              415           685              778       1,240         1,560      1,670       1,800        1,880      1,960

 Other dairy products*                       582           716              845       1,050         1,240      1,290       1,330        1,360      1,400

 Total                                   14,050          13,289       14,638        16,655         17,610     17,820      18,190    18,510        18,820

 % Change                                -21.0%           -5.4%       +10.1%        +13.8%         +5.7%      +1.2%       +2.1%         +1.8%      +1.7%

Source: Stats NZ and MPI.
* Other dairy products include: liquid milk and cream, ultra-high temperature milk, yoghurt, and ice cream.

16 • MINISTRY FOR PRIMARY INDUSTRIES
Top 10 export destinations
China
$5,422m
Japan
US
$733m $661m
Hong Kong
$470m
Philippines
$636m Total
export revenue
UAE $ million %
$565m Product (March 2019) of Total
Thailand Whole Milk Powder 6,443 36%
$525m
Malaysia Butter, AMF & Cream Products 3,831 22%
$678m
Cheese 1,949 11%
Casein & Protein Products 1,480 8%
Skim Milk and Butter Milk Powder 1,225 7%
Indonesia
Australia Infant Formula 1,514 9%
$561m
$1,239m Other Dairy Products 1,247 7%
Total Dairy 17,689 100%
Top markets ($NZ millions, year ended March 2019)
Total dairy products Whole milk powder Butter, AMF & cream
China 31% China 38% China 19%
Australia 7% Algeria 6% Philippines 7%
Japan 4% Sri Lanka 6% Australia 7%
Malaysia 4% UAE 6% Saudi Arabia 5%
US 4% Bangladesh 5% Mexico 4%
Philippines 4% Malaysia 4% US 4%
UAE 3% Thailand 4% EU (excl. UK) 4%
Indonesia 3% Indonesia 3% UAE 4%
Thailand 3% Singapore 3% Vietnam 3%
Hong Kong 3% Vietnam 2% Malaysia 3%
All other 35% All other 23% All other 39%
0 200 400 600 800 1,000 1,200 1,400 1,600
0 1,000 2,000 3,000 4,000 5,000 6,000 7,000 0 500 1,000 1,500 2,000 2,500 3,000
Skim & butter milk powder Casein & protein products Cheese
China 31% US 31% Japan 20%
Philippines 11% Japan 14% China 18%
Malaysia 9% China 13% Australia 14%
Thailand 8% EU (excl. UK) 11% South Korea 6%
Indonesia 5% Mexico 6% Indonesia 5%
Singapore 5% Singapore 3% Philippines 4%
Taiwan 4% Indonesia 3% Saudi Arabia 4%
Vietnam 4% South Korea 2% Chile 3%
Australia 2% Philippines 2% Taiwan 2%
Pakistan 2% Thailand 2% Malaysia 2%
All other 18% All other 13% All other 22%
0 50 100 150 200 250 300 350 400 0 50 100 150 200 250 200 350 400 450 500 0 50 100 150 200 250 200 350 400 450
Infant formula Other dairy products*
China 40% China 57%
Australia 28% Malaysia 6%
Hong Kong 22% Australia 5%
Thailand 2% Indonesia 3%
Taiwan 2% Philippines 3%
Malaysia 2% Thailand 3%
South Korea 2% Hong Kong 2%
Russia 1% Taiwan 2%
Vietnam 2%
Japan 2%
All other 2% All other 13%
0 100 200 300 400 500 600 700 0 100 200 300 400 500 600 700 800Strong production and export price season’s strong finish. As on-farm supplementary feed was
recovery underpinning export growth used up, February production fell 0.1 percent compared with
New Zealand’s dairy export revenue is forecast to increase to the previous year, with March production 7.5 percent lower
$17.6 billion for the year ended June 2019, up $1.0 billion (Figure 4).
(5.7 percent) from the previous year. Strong domestic milk
production has resulted in increased export volumes, with Figure 4: Strong milk solids production compared with
sustained demand out of China and South East Asia supporting previous season
prices. Global dairy commodity prices have experienced
300
significant volatility over the year, affecting returns across 5 year average
several important products. 250 2017/18 Season
2018/19 Season to date
Production (Million kg ms)
However, a recovery in global prices, which began in late 2018, 200
will see export revenue growth continue into 2020, supporting
150
relatively strong farmgate milk payouts over the medium term
(Figure 3). 100
Figure 3: Dairy export revenue growth led by whole milk 50
powder and value added products
0
18,000 + 30 - 113 Jun Jul Aug Sep Oct Nov Dec Jan Feb Mar Apr May
+ 63 - 196
+ 202
Milk solids production (2017/18 and 2018/19 season)
+ 296
Source: Dairy NZ.
17,500
Export revenue (NZ$ millions)
+ 682
As a result, although total milk solids production to date (ending
March 2019) is currently 3.5 percent ahead of the previous
17,000
season, we are forecasting total milk solids production for the
current season ending May 2019 to be 1,883 million kilograms,
16,500 2.3 percent above the previous year.
These results are all the more impressive in the context of the
16,000 declining size of the New Zealand dairy herd. Figures from the
Jun-18 Whole Infant Other SMP & Cheese Casein Buttter Jun-19
Milk Formula BMP and 2018 Agricultural Production Survey released by Stats NZ show
Powder AMF
Dairy export revenue growth by product, year ended June 2018–19
that, as at June 2018, dairy cows in milk or in calf were
Source: Stats NZ. 0.7 percent lower than the previous year at 5.01 million. This
follows a 3.0 percent decline in the previous year. With both
New Zealand milk production lifted by dairy calving numbers and rising one-year-old dairy heifers also
favourable weather conditions declining, we expect this trend in the national dairy herd to
After a challenging 2017/18 season, this year has been far continue over the next few years.
more positive for New Zealand milk production. Following a
As the industry adjusts to increasing pressures to reduce the
strong finish to the previous season, early season production
environmental impacts of dairy farming (with more catchments
was boosted by increased winter milking in June and July (up
bringing in constraints on nutrient discharges to improve water
7.7 percent on the previous year) and mild temperatures.
quality outcomes), further on-farm productivity gains will need
Favourable weather conditions continued through spring and
to continue, in order to drive future industry growth. Indeed,
early summer, promoting strong pasture growth across the
dairy farm productivity (measured by milk solids produced per
major dairy regions during the peak milk production months
cow) has experienced a compound average growth rate of
from September to January. Overall, total milk solids production
1.9 percent annually over the past 10 years.
for this period increased 5.6 percent on the previous year, the
second highest ever, only 1.5 percent below the record set in However, the ongoing effect of these increasing regulatory
2015, when the milking cow population was 3.3 percent higher. constraints should act to limit any future intensification of
farming practices. This is also likely to inhibit any growth in the
Excess grass growth early in the season also allowed many
national milking platform area, but the impact will vary by
farmers to increase on-farm stores of bailage and silage. This
region. As a result, we are forecasting a slight decline in the
has, to some extent, provided a buffer for production later in
national dairy herd and land use over the medium term.
the season, as a hot, dry summer limited pasture growth. As a
result, January milk collections were up 7.7 percent, compared Despite this, we do expect ongoing advances in herd genetics,
with the previous year. improvements in farm management practices, forages, and
new technology to continue to drive further increases in
Unlike the previous season, where a favourable autumn
on-farm productivity. With increases in milk solids production
boosted production significantly above the long-term average,
per cow likely to continue (albeit at a slower pace due in part to
this season has followed a pattern more typical of prior years.
nutrient discharge limits), this should offset the effects of a
With the weather outlook at the tail end of this season across
declining dairy cow population, leading to a modest growth in
New Zealand’s major dairying regions drier and warmer than
milk solids production over the medium term.
last year, many farmers have dried off their herds earlier than
normal. Consequently, output has fallen well behind last
18 • MINISTRY FOR PRIMARY INDUSTRIESGlobal production outlook beginning to prices have since experienced a significant recovery.
weaken GDT auction prices for butter and AMF have subsequently
The strong production season experienced by the New Zealand reversed their previous declines, with cheddar also trading
industry has contrasted against weakening supply trends across 5.5 percent higher and WMP prices 1.4 percent higher than at
other major milk producing countries over the past nine the beginning of the season.
months, which has supported price recovery for New Zealand
exporters as the season developed. Oceania region prices for butter, skim milk powder (SMP), and
cheddar are now trading at significant premiums to EU and US
In Australia, continued drought conditions and increasing equivalents. This is likely to further constrain New Zealand
supplementary feed and irrigation costs have resulted in export price growth for these commodities over the short to
increased dairy cow cull rates and farm exits. As a result, medium term.
Australian milk production for the 12 months to March 2019
was 6.7 percent below the previous year, with Dairy Australia
Figure 5: Global dairy commodity prices sharply falling
forecasting the season to be down between 7 percent and
before recovering in the latter half of the season
9 percent overall.
1,200
EU milk production has also showed signs of weakness. GDT Index 7 May
2019 -3.3% higher
GDT Index (2010 = 1000)
Difficult summer conditions across north-western Europe and 1,100
than at the start of
the season
declining herd numbers constrained dairy output growth. This
has resulted in milk collections for the year to February 2019 to
1,000
be up only 0.2 percent on the previous year.
Similarly, in the United States, tight margins, high cull rates, 900 GDT Index 20 Nov
record farm closures, and weather issues are combining to 2018- 20.6% fall
since the start of
constrain production. Although total milk production for the 12 the season
800
months to March 2019 was up 1 percent for the year, this was 2017/18 Dairy Season 2018/19 Dairy Season
below earlier market expectations. As a result, the US Global Dairy Trade Index price (June 2017–April 2019)
Source: Global Dairy Trade.
Department of Agriculture has lowered its forecast for
production growth to just 1 percent for the year ahead.
EU clearance of SMP intervention stocks
Greater volatility in commodity prices
have supported price growth
characterising Global Dairy Trade The large amount of intervention stocks built up by the EU has
auction results been depressing SMP prices since the end of 2016. In total,
The strong New Zealand season has dominated global supply
395 thousand tonnes of SMP were bought by the European
patterns, weighing heavily on dairy commodity prices from May
Commission between 2015 and 2017 to help stabilise the
to November. Prices for butter and anhydrous milk fat (AMF)
market and support farmers' incomes following the removal of
on the Global Dairy Trade (GDT) auction fell 26.4 percent and
country-specific production quotas. The EU has been grappling
34.8 percent respectively. Similarly, whole milk powder (WMP)
with the inventory for several years, however, through a series of
prices also fell 18.9 percent over the same period, while
large tenders from December 2018 to February 2019, it has
cheddar prices fell 18.7 percent. However, as expectations of
now cleared almost all of its stockpile. The consequent recovery
production growth eased across the northern hemisphere and
in global prices has been significant, with GDT prices for SMP
dry weather curbed New Zealand’s forecast supplies into export
rising 28 percent since the beginning of December.
markets, this eased risks of a potential excess supply–demand
imbalance in global markets (Figure 5). As a consequence,
Table 3: Dairy farm production, milk prices, and exports 2015–23
Actual Forecast
Year to 30 June 2015 2016 2017 2018 2019 2020 2021 2022 2023
Cows and heifers in calf or in 5.06 5.20 5.04 5.01 4.98 4.96 4.94 4.93 4.92
milk (million)
Milk solids production (million 1,890 1,854 1,851 1,840 1,883 1,853 1,863 1,873 1,883
kg)
Milk solids per cow (kg of milk 365 367 356 367 376 372 376 379 382
solid)
Milk price (cents per kg of milk 461 426 640 672 646 697 712 721 725
solids)
Total export value ($ million) 14,050 13,289 14,638 16,655 17,610 17,820 18,190 18,510 18,820
Total export volume (thousand 3,046 3,232 3,279 3,238 3,448 3,373 3,408 3,428 3,452
tonnes)
Average export price ($ per kg) 4.61 4.11 4.46 5.14 5.11 5.28 5.34 5.40 5.40
Source: MPI, Stats NZ, DairyNZ.
SOPI JUNE 2019 • 19For the nine months to March 2019, New Zealand’s export of
Figure 6: Clearance of EU intervention stocks have led to a butter and AMF increased by 35,100 tonnes (up 10.7 percent),
recovery in global prices compared with the previous year, although cheese production
400 2,800 growth was flat with only an additional 1,800 tonnes of cheese
350 2,600
(up 0.8 percent) exported. However, the volatility in butter and
Ending stocks (thousand tonnes)
GDT SMP price US$ per tonne
300
AMF prices so far this season has been reflected in an overall
2,400
fall in average export prices for these products for
250
2,200 New Zealand’s processors. Accordingly, we are forecasting
200
2,000
butter and AMF export revenues for the year ended June 2019
150 to be down 4.2 percent to $3.65 billion, as the impact of
1,800
100 increased volumes is offset by lower average prices across the
50 1,600 season. Looking ahead to 2020 and beyond, we expect modest
volume increases and continued strength in prices to support
0 1,400
2015 2016 2017 2018 2019 steady export revenue growth for these products.
Ending stocks SMP price (right axis)
EU intervention stock inventories and GDT SMP prices (July 2015–March 2019) Cheese exports are forecast to lift only 1.5 percent to
Source: Global Dairy Trade and Agriculture and Horticulture Development Board
$1.93 billion for the year ended June 2019, driven by improved
– Dairy (UK).
prices despite flat export volume growth (Figure 8). With strong
As can be seen from Figure 6, while early intervention competition in export markets from the EU (particularly in the
purchases supported prices for SMP initially, the large overhang important Japanese market) and also the US, we expect export
of inventory in the global market ultimately depressed global volumes for cheese to continue to trend upwards at modest
prices during 2017 and 2018. With the gradual sell down of rates over the medium term, with growth to $1.99 billion
stocks, starting in early 2018 and finishing February 2019, forecast for the year ended June 2020.
SMP prices have subsequently recovered.
Much of New Zealand’s increased domestic milk production
Global demand–supply dynamics drive this season has been moved into WMP. New Zealand exported
divergence between dairy fats and an additional 135.7 million tonnes of WMP during the nine
protein prices months to March 2019, up 11.6 percent on the previous year.
The impact of EU intervention stocks on depressing SMP We are forecasting WMP revenues for the year ended June
prices, with the consequent flow-on effects for WMP, highlight 2019 to rise 10.5 percent to $6.43 billion. As New Zealand’s
the growing disparity in global price trends between dairy fat on-farm milk production next year falls to levels more in line
and protein products that has emerged since 2015. However, with historical averages, we expect this to result in declining
income growth and the westernisation of dietary preferences in export volumes for WMP as New Zealand processors adjust
important Asian export markets (particularly China) have also their production mix to maximise their revenue streams across
been a key factor, boosting demand and supporting strong all their products. Accordingly, we are forecasting WMP
price growth for butter, AMF, and cheese over the past three revenues to fall 5.4 percent to $6.07 billion for the year ended
years. June 2020, with modest growth then continuing out to 2023.
While the price gap has closed slightly in recent months, we are
forecasting strength in butter, AMF, and cheese prices to
Figure 8: WMP and dairy fat volume growth amid high price
continue to be supported by sustained demand growth out of
volatility supporting export revenue growth
Asia (Figure 7).
15.0%
Volume Exported Average Export Price
Figure 7: Global dairy fat prices have diverged from proteins 10.0%
in recent years
5.0%
Butter, AMF Cheese WMP SMP & BMP Forecast
6,000
0.0%
5,000
-5.0%
Price (US$ per tonne)
4,000
-10.0%
3,000
-15.0%
Butter & AMF Cheese Whole Milk Skim Milk and Casein
Powder Butter Milk
2,000 Powder
Change in New Zealand export volumes and average export prices (nine months
1,000 to March 2019–20)
2010 2011 2012 2013 2014 2015 2016 2017 2018 2019 2020 2021
Source: Stats NZ
Dairy export prices 2010–20
Source: Stats NZ and MPI. Focus on value-added production
New Zealand is well positioned to take advantage of strong
continues with strong growth forecast
The evolution of New Zealand’s dairy sector towards increasing
demand for fat-based milk products due to the strong influence
value-added products has continued over the current year. In
of jersey genes in the national herd. The breed is known for
response to growing international demand for high-fat dairy
producing milk with a high fat content.
20 • MINISTRY FOR PRIMARY INDUSTRIESYou can also read