Atlas Biosecurity SURVEILLANCE - MPI
←
→
Page content transcription
If your browser does not render page correctly, please read the page content below
Atlas   OF

Biosecurity
SURVEILLANCE
    JANUARY 2020
Acknowledgements
The Atlas of Biosecurity Surveillance is a publication of the Surveillance and Incursion Investigation Group, Biosecurity
New Zealand. We are grateful to all in the Surveillance Group for their patient assistance and participation in compiling
this atlas. We also wish to thank Dr Craig Stewart, NIWA, for his assistance in data cleaning and contribution to figures,
and MPI’s Publications team and Words & Pictures for editing and formating this document.
Cover images: Ants in pottle by Flybusters/Antiants, Auckland, New Zealand; Native trees by Rory MacLellan; Hoiho
(Yellow-eyed penguin) taken on Rakiura (Stewart Island) © Robert Sanson (www.myfathersworld.net.nz)

Enquiries
All enquiries should be addressed to the Surveillance and Incursion Investigation group of the Diagnostic and
Surveillance Services Directorate of Biosecurity New Zealand.

Citation
Acosta H, Earl L, Growcott A, MacLellan R, Marquetoux N, Peacock L, Phiri BJ, Stanislawek W, Stevens P,
Tana T, van Andel M, Watts J, Gould B (2020).

Published by
Ministry for Primary Industries
34-38 Bowen Street
PO Box 2526
Wellington 6140
New Zealand
Tel: 64 4 894 0100 or 0800 008 333 (within New Zealand)
Fax: 64 4 894 0731
Web: www.biosecurity.govt.nz

Crown Copyright© 2019 – Ministry for Primary Industries. This document can be copied for non-commercial purposes
providing its source is acknowledged.

First published – January 2020
ISBN 978-1-99-001785-8 (Print)
ISBN 978-1-99-001786-5 (Online)

Disclaimer
While every effort has been made to ensure the accuracy of the information depicted in this atlas, no guarantees can be
made as to quality, performance and usefulness of the maps or data for the user. The atlas should be considered as a
dynamic document that is responsive to the surveillance priorities of Biosecurity New Zealand. Specific questions
regarding features of the atlas should be referred to Biosecurity New Zealand Surveillance Group. This atlas remains
copyright of Biosecurity New Zealand – Surveillance Group.
Contents
Preface                                                                                                       2
1     Introduction                                                                                            3
1.1   Biosecurity: What it is and why we should bother                                                        3
1.2   The biosecurity system in New Zealand                                                                   3
1.3   Surveillance: an essential component of post-border biosecurity                                         3
1.4 Risk and how it varies                                                                                    4
1.5 Atlas layout                                                                                              8
1.6 Boxplots                                                                                                  9
2     Surveillance Programmes                                                                               10
2.1   Biosecurity New Zealand Exotic Pest and Disease Hotline (0800 80 99 66)
      – general surveillance                                                                                10
2.2   Animal health information                                                                             15
2.4   Avian influenza surveillance programme                                                                20
2.6   Arbovirus surveillance programme                                                                      24
2.9   National apiculture surveillance programme                                                            28
2.11 Fruit fly surveillance programme                                                                       34
2.13 Gypsy moth surveillance programme                                                                      42
2.15 High-risk site surveillance programme                                                                  50
2.17 Marine high-risk surveillance programme                                                                56
2.18 National invasive ant surveillance programme                                                           64
2.20 National saltmarsh mosquito surveillance programme                                                     71
2.22 Transmissible spongiform encephalopathies (TSEs) surveillance programme                                76
2.24 Wildlife disease surveillance programme                                                                81
3     References                                                                                            85

                                                                                Atlas of Biosecurity Surveillance 1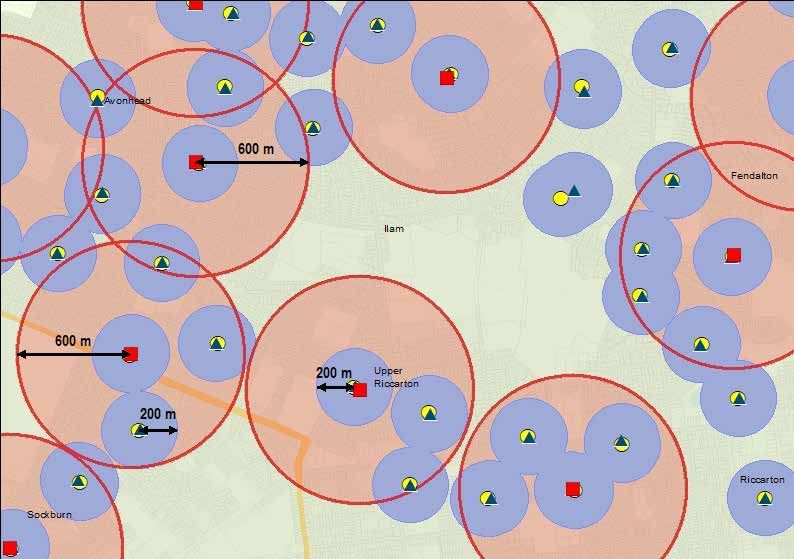
Preface
In 2011 we produced our first Atlas of Biosecurity            organisations such as the World Organisation for Animal
Surveillance to communicate the majority of our               Health (OIE) and the International Plant Protection
surveillance programmes, showing what we do, where we         Committee (IPPC). This Atlas aims to both increase
do it and why we do it. We were extremely happy with the      transparency and spark interest in our programmes for
positive feedback received from a range of stakeholders and   New Zealanders and international stakeholders.
members of the public, indicating the Atlas increased their
                                                              Our surveillance programmes span the length of the
knowledge and understanding of the Biosecurity New
                                                              country and involve multiple agencies, specialists and
Zealand’s surveillance programmes. For this version we
                                                              everyday New Zealanders: including sampling for marine
have expanded the Atlas to describe the full range of
                                                              pests in harbours, baiting ants around ports and
Biosecurity New Zealand’s active and general surveillance
                                                              transitional facilities, trapping fruit flies in backyards,
programmes. We also aim to provide a deeper insight into
                                                              surveying forests and coastal environments, blood sampling
these programmes. Hence, the reader will find that this
                                                              cattle in abattoirs, capturing pathological findings from
version includes more detailed explanations of the sampling
                                                              veterinary laboratories. Our general surveillance system
methods, information on the biological features of some of
                                                              also encourages all 4.7 million New Zealanders to phone a
the target organisms, or details of previous incursions. We
                                                              specialist or MPI’s Exotic Pest and Disease hotline (0800 80
hope this will provide further context to the importance of
                                                              99 66) when they come across a pest or disease they have
biosecurity surveillance and the outcomes that these
                                                              not seen before. In this way biosecurity surveillance
programmes achieve.
                                                              becomes everyone’s responsibility, a key message of
A main aim of our surveillance programmes is early            Biosecurity 2025’s Ko Tātou This Is Us campaign. In our
detection of new or exotic organisms which may impact our     work we continuously witness the passion of New
environment, economy, our access to fresh produce, and/or     Zealanders for protecting our natural resources, our people
the health and wellbeing of our people and animals. Early     and our way of life, and we are fortunate to be part of this.
detection enables the opportunity to minimise this impact     We hope this Atlas helps communicate the large amount of
and sometimes eradicate the organism. Quite often the only    work being undertaken in biosecurity surveillance and
time that the public become aware of the surveillance         inspires further participation in this system.
system is when it identifies the presence of a potential
threat in the country. However year after year the majority
of our surveillance programmes are also quietly fulfilling
another purpose of biosecurity surveillance: creating and
sustaining valuable export markets for New Zealand
produce and animal products. This is because zero
detections in a well-designed surveillance programme help
provide confidence to our trading partners that our exports   Brendan Gould
are free from the pests and diseases that may impact their    Biosecurity Surveillance and Incursion Investigation
country. Trade is also enabled by trust, and we must            Group Manager
therefore demonstrate transparency in our programmes, as      Diagnostic and Surveillance Services Directorate
well as fulfil international reporting requirements to        Biosecurity New Zealand

2 Biosecurity New Zealand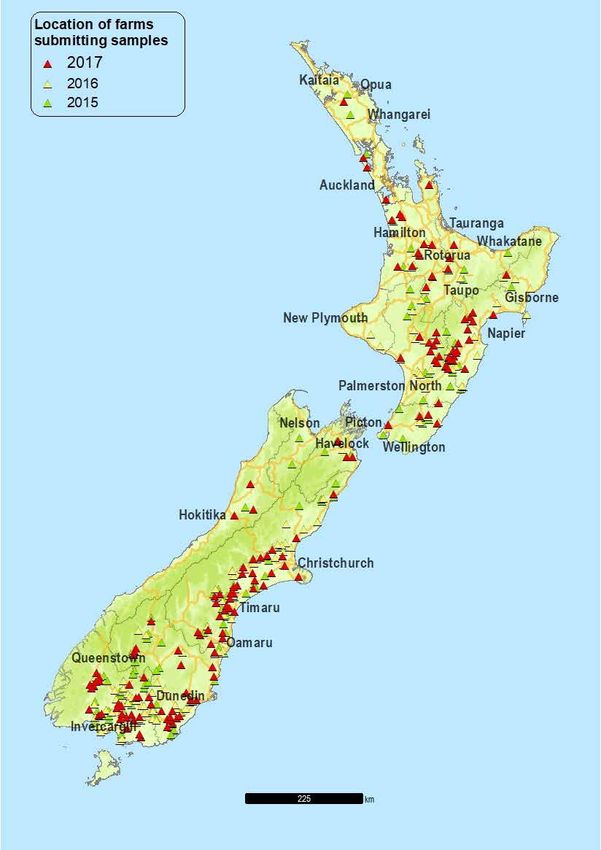
1 Introduction

1.1 Biosecurity: What it is and why we                                                        1.3 Surveillance: an essential component
    should bother                                                                                 of post-border biosecurity
Biosecurity is the protection of the economy, environment                                     Biosecurity surveillance is “the collection, collation,
and people from the risks1 associated with and                                                analysis, interpretation and timely dissemination of
consequences of, the introduction of damaging risk                                            information on the presence, distribution or prevalence of
organisms2, and the mitigation of the effects of risk                                         risk organisms and the plants or animals that they affect”
organisms that are already present.                                                           (MAF Biosecurity New Zealand, 2009). It is an essential
                                                                                              component of post-border biosecurity (Figure 1).
1.2 The biosecurity system in                                                                 Post-border surveillance is undertaken for a variety of
New Zealand                                                                                   reasons, some of the most important being:
                                                                                              • to provide evidence that a pest or disease is absent
The biosecurity system in New Zealand is coordinated by
                                                                                                 from a country, region or defined area, thus enabling
the Ministry for Primary Industries (MPI) and comprises
                                                                                                 access to particular export markets;
three sequential, equally important and highly interactive
sections: pre-border, border and post-border (Figure 1).                                      •      to detect new pests and diseases early enough to
It is a complex system based on commitments and                                                      enable cost-effective management;
synchronised interactions between government agencies,                                        •      to establish the boundaries of a known pest or disease
industries and members of the New Zealand public.                                                    incursion;

Biosecurity surveillance activities occur pre-border, at the                                  •      to monitor the progress of existing containment or
border, and post-border. Post-border surveillance                                                    eradication programmes.
increases the likelihood of detecting pests and diseases                                      Biosecurity surveillance in New Zealand is undertaken
early enough to conduct effective containment and                                             across the four functional areas of animals, plants,
eradication programmes.                                                                       environment and marine using active and passive, targeted
                                                                                              and non-specific surveillance techniques in continual,
                                                                                              seasonal and periodic programmes.

                        Figure 1: The biosecurity system

                                                      International agreements
                            Imports                     Import risk analysis

                                                         Border standards           Mail, passenger and
                            Vessels                                                  goods inspection          Internal border and
                                                                                                              pathway management
                                                         Pest risk analysis        Pathway risk analysis        SURVEILLANCE AND
                          Passengers                                                                             INVESTIGATION
                                                                                    Clearance standards
                                                                                                                   Response
                              Mail                                                                           Long-term management

                               Air

                               Sea

                                                                                       Adapted from MAF Biosecurity New Zealand, 2009

1 “Risk” is a measure of the probability of a harm multiplied by the consequence of such harm.
2 “Risk organism” is an organism either already present in, or new to, New Zealand that poses a potential biosecurity risk.

                                                                                                                                     Atlas of Biosecurity Surveillance 3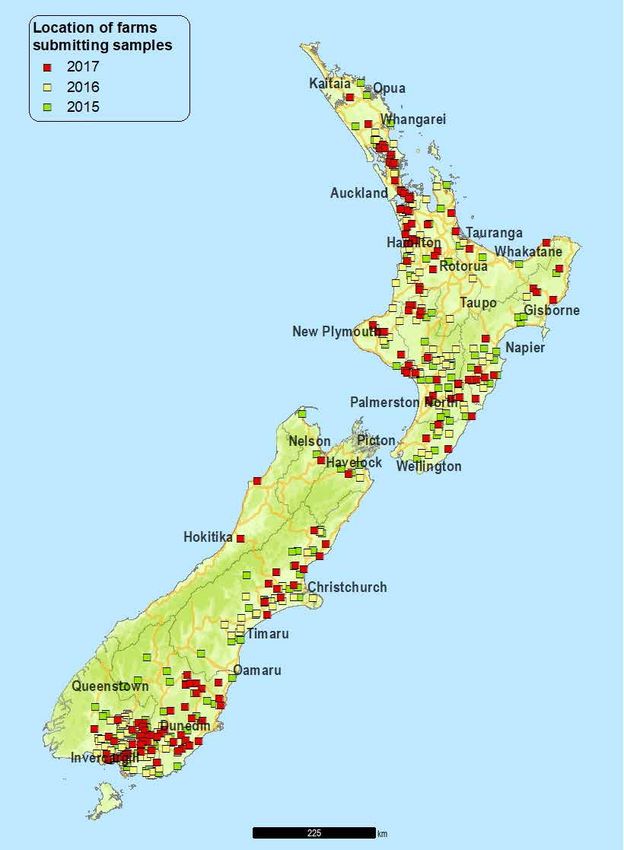
1.4 Risk and how it varies number of arrivals by air during recent years, which
suggests an increase of the risk level.
The arrival in New Zealand of imports, vessels and
passengers, as well as the connectivity that the air and sea A similar seasonal pattern is observed for people arriving at
creates with other regions of the world (Figures 2–7), has the airports of Hamilton, Rotorua, Palmerston North,
the potential to generate risks that, if unmanaged, could Queenstown and Dunedin, which received international
have serious impacts on New Zealand’s economic, passengers only from Australia between 2000 and 2018
environmental, human health, socio-cultural and Māori (Figure 5). This figure shows how risks associated with
values. These risks are highly dynamic and can vary in arrivals can appear or disappear, depending on the dynamic
space and time. of the airports across the country. Before 1995 for example,
Queenstown did not receive any direct flights from
For example, larvae of coastal marine species may be Australia, but today it is one of the busiest airports for
transported across oceans, predominantly in surface flights from there. Similarly, although Rotorua does not now
currents which are strongly influenced by deep ocean have any passenger flights from Australia, there were
currents (Figure 2) and other factors such as wind Australian flights to this city from 2009 to 2015.
conditions, seawater temperatures, salinity, and upwelling.
Risks associated with passengers and cargo vessels also
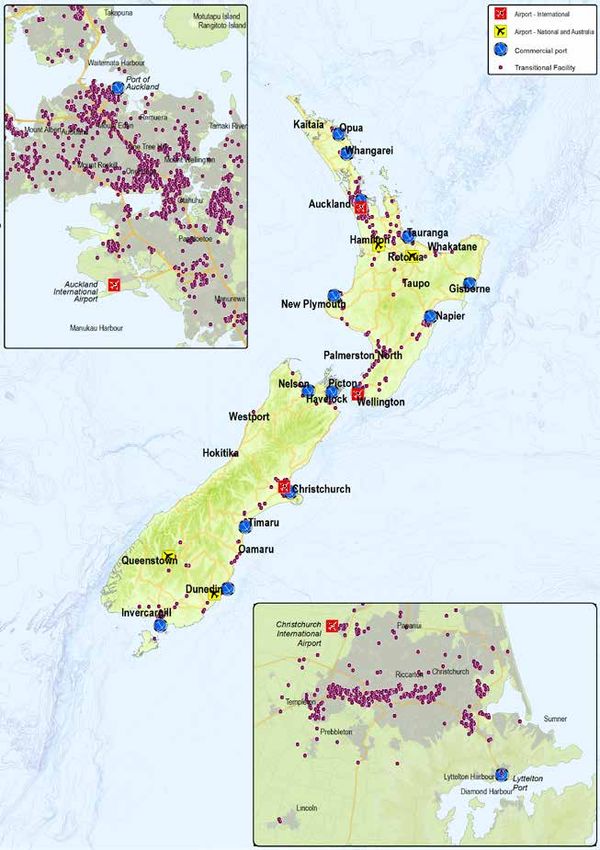
The risks also vary across the country. This is clearly shown vary in space and time. Figures 4 and 7 show a seasonal
in the map of New Zealand airports, commercial seaports pattern of arrivals, with more people arriving on passenger
and transitional facilities (Map 1). These localities are the vessels during summer. Similarly, Figure 6 shows that
most likely points of entry and spread for many new Auckland and Whangarei have been always the ports most
organisms. Similarly, the risks vary over time. For example, visited by international container vessels. The sudden drop
Figures 4–7 show a seasonal pattern of arrival numbers of for the Port of Wellington in November 2016 coincides with
people and vessels, thus risks, at airports and seaports the Kaikoura earthquake, which caused significant damage
over time. Figure 4 also shows a steady increase in the to the port and temporarily suspended operations.
Figure 2: Ocean currents in New Zealand region at approximately 1000m depth
Source: National Institute of Water and Atmospheric Research: Chiswell, SM et al (2015)
4 Biosecurity New Zealand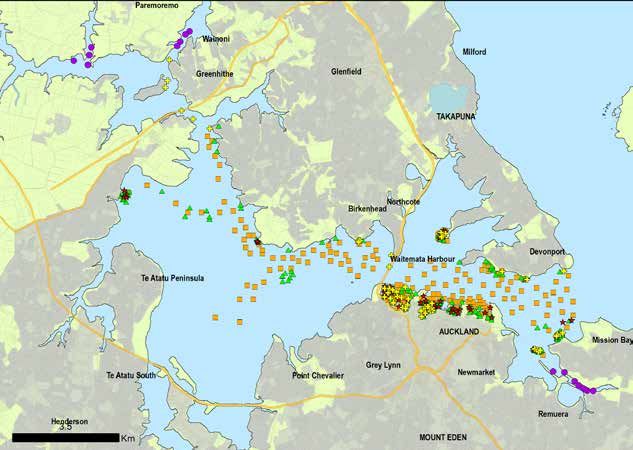
Map 1: International airports, commercial seaports and transitional facilities

Locations of transitional facilities are approximate and as at 2015.

                                                                                    Atlas of Biosecurity Surveillance 5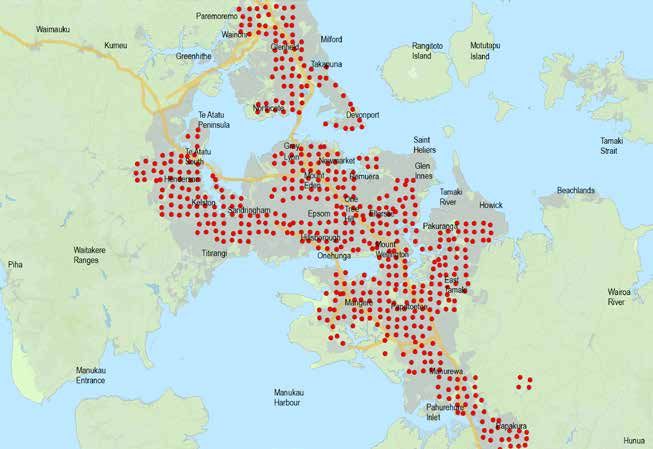
Figure 3: International flight arrivals into New Zealand in 2014

                                                                                                                                                                        Direct flight
                                                                                                                                                                        Feeder flight

                 Data source: https://openflights.org/data.html – downloaded 18/3/18

 Figure 4: Quarterly arrivals at New Zealand airports and seaports between 2010 and 2018

                                 2,000,000                                                                                                                                              2 000 000
                                                         + Airports
                                 1,800,000               + Seaports                                                                                                                     1 800 000

                                 1,600,000                                                                                                                                              1 600 000

                                 1,400,000                                                                                                                                              1 400 000
   Number of arrivals (people)

                                                                                                                                                                                                        Total Number of Arrivals (People)
                                 1,200,000                                                                                                                                              1 200 000

                                 1,000,000                                                                                                                                              1 000 000

                                   40,000                                                                                                                                                           40 000

                                   30,000                                                                                                                                                           30 000

                                   20,000                                                                                                                                                           20 000

                                   10,000                                                                                                                                                           10 000

                                        0
                                                                                                                                                                                                    0
                                             2010
                                             2010        2011 2011       2012 2012       20132013       20142014       20152015           20162016        20172017        2018
                                                                                                                                                                             2018
                                                                                                     Year (Mar/Jun/Sep/Dec)
                                                                                              Year – Quarterly (Mar/Jun/Sep/Dec)
                                                                                                                      By air Commons
                          This graph is based on Stats NZ’s data which are licensed by Stats NZ for re-use under the Creative    By sea
                                                                                                                                     Attribution 4.0 International licence.

Risks associated with passengers and cargo vessels also vary in space and time. Figures 4–6 show a seasonal pattern of
arrivals, with more people arriving on passenger vessels during summer. Similarly, Figure 6 shows that Auckland and Tauranga
have been always the ports most visited by international container vessels. This figure also shows a remarkable drop of visits
for the Port of Wellington between November 2016 and September 2017.

6 Biosecurity New Zealand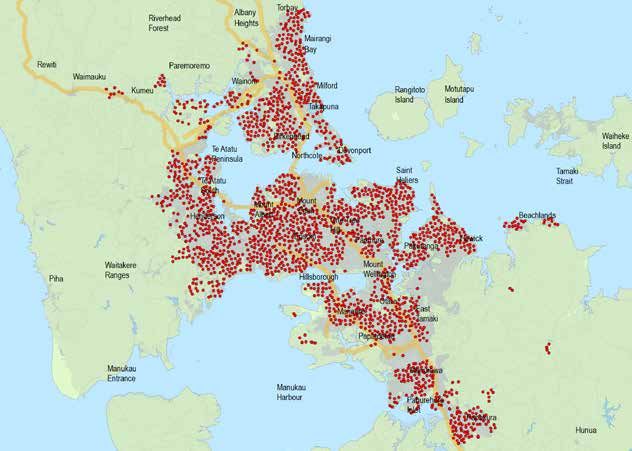
Figure 5: Arrivals from Australia at regional airports between 2000 and 2018
110 000
Dunedin Queenstown Hamilton Palmerston North Rotorua
100 000
90 000
80 000
70 000
Number of people
60 000
50 000
40 000
30 000
20 000
10 000
0
2000 2001 2002 2003 2004 2005 2006 2007 2008 2009 2010 2011 2012 2013 2014 2015 2016 2017 2018
Year – Quarterly (Mar/Jun/Sep/Dec)
This graph is based on Stats NZ’s data which are licensed by Stats NZ for re-use under the Creative Commons Attribution 4.0 International licence.
Figure 6: Visits of international container vessels to six ports between 2013 and 2018
85
Whangarei Auckland Tauranga Napier Wellington Bluff
80
75
70
Number of ship visits (container vessels)
65
60
55
50
45
40
35
30
25
20
15
10
5
0
Mar
Mar
Mar
Mar
Mar
Mar
Jul
Jul
Jul
Jul
Jul
Jul
Apr
Jun
Apr
Jun
Apr
Jun
Apr
Jun
Apr
Jun
Apr
Jun
Jan
Jan
Jan
Jan
Jan
Jan
Aug
Aug
Aug
Aug
Aug
Aug
Nov
Nov
Nov
Nov
Nov
Nov
Feb
Feb
Feb
Feb
Feb
Feb
May
May
May
May
May
May
Dec
Dec
Dec
Dec
Dec
Sep
Sep
Sep
Sep
Sep
Sep
Oct
Oct
Oct
Oct
Oct
Oct
2013
2013 2014
2014 2015
2015 2016
2016 2017
2017 2018
2018
Year – Month
This graph is based on Stats NZ’s data which are licensed by Stats NZ for re-use under the Creative Commons Attribution 4.0 International licence.
Atlas of Biosecurity Surveillance 7
Figure 7: Visits of international passenger vessels to six ports between 2013 and 2018
32
Auckland Tauranga Napier Lyttelton Timaru Bluff
30
28
26
Number of ship visits (passenger vessels)
24
22
20
18
16
14
12
10
8
6
4
2
0
Jan
Feb
Jun
Jul
Mar
Apr
May
Aug
Sep
Oct
Nov
Dec
Jan
Feb
Jun
Jun
Jul
Mar
Apr
May
Jul
Aug
Sep
Jan
Oct
Nov
Dec
Feb
Mar
Apr
May
Aug
Sep
Jun
Oct
Nov
Dec
Jan
Feb
Jul
Mar
Apr
May
Aug
Sep
Oct
Nov
Dec
Jan
Feb
Jun
Jun
Jul
Mar
Apr
May
Jul
Aug
Sep
Jan
Oct
Nov
Dec
Feb
Mar
Apr
May
Aug
Sep
Oct
Nov
Dec
2013
2013 2014
2014 2015
2015 2016
2016 2017
2017 2018
2018
Year – Month
This graph is based on Stats NZ’s data which are licensed by Stats NZ for re-use under the Creative Commons Attribution 4.0 International licence.
1.5 Atlas layout Surveillance programme
Each programme begins with an introductory page with the Objectives: The main objectives of the programme.
following headings: Start: The year when the programme officially began.
Name of the programme Methodology: The surveillance methods used to detect
target organism/s.
Target organism/s: The organism/s of concern for that
particular programme. Sampling period: The period of the year when sampling is
conducted.
Potential impacts: A summary of the potential impacts that
the target organism/s could have in New Zealand. Status: Whether the target organism/s are currently
present or not in New Zealand.
Introduction mechanisms: The means by which the target
organism/s could arrive and spread in New Zealand. Incursions: Known incursions in New Zealand of target
organism/s.
The introductory page is followed by a map of New Zealand
depicting the usual sampling locations of the programme.
For several programmes, additional large-scale maps have
been included to give the reader an idea of sampling
density.
Complementary information: This includes a summary of
the sampling effort and findings of the programme during
the past few years, as well as complementary information
on the identification, biology and world distribution of some
of the target species.
8 Biosecurity New Zealand1.6 Boxplots ranked values – all the values between the lower quantile
value (25 percentile) and the upper quantile value (75
Some of the information on surveillance sampling activities, percentile). The height of box is proportional to the spread
effort and results in this Atlas are presented in boxplots. of the values within the IQR. The whiskers represent values
The box-and-whisker plot, or boxplot, is commonly used in out of the IQR and their length is proportional to the spread
statistics. They represent datasets using ranked vales to of such values within a minimum and the 25 percentile
generate a five-number summary: minimum, first quantile, (lower whisker) and the 75 percentile and a maximum
median, third quantile and maximum (Figure 8). The (higher whisker). There is no standard definition for the
five-number summary makes presenting, interpreting and minimum and maximum. For example, Massart et al. (2005)
comparing datasets easy and straightforward, especially calculate the minimum as the lower quantile – (1.5 * IQR)
when comparing distributions between many groups of and the maximum as the upper quantile + (1.5 * IQR),
data. Boxplots are more compact than histograms and Cleveland (1985) defines them as the 10th (minimum) and
density plots – they are still highly effective at visually 90th percentile (maximum), and McGill et al. (1978) uses the
conveying information on the symmetry (skewness) and actual minimum and maximum values of the whole dataset.
extreme values (outliers) of the data. The latter is the approach used throughout this Atlas to
The “split box” in the plot is referred to as the Interquartile define these values.
range (IQR) and represents the middle 50 percent of the
Figure 8: The anatomy of a bloxplot
Atlas of Biosecurity Surveillance 92. Surveillance Programmes
2.1 Biosecurity New Zealand Exotic Pest • to support the fulfilment of New Zealand’s international
reporting obligations.
and Disease Hotline (0800 80 99 66) –
Start: 1998
general surveillance
Methodology: Reporting of suspected emerging or exotic
Target organism/s diseases is a responsibility of all New Zealanders under the
Biosecurity Act 1993. All calls to the Exotic Pest and
All exotic and emerging organisms and diseases across all
Disease Hotline (staffed 24 hours a day) are triaged by
environments (land, freshwater and marine) in New
trained call centre staff and passed onto the appropriate
Zealand, including wildlife and native flora, production and
investigation team at Biosecurity New Zealand: Animal
customary crops, and farmed and domestic animals.
Health, Plant Health or Aquatics and Environment Health
(Figure 9). In addition, low-risk notifications regarding plant
Potential impacts health are first passed onto Biosecurity New Zealand’s
The potential impacts of exotic and emerging organisms Plant Health and Environment Laboratory to screen, with
and diseases on New Zealand’s human health and Māori, only suspicious notifications passed on to Investigators.
socio-economic and environmental values are species- Investigation teams include veterinarians, marine
specific and vary from minor and unnoticeable to biologists, ecologists, pathologists and epidemiologists, all
devastating and irreversible, including: trained in biosecurity investigations and exotic pest and
• international trade restrictions (even potentially a disease recognition. Investigators follow each report
complete ban) on New Zealand’s exports such as dairy, directly with the caller and, if warranted, an investigation
honey and forestry products; plan is developed. Investigation teams work closely with
• altered ecosystems and affected native fauna and flora; private veterinarians, private veterinary laboratories,
universities, research groups and other parts of Biosecurity
• socio-economic burdens associated with control and
New Zealand, including the Animal Health Laboratory
eradication programmes;
(Wallacevile) and the Plant Health and Environment
• restricted movement of animals, plants and their Laboratory (Auckland and Christchurch). Most notifications
products, affecting domestic markets; do not result in anything more than a detailed investigation
• degrading New Zealand’s image of a pristine and to rule out exotic or emerging diseases and to establish an
healthy tourism destination. endemic diagnosis, but occasionally a new organism or
disease is detected. Sometimes, such as when detected at
Introduction mechanisms the border, these detections can be eradicated immediately.
Potential routes of introduction for exotic organisms include At other times the detection will result in a biosecurity
natural introduction by wind and marine currents, illegal response.
importation of animals and plants or their products, Sampling: Sampling varies from case to case and ranges
inadvertent introduction via legal trade, and as hitchhikers from submission of organisms in the case of suspect new
on planes, vessels, or passengers and their belongings. pests to blood or tissue sampling of animals or post
There is also the potential for new mutations of existing mortem examinations. Strategies are adapted to each case
pathogens, which alter their virulence and epidemiology, to make the most robust assessment possible.
resulting in increased disease, reduced productivity or new
human health risks. Status
Surveillance programme Not applicable
Objectives: Incursions
• to facilitate the early detection of exotic or emerging
disease in New Zealand; In 2017 the Exotic Pest and Disease Hotline received 13,600
notifications, of which 2,800 were initially screened by the
• to support New Zealand’s statements of freedom from
Plant Health and Environment Laboratory and 1,700 were
specific pests or diseases;
immediately sent to Investigators. In total, 800 notifications
• to investigate to a point of diagnosis any cases of were investigated, resulting in 200 positive detections of
unusual disease that could possibly be new or which 11 led to a biosecurity response.
emerging;
10 Biosecurity New ZealandFigure 9: Exotic Pest and Disease Hotline notification process
Call centre
80 9 9
00
Stakeholders
08
66
-General public
Call triage
-Scientific community Pest and protocol
Reported
disease
-Biosecurity service provider hotline
-Central/local goverment
-Industry
-Human health Redirected
Notification Notified
followed up with
Biosecurity
the caller
investigators
If available and required, teams
specimen is free-posted Investigator works
to the labs closely with the
lab to identify
the sample or Animal Aquatic and
reach a diagnosis Health Environment
Health
Plant Health
Plant Health
Animal Health
Aquatic and Investigated
Environment Health
Laboratories Notification recorded in a
centralised system
Stood down Notification
Information Management
Redirected Administration
Atlas of Biosecurity Surveillance 11Figure 10: Number of notifications to incursion investigators per year by sector at risk, 2012–2017
Figure 11: Number of annual notifications and investigations by month between 2012–2017
300
Notifications
Investigations
250
Number of notifications/Investigations
200
150
100
50
0
Jan Feb Mar Apr May Jun Jul Aug Sep Oct Nov Dec
Month
12 Biosecurity New ZealandFigure 12: Total number of notifications and investigations by sector and region between 2012–2017
Notifications Investigations Notifications Investigations
Animals Environment
Total number
0–1
2–25
25–50
51–75
76–100
101–150
151–250
251–500
501–750
751–1000
1001–1500
Notifications Investigations Notifications Investigations
Aquatic & Marine Plants
Atlas of Biosecurity Surveillance 13Figure 13: Total number of notifications and investigations by region between 2012–2017
Notifications Investigations
2012
2013
2014
2015
Total number
0–1
2–25
26–50
51–75
76–100
101–150
2016 151–250
251–500
501–750
2017
14 Biosecurity New Zealand2.2 Animal health information 2. Demonstration and oversight of veterinary laboratory
network:
Target organism/s a. MPI maintains contracts with the private veterinary
diagnostic labs with specific requirements related to
No specific organism is targeted but scanning surveillance biological containment and quality control within the
techniques are used to watch for organisms of interest and laboratory.
to monitor and measure submissions to veterinary b. MPI stipulates criteria for notification of suspected
diagnostic laboratories. exotic or emerging organisms via the Exotic Pest and
Disease hotline.
Potential impacts c. MPI carrieds out regular audits to ensure compliance
Potential impacts range from the very minor to extremely with the requirements.
severe, depending on the organisms. Organism/s of high
interest to the surveillance programme could have dramatic Status
economic or human health impacts if they became Not applicable
established in New Zealand. For example, Coxiella burnetii,
the causative agent of Q fever, would have a significant Incursions
human health impact.
There are several notifications from veterinary diagnostic
Introduction mechanisms laboratories each month to the Exotic Pest and Disease
Commonly recognised introduction mechanisms for exotic Hotline as a direct result of veterinary practitioner
organisms include carrier animals, international travel by submissions. Most of these do not result in anything more
humans and winds. Sometimes an arthropod1 vector2 is also than a detailed investigation, but occasionally a new
involved. In addition, there is the potential for new organism or disease is detected, such as Theileria
mutations of existing pathogens, which alter the orientalis (Ikeda) in 2012.
epidemiology and can result in increased wastage, reduced
productivity or new zoonotic3 risks.
Surveillance programme
Objectives:
• to provide early detection of exotic or emerging diseases
to facilitate containment and eradication;
• to provide assurance of country freedom from specified
diseases;
• to describe distribution and occurrence of endemic
diseases;
• to demonstrate and quantify the veterinary
infrastructure and submission patterns.
Start: Evolved from original government veterinary
diagnostic services provided many decades ago.
Methodology: The programme has two main components:
1. Submission of animal health data:
a. Veterinary practitioners submit samples to veterinary
diagnostic laboratories as part of disease investigations
for their clients’ animals. The investigating veterinarian
requests the tests. Where a case meets specific MPI
criteria the veterinary diagnostic laboratory provides
MPI with anonymised case data. This data is then
loaded into the MPI Surveillance Information
Management System database where it can be
retrieved, analysed and published as needed (Map 2).
b. Samples are collected across all species and across the
entire country.
c. In 2017 approximately 28,000 case records were
submitted to MPI.
1 Invertebrates that have a segmented body, jointed limbs and an exoskeleton.
2 Organisms that carry and transmit a disease from one host to another.
3 Refers to diseases that can be transferred between animals and people.
Atlas of Biosecurity Surveillance 15Map 2: Animal health information 2017 – sheep, cattle, deer and pig submissions 2016
Sheep Cattle
Northland Northland
Northland
Auckland Auckland
Auckland
Bay of Plenty
Waikato
Dairy
Gisborne
Bay of Plenty Taranaki
Bay of Plenty
Hawke's Bay
Waikato Manawatu-Wanganui
Waikato
Gisborne Gisborne
Wellington
Tasman
Marlborough
Taranaki West Coast
Taranaki
Hawke's Bay Hawke's Bay
Canterbury
Manawatu-Wanganui Manawatu-Wanganui
Otago
Southland
Wellington Wellington
Tasman Tasman
Marlborough Marlborough
West Coast Northland
West Coast Northland
Auckland Auckland
Bay of Plenty Bay of Plenty
Waikato Waikato
Beef
Gisborne Gisborne
Canterbury Canterbury
Taranaki Taranaki
Hawke's Bay Hawke's Bay
Manawatu-Wanganui
Manawatu-Wanganui
Wellington
Wellington
Tasman
Tasman
Marlborough
Marlborough
West Coast
West Coast
Otago Otago
Canterbury
Canterbury
Southland Southland
Otago
Otago
Southland
Southland
Percentage of
submissions
Lowest
Deer Total number Pigs
of animals
Northland Northland
Lowest
Highest
Auckland Auckland
Highest
Bay of Plenty Bay of Plenty
Waikato Waikato
Gisborne Gisborne
Taranaki Taranaki
Hawke's Bay Hawke's Bay
Manawatu-Wanganui Manawatu-Wanganui
Wellington Wellington
Tasman Tasman
Marlborough Marlborough
Northland Northland
West Coast West Coast
Auckland Auckland
Bay of Plenty Bay of Plenty
Waikato Waikato
Gisborne Gisborne
Canterbury Taranaki
Hawke's Bay Canterbury Taranaki
Hawke's Bay
Manawatu-Wanganui Manawatu-Wanganui
Wellington Wellington
Tasman Tasman
Marlborough Marlborough
West Coast West Coast
Otago Otago
Canterbury Canterbury
Southland Southland
Otago Otago
Southland Southland
Data sources: MPI Surveillance Information Management System database (Animal submissions); Agriculture Census data Stats ZN 2013 (Total number of animals).
16 Biosecurity New ZealandFigure 14: Animal health information – monthly and yearly total submissions of cattle, sheep, pigs
and deer, 2010–2017
Atlas of Biosecurity Surveillance 172.3 Detection of Theileria orientalis the early 1980s, however, this strain does not commonly
cause disease.
(Ikeda) in New Zealand
Theileria orientalis is transmitted by the cattle tick,
In September 2012 a new-to-New Zealand organism,
Haemaphysalis longicornis, (Figure 16) which was already
Theileria orientalis (Ikeda), was notified to MPI by a
established in New Zealand. Movements of infected cattle
veterinary pathologist via the Exotic Pest and Disease
can also spread the disease, however the tick is required to
hotline. The pathologist had detected the organism in blood
be present to infect other cattle. The known distribution of
smears of anaemic cattle from a Northland dairy herd that
this tick in New Zealand are in regions with warmer
was experiencing high mortalities. This organism was
climate, mainly in the North Island, the top of the South
subsequently detected on a number of farms in Northland
Island and Canterbury (Figure 17). The disease is therefore
in late 2012 and in Waikato in 2013.
only expected to be found in these regions. However
Theileria orientalis (Ikeda) is a blood-borne parasite in suitable habitat for this tick may increase in the future with
cattle. It causes anaemia by infecting and destroying red climate change, and thus may cause further spread of
blood cells (Figure 15). The signs of the disease are Theileria orientalis.
therefore due to anaemia, and include lethargy, pale
mucous membranes, increased heart rate and respiratory
rate, and sometimes death. It does not infect humans and is
treatable. Other Theileria species exist worldwide with the
Theileria orientalis (Ikeda) strain affecting Pacific rim
countries (Figure 18). New Zealand has also had another
strain of this species, Theileria orientalis (Chitose), since
Figure 15: Theileria-infected red blood cells in an Figure 17: Distribution of the cattle tick
affected cow (Haemaphysalis longicornis) in New Zealand as at
2016 (Heath, 2016)
Figure 16: Cattle tick (Haemaphysalis longicornis)
2mm
Image: Qing-Hai Fan, MPI
18 Biosecurity New ZealandFigure 18: Figurative distribution of Theileria species worldwide (does not depict exact distribution)
Reproduced from DairyNZ Technical Series, February 2014.
Atlas of Biosecurity Surveillance 192.4 Avian influenza surveillance Map 3: Avian influenza surveillance programme, 2017
programme Sampling sites
Target organism/s
All Type A avian influenza viruses with high-pathogenicity4
and low-pathogenicity avian influenza viruses of subtype H5
and H7, that are responsible for avian influenza (bird flu).
Potential impacts
High-pathogenicity avian influenza can cause serious
damage to multiple internal organs of infected birds,
leading to a mortality rate up to 90–100 percent in less than
48 hours. Although the risk from avian influenza to most
people is low, since 1997 cases of human infection with
high-pathogenicity avian influenza have been reported
overseas (Map 4). The presence of high-pathogenicity avian
influenza in New Zealand could:
• have a devastating effect on the domestic market for
poultry and poultry products;
• lead to international trade restrictions on New Zealand’s
poultry and poultry products;
• negatively impact populations of domesticated birds and
wild birds, which is of particular concern for critically
endangered species;
• bring a socio-economic and ecological burden
associated with control and eradication programmes;
• have a health impact on the human population. Sampling: The programme samples healthy resident wild
mallard ducks mainly in mid-to-late summer. In addition,
Introduction mechanisms any reports to MPI’s Exotic Pest and Disease Hotline related
Avian influenza viruses could enter into New Zealand via to sick or dead wild and domestic birds are assessed by a
inadvertent importation via legal trade movements or the veterinarian and if required, the event is further investigated
illegal importation of risk items, for example, eggs, with birds tested for avian influenza (Figure 20). Sampling is
unprocessed poultry products, contaminated equipment, targeted principally to coastal areas where non-migratory
packaging, clothing and other commodities from infected waterfowl are likely to have had contact with migratory
areas (Map 5). There is also the potential for avian influenza shorebirds. Initially the programme also included migratory
viruses to be carried by migrating birds, whose interaction birds such as the bartailed godwit (Limosa lapponica) and
with local species could lead to spill-over infection. red (lesser) knot (Calidris canheutus), but this changed as
findings from surveillance from 2004 to 2010 indicated the
Surveillance programme risk of introduction of avian influenza to New Zealand by
migratory birds was very low.
Objectives:
• to provide early detection of avian influenza for
Status
containment and eradication;
• to provide assurance of country freedom from high- New Zealand is considered free from highly pathogenic
pathogenicity avian influenza viruses; avian influenza (high-pathogenicity avian influenza viruses).
• to provide assurance of country freedom from other
Incursions
avian influenza viruses;
• to monitor endemic avian influenza viruses. New Zealand has never had a case of high-pathogenicity
avian influenza, but low-pathogenicity avian influenza
Start: 2004 (Previously, surveillance had been conducted viruses have been detected in wild mallard ducks. Cases of
since 1975). low-pathogenic avian influenza subtypes H5 have been
detected in the North Island and subtypes H7 in the South
Methodology: Throat5 and cloacal6 swabs are taken from
Island (Map 3).
healthy resident mallard ducks Anas platyrhynchos and
tested for avian influenza virus. Positive or suspected
positive samples are then tested for H5 and H7 subtypes.
20 Biosecurity New ZealandFigure 19: Active surveillance for avian influenza viruses in wild birds, 2010-2017
2010 2011 2012
2013 2014 2015
Number of birds
sampled
1–50
50–100
2016 2017 100–150
150–200
200–250
250–300
300–350
350–400
Atlas of Biosecurity Surveillance 21Figure 20: Monthly avian mortality reports, 2010–2017
10
9
8
7
Avian Mortality Reports (2010–2017)
6
5
4
3
2
1
0
Jan Feb Mar Apr May Jun Jul Aug Sep Oct Nov Dec
Month
2.5 Avian influenza Birds infected with low-pathogenicity avian influenza virus
strains may not develop clinical disease, and show only mild
Avian influenza, which is caused by Influenza A, is a viral symptoms or no symptoms at all (Swayne and Suarez 2000,
disease that can infect domestic poultry (chickens, turkeys Swayne et al. 2003, Peng et al 2013). Low pathogenicity
and ducks) and wild birds such as waterfowl, gulls and avian influenza viruses often occur naturally in wild birds,
shorebirds (CIDRA 2013). Avian Influenza viruses are divided particularly waterfowl, without causing illness. In contrast,
into H type and N type based on the configuration of their high-pathogenicity avian influenza virus strains are highly
haemagglutinin (HA) and neuraminidase (NA) proteins. infectious, commonly lethal to domestic poultry, and can
These H and N types are at the same time classified as spread rapidly between flocks. High-pathogenicity avian
low-pathogenicity or high-pathogenicity viruses mainly influenza virus has been recorded in most continents (Map 5).
based on their ability to cause disease and mortality in
chickens under laboratory conditions. For example, the Avian influenza is transmitted mainly through direct contact
epizootic bird flu that started in Southeast Asia in late 2003 with infected birds via saliva, nasal secretions and faeces
was caused by a high-pathogenicity H5N1 strain: a highly (CIDRAP 2013). Birds can also become infected through
pathogenic avian influenza virus subtype that has an HA5 contact with contaminated objects such as feed, water,
protein (H5) and an NA1 protein (N1) (Martin et al. 2006). equipment and clothing. Faecal contamination of drinking
This outbreak affected not only domestic and wild birds but water as well as houseflies (Wanaratama et al. 2013) and
also humans. Since then, more than 10 countries have blowflies (Sawabe et al. 2006) have also been linked to the
reported human H5N1 influenza cases (Map 4). transmission of avian influenza.
22 Biosecurity New ZealandMap 4: Countries with confirmed human cases of avian influenza A (H5N1) between 2003–2019
Number of
reported cases
1 – 60
61 – 120
121 – 180
181 – 240
241 – 300
301 – 361
Data source: www.who.int/influenza/human_animal_interface/H5N1_cumulative_table_archives/en/ (visited 3 March 2019)
Map 5: 23 countries that have reported high-pathogenicity avian influenza subtype H5N1 in poultry to the OIE
between 2013–2017
Europa
North
Asia America
Africa
South America
Australia
New Zealand
Avian influenza subtype H5N1 reported
Data source: www.oie.int/animal-health-in-the-world/update-on-avian-influenza/ (visited 21 Nov 2017)
Atlas of Biosecurity Surveillance 232.6 Arbovirus surveillance programme Map 6: Arbovirus surveillance programme, 2018
Target organism/s Herd Sampling
Light trap
The programme targets the following diseases through a
combination of blood sampling and trapping for the
Culicoides biting midge:
• bluetongue virus;
• epizootic haemorrhagic disease;
• Akabane disease;
• bovine ephemeral fever.
The Culicoides genus is not present in New Zealand.
Potential impacts
By causing significant health problems (for example,
illnesses of the central nervous system and haemorrhagic
fevers) in cattle, sheep, goats and deer, the incursion of
these diseases into the country would:
• lead to international trade restrictions on New Zealand’s
animals and animal products;
• impact the domestic market for animals and animal
products;
• impose a socioeconomic burden associated with control
and eradication programmes.
Introduction mechanisms
These diseases are transmitted by arthropods, for example
Sampling: Blood testing is conducted after the possible
midges of the Culicoides genus. Although regarded as a
period of virus transmission from onset of arrival and
very low-probability event, there is a risk that infected
establishment of Culicoides. Trapping is undertaken in all
midges could arrive in New Zealand from Australia via wind
sites from February to April each year, as environmental
currents, the main form of dispersal for these species.
conditions during this period are most favourable for
survival of midges.
Surveillance programme
Objectives: Status
• to provide early warning of selected arboviruses to
New Zealand is considered free from these selected
facilitate eradication;
arboviruses and their vectors.
• to provide assurance of country freedom from selected
arboviruses.
Incursions
There have been no detections of the selected arboviruses
Start: 1991
or the genus Culicoides in the country.
Methodology: 640 blood samples are taken from 32 farms
from four districts (Northland, Auckland, Waikato and Bay
of Plenty) that are considered suitable for Culicoides
species for survival and establishment (Maps 6 and 7).
Light trapping of Culicoides is undertaken at 12 cattle farms
in areas where Culicoides species are likely to arrive via
wind currents from Australia. The traps use green light-
emitting diodes to attract Culicoides (Figure 21). These
traps were introduced in 2012 to replace the incandescent
white light traps previously used because of the
demonstrated greater trapping efficiency of green light
traps (Bishop et al., 2004 and 2006).
24 Biosecurity New ZealandMap 7: Arbovirus herd testing and light trapping surveillance programme, 2008–2018
Top of North Island
Figure 21: Traps for Culicoides midges
Traps used in the surveillance programme attract midges with light
emitting diodes, luring them close to the sheltered part of the trap where
an air current from a battery fan vacuums them into a collection pot with
ethanol. The arbovirus surveillance programme places light traps close
to cattle whose dung offers suitable habitat for the development of
immature stages of Culicoides. Light traps are not used during full moon
weeks as the increased luminosity is likely to reduce their effectiveness
(Bowden and Church 1973). The programme initially used white-light
traps but in 2012 changed to green-light traps because of their
demonstrated greater trapping efficiency (Bishop et al. 2004 and 2006).
Atlas of Biosecurity Surveillance 25Figure 22: Arbovirus surveillance light trapping programme, 2010–2018
550 000
White light
500 000 Green light
Total number of insects trapped and screened by the programme
450 000
400 000
350 000
300 000
250 000
200 000 Green light traps
are introduced
150 000
100 000
50 000
2008–2009 2009–2010 2010–2011 2011–2012 2012–2013 2013–2014 2014–2015 2015–2016 2016–2017 2017–2018
10 traps 12 traps
Trapping period / Number of traps
The programme has detected native midges (Ceratopogonidae) in all trapping seasons, which suggests the traps would
catch Culicoides sp. if present in the area. In 2012, white light traps were replaced with green light traps because of
their greater trapping efficiency.
2.7 Biting midges are not sandflies sandflies are small, so would look the same to the naked
eye. The wing pattern is commonly used to differentiate
Biting midges, including Culicoides species, are sometimes taxonomic groups even at the species level (Figure 23). The
incorrectly referred to as sandflies. They are both insects genus Culicoides has never been present in New Zealand.
but belong to different biological groups. New Zealand has
13 species of sandflies and only two of them bite: the
New Zealand blackfly (Austrosimulium australense) and the
West Coast blackfly (A. ungulatum). Biting midges and
Figure 23: Biting midge (Culicoides brevitarsis) vs. Sandfly (Austrosimulium australense)
1–3 mm 2–3 mm
Culicoides brevitarsis Austrosimulium australense
© lines2logos
26 Biosecurity New Zealand2.8 Culicoides life cycle and arbovirus then adults. Male midges do not bite and feed only on
nectar (Mellor et al. 2000).
transmission
Female midges can uptake the virus during a blood-meal
Most Culicoides species undergo anautogenous
when feeding from an infected host. The virus initially
development, characterised by female midges requiring to
infects and replicates in the epithelial cells of the midgut
take a bloodmeal after mating to ensure the fertilised eggs
before spreading into other organisms via haemolymph
have access to nutrients (Figure 24). Once eggs mature, the
(Venter 2018). Once the virus is present in the salivary
female lay them in suitable habitat – cattle dung in the case
glands, the female is capable of transmitting it to a
of C. brevitarsis (Kelso and Milne 2014) – where they go
susceptible host during a blood-meal.
through four larval stages before turning into pupae and
Figure 24: Life cycle and arbovirus transmission
Virus
Blood
gut wall gut diverticulim
(one cell thick)
salivary glands
salivary glands duct
proboscis
midgut
epithelial
cells rectum
Host’s skin
Blood capillary
Susceptible Infective
host host ADULT
FEMALE
Mating – usually during flight
ADULTS Blood feeding – only females
respiratory Egg maturation – inside ovaries
organ Oviposition – several hundreds
eye
palp
maxilary calpus
wing
proboscis
foreleg 1–3 mm
midleg
hindleg EGGS
sensilla
PUPAE LARVAE
I Stage
II Stage
1 mm
III Stage
IV Stage
Adapted from Purse et al. 2005, Venter 2018, Russel et al. 2013 and www.butox-info.com/ectoparasites/lifecycle-culicoides.asp, modified
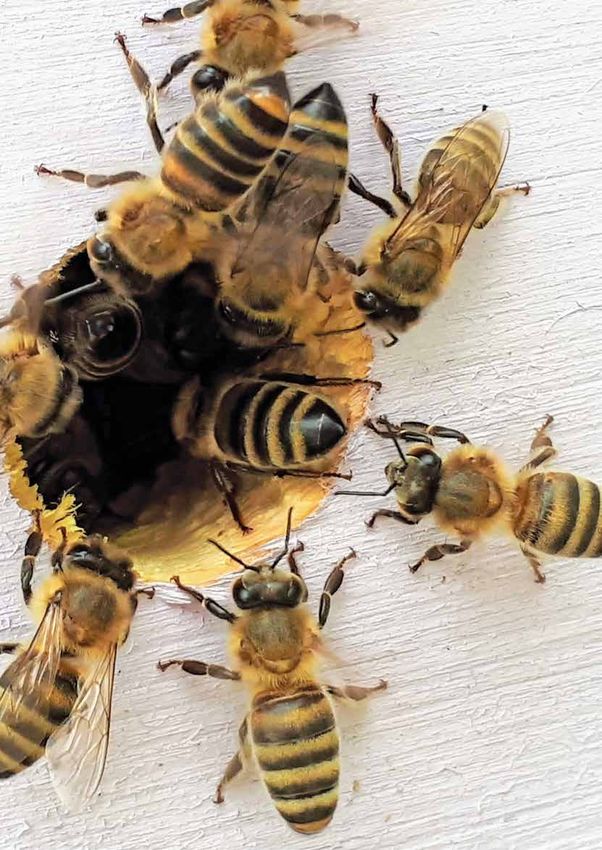
Atlas of Biosecurity Surveillance 272.9 National apiculture surveillance Map 8: National apiculture surveillance programme, 2018
programme Sampling site
Target organism/s
All honey bee diseases, pests and undesirable genetic
strains non-indigenous to New Zealand, but in particular:
• external mites (Tropilaelaps spp. and Euvarroa spp.);
• tracheal mite (Acarapis woodi);
• small hive beetle (Aethina tumida);
• European foulbrood (Melissococcus plutonius);
• parasitic fly (Braula coeca);
• Asian honey bee (Apis cerana);
• Africanised honey bee (Apis mellifera scutsellata);
• Cape honey bee (Apis mellifera capensis).
Potential impacts
The introduction and spread of any of these pests or
diseases is likely to affect honey production and severely
reduce the number of bees in managed hives and wild
colonies, which could:
• affect pollination of commercial crops, pasture legumes
and native flora;
• lead to international trade restrictions for
New Zealand’s honey and bee products;
• impact the internal market of honey and bee products; samples of bees from up to 25 of their apiaries. The total
• bring a socioeconomic and ecological burden associated number of exporting apiaries and export events are then
with control and eradication programmes. determining factors in the number of samples received and
processed by the programme (Figures 26 and 27). Samples
Introduction mechanisms are tested for external and internal mites.
Introduction mechanisms are species-specific but often Sampling: Beehive inspection and collection of samples for
associated with apiculture products and equipment laboratory examination are conducted between February
(including honey) and the transport of plant products or and May. Opportunistic sampling can occur at any time
inanimate objects such as machinery, personal effects, through the year.
used vehicles and shipping containers.
Status
Surveillance programme
New Zealand is considered free from all notifiable bee pest
Objectives: and diseases except American foulbrood (AFB) and the mite
• to provide early detection of apiary-related pest and Varroa destructor which are both classified as controlled.
diseases for containment and eradication;
• to provide assurance of country freedom of notifiable Incursions
bee diseases such as European foulbrood;
The only two high-profile introductions in New Zealand are
• to promote biosecurity awareness and education within AFB, first detected in 1877, and the Varroa mite, first
commercial and recreational beekeepers. detected in Auckland in April 2000. The presence of these
Start: Evolved since the detection of American foulbrood organisms has significantly changed apiculture practices in
in 1877. the country. The industry previously promoted itself as
Methodology: Every year warranted inspectors survey a relying mainly on natural products. New Zealand apiculture
minimum of 350 apiaries randomly selected from 19 areas had to accept the use of chemical products as the only
considered high risk because of their proximity to ports, effective method to control the Varroa mite. The use of
Transitional Facilities, urban areas, tourist destinations and antibiotics to control AFB and other endemic diseases is
areas of high hive concentration (Maps 8-12). High-risk still prohibited.
areas include commercial and recreational apiaries. All the The spore-forming parasite Nosema apis has been also
hives of the selected apiaries are visually inspected and considered established in New Zealand since 2010 when an
adult bees tested for external mites using miticide strips. investigation found it in apiaries from Coromandel and
Opportunistic testing is also conducted from consignments northern Bay of Plenty. This parasite is of concern to
of live bees from apiaries sourcing live bees for exports. beekeepers because it can kill colonies in winter and
Bee keepers wanting to export bees are required to provide spring, but it is not a notifiable disease.
28 Biosecurity New ZealandMap 9: National apiculture surveillance programme – Auckland and Hamilton, 2016–2018
Auckland Hamilton
Apiaries
sampled
Year
2016
2017
5 2018 2
Km Km
Map 10: National apiculture surveillance programme – Wellington, Hastings and Napier, 2016–2018
Wellington Hastings and Napier
Apiaries
sampled
Year
2016
2017
5 2018 2
Km Km
Atlas of Biosecurity Surveillance 29Map 11: National apiculture surveillance programme – Nelson, Picton and Blenheim, 2016–2018
Nelson Apiaries Picton and Blenheim
sampled
Year
2016
2017
2018
5 5
Km Km
Map 12: National apiculture surveillance programme – Christchurch and Dunedin, 2016–2018
Christchurch Dunedin
Apiaries
sampled
Year
2016
2017
10
Km
2018 10
Km
30 Biosecurity New ZealandFigure 25: Exports of live bees and number of exporting apiaries supplying sampling bees, 2010–2017
40 000 800
1 kg packages
Queen bees
35 000 700
Samples (exporting apiaries)
30 000 600
Number of queen bees or packages exported
Total number of apiaries sampled
25 000 500
20 000 400
15 000 300
10 000 200
5 000 100
0
2010 2011 2012 2013 2014 2015 2016 2017
Year
The total number of exporting apiaries and export events are detetermining factors in the number of samples received and processed
by the programme. Samples are tested for external and internal mites. 1kg package = 1kg of bees.
Figure 26: Number of suspected samples taken by the programme, 2010–2018
External parasites Internal parasites European foulbrood Small hive beetle Exotic bee species
20
18
16
14
Number of samples collected
12
10
8
6
4
2
0
2009-2010 2010-2011 2011-2012 2012-2013 2013-2014 2014-2015 2015-2016 2016-2017 2017-2018
Surveillance season
Atlas of Biosecurity Surveillance 312.10 Small hive beetle (Aethina timida) months of life (Cuthbertson et al., 2008). The development
and length depends mainly on humidity, temperature and
Small hive beetle (SHB), Aethina tumida, is a well-known food availability (De Guzman et al 2009). The actual risk and
invasive pest of beehives. Adults of this pest lay eggs in impact on the survival of the affected colony is highly
hives, where emerging larvae feed on honey comb, bee dependent on the number of larvae present. Surveillance for
eggs, brood, honey and pollen (Figure 27). Larvae also SHB is particularly important as it might take a few years
defecate throughout the comb, releasing the yeast for the impacts of the pest to become obvious in the industry
Kodamaea ohmeri that contaminates the honey. Under and before this time, the pest could establish in multiple
suitable conditions A. tumida can produce five generations places.
per year, with females producing about 1,000 eggs in 4-6
Figure 27: Life cycle of small hive beetle Aethina timida
9–11 mm
3–10 days
1.5 mm
1–3 days
Adults emerging
from the soil infest
colonies. Females
lay eggs within
capped brood cells Post-feeding or wan-
After pupation,
or in the small dering larvae leave
adults leave the
cracks and crevices the food sources for
soil and become
around the hive pupation burrowed
sexually mature
5–20 cm into the soil
between the next
1–7 days
5–7 mm
13–25 days
3–4.5 mm
13–25 days
Adapted from Sheridan et al 2019 with information from Neumann et al 2016 and Cuthbertson et al 2013)
Originally from South Africa, the SHB has spread across the world and is now present in the United States, Canada, Mexico, Jamaica, Australia
and Italy (CABI 2018) (Figure 28). It has also been reported in other countries such as Portugal, Egypt, El Salvador, Nicaragua and the Philippines
(Neuman et al. 2016). The SHB has never been detected in New Zealand.
32 Biosecurity New ZealandFigure 28: Global distribution of small hive beetle Aethina timida
Present
Data source: CABI, 2019. Aethina tumida. In: Invasive Species Compendium. Wallingford, UK: CAB International, https://www.cabi.org/isc/datasheet/3459#toDistributionMaps.
Licensed under a Creative Commons Attribution-NonCommercial-NoDerivs 2.0 UK: England & Wales Licence.
Atlas of Biosecurity Surveillance 332.11 Fruit fly surveillance programme Map 13: Fruit fly surveillance programme, 2018
Target organism/s Trap
Economically important fruit flies of the family Tephritidae
such as:
• Queensland fruit fly (Bactrocera tryoni) (Map 19);
• Oriental fruit fly (Bactrocera dorsalis);
• Mediterranean fruit fly (Ceratitis capitata) (Map 18);
• melon fly (Bactrocera cucumis).
Potential impacts
Collectively, fruit flies are considered the world’s worst fruit
crop pests by laying eggs in ripening and ripe fruit and
vegetables. Their larvae then damage the pulp of fruit and
vegetables, leaving them inedible and unmarketable. The
presence of economically important fruit flies in
New Zealand could therefore:
• damage commercial and home crops;
• generate trade restrictions on horticulture exports;
• affect native flora;
• impose an economic and ecological burden associated
with control and eradication programmes.
Introduction mechanisms
Fruit flies could enter New Zealand as eggs or maggots in The methyl eugenol lure has a pulling capacity of
fruit and vegetables imported commercially or brought in by approximately 600 metres. In contrast, the pulling capacity
travellers from overseas. of Cuelure and Trimedlure is approximately 200 metres
(Map 14).
Surveillance programme
Sampling: October to July annually. This programme
Objectives: deploys about 7,800 traps throughout the country. Methyl
• to provide early detection of fruit fly incursions to eugenol traps are spaced 1,200 metres apart, while
facilitate eradication; Cuelure and Trimedlure traps are spaced 400 metres
• to provide assurance of country freedom from apart. All traps are placed at the same site where
economically important fruit flies. alignment and host availability allows, but are at least 3
metres apart from any other pheromone trap to prevent
Start: mid 1970s cross contamination.
Methodology: Pheromone-lure traps are placed in potential Status
host trees and arranged in a specific pattern to cover areas
identified as likely points of entry and detection because of New Zealand is considered free from economically
their vicinity to international sea/air ports, presence of host important fruit flies.
material, habitat suitability (in particular temperature),
population, and first night of stay (Maps 13–16). The Incursions
effective range of action of a fruit fly trap is determined by There have been ten incursions in Auckland and Northland
the pulling capacity of its lure. The surveillance programme between 1996 and 2019 (Map 17). Only two of these
uses three main lures: incidents (Mediterranean fruit fly and Queensland fruit fly,
• methyl eugenol to attract Oriental fruit fly and other found in Auckland in 1996 and 2015, respectively) detected
lure-responsive oriental fruit flies;. a breeding population, which triggered an eradication
• Cuelure to attract Queensland fruit fly and other programme using intensified trapping, fruit collection and
lure-responsive tropical fruit flies; monitoring, and a bait spraying programme. These actions
• Trimedlure to attract Mediterranean fruit fly. were also used for the Queensland fruit fly incursion of
2019 in Northcote as a precautionary measure due to a
number of adult males detected. This response is ongoing
at the time of publication.
34 Biosecurity New ZealandYou can also read