Economic Impacts of Advanced Air Mobility - AAM White Paper Series Part II November 13, 2020 - PNWER
←
→
Page content transcription
If your browser does not render page correctly, please read the page content below

Economic Impacts of Advanced Air Mobility
New Air Mobility Options Will Benefit Greater Vancouver, Creating Jobs and Energizing GDP Growth

AAM White Paper Series Part II
November 13, 2020

                                                                                                   1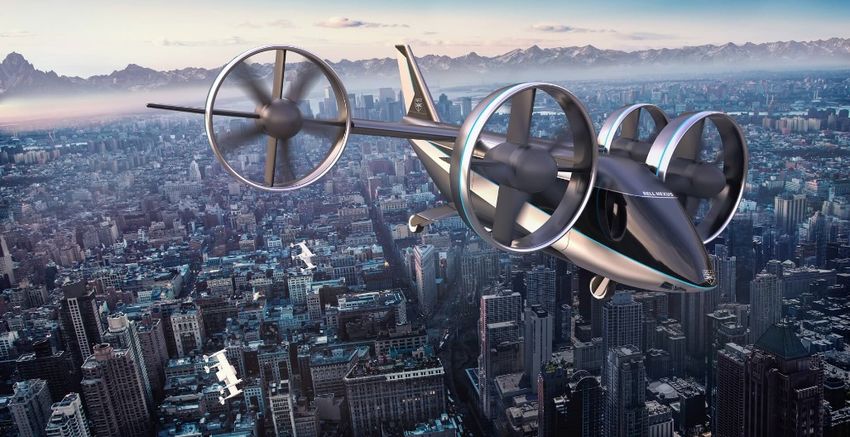
2
Vision of Canadian Advanced Air Mobility (CAAM)
CAAM intends to facilitate development of airspace above Canada’s cities and exurban areas, delivering
advanced mobility options and benefits to society, especially residents, businesses, disadvantaged and
remote communities, Indigenous peoples, and emergency responders. The VISION for Advanced Air
Mobility will be to deliver equitable, inclusive, resilient, intermodal, and accessible elements with Zero
Emission Aircraft. A centralized strategy is planned, nationally and regionally, with the inclusion of
stakeholders across government, industry, academia, and the investment community.

About This Paper
This paper is about the economic benefits derived for Greater Vancouver and British Columbia from new
mobility options, making use of the underutilized airspace above metropolitan areas. How will residents
benefit through creation of jobs and increased economic prosperity? How will local governments benefit
from increased tax revenue? What will the expected “ripple effect” of increased economic activity be?

Authorship
Several companies and individuals are responsible for the research and preparation of this document.
Researched and prepared by NEXA Advisors LLC, the team included transportation economists and
experts in aerospace transportation systems, supported by Crown Consulting Inc. Thanks go to authors
Eleanor Herman, Phillip Dyment, Chase Leeby, Benjamin Merran, and Thomas Edwards.

Acknowledgement of Statistics Canada Team
The authors relied heavily on analytical tools and expertise provided by Statistics Canada. The Canadian
System of Macroeconomic Accounts, made use of here, provides a conceptually integrated statistical
framework for studying the state and behavior of the Canadian economy, coast to coast and by
province.

Sponsors
This paper was sponsored by the Canadian Advanced Air Mobility (CAAM) Consortium, a non-profit
effort bringing together partners across government, academia, industry, and local communities, to lay
the foundation for Advanced Air Mobility in Canada, seeking to maximize public benefits for all.

Deep Appreciation
We express our deep appreciation to Teara Fraser, Owner and Lead Executive Officer of Iskwew Air;
Duncan Kennedy, co-founder and managing director of Indigenext, and the dozen individuals they
brought together to discuss what Advanced Air Mobility will mean for Indigenous communities. We also
thank Jeff Ward, Founder and CEO of Animikii, for his insights into Indigenous technology.

Acknowledgement of Ancestral Territories
We respectfully acknowledge that this work is taking place on the unceded and traditional ancestral
territories of the Coast Salish Peoples of the Skwxwú7mesh (Squamish), xʷəәθkwəәy̓əәm (Musqueam),
kwikwəәƛ ə̓ әm (Kikwetlem), q̓ ic̓əәy̓ (Katzie), Kwantlen and Semyome (Semiahmoo) Nations.

NOTE ON CURRENCIES
All currency amounts in this paper are expressed in Canadian dollars.

ON THE COVER
AeroG LLC 10-12 Passenger “Air Metro” all-electric eVTOL Concept Vehicle (compliments of AeroG LLC).

                                                                                                         3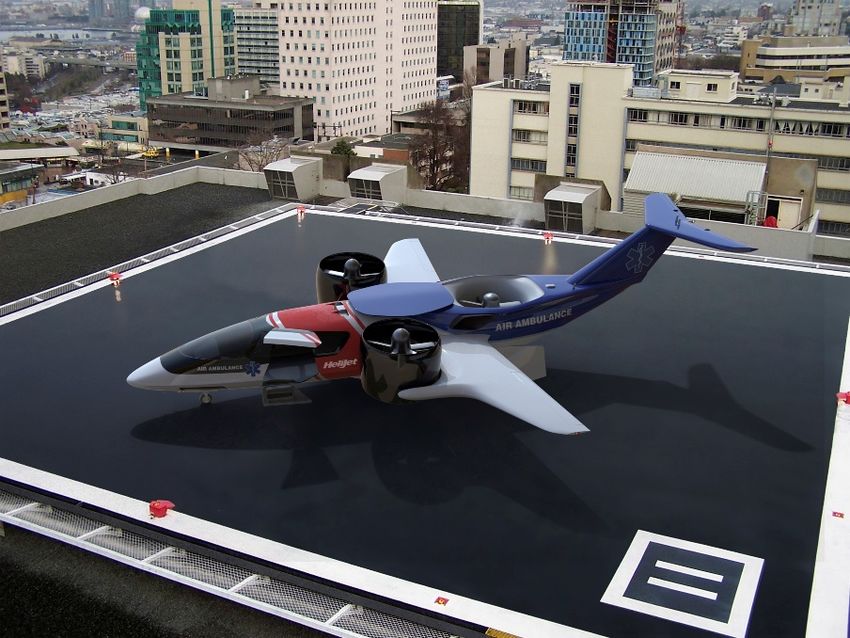
Estimated AAM Passenger Demand for Vancouver
Contents                                                                                 ............................................................................. 21

Executive Summary ................................................ 5                  Advanced Air Mobility Economic Outputs: Jobs and
                                                                                      GDP ...................................................................... 23
Introduction and Economic Impact Study
                                                                                         Economic Impact – Study Definitions and Methods
Methodology .......................................................... 8
                                                                                         Used..................................................................... 24
What is Advanced Air Mobility?............................ 10                            Economic Impact – GDP Growth ......................... 26
                                                                                         Economic Impact – Jobs ...................................... 26
   Greater Vancouver Advanced Air Mobility Use                                           Economic Impact – Tax Revenues ....................... 28
   Cases.................................................................... 10
   Small Unpiloted Aerial Systems (sUAS) Use Cases                                    Catalytic Economic Impacts .................................. 30
   ............................................................................. 11
                                                                                         Catalytic Impact 1 - Accelerated International
   AAM Challenges and Opportunities .................... 11
                                                                                         Trade Along the Cascadia Corridor ...................... 30
The Business of Advanced Air Mobility: Economic                                          Catalytic Impact 2 - Unique Benefits for
Inputs ................................................................... 15            Indigenous Peoples ............................................. 35
                                                                                         Catalytic Impact 3 - Boost for Academic Science
   Relevant Supply Chains ....................................... 15                     and Technology Programs ................................... 39
      Supply Chain #1: Provisioning Extensive AAM                                        Catalytic Impact 4 - Acceleration of B.C. Hydrogen
      Ground Infrastructure.....................................17                       Programs ............................................................. 43
      Supply Chain #2: RTM: Safely Managing AAM
      Air Traffic Flows ..............................................18              Conclusion ............................................................ 49
      Supply Chain #3: Advanced Air Mobility
      Operators ........................................................20
      Supply Chain #4: Advanced Air Mobility eVTOL
      Aircraft ............................................................21

                                                                                                                                                                      4
Executive Summary

Advanced Air Mobility—the use of smaller, quiet, fast and safe electric aircraft (Figure 1)—is coming to
Vancouver. Innovation-driven advances—such as lithium ion batteries, lightweight composites, electric-
                            motors, hydrogen fuel cells, intelligent systems to fly and manage these
   “We're focused very      vehicles, and other new technologies—are making possible revolutionary
   much on R and D
                            new electric vertical takeoff and landing (eVTOL) aircraft that will greatly
   (research and devel-
   opment) investment in
                            expand the mobility of people and goods not conveniently served by
   Canada. It's about       surface transportation. Analysis performed by companies such as Goldman
   good-quality jobs, it's  Sachs, Morgan Stanley 1 and NEXA Advisors/UAM Geomatics 2 forecast a
   about the long-term      $1.9 trillion market opportunity, with much of this business flowing into
   success of the company
                            the metropolitan areas eager to adopt this new mobility option.
      and the sector ... We
      want a strong, vibrant
                            While a dozen cities around the world—Seoul, Munich, Los Angeles, and
      aerospace sector in
      Canada, and that is a Dubai, for instance—are the vanguard of AAM implementation, Vancouver
      priority for this     may well be the first in North America to embrace this new form of
      government.           aviation. The societal benefits that eVTOL aircraft bring to Vancouver will
                            be numerous and are outlined in some detail in Part 1 of this series, our
           The Honourable
          Navedeep Bains,   October 2020 White Paper: Advanced Air Mobility Comes to Vancouver:
    Minister of Innovation, Exciting New Mobility Options for Residents, Businesses, Indigenous
      Science and Industry, Peoples, and Emergency Responders. This paper, Part 2, focuses on the
    Government of Canada    economic benefits of AAM, and what it means for aviation and aerospace
                            jobs, new businesses, and economic vitality for Greater Vancouver, smaller
towns, and First Nation communities tied to the general region.

The Canadian Advanced Air
Mobility (CAAM) Consortium
commissioned this study to better
understand how AAM activities
will impact the Greater Vancouver
economy. NEXA has produced
“input-output” type economic
impact assessments (EIA) in the
past for both U.S. and Canadian
projects. However, the scope of
this EIA, requiring access to data
of national scale and spanning
dozens of interlinked industries,
broke norms. As referenced in      Figure 1 - Bell NEXUS five-passenger eVTOL, under development in Quebec.
Footnote 2, the business case for
AAM in Vancouver identified over $2 billion in direct spending over a twenty-year period. Working from
these figures—the “inputs”—to ascertain the economic results—the “outputs”—we collaborated with

1
    https://irei.com/news/morgan-stanley-flying-care-preparing-takeoff/
2
    Urban Air Mobility: Economics and Global Markets 2020-2040. www.nexa-uam.com

                                                                                                          5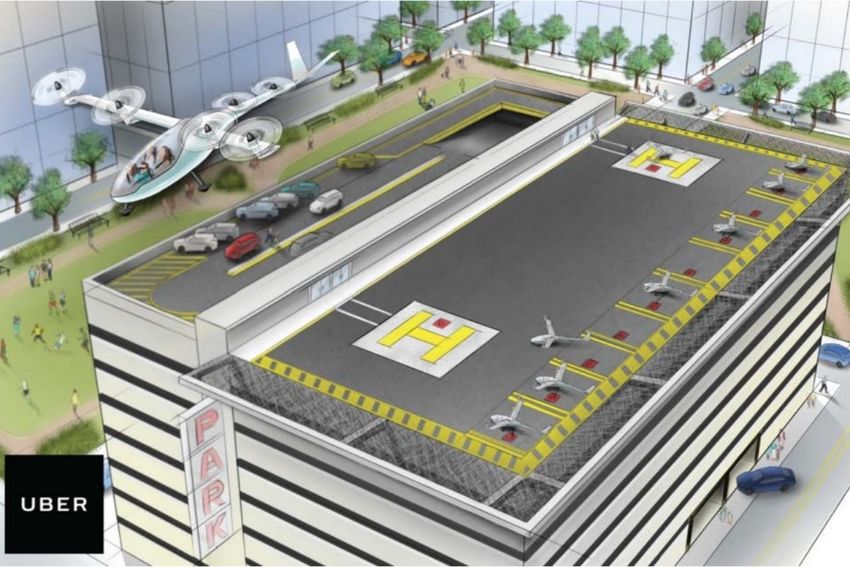
Statistics Canada, the federal agency tasked with producing data
to help better understand Canada, its population, resources, and
economy. Statistics Canada has created industry multipliers and
specialized models to derive accurate Canada-specific economic
projections for jobs, GDP, government revenues, and other
benefits. In this way, Statistics Canada was an invaluable partner in the production of this assessment.

This study gives the direct, indirect, and induced economic effects of AAM over the next twenty years.
Direct effects include the direct hiring of employees and revenue generation of sales. Indirect effects are
the benefits to the supply chain of a company or government agency. Induced effects are those
consumer expenditures resulting from direct and indirect effects.

The direct, indirect, and induced jobs and incremental GDP outputs are presented in Figure 2. A “Full-
time Equivalent” (FTE) job is a full-time job for one year. We found that, driven by 20-year spending for
Advanced Air Mobility services within its four most critical supply chains, the direct, indirect, and
induced benefits are significant:
                                                          Full-time                  Incremental Gross Domestic Product –
      Benefit Category (2021-2040)
                                                       Equivalent Jobs                       Basic Prices ($’000)
             Direct Benefits:                               9,188                                  $ 1,056,167
            Indirect Benefits:                              4,247                                   $ 556,463
            Induced Benefits:                               3,532                                   $ 555,782
                  Total                                    16,967                                  $ 2,168,411
Figure 2 - Economic impacts of AAM for Greater Vancouver including spill-over into other regions of Canada (2020-2040)

Today, according to industry records, British Columbia’s private aerospace sector employs over 9,000
full-time jobs. As shown in Figure 2, the new AAM-driven job estimates can improve this number
materially by 2040. These new jobs represent highly paid skilled, technical and, in some cases, scientific
labor categories. Over 2,000 permanent jobs are thus forecasted.

NEXA also examined four catalytic benefits—that is, those “spin-off” effects on                            “Pre-COVID-19, the air
other industries considered incremental to the quantified impacts of Figure 2. Our                         transport industry
findings are:                                                                                              generated a total of
                                                                                                           87.7 million jobs
    1. Indigenous community empowerment: Improved environmental,                                           globally through direct,
       economic, and social benefits.                                                                      indirect, induced and
                                                                                                           catalytic impacts.”
    2. Trans-Border Trade: Increased north-south trade along the Cascadia
       Corridor.                                                                                                             The Air
    3. University Research and STEM Education: Acceleration in STEM and                                     Transport Action Group,
       private funding driving increased educational opportunities.                                            Geneva, Switzerland,
                                                                                                                   September 2020
    4. Hydrogen Sector Acceleration: Quickened development and demand for
       alternative clean power sources, supporting B.C.’s new hydrogen sector.

In NEXA’s opinion, catalytic impacts could more than double the FTE forecast in Figure 2.

The AAM sector, an important new outgrowth of the world’s aerospace industry, can help transform the
Vancouver economy, spinning out thousands of new and high-paying jobs on the strength of billions of
dollars of incremental revenue activity. In turn, the ability of Vancouver to lead North America in this

                                                                                                                            6
sustainable arena will deliver first mover advantages—attracting investment and top talent—to benefit
local industries, the public, Indigenous communities, and public responders.

Over the initial two to three-year period, AAM is expected to generate some 320 permanent jobs for the
Greater Vancouver region. This gain will be directed from capital expenditures to plan, construct and
begin operating the new infrastructure to support commencement of AAM. A significant fact is that
                               private capital markets can be tapped through partnerships with public
                               and private sector stakeholders, with infrastructure investors (generally
   “Using the FTE              Canadian pension funds) committing to funding the requirements.
   projection of 16,967
   direct, indirect and
                               Additionally, regional helicopter operators will begin to invest in new
   induced jobs over the       eVTOL fleets, training pilots to operate the new vehicles for the benefit of
   forecast period, a          communities needing alternative forms of advanced air mobility.
   market growth
   accelerator of 11.4        Over time the FTE projection will lead to over 2,000 permanent jobs
   percent yields over        supporting this new sector for the Greater Vancouver region. These new
   2,000 permanent, full-     positions, involving specialized skills in aerospace engineering, advanced
   time jobs for the
   Vancouver region.”
                              technologies, power systems, pilots, air traffic controllers, and air
                              transport support to name a few, will be well-paying and highly prized job
         Michael Dyment,      opportunities.
        Managing Partner,
          NEXA Advisors,     Finally, the consortium formed to organize AAM’s launch throughout
        November 5, 2020     Greater Vancouver is already bound together by strong commitments to
                             ensure equal access to these new eVTOL mobility services. The region can
lead Canada through introduction of revolutionary new aviation technologies that will reduce
greenhouse gas emissions, improve transportation system efficiency, promote public health and safety,
create jobs and revenue, and improve equitable access to opportunities for all residents—particularly
low income groups, seniors, youth, people with disabilities, and other vulnerable population groups.

                                                                                                           7
Introduction and Economic Impact Study Methodology

At the heart of any healthy urban economy is a convenient, accessible, environmentally clean
transportation system that allows the improved mobility of people, goods, and services. Mobility
solutions take people to work, shopping, recreation, and other places that support the economy and
improve their quality of life. Several urban-related societal as well as infrastructure
factors are advancing the development of Advanced Air Mobility. One is the
increasing congestion of the world’s metropolitan areas driven by population              “B.C.’s aerospace sector
                                                                                          is the third largest in
growth and rural-to-urban migration. According to the United Nations, in 2018 some
                                                                                          Canada. It has more
55% of the world’s population lived in urban areas, a figure that is expected to          than 200 companies,
increase to 68% by 2050. The Vancouver metro area—hemmed in by water and                  generates a total of
mountains, and already built out—is forecast to grow from its 2016 base population        $2.4 billion in revenue
                                                                                          annually and directly
of 2,570,000 to 3,600,000 by the year 2050. Increased congestion strains
                                              3
                                                                                          employs nearly 9,000
emergency response resources, adversely impacts quality of life, and limits the           people.”
vitality of the local economy.
                                                                                                       British Columbia:
According to a 2015 CD Howe Institute study, the cost of lost efficiency and                Innovative, Responsive.
productivity due to traffic congestion in the Metro Vancouver area is between $500          Trade and Invest British
                                                                                                   Columbia, 2018
million and $1.2 billion annually. Widening roads and freeway corridors and
                                   4

building more bridges is not only cost-prohibitive but also flies in the face of
Vancouver’s Transportation 2040 plan, which aims for the majority of trips on foot, bike, and transit,
eliminating dependence on fossil fuels through adoption of zero-emission hydrogen and electric power,
and offering its citizens and visitors the cleanest air of any major city in the world.

With its growing population, built-out land, and hemmed-in geography, Vancouver’s transportation
network will require continued and creative improvements in the years to come. AAM holds the promise
                                                                        of substantial economic benefits for the
                                                                        Vancouver area, and not just in terms of
                                                                        reducing congestion as part of a
                                                                        seamless, multi-modal transportation
                                                                        system. Its implementation will require
                                                                        entirely new products and services that
                                                                        rely on investment and development,
                                                                        which in turn will spur economic growth.
                                                                        AAM will create skilled and highly paid
                                                                        jobs, attract global industrial and
                                                                        commercial players, bring in new tax
                                                                        revenues, boost tourism, and improve
                                                                        the ecosystem for institutes of higher
Figure 3 - Alaka'i Skai four-passenger hydrogen-powered eVTOL aircraft. learning. Importantly, improved mobility
                                                                        options brought about by AAM and the

3
  http://www.metrovancouver.org/services/regional-
planning/PlanningPublications/OverviewofMetroVancouversMethodsinProjectingRegionalGrowth.pdf
4
  Tackling Traffic: The Economic Cost of Congestion in Metro Vancouver, 2019, C.D. Howe Institute.

                                                                                                               8
jobs they create will greatly benefit Indigenous communities. Last but not least, environmental
monitoring and emergency services will dramatically benefit.

This paper lays out the methodology of our economic analysis. It also explores the economic effects—
jobs and GDP impact—of the four supply chains required to make AAM a reality. We examine how the
region could undertake the manufacturing of aircraft, build the required air traffic management systems
and ground infrastructure such as vertiports for landing and takeoff, and ensure safe flight operations.
Figure 4 provides the roadmap that this analysis follows.

Figure 4 - Advanced Air Mobility industry jobs and GDP impacts are derived through an econometric analysis using AAM industry business
case tools and Statistics Canada input/output tools.

In the sections below, we walk readers through the components and concepts illustrated in Figure 4,
beginning with a crisp definition of the four supply chains that need to come together to secure a long-
term, viable, and profitable Advanced Air Mobility ecosystem. Direct, indirect, and induced job and GDP
impacts will be quantified. Lastly, a select number of catalytic benefits will be reviewed for their AAM
sector benefits.

                                                                                                                           9
What is Advanced Air Mobility?
Advanced Air Mobility refers to a wide variety of aircraft, both large and small, piloted and unpiloted,
VTOL (vertical take-off and landing) and STOL (short take-off and landing), hybrid-electric, all-electric or
other advanced propulsion (such as hydrogen fuel cells), intra-urban and
“It’s time to look at regional, passenger and cargo vehicles. For the purposes of this study,
[Advanced Air however, we will only examine the economic impact of VTOL passenger
Mobility]. The address- aircraft. Those powered by batteries or hybrid electric systems are called
able market is $1.5
trillion in our base case
eVTOL (electric VTOL) aircraft. At some point in the future, hydrogen fuel
by 2040. Logistics is cells may also come into play, fueling hVTOL aircraft. While batteries
leading the way.” currently limit flight times and require long charging times in between
flights, fuel cells—such as those that will be used in aircraft being
Morgan Stanley
Research, December developed by Alaka’i, VEA Aviation, AeroG, and ZeroAvia—could offer the
2018. benefit of long-range flight capabilities as well as fast refueling.
AAM has until recently been known as UAM, or Urban Air Mobility, given
its intended uses over heavily congested cities. However, eVTOL aircraft will also be utilized outside of
urban areas, delivering supplies to and transporting passengers throughout remote communities, for
instance, or providing regional transport between airports 80-250 km apart. Therefore, the name AAM
has been adopted to reflect greater inclusivity of its many uses near and far, which is especially true for
British Columbia.
Greater Vancouver Advanced Air Mobility Use Cases
AAM will have numerous uses moving people. This analysis, discussed thoroughly in the AAM White
Paper Series Part I, focuses on six:
Airport Shuttle Services: Tying city centers to airports and one metropolitan airport to another.
On-Demand Air Taxi: A network
of small electric aircraft hailed by
mobile app to land at the
passenger’s nearest vertiport and
delivering the passenger to the
vertiport nearest their ultimate
destination.
Regional Transport Services:
Many city pairs are located too
close for a convenient
commercial flight but too far for
a convenient drive (Vancouver
and Seattle, for example).
Longer-range eVTOL aircraft will
focus on transporting passengers
between such city pairs. Figure 5 – Conceptual TriFan eVTOL Medevac configuration designed by XTI Corp.
for Helijet of Vancouver.
10 Medical and Emergency Operations and Services: eVTOL aircraft in development (Figure 5) are
likely to require only one minute to prepare for take-off as opposed to the 10-13 minutes
required by some helicopters, thereby reaching critically ill and injured people much more
quickly.
Business Aviation: The world’s top executives use business aircraft for time management,
building enterprise value, and retaining top talent. Yet they, too, get stuck in traffic on the way
to the airport. eVTOL aircraft will fly top executives from corporate headquarters to their
business aircraft or to their final destinations if within a couple of hundred kms.
Air Metro: The air metro concept of AAM resembles current public transit options such as
subways and buses, with pre-determined routes, regular schedules, and set stops in high traffic
areas throughout Greater Vancouver. This use case deploys larger eVTOLs, such as the AeroG
platform (on the cover of this paper), moving perhaps 10 to 12 or more passengers at a time.
An air metro use would take residents from distant passenger stations in a remote suburb to a
TransLink Skytrain station closer into the city, or perhaps directly into the airport or downtown.
Small Unpiloted Aerial Systems (sUAS) Use Cases
A number of use cases for sUAS vehicles (sometimes known as drones), generally
“The final frontier in
of limited range and under control through visual line of sight, are detailed in Part
‘mobility-by-air’
I, the White Paper. These are: remains urban centers,
long captive to surface
Wildlife Tracking and Monitoring: page 47. transportation,
Coastline Monitoring and Conservation: page 48. especially cars, buses
Fishery Monitoring and Compliance: page 50. and mass rail transit.”
Rapid-Fire Dispatch: page 51.
Michael Dyment,
Wildfire Response: page 53. Managing Partner,
Retail Goods and Food Delivery: page 54. NEXA Capital Partners.
This paper, Part II, does not analyze economic impacts of these drone and UAS
use cases; however, we will produce an econometric study of drone and UAS applications in the future.
The remainder of this report lays out the AAM passenger impacts only.
AAM Challenges and Opportunities
As with any great technological leap forward, especially one that will impact the lives of so many people,
AAM must overcome numerous barriers before it can be implemented in a community. In short, it must
be safe; it must be financed; it must break even in the near future; and it must be accepted by the
public. These requirements have been thoroughly discussed in the White Paper, which examines safety,
regulations, capital formation, infrastructure needs, privacy issues, and environmental impacts such as
noise.
Opportunities also abound. Vancouver’s geography is a key factor in its early utilization of AAM. A
distinctive combination of factors—many bodies of water, mountains, and the capital of British
11Columbia, Victoria, located on nearby Vancouver Island—creates
“According to a [recent] increasing congestion, presents challenges to convenient mobility
poll, 85 percent of
solutions, and positions the city to become an excellent early user of AAM.
Canadians feel that it is
important for Canada Additional factors strongly favoring the Greater Vancouver region include:
to invest in its domestic
aerospace industry.”
Diversified, green, knowledge economy. Several sectors are attracting
global talent, corporations, and investment to Vancouver, which is fast
Aerospace becoming the new foundation of the knowledge economy. For example,
Industries Association of the city is the third greenest in the world 5 and has long recognized the
Canada, July 2020
economic opportunity and global imperative of driving green. Also,
Vancouver’s economic diversity ranges from leadership in traditional
resource industries to social enterprise, technology, aerospace, and digital entertainment.
A vibrant aerospace sector.
Vancouver is the location of
more than a dozen AAM
projects involving large
aerospace companies,
universities, and both the
federal and provincial
governments.
A strong in situ base of
scientific and technical
know-how. Vancouver has a
network of educational
institutions that provide a
deep pool of highly skilled
talent. For instance, the
University of British
Columbia is a global center
for research and is Figure 6 - Local aerospace expertise is abundant in B.C.
consistently ranked as one
of the top 20 public universities in the world.
5
According to the 2016 Global Green Economy Index, behind only Copenhagen and Stockholm.
12Figure 7 - Greater Vancouver, including parts of Vancouver Island, with important features that aid in AAM planning such as
major transportation routes, hospitals, corporate headquarters, helipads, and airports..
Vancouver’s innovation economy. The city has been voted the number one Job-Creating
Economy in Canada; the Most Diverse Economy in Canada 6; the number two Startup Ecosystem
in Canada 7; and the “Number One Cleantech Cluster” in Canada. 8
Long experience with and public acceptance of helicopters and sea planes. The active Air
Operators maintain licensed AOCs (Air Operator Certificates) and ferry several hundred
thousand passengers annually. They have the experience, infrastructure, and regulatory licenses
to easily transition to eVTOL aircraft using their current offshore flight corridors—channeling
noise and visual disturbances away from populated areas.
54 existing helipads. Many of these could be remediated at reasonable cost as vertiports with
battery recharging stations and passenger amenities.
6
Conference Board of Canada. www.conferenceboard.ca
7
By Startup Genome. https://startupgenome.com
8
The Global Cleantech Cluster Association.
13 Twelve airports.
15 hospital centers. Seven are equipped with helipads. These would “The simplification of
benefit from drone delivery of supplies and eVTOL Medevac rescue the technology,
operations. combined with the
sophistication that can
be pushed into the
software, has
completely changed the
landscape of what you
can do with these flying
vehicles.”
Eric Allison, Uber
Elevate
14The Business of Advanced Air Mobility: Economic Inputs
How does AAM translate into societal benefits, environmental advantages, jobs, and economic growth?
This section provides an explanation of the key drivers of such outcomes. The estimated capital and
operational inflows and outflows for the Greater Vancouver area are quantified.
Relevant Supply Chains
Bringing Advanced Air Mobility into operational status will require four supply chains to assemble and
operate this new transportation system. As shown in Figure 4 on page 8, these begin with AAM ground
infrastructure needed to provision landing
facilities. The world is actually well-
populated with heliports; however, fewer
than half are in locations convenient to
maximize AAM applications. Ground
infrastructure will require expansion into
network configurations, with each node, or
vertiport, carefully located and built to
ensure passenger convenience and value
(Figure 8).
The second AAM supply chain is that of air
traffic management, known as RTM
(Remote Traffic Management), which
ensures safe airspace coexistence for
Figure 8 - Uber Elevate proposes that rooftop modifications to parking facilities
commercial and general aviation, drones, in urban areas can be made cost effectively.
and AAM aircraft. Finding the right RTM
solutions on a city-by-city basis will be necessary to unlock full market potential and requires increased
collaboration and planning among all stakeholders. NAV CANADA is responsible for managing Canada’s
airspace and, as an observer of the Canadian Advanced Air Mobility Consortium, will assist in developing
the air traffic management portion of the AAM ecosystem.
The remaining two supply chains—eVTOL aircraft manufacturing and the aircraft operators that will fly
them—will be fully discussed in the sections below. The ecosystem needs to provide excellent services
to passengers at affordable prices at a point where the sector finds equilibrium, thereby becoming and
remaining profitable. By definition, this equilibrium is achieved when each of the four supply chains can
reach and exceed cash flow profitability.
15The NEXA Advisors/UAM Geomatics business analysis tools illustrated in Figure 9 have been developed and used to assess city-by-city AAM
feasibility, and Vancouver is one of 75 urban areas studied for this exacting and comparative analysis. A key goal is for each of the four supply
chains shown (the “City PPP Model”, the “AAM Operating Model”, the “RTM Model” and the “AAM eVTOL Supply Chain”) to achieve a measure
of commercial success.
Figure 9 – NEXA Advisors/UAM Geomatics financial and economic tools analyze the four supply chains to assess AAM business viability, city by city.
Vancouver is one of the 75 cities analyzed
16For the purpose of this analysis, Vancouver’s four critical supply chains all succeeded in achieving this
success, in turn attracting outside capital to fund each phase of the launch
Pillar Year 2021-2025 2026-2030 2031-2035 2036-2040 SUM
Pillar Totals
Ground Infrastructure OPEX $7,080,538 $15,668,063 $45,839,785 $52,095,751 $120,684,137
Ground Infrastructure $181,388,465
Ground Infrastructure CAPEX $13,877,663 $14,769,977 $29,602,682 $2,454,005 $60,704,328
RTM Cost OPEX $3,154,325 $3,797,741 $12,641,869 $26,506,853 $46,100,788
RTM $77,868,401
RTM Cost CAPEX $5,282,482 $9,824,189 $8,364,717 $8,296,225 $31,767,613
Operator Use Case Revenues $91,103,282 $207,172,611 $377,773,838 $471,264,943 $1,147,314,673
AAM Operators $1,576,356,945
MedEvac/EMT Services BC $80,751,593 $80,865,721 $134,262,161 $133,162,797 $429,042,272
Vehicles Vehicle Acquisitions $33,047,009 $73,037,381 $77,677,583 $66,415,124 $250,177,098 $250,177,098
Vancouver Grand Total $234,296,893 $405,135,683 $686,162,635 $760,195,698 $2,085,790,909 $2,085,790,909
Percent of Total 11.2% 19.4% 32.9% 36.4% 100%
Figure 10 - Greater Vancouver revenue, OPEX and CAPEX analysis, generating monetary inputs used to drive Statistics Canada
input/output tool.
Figure 10 shows the extensive analysis provided by the financial and economic tools used in the NEXA
Advisors/UAM Geomatics Urban Air Mobility study, produced in five-year increments of 20-year revenue
and capital investment estimates for Greater Vancouver. These financial estimates fall into three
categories:
CAPEX – Those capital expenditures funds used to acquire, upgrade, and maintain physical
assets such as property, plants, buildings, and specialized facilities, technology, or equipment.
OPEX – Costs that a business incurs through normal business operations. Operating expenses
include rent, equipment, inventory costs, marketing, payroll, insurance, step costs, and funds
allocated for research and development.
Vehicles – Fleet acquisition and maintenance costs to acquire and operate sufficient eVTOL
aircraft to sustain the use cases identified.
Supply Chain #1: Provisioning Extensive AAM Ground Infrastructure
The easiest way to create AAM vertiports is to remodel existing heliports. The basic elements of a
heliport are clear approach/departure paths, a clear area for ground maneuvers, final approach and
takeoff area (FATO), touchdown and liftoff area (TLOF), safety area, and a wind cone. This existing
infrastructure can be updated for eVTOL aircraft by adding battery recharging stations and fuel stations
for hybrid aircraft, as well as perimeter security, shelters, and other amenities. Given the need to
recharge batteries, the region’s power grid becomes an essential factor in determining vertiport
locations.
Globally, many cities have heliports that are rarely or no longer used. Helicopters are often seen as a
nuisance by local communities due to their noise. Given the lower noise signature of eVTOLs, it is likely
that some of the unused or underutilized heliports—particularly those near hospitals—may be
renovated to utilize the new aircraft.
Integrating an eVTOL aviation network with the existing system of public transportation modes requires
detailed planning and analysis. With the objective of implementing the greenest, most cost-effective,
and commuter-friendly transit system possible, planners must consider the needs of all users when
locating vertiports to enable practical end-to-end solutions for passengers. Metro Vancouver has 54
heliports, including at all 12 airports, and at seven of the 15 hospital centers. The NEXA Advisors/UAM
Geomatics Urban Air Mobility Study projected that by 2040 Greater Vancouver would need twelve new
17vertiports and possibly one multiport (landing area for multiple aircraft), strategically placed throughout
the metro region, in addition to those presently at airports and hospitals.
RTM Ground Infrastructure While the technology is
Components (CAPEX and OPEX)
available to upgrade heliports
• Network design studies • Passenger shelters
• Environmental study • Lighting systems
to vertiports, Transport
• Airspace flight design 3D • CNS systems (ILS, beacons, etc.) Canada has not yet finalized
visualization studies • IT and security systems standards. These regulations
• Concession agreements • Perimeter systems may be dependent on the
• Secure project financing • Parking
• Purchase or lease land • Power grid updates types of aircraft selected, their
• Construction permitting • Transport Canada (etc.) permitting footprint, weight, and electric
• Architectural and engineering and certification or hydrogen charging
• Site preparation • Recharging capability and systems
requirements.
• Site construction • Fire suppression systems
• Foundation modifications • Aeronautical chart preparation
What are the cost elements
• Platforms • Operators, maintenance staff and
• Egress, walkways related workforce one must include in CAPEX and
• Elevators OPEX estimates? A list is
provided in Figure 11. These
Figure 11 - Selected ground infrastructure cost elements. elements have been
forecasted for Vancouver’s
infrastructure improvements using specific intrinsic cost data unique to the City and its metropolitan
region, such as land cost, labor cost, and so forth.
While certain aspects of vertiports remain to be determined, it is safe to say that the development of
infrastructure to support an eVTOL network has significant cost advantages over heavy-infrastructure
approaches such as roads, light rail lines, bridges, and tunnels. Compared to the
billions of dollars required to extend lines, for instance, the estimate for the 12 “Airbus is working on
different concepts for
new vertiports projected to operate in Greater Vancouver by 2040 (a mix of
urban air mobility and
remediating existing heliports and building new ones) is in the range of $70 million is actively engaging
total. with cities and other
stakeholders.”
Supply Chain #2: RTM: Safely Managing AAM Air Traffic Flows
Vassilis Agouridas,
Airbus Mobility
An air traffic management system ensures the safe and efficient movement of
aircraft. Airplanes and helicopters are guided through the airspace by air traffic
controllers. Drones and eVTOL passenger aircraft must also be safely and efficiently managed. It is likely
that the first passenger use cases will rely on NAV CANADA’s existing system of air traffic controllers:
those eVTOL aircraft replacing and/or complementing existing aircraft operations such as Medevac and
helicopter operators.
18But the many new uses and routes of eVTOLs—both passenger vehicles and drones—would add
hundreds, perhaps thousands of movements to the system each day, overloading the area’s air traffic
management capabilities.
Advanced Air Mobility will
RTM ATC Infrastructure need its own air traffic
Components (CAPEX and OPEX) management system working
• RTM interoperability standards and • Flight Plan and Flight Operations
in conjunction with the current
drone/eVTOL agreements. Database
• RTM one-time facilities planning • SCADA for Systems and Networks system. Human controllers in a
• Site/network optimization study • Power Grid and Backup Systems new local RTM facility may
• Systems specifications • Network Design and Site Selection become airspace managers,
• Power grid studies Studies
• Cyber security architecture studies • Weather Information Systems - focused on supervising
• Physical security architecture Areal automated systems and
• Facilities (offices) rental costs • Micro Weather Detection Sensors aircraft operations, ensuring
• Automation Systems and Stations • Beacon Navigation Nodes
safety and, at all times,
• Flight Decision Support Tools • Resilient Communications Nodes
• Computers and Equipment • High Density Radar security. At such a facility, a
single controller could
Figure 12 – Selected RTM Cost Elements. supervise many more aircraft
movements than working in an
airport ATC tower. A simple explanation is that aircraft will operate in layers of altitude (Figure 13), with
drones at the lowest level, eVTOL aircraft in the middle, and traditional aircraft at the
highest, though they must also be guided through layers during take-off and landing. “British Columbia’s
aerospace sector is globally
Of note is that NAV CANADA already maintains a downtown Vancouver air traffic
recognized for excellence in
control tower overlooking Vancouver Harbour. For more detailed information on delivering highly specialized
RTM, refer to page 29 in the White Paper. products and services,
supported by a network of
Costs to implement RTM capabilities are reflected in Figure 12. While ensuring safe education institutions that
vehicle separation using fully staffed facilities, the costs for Vancouver identified in provide a deep pool of
Figure 10 are affordable when considering their amortization over a period of highly skilled talent.
decades. --Trade and Invest British
Columbia 2018
According to the NEXA Advisors/UAM Geomatics study, the estimated cumulative
cost for Metro Vancouver Advanced Air Mobility Air Traffic Management systems and
operations will start at around $80 million. This amount includes the need for a fully
staffed Network Operations Center or NOC, within the city’s boundary. The NOC would be overseen by
NAV CANADA.
19Figure 13 – Simplification of concepts for layering airspace above metropolitan areas.
Advanced Air Mobility must, within a few years, become economically viable to pay off investors as well
as to pay recurring costs such as equipment maintenance and upgrades, and employee salaries, and
maintain public safety and convenience.
Supply Chain #3: Advanced Air Mobility Operators
Current operators of helicopters are today’s vanguard for eVTOL services. Charter helicopter companies
in Vancouver, the most familiar being Helijet (Figure 14), have excellent longstanding safety records,
trained pilots, weather dispatching
expertise and systems, and quality and
safety programs. They are also familiar
with the regulations, terrain, and
locations of the heliports and airports in
the region. As an industry, their current
services are scheduled operations (e.g.
Vancouver Harbour to Victoria), and
more, including medical/emergency
services, airport shuttle services,
regional transport, cargo delivery,
tourism, and heli-skiing. Figure 14 - Helijet currently provides scheduled airline services, air taxi and
Medevac services, to British Columbia residents.
Drone operators can be independent
individuals, small companies, and large players such as Amazon, FedEx, Air Canada and DHL. Their
missions are diversified, and range from healthcare (isotope delivery, vaccine delivery, COVID test kits,
20blood transport) to package delivery, agricultural purposes, bridge inspection, and other useful
applications.
“British Columbia
Supply Chain #4: Advanced Air Mobility eVTOL Aircraft companies serve major
aircraft manufacturers such
Several eVTOL prototypes around the world are either in or nearing advanced stages as Boeing, Lockheed Martin,
of development and operational trials of one kind or another. Designs vary widely in and Bombardier. The
terms of numbers of passengers, number of rotors, and distance traveled before province is home to
pioneering research and
recharging.
development on aerospace
Even those developers furthest along have not released certain details about their composite materials and
structures.”
aircraft, but we believe they will be lighter, quieter (Figure 15), and more flexible
than helicopters. Medevac eVTOLs, for instance, will be able to land safely in a --Trade and Invest British
smaller area, a great bonus when emergency rescue personnel need to reach a Columbia, 2018.
critically injured person on a congested road.
Nearly all eVTOL aircraft currently in development are designed to be piloted, at least initially. The next
two decades will see increasing use of automation and autonomy performing many functions
traditionally performed by humans. Automation and autonomy offer the opportunity to reduce
workload and enhance safety for critical aviation functions.
Aircraft noise is a key determinant
defining success and acceptance of
eVTOLs that will operate in areas
of higher population density at low
altitudes. Smaller eVTOL aircraft
are expected to fall well within
current noise guidelines, and
noise-reducing technologies hold
promise for larger aircraft to be
good neighbors as well.
Estimated AAM Passenger
Figure 15 - eVTOL noise will be a key determinant of public acceptance.
Demand for Vancouver
Analysis of the major use cases’ passenger demand first required separation into price-elastic (sensitive
to price) and price-inelastic (less sensitive to price) forecasts. Clearly, on-demand air taxi, airport
shuttle, air metro and regional air transport services are highly price sensitive, while business aviation
and Medevac are not. Many factors are considered as well, including the ability of urban residents to
afford such services. For these demand forecasts to be realistic, the analysis made use of ten factors—a
method uniformly applied to the 75-city study undertaken by NEXA Advisors/UAM Geomatics earlier in
2020. These factors (Figure 16), adjusted to Greater Vancouver’s unique demographics, estimate that by
2040, the peak forecast year, some 680,000 passengers are expected to travel using new eVTOL services
annually.
21Factor Demand Description
Input
1 Airport The Airport O/D input weighted cities according to the level of originating and departing
O/D Traffic passenger traffic. The total commercial passenger “Enplanement” traffic was gathered for all
active airports within the wider city metro areas. A tier was then found for each city to
determine how much of the passenger traffic was originating to or departing from the city,
eliminating connecting traffic.
2 Mobility The Mobility Substitutes input ranked a city’s willingness to accept a new AAM transportation
Substitutes option. The rank was derived from five scores, all weighted accordingly, including on-demand
taxi cost, public transport cost, vehicle ownership cost, electricity and gas cost. The higher
the cost (except for electricity), the better the city scored for the new UAM services.
3 Per Capita The per capita GDP (PPP) input weighted cities according to the most up-to-date gross
GDP domestic product (PPP) of each city.
4 Distances The Distances and Congestion input weighted cities according to average traveling distances.
and The rank was derived from ranking the distance from the main airport to the city center, and
Congestion the total area of the city itself. The higher the congestion, the greater weight this factor
played.
5 CIMI The CIMI Human Capital input weighted cities according to the human capital indicator of the
Human IESE Cities in Motion Index (CIMI), 2019. The CIMI comparatively analyzed 174 different
Capital cities. The human capital score was derived from 10 different factors, including higher
Indicator education levels of the population, available universities, and per capita expenditure on
education.
6 Population The Population Density input weighted cities according to their density and proximity to city
Density employment areas. The gravity model determined how likely the factor was able to influence
UAM demand.
7 Liveability The Liveability input ranked cities according to its liveability, focusing on disposable income.
The costs of living in each city was derived from Expatistan.com, and then inversed. That rank
was combined with the average monthly net salary (after tax) of each city, and the two scores
were averaged together. The higher the salary and the lower the cost of living, the higher the
cities were ranked for AAM usage.
8 Fortune The Fortune Global 1000 Corporations input weighted cities according to commercial
1000 business environment. To determine the importance of this factor on passenger demand, we
Presence identified the total count, total enterprise value, and total employees of Fortune Global 1000
company headquarters. The three scores were ranked and averaged to influence AAM usage.
9 Business The Business Aviation arrivals/departures input weighted cities according to their business
Aviation aircraft arrivals and departures. The data was derived from multiple sources and databases.
Activity Business aviation fleets were considered through JETNETS registrations.
10 Existing The Existing Heliports input weighted cities according to their sunk investment in heliport
Heliports infrastructure. The best available data for heliports is considerably inaccurate, so our
proprietary data and research tools were developed and used to increase the accuracy.
Figure 16 - Factors applied to Vancouver demographic analysis of future AAM demand.
22Advanced Air Mobility Economic Outputs: Jobs and GDP
To undertake a 20-year economic impact assessment of Advanced Air
“The master-economist Mobility for the Greater Vancouver area, CAAM and NEXA retained the
must possess a rare services of Statistics Canada to combine the work of the NEXA data with
combination of gifts ....
the input/output modeling capacity of Statistics Canada. The combination
He must be
mathematician, depicts the most accurate possible impact assessment of the benefits AAM
historian, statesman, will deliver specifically to the Greater Vancouver region. The results of the
philosopher—in some study give insight into not only the city of Vancouver and British Columbia
degree. He must study
as a whole but include rippling effects for the rest of Canada. The results
the present in the light
of the past for the
may be analyzed and carefully considered by policy planners, such as the
purposes of the future. Vancouver Economic Commission and the Western Economic
No part of man's Diversification group, as well as municipal and provincial governments
nature or his interested in job creation and general economic growth. These results
institutions must be
make it somewhat easier to mobilize Vancouver’s resources to act on the
entirely outside his
regard. He must be AAM opportunity and support goals of a safer, more mobile, publicly
purposeful and affordable, and greener city.
disinterested in a
simultaneous mood, as In economics, an input/output model is a quantitative methodology that
aloof and incorruptible represents the interdependencies between different branches of a
as an artist, yet national economy or of regional economies. The Statistics Canada
sometimes as near to
input/output model depicts inter-industry relationships, showing how
earth as a politician.”
output from one industrial sector may become an input to another
John Maynard industrial sector. In the inter-industry matrix, column entries typically
Keynes represent inputs to an industrial sector, while row entries represent
outputs from a given sector. This format shows how dependent each
sector is on every other sector, both as a customer of outputs from other sectors and as a supplier of
inputs.
Econometric and input-output models contain assumptions; after all, if every variable were known, we
would have a list of facts and not a forecast. The most important assumption derived from NEXA’s
business forecast for Vancouver
includes the insertion of an
“inflection point,” the
introduction of highly automated
flight systems requiring less
human intervention. For
example, an emerging view of
AAM over the next 20 years is
that cockpit automation will be
necessary to improve the
integrity and thus the safety of
this new market sector.
Figure 17 - Vancouver International Airport (YVR) will become a significant node when
Automation should eliminate Advanced Air Mobility comes online. In 2019, YVR handled 26.4 million travelers.
23pilot error, enforce sense-and-avoid rules, and safely separate all vehicles,
including eVTOLs and drones. Automation will reduce the cost of operations, as “We could solve all our
well as the demand for human operators. The cost structure of the entire industry problems if only we
will be dramatically impacted in synchronization with the expansion of vehicle were the efficient,
rational human beings
and airspace capacity. The economic impact assessment in this report accounts of standard economic
for the inflection point, as reflected in the charts examined below. This is done theory and had
through the input phase, whereby the NEXA model factors in automation and its politicians willing to
impact on the overall AAM business case. think in the long-term
interest of their people
Statistics Canada’s input-output model also comes with certain assumptions and rather than their own.”
limitations. It does not take into account economies of scale, constraint
Jeremy
capacities, technological change, externalities, or price changes. It is, however, Grantham, Inventor of
easily assumed that technologies improve over time, and that growing firms and Market Bubble Theory
industries experience the benefits scale, which reduce, as a proportion, fixed
operational costs. Prices are predicted to fall, and productivity generally improve. Other assumptions in
the model include fixed consumption behaviors and a fixed share of expenditure relative to income.
Economic Impact – Study Definitions and Methods Used
EIAs assess the impact of an “exogenous shock”—economic activity that stimulates growth—exploring
its impact on a number of indicators such as job creation, GDP growth, and revenues. Some of these
indicators will be further evaluated at three levels of analysis: direct, indirect, and induced effect. Direct
effects calculate the economic value that a business or industry generates by its own means through
direct hiring of its own employees, revenue generation from sales, and the portion of its business
activity that contributes to national GDP. Statistics Canada states the following: “The direct effect on the
output of an industry is a one-dollar change in output to meet the change of one dollar in final demand.
Associated with this change, there will also be direct effects on GDP, jobs, and imports.” Indirect effects
gauge the economic impact that results from demand created by a particular company/industry for
products and services from companies that support that business’s activities (i.e. supply chain
companies).
Statistics Canada classifies indirect effects as follows: “Indirect effects measure the changes due to inter-
industry purchases as they respond to the new demands of the directly affected industries. This includes
all the chain reaction of output up the production stream since each of the products purchased will
require, in turn, the production of various inputs.” Finally, there’s the induced effect, which measures
the economic impact on the broader economy resulting from demand created by employees of the
company/industry in question (direct component) and its supporting businesses (indirect component).
Statistics Canada defines induced effects as follows: “Induced effects measure the changes in the
production of goods and services in response to consumer expenditures induced by households'
incomes (i.e., wages) generated by the production of the direct and indirect requirements.”
In this instance, the direct effect of a $ 2.2 billion (page 6) AAM multi-industry exogenous shock to
Vancouver over 20 years will produce a number of direct AAM jobs, revenues, and expenditures that will
further produce inter-industry demand (indirect impact). Additionally, the induced impact will capture
unrelated excess economic activity (e.g., consumer spending in the general economy from increased
income provided by AAM). Based on the EIA numbers, we go one step farther in identifying AAM’s
24catalytic effects on the city of Vancouver and the surrounding region. Growth in AAM will improve trade
between West Coast communities along the Cascadia corridor, facilitate economic reconciliation for
Indigenous peoples, accelerate investments in science and technology, and boost the role of
Vancouver’s hydrogen programs and pull-through for the AAM sector. These effects are discussed as an
extension to the EIA.
Figure 18 provides a flow diagram of this study’s method. The model requires a dollar value shock as an
input in the input/output model. NEXA used its 20-year city estimate of $2.2 billion, categorized into
four NEXA-defined supply chains, to distribute as shocks to Vancouver’s economy. Although the shock
Figure 18 - Shock value allocation flow model.
was forecasted to occur with growing impact over 20 years, due to financial constraints associated with
infrastructure construction schedules, the shock was distributed over 20 years. The four supply chains
were further disintermediated and segmented by the type of cost-operational (OPEX) or capital
expenditure (CAPEX). Statistics Canada provided their North American Industry Classification System
(NAICS) codes applicable to the Province of British Columbia. We identified the appropriate and relevant
industries and their associated products to distribute the OPEX and CAPEX values. The examples of OPEX
industries and CAPEX commodities listed in Figure 18 are just some of the selections NEXA determined
were most relevant to the four supply chains. For OPEX, we distributed over $1.7 billion across eight
industries, including those such as air transportation and architectural, engineering, and related
services. For CAPEX, we distributed over $92 million across commodity classifications. These include:
communications equipment, research and development services, and aircraft. In this study, the vehicles
or aircraft component, which can be understood to mean aircraft and aircraft component purchases, is
considered a capital expense.
25The CAPEX commodity dollars were applied to the commodity distribution ratios
(e.g., communication engineering construction—a Stats Canada CAPEX “With a population of
commodity—took in 15% of the total CAPEX dollar distribution), resulting in a over 2.2 million and a
final shock value. Next, the OPEX industry values were applied to Statistics GDP of over $90B,
Metro Vancouver ranks
Canada’s production functions associated with each of the selected industries,
64th among city-
applying NEXA’s OPEX inputs to Stats Canada’s industry ratios (e.g., Statistics regional economies in
Canada’s function for the architectural, engineering, and related services size, but much higher in
industry estimates that office administrative services account for 2.43% of total livability, entrepreneur-
output). Once these final shock values were determined, Statistics Canada ran ship and ‘greenness.’”
the numbers through their model, producing outputs in the form of estimated Vancouver
impacts to GDP, jobs, and other economic indicators. Economic Development
Commission, March
Economic Impact – GDP Growth 2020
GDP, or Gross Domestic Product, is defined as the total value of all domestic final goods and services
produced within a specified period. According to the City of Vancouver factsheet #1.5, GDP for Metro
Vancouver was $135 billion in 2017. The introduction of AAM to Vancouver over 20 years would
generate nearly $2 billion more to the local and provincial economy, an additional 1.4% increase to GDP.
According to Figure 19, British Columbia would expect incremental GDP growth of $200 million within
the first five years of AAM service. As service expands, the value of AAM increases, finally topping at an
additional $732 million in GDP between 2036 and 2040. While the economic shock targets Vancouver,
the supply chains that would support the development of AAM bring in inputs from various economic
centers throughout the rest of Canada. For our purposes, the focus of the economic impact remains
within the Province of British Columbia, although GDP is forecasted to increase for the remainder of
Canada as a whole as a result. The rest of Canada (i.e., Canada, except B.C. in Figure 19) would see
nearly $360 million in GDP growth, bringing the total impact for the country at well over $2 billion for
the entire 20 years. We can assume that the introduction of AAM to Vancouver will serve as a catalyst
for introduction into the rest of
GDP Growth Canada. Toronto, for example, is
$1,000,000 another prime city that is expected to
$130,715 follow Vancouver’s direction, making
$800,000 $118,289 the GDP impact on the country
GDP, thousands
$600,000 significantly higher.
$68,843
$400,000 $732,152 Economic Impact – Jobs
$40,261 $634,608
$200,000 $351,126
$208,519 Jobs were calculated in full-time
$- equivalence. Statistics Canada
2021-2025 2026-2030 2031-2035 2036-2040 describes these as jobs that “include
Year only employee jobs that are
converted to full-time equivalence
B.C Canada, Except B.C
based on the overall average full-time
Figure 19 - GDP growth for both British Columbia and the rest of Canada, hours worked in either the business
assuming introduction of AAM infrastructure and services within several years. or government sectors.” For example,
26You can also read