Action plan of Ukraine for reducing aviation CO2 emissions - State Aviation Administration of Ukraine
←
→
Page content transcription
If your browser does not render page correctly, please read the page content below
State Aviation Administration of Ukraine

     Action plan of Ukraine for
     reducing aviation CO2 emissions

Document approved on                5 October 2018

FOREWORD
Ukraine supports the position to comply a global approach for monitoring and reducing of
aviation emissions that includes implementation of the ICAO Resolution A37-19 provisions
(Consolidated statement of continuing ICAO policies and practices related to environmental protection –
Climate change), encourages States to submit their action plans outlining their respective policies and
actions to achieve a global annual average fuel efficiency improvement of 2 per cent until 2020 and an
aspirational global fuel efficiency improvement rate of 2 per cent per annum from 2021 to 2050.
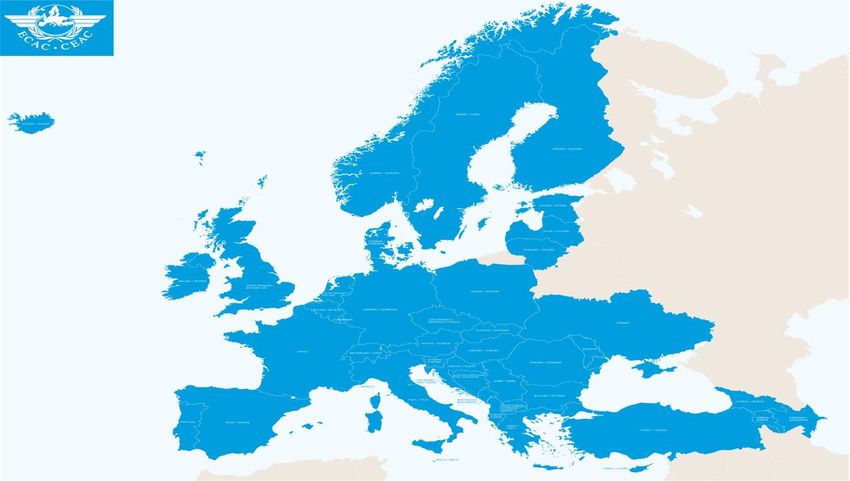
According to the decision of the European Civil Aviation Conference all ECAC Member States,
including Ukraine, agreed to provide its National Plan to ICAO and coordinated the format of such plan.
State aviation administration of Ukraine with the support of leading scientists and experts was
created the Working Group for development of the Action Plan with the assistance of aviation industry
representatives whose activity may effect on the final result: airlines, airports, fuel suppliers, air
navigation service provider, etc.
The objective of Ukrainian action plan is to calculate and forecast the CO 2 aviation emission and
implementation of appropriate measures to reduce and prevent pollution.
ACTION PLAN OF UKRAINE
Content
INTRODUCTION
CURRENT STATE OF AVIATION IN UKRAINE
CO2 EMISSIONS INVENTORIES, FORECASTS AND BASELINE CALCULATION
ECAC BASELINE SCENARIO AND ESTIMATED BENEFITS OF IMPLEMENTED
MEASURES
SECTION 1- Supra-national actions, including those led by the EU
SECTION 2- National Actions in Ukraine
CONCLUSION
Contact information for Ukraine focal point for the action plan:
Authority name: STATE AVIATION ADMINISTRATION OF UKRAINE
Point of Contact: Ivan Iatsenko
Street Address Peremohy ave, 14
Country: Ukraine
City: Kyiv
Telephone Number: +380443515632
Fax Number: +380443515632
E-mail address: Ivan.Iatsenko@avia.gov.ua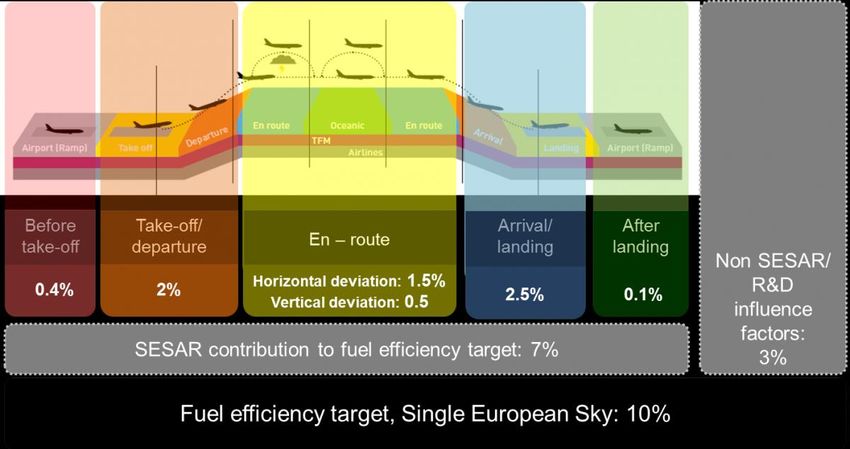
INTRODUCTION

    Ukraine is a member of the International Civil Aviation Organization (ICAO) from 09 September 1992,
    European Civil Aviation Conference (ECAC) from 15 December 1999 and European Organization for the
    Safety of Air Navigation (EUROCONTROL) from 1 January 2004. ECAC is an intergovernmental organisation
    covering the widest grouping of Member States 1 of any European organisation dealing with civil aviation. It is
    currently composed of 44 Member States, and was created in 1955.
    Ukraine is also member of the World Trade Organization (WTO) from 2008 year
    ECAC States share the view that environmental concerns represent a potential constraint on the future
    development of the international aviation sector, and together they fully support ICAO’s ongoing efforts to
    address the full range of these concerns, including the key strategic challenge posed by climate change, for the
    sustainable development of international air transport.
    Ukraine, like all of ECAC’s forty-four States, is fully committed to and involved in the fight against climate
    change, and works towards a resource-efficient, competitive and sustainable multimodal transport system.
    Ukraine recognises the value of each State preparing and submitting to ICAO a State Action Plan on emissions
    reductions, as an important step towards the achievement of the global collective goals agreed at the 37 th Session
    of the ICAO Assembly in 2010.
    In that context, all ECAC States submitting to ICAO an Action Plan, regardless of whether or not the 1% de
    minimis threshold is met, thus going beyond the agreement of ICAO Assembly Resolution A/37-19. This is the
    Action Plan of Ukraine.
    Ukraine shares the view of all ECAC States that a comprehensive approach to reducing aviation emissions is
    necessary, and that this should include:
 i. emission reductions at source, including European support to CAEP work
ii. research and development on emission reductions technologies, including public-private partnerships
iii. the development and deployment of low-carbon sustainable alternative fuels, including research and operational
     initiatives undertaken jointly with stakeholders
iv. the optimisation and improvement of Air Traffic Management, and CNS infrastructure within Europe.
v. Applying of global approaches to reduce the negative impact of international aviation to the environment.
    In Europe, many of the actions which are undertaken within the framework of this comprehensive approach are
    in practice taken at a supra-national level, most of them led by the EU. They are reported in Section 1 of this
    Action Plan, where Ukraine’s involvement in them is described, as well as that of stakeholders.

    In Ukraine a number of actions are undertaken at the national level, including by stakeholders, in addition to
    those of a supra-national nature. These national actions are reported in Section 2 of this Plan.
    In relation to actions which are taken at a supranational level, it is important to note that:
    The extent of participation will vary from one State and another, reflecting the priorities and circumstances of
    each State (economic situation, size of its aviation market, historical and institutional context, such as EU/ non
    EU). The ECAC States are thus involved to different degrees and on different timelines in the delivery of these

          1   Albania, Armenia, Austria, Azerbaijan, Belgium, Bosnia and Herzegovina, Bulgaria, Croatia, Cyprus, Czech
              Republic, Denmark, Estonia, Finland, France, Georgia, Germany, Greece, Hungary, Iceland, Ireland, Italy,
              Latvia, Lithuania, Luxembourg, Malta, Moldova, Monaco, Montenegro, Netherlands, Norway, Poland, Portugal,
              Romania, San Marino, Serbia, Slovakia, Slovenia, Spain, Sweden, Switzerland, The former Yugoslav Republic of
              Macedonia, Turkey, Ukraine, and the United Kingdom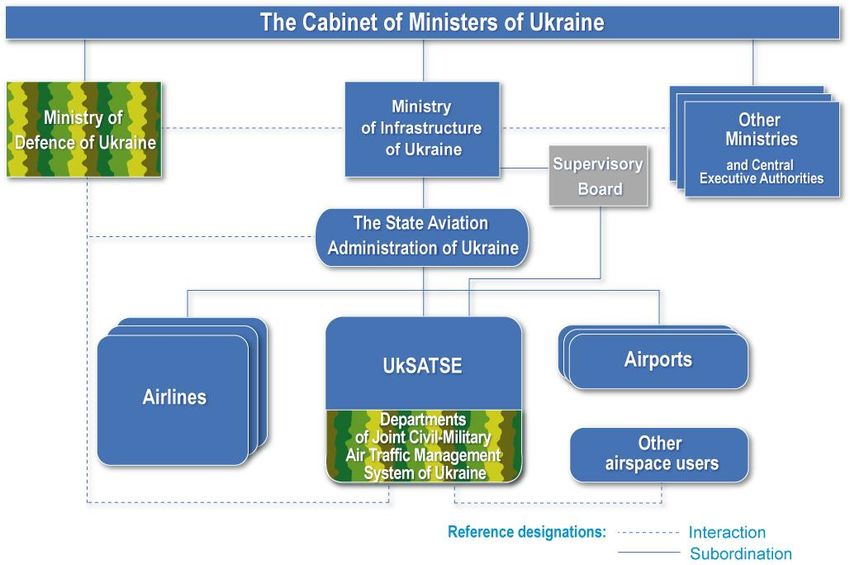
common actions. When an additional State joins a collective action, including at a later stage, this broadens the
effect of the measure, thus increasing the European contribution to meeting the global goals.
Nonetheless, acting together, the ECAC States have undertaken to reduce the region’s emissions through a
comprehensive approach which uses each of the pillars of that approach.

CURRENT STATE OF AVIATION IN UKRAINE

      Structure of aviation sector
President of Ukraine and Cabinet of Ministers of Ukraine shall ensure implementation of the aviation
development policy of Ukraine in accordance with the Constitution and Laws of Ukraine.
Authorized body for civil aviation is the Central Executive (governmental) Body on Civil Aviation that shall be
established and which status shall be defined by the President of Ukraine (hereinafter referred to as the Civil
Aviation Authority). Authorized executive body for state aviation is the Ministry of Defense.
Civil Aviation Authority and the Ministry of Defense within their powers are entrusted with regulation of
Ukraine’s airspace.
State Aviation Administration of Ukraine (SAAU) is a Civil Aviation Authority of Ukraine established by the
Cabinet of Mibisters of Ukraine Edict from 08October 2014 №520/.
State Aviation Administration of Ukraine shall implement the Ukraine’s state policy and strategy for aviation
development, and it shall exercise regulation of civil aviation in such areas:
- ensuring aviation safety, aviation security, ecological safety, economic and information security;
- creation of conditions for development of aviation activity, air transportation and its servicing, exercising
aerial works and flights of general aviation;
- air traffic management and airspace regulation of Ukraine;
- representation of Ukraine in the international civil aviation organizations and in external relations in the field
of civil aviation;
- drafting, adoption and implementation of aviation rules;
- certification of aviation entities and facilities;
- issue of licenses for economic activities pertaining to rendering services on transportation of passengers and/or
cargo by air as well as authorization of air lines operation and assignment to air carriers;
- continuous supervision and monitoring of the observance of the requirements set by legislation, including
aviation rules of Ukraine.
State Aviation Administration of Ukraine is a duly authorized and independent body with regard to ensuring
utilization of the airspace of Ukraine by aviation entities of Ukraine and oversight the provision of air
navigation services.
For the purpose of aviation safety State Aviation Administration of Ukraine shall cooperate with law-
enforcement agencies and other executive bodies.
State Aviation Administration of Ukraine web address: http://www.avia.gov.ua/
The Ukrainian State Air Traffic Service Enterprise (UkSATSE) is the main air navigation services provider
of Ukraine as well as core for the Integrated Civil-Military Air Traffic Management System of Ukraine (ICMS).
The Enterprise is authorized by the Governmental Regulation Body for provision of Air Navigation Services in
the ATS airspace of Ukraine and in the part of the high seas of the Black Sea, where the responsibility for the
provision of ATS is delegated to Ukraine (hereinafter referred to as ATS airspace of Ukraine) by International
Civil Aviation Organization (ICAO). This identifies the mission and main tasks of UkSATSE.
         Main tasks:
-      Air Traffic Management: Air Traffic Services, Airspace Management and Air Traffic Flow Management
in the airspace of Ukraine;
-      radio-technical and electrical provision of ATS and flight operation;
-      provision of activity and development of the Joint Civil-Military ATM System Units;
-      alerting Services and participation in Search and Rescue operations;
-      provision of airspace users with Aeronautical Information;
-      modernization and development of the Air Navigation System of Ukraine;
-      training and refresher training of the UkSATSE experts;
-      provision of social development and security of its personnel.
The Ukrainian State Air Traffic Service Enterprise web address: http://uksatse.ua
      Participation in International Organisations
1992 - Ukraine became the Full Member State of International Civil Aviation Organisation (ICAO)
1994 - Accession of UkSATSE to International Federation of Air Traffic Controllers' Associations (IFATCA)
1995 - Signature of Bilateral Agreement between Ukraine and Central Route Charges Office
(EUROCONTROL)
1997 - Accession of UkSATSE to Air Traffic Control Association (ATCA)
1997 - Introduction of new Flight Information Region (FIR) boundaries over the Black Sea
1998 - UkSATSE became a founder member of Civil Air Navigation Services Organisation (CANSO)
1999 - Ukraine became the Member State of European Civil Aviation Conference (ECAC)
1999 - Ratification of the Agreement between the EBRD and the Government of Ukraine concerning the
Ukrainian ANS Modernisation Project by Ukrainian Parliament
1999 - UkSATSE joined International Organisation Information Co-ordinating Council on Air Navigation
Charges (IKSANO)
1999 - Conclusion of Agreement between UkSATSE and the EUROCONTROL Central Flow Management
Unit (CFMU)
2000 - UkSATSE became the 33rd Member State of International Federation of Air Traffic Safety Electronics
Associations (IFATSEA)
2003 - UkSATSE initiates creation of the Regional Air Navigation Services Development Association (RADA)
2004 - Ukraine became the 33rd Member State of EUROCONTROL. Experts of UkSATSE are fully engaged in
EUROCONTROL activities
2005 - Contract between SELEX Sistemi Integrati S.p.A. (Italy) and UkSATSE for Supply and Installation of
Approach Radars (Dnipropetrovs'k, Kyiv, L'viv, Odesa, Simferopol')
2006 - Ukraine hosted NATO Air Traffic Management Committee (NATMC) Plenary Session

            Name                         Date of Founding                           Date of Entrance

                       International aviation organisations, where Ukraine is a member
            ICAO                                1944                                     1992
         ECAC                                   1954                                     1999
     EUROCONTROL                                1963                                     2004
                  International aviation organisations, where UkSATSE is a member
           IFATCA                           1961                                1994
            ATCA                                1956                                     1997
           CANSO                                1998                                     1998
          IKSANO                                1999                                     1999
          IFATSEA                               1972                                     2000

      Education
Aviation degree in Ukraine can be obtained in three aviation universities. Kyiv National Aviation University is
recognized as a leader of higher aviation education in Ukraine. Kyiv Aviation University cooperates closely
with Civil Aviation authorities across the world and even has a special ICAO institute in its structure.
Kirovograd flight academy is famous for pilot training and Kharkov Aerospace academy is recognized for
preparing best specialists in the fields of space research, aircraft manufacturing and aeronautical engineering.
Kharkov University is closely connected to the industry.
National Aviation Policy
Ukraine, with a large power-consuming economy and correspondingly high emissions of greenhouse gases, is
committed to the prevention of global climate change.
The primary task of the Government of Ukraine is to create and implement a national policy directed to fulfill
the obligations of Ukraine within the framework of the international treaties.
The major legislative document of Ukraine in aviation activity is Air Code of Ukraine in force since 19 May
2011 № 3393VI which regulates among other questions the question of environmental protection. This chapter
include requirements about:
- Maximum acceptable level of aviation noise, air engine emissions established by the Aviation Rules of
Ukraine.
- Compensation for damage caused as result of the aviation activity.
- Limitations and prohibitions for civil aircraft if they exceed noise levels established by the Civil Aviation
Authority.
- Limitations and prohibitions taking account taking account of measures aimed to reduction of noise levels
at the airport and in its vicinity including:
- Technical noise reduction at the source.
- Space zoning of the airport adjacent territory and a proper zone planning.
- Operational measures to reduce aircraft noise and emissions.
- The cost of the measures aimed at reduction and prevention in noise and emissions shall be funded by
airport taxes taking account ICAO recommendations.
Other Laws of Ukraine in environmental field:
- "About atmospheric air protection", from 16.10.1992, № 2708-XII
- "About ecological expertise", from 09.02.1995, № 46/95-ВР
- "About sanitary and epidemiological population welfare ", from 24.02.1994, № 4005-XII
- "About environmental protection", from 26.06.1991, № 1268-XII
- “About high danger objects”, from 15.05.2003, № 762-IV
- “About main strategy in state ecological policy of Ukraine for 2020 year”from 21.12.2010 № 2818-VI
Convention on International Civil Aviation, signed at Chicago on 7 December 1944, hereinafter referred to as
the Chicago, ratified by Ukraine on 10 August1992, Ukraine has the obligation to implement and enforce such
provisions of Convention, as well as standards set out in annexes.
United Nations Framework Convention on Climate Change, ratified by Verkhovna Rada of Ukraine on 29
October, 1996. The objective of the treaty is to stabilize greenhouse gas concentrations in the atmosphere at a
level that would prevent dangerous anthropogenic interference with the climate system. Ukraine corresponds to
Annex I countries which have ratified the Protocol have committed to reduce their emission levels of
greenhouse gasses to targets that are mainly set below their 1990 levels. They may do this by allocating reduced
annual allowances to the major operators within their borders. Ukraine adopted list of regulations concerning
prevention of climate change. Among them Law of Ukraine "About atmospheric air protection" from
16.10.1992, № 2708-XII.
Kyoto Protocol to the United Nations Framework Convention on Climate Change, adopted by Ukraine on 04
February, 2004.
Committee on Aviation Environmental Protection. ICAO's current environmental activities are largely
undertaken through the Committee on Aviation Environmental Protection (CAEP), which was established by
the Council in 1983, superseding the Committee on Alircraft Noise (CAN) and the Committee on Aircraft
Engine Emissions (CAEE).
CAEP assists the Council in formulating new policies and adopting new Standards on aircraft noise and aircraft
engine emissions.
Ukraine is a member of CAEP and took active part in working groups and steering groups.
National Airlines network
List of national airlines that include carriers executing regular and charter flights
        №                                                      Operator
   1.             Limited Liability Company “Kharkiv Airlines”
   2.             Privet Enterprise PoltavAvia
   3.             Limited Liability Company “Wind Rose” Aviation Company
   4.             Limited Liability Company “Aircompany “Meridian”, Ltd
   5.             Private joint-stock company “Bukovyna” airlines”
   6.             Limited Liability Company “Aircompany “ZetAvia”
   7.             Limited Liability Company “Ukrainian Airlines company “AEROSTAR”
   8.             Private Corporation “International Joint-Stock Aviation Company “Urga”
   9.             Limited Liability Company Wizz Air Ukraine Airlines LLC
   10.            Flight School CONDOR LLC
   11.            SE “Production Association Yuzhny Machine–Building Works named after O.M. Makarov”
                  Aviation Transport Company “YUZMASHAVIA”
   12.            Limited Liability Company “Atlasjet Ukraine”
   13.            Limited Liability Company “Europa Air”
   14.            Antonov Company
   15.            Joint Stock Company “Aviation Company “Dniproavia”
   16.             “DART” Limited Liability Company
   17.            Private Stock Company “Ukraine International Airlines”
   18.            Private Joint Stock Company “Airline ”Ukraine-AirAlliance
   19.            State Air Enterprise “Ukraine”
  20.            Limited Liability Company “Maximus Airlines”
  21.            Public Liability Company Motor Sich JSC
  22.            Avia Styl Private Joint Stock Company
  23.            Anda Eir Limited liability company
  24.            Limited Liability Company “Shovkoviy Shlyah” Ltd
  25.            State enterprise KHORIV-AVIA
  26.            Limited Liability Company Bravo Airways
  27.            Limited Liability Company “Aircompany ”ISD Avia” Ltd
  28.            YanEir LTD
  29.            Aircompany Prominterservice Limited Liability Company
  30.            Limited Liability Company “CAVOK AIR”
  31.            Limited Liability Company AEROJET LTD
  32.            “Aircompany Constanta” Private Joint-Stock Company
  33.            NikolaevAir Limited Liability Company
  34.            Private joint-stock company “Air Columbus”
  35.            Kremenchuk Flight College of National Aviation University
  36.            Kharkiv Aeroclub named after V.S. Grizodubova of DSS of Ukraine
  37.            Joint Stock Company “Aviation Company “Dniproavia”
  38.            State Aviation Company “Kherson-Avia”
  39.            Air Alanna Limited Liability Company
  40.            Kirovograd Flight Academy of the National Aviation University
  41.            Limited Liability Company Aviation-Transport Agency “Kroonk” Ltd
  42.            Ukrainian State Air Traffic Service Enterprise
  43.            Limited liability company “Aircompany “Rosavia”
44. “Air company BORA 45. Limited Liability Company “Prostor Avia” Ltd 46. Association with limited liability “Breeze” Ltd 47. Private Joint Stock Company “Aviation Company “Ukrainian helicopters” 48. Enterprise “Aviation company “AgroaviaDnipro” 49. Limited Partnership Production Commercial Firm “Ukraviatechservis” 50. Aerovis Airlines LTD 51. Private Enterprise “Proskuriv-Avia” 52. Limited Partnership “Turaerodan” 53. Limited Liability Company Challenge Aero Ukraine LLC 54. “Global Air Company” Limited Liability Partnership 55. Private Enterprise “Yunikom Avia” 56. Enterprise aviation company AgroaviaDnipro 57. Limited Liability Company “YugAvia” LLC 58. Vulkan AIR Limited Liability Company 59. Azur Air Ukraine Limited Liability Company 60. Aircompany Khors Limited Liability Company 61. Atlasjet Ukraine Limited Liability Company 62. Europe Air Limited Liability Company 63. Alpha Air Limited Liability Company 64. Anda Air Limited Liability Company 65. Ukrainian Wings Limited Liability Company 66. Skyaviatrans Limited Liability Company
National Airports network of Ukraine

Institutionally 18 airports are independent bodies, 2 airports are state-owned enterprises, 14 are municipal
enterprises, 4 are community property enterprises.

            #       AIRPORTS
     1       International airport "Borispol"              State
     2       International airport "Dnipropetrovsk"        community property
     3       International airport "Kiev" (Zhuliany)       municipal
     4       International airport "Ivano-Frankivsk"       community property
     5       International airport "Krivyi Rig"            municipal
     6       International airport "Lviv"                  State
     7       International airport "Zaporizhzhia"          municipal
     8       Airport Zhitomir                              community property
     9       International airport "Odessa"                municipal
     10      International airport "Chernivtsi"            municipal
     11      International airport "Rivne"                 municipal
     12      International airport "Kharkiv"               community property
     13      Airport "Sumy"                                municipal
     14      Airport "Ternopil"                            municipal
     15      Airport "Vinnitsa" (Havryshivka)              municipal
     16      Airport "Cherkasy"                            municipal
     17      Airport "Poltava"                             Municipal
     18      Airport Kherson                               Municipal
     19      Airport Uzhhorod                              Municipal
Economic information related to the contribution of international aviation
In recent years there has been a significant reduction in the basic performance of the aviation
industry. The main factors that led to the demand decline for air travel and caused consequent
breakdown of the current economic situation in general are the next : military-political situation in the
state, annexation of the Crimea, safety recommendations from the international organizations and the
EU regarding avoidance of that area of Ukraine using alternative airspace routes. Several national
airports not working during the year and many airlines have significantly reduced their route network.
During the reporting year, 29 airlines operated on the market of passenger and cargo air transportation,
of which 19 carried passenger transport.
The number of passengers carried increased by 99.3% compared to the previous year and
amounted to 16498.9 thousand pax, which indicates the restoration of the Ukrainian market of
passenger air services after the decline of 2014-2015.
According to the results of 2017, 95 percent of the total passenger traffic was made by 6 leading
airlines: Ukraine International Airlines, Azur Air Ukraine, Wind Rose, Yanyeir, Bravo and Atlas
Ukraine.
Volumes of cargo and mail shipment fell by 29.6 percent and amounted to 52.3 thousand tons.
Transportation of goods and mail carried by 18 domestic airlines, most of the transport - is charter
flights to other states within the framework of UN humanitarian and peaceful programs, as well as
contracts and agreements with other customers.
Commercial flights of domestic and foreign airlines served 19 Ukrainian airports and airfields.
It should be noted that today, about 98 percent of total passenger traffic and mail traffic are
concentrated in 7 leading airports - Boryspil, Kiev (Zhulyany), Odessa, Lviv, Kharkiv, Dnipropetrovsk
and Zaporizhzhya.
CO2 EMISSIONS INVENTORIES, FORECASTS AND BASELINE CALCULATION
INTERNATIONAL AVIATION CO2 EMISSIONS INVENTORIES
Ukraine ratified the United Nations Framework Convention on Climate Change on 29 October, 1996
as an Annex I country. One of the commitments of parties to the Convention is to compile national
inventories of their emissions sources.
For domestic flights, emissions are considered to be part of the national inventory of the country within
which the flights occur. For international flights, inventories are also calculated and reported to
UNFCCC under the terminology "emissions from international aviation bunker fuels".
Ukraine also adopted Kyoto Protocol to the United Nations Framework Convention on Climate
Change, on 2004.
Due to this, the calculation of the Baseline for Ukraine has been based on the available information on
National Inventories reported to UNFCCC, and provided by the Ministry of Ecology and Natural
Resources of Ukraine. The methodology used for the calculation of those inventories follows the IPCC
2006 Guidelines for National Greenhouse Gas Inventories.
As Ukraine has established this systematic way to estimate, report and verify GHG emissions, those
procedures will be used to ensure that the estimation, reporting and verification of CO2 emissions in its
action plan is undertaken in accordance with the ICAO Guidance on States Action Plans Appendix E
recommendations.
CO2 EMISSIONS INVENTORIES METHODOLOGY (UNFCCC)
Emissions estimation was conducted separately for aircraft with jet and turboprop engines, which use jet
fuel, and equipped with piston engines, which use aviation kerosene.
13For aircraft emissions estimation equipped with jet and turboprop engines, was used method correspond to the Tier 3a of the IPCC sectoral approach. The next tendencies directly affecting the level of aircraft emissions were observed. In the period of 2001-2004 there was a dramatic increase of the number of domestic flights, and in 2008- 2009 dramatic fall, caused by decline of business activity. This led to corresponding changes in the level of CO2 emissions. At the same time there have been changes in the structure of the fleet, which operates domestic flights. Since 2000, there has been a constant renewal of USSR-produced aircraft (AN-24, AN- 26, Yak-40, Yak-42) on modern aircrafts (Embraer, Boeing, Airbus), which in 2000 year was made more than 95% of all domestic flights and in 2010 performed about 50% of all domestic flights. In recent years there has been a significant reduction in the basic performance of the aviation industry. The main factors that led to the demand decline for air travel and caused consequent breakdown of the current economic situation in general are the next: military-political situation in the state, annexation of the Crimea, safety recommendations from the international organizations and the EU regarding avoidance of that area of Ukraine using alternative airspace routes. Several national airports not working during the year and many airlines have significantly reduced their route network. Separation of aircraft emission Emissions from domestic aviation include all emissions from aircraft flights, departure and arrival airports of which located on the territory of Ukraine. Emissions from international aviation include emissions from the flights where departure airports are located in the territory of Ukraine, and the destination airport - outside Ukraine. Calculation of aircraft emissions It was used data based on departures of aircrafts from airports situated on the territory of Ukraine. Data about flight include next information according to each flight: - date and time of flight; - depart and destination points; - air company; - aircraft code by ICAO. Assessment of aircraft emissions was making in 2 steps: preliminary data processing and aircraft emissions calculation. Estimation of aircraft emissions has been produced in accordance with the detailed methodology EMEP/CORINAIR, which correspond to the Tier 2b. Fuel consumption: Fuel consumption cycle per LTO cycle taken according to the methodology EMEP / CORINAIR, and fuel consumption at cruise was calculated according to the flight length. The length of the flight was defined as orthodromic distance between departure and destination points, taking into account the deflection coefficient of the actual flight path and orthodromic. Deflection coefficient was taken as 1.095. For recalculation of jet fuel consumption from mass units into energy units, as shown in the methodology EMEP / CORINAIR, it used low-value calorific capacity equal to 44.59 MJ / kg. Calculation of CO2 emissions: Coefficient of СО2 emissions for reactive fuel was taken as 19,5 tonne С/ТJ.
INTERNATIONAL BUNKERS AND MULTILATERAL OPERATIONS

Last data from the Ukrainian National Inventory reported to UNFCCC:

              Year       Greenhouse Gas        Aggregate           Implied Co2        Co2
                             Source         Consumption Data      Emission Factor   Emissions
                                                  (TJ)                (t/TJ)         (Gg)
              1990        Jet Kerosene          33 118,66             71,50         2 367,98
              1991        Jet Kerosene          28 596,93             71,50         2 044,68
              1992        Jet Kerosene          24 075,20             71,50         1 721,38
              1993        Jet Kerosene          19 553,47             71,50         1 398,07
              1994        Jet Kerosene          15 031,74             71,50         1 074,77
              1995        Jet Kerosene          10 510,02             71,50          751,47
              1996        Jet Kerosene           5 988,29             71,50          428,16
              1997        Jet Kerosene           5 809,65             71,50          415,39
              1998        Jet Kerosene           5 548,23             71,50          396,70
              1999        Jet Kerosene           5 082,83             71,50         363,42
              2000        Jet Kerosene           5 036,98             71,50         360,14
              2001        Jet Kerosene           5 059,46             71,50         361,75
              2002        Jet Kerosene           5 696,22             71,50         407,28
              2003        Jet Kerosene           6 650,57             71,50         475,52
              2004        Jet Kerosene           8 062,97             71,50         576,50
              2005        Jet Kerosene           8 923,37             71,50         638,02
              2006        Jet Kerosene          10 529,95             71,50         752,89
              2007        Jet Kerosene          11 944,43             71,50         854,03
              2008        Jet Kerosene          13 057,95             71,50         933,64
              2009        Jet Kerosene          11 457,15             71,50         819,19
              2010        Jet Kerosene          12 478,25             71,50         892,19
              2011        Jet Kerosene          11 097,27             71,50         793,44
              2012        Jet Kerosene          10 242,71             71,50         732,35
2 500 000,00
CO2 emissions trend
2 000 000,00
1 500 000,00
1 000 000,00
500 000,00
0,00
199019921994199619982000200220042006200820102012
TOTAL CO2 EMISSIONS
YEAR Domestic aviation International aviation TOTAL
СО2 emissions, Gg СО2 emissions, Gg
1990 781,30 2367,98 3149,28
1991 597,92 2044,68 2642,60
1992 454,03 1721,38 2175,41
1993 343,18 1398,07 1741,25
1994 259,31 1074,77 1334,08
1995 197,50 751,47 948,97
1996 146,14 428,16 574,30
1997 116,23 415,39 531,62
1998 115,07 396,70 511,77
1999 107,68 363,42 471,10
2000 101,04 360,14 461,18
2001 102,06 361,75 463,81
2002 119,09 407,28 526,37
2003 158,46 475,52 633,98
2004 185,45 576,50 761,95
2005 176,06 638,02 814,08
2006 197,16 752,89 950,05
2007 213,06 854,03 1067,09
2008 210,08 933,64 1143,72
2009 143,98 819,19 963,17
2010 141,55 892,19 1033,74
2011 223,46 793,44 1 016,90
2012 222,05 732,35 954,403 500 000,00 CO2 Emissions Ukraine Data
Tn CO2
3 000 000,00
internat
ional…
2 500 000,00
2 000 000,00
1 500 000,00
1 000 000,00
500 000,00
0,00
1990 1992 1994 1996 1998 2000 2002 2004 2006 2008 2010 2012
TRAFFIC FORECASTS
Annual IFR Movements and 2011-2021 average annual growth.
2011 2012 2013 2014 2015 2016 2017 2018 2019 2020 2021 AAG
R
2021/
2014
H - - - - 135 133 147 163 178 194 211 -5,5%
B 453 466 494 312 132 128 138 149 160 171 183 -7,4%
L - - - - 130 122 128 136 144 151 158 -9,2%
Annual growth rates and 2011-2021 average annual growth.
2011 2012 2013 2014 2015 2016 2017 2018 2019 2020 2021 AAGR
2021/
2014
H - - - - -57% - 11,0 10% 9,4 9,2 8,3 -5,5%
1,6% % % % %
B 5,5% 2,9 6,0 -37% -58% - 8,0 8,2 7,3 7,2 6,5 -7,4%
% % 3,5% % % % % %
L - - - - - - 5% 6,2 5,4 5,3 4.7 -9,2%
5,8% 5,8% % % % %
Source: EUROCONTROL (Feb. 2015)
BASELINE CALCULATION AND EXPECTED RESULTSThe State Aviation Administration of Ukraine has decided to calculate a Baseline as a suitable element
of its action plan, to estimate the levels of fuel consumption, CO2 emissions, and air traffic (expressed in
RTK) that can be expected in the time horizons of 2020 and 2025. Such “business as usual” scenario
will be used as the reference to estimate the expected results once the measures identified on the Action
Plan are implemented and will represent the projected fuel consumption and CO2 emissions willing to
reach as results.
To calculate the baseline for the evaluation of the Action Plan measures, it has been estimated an
average year growth of air traffic (RTK) of 5,3% from 2010-2020 and 4,5% from 2020 to 2025 taken
from the EUROCONTROL forecasts included in the previous paragraph.
Methodological approach
The baseline calculation is based on the extrapolation of past trend data in order to determine future
levels of fuel consumption and traffic, and through the calculation of a Fuel Efficiency Metric, following
the recommendations of the ICAO Guidance Material for the Development of States Action Plans.
Historic data sources:
Historic data from fuel consumption have been taken from the official National Emissions Inventory, as
described above.
Historic Traffic data expressed in RTK have been taken from the ICAO database provided through the
APER Website.
Fuel efficiency metric:
Following the ICAO Guidance, the fuel efficiency metric expresses the rate of efficiency improvement
over time, and its calculation is based on the following metric:
Fuel efficiency = Volume of fuel/RTK (1)
This metric is an indicator of the efficiency of fuel usage (in liters) per tonne of revenue load carried
(passengers, freight and mail).
METHOD 3 OF ICAO GUIDANCE
Following ICAO Guidance Method 3, the baseline for Ukraine has been calculated as follows:
1. Getting fuel consumption data (volume of fuel) and traffic (RTK) for the latest available years.
2. Determining the RTK future scenarios by considering EUROCONTROL Ukrainian forecasts.
3. Determining the projected volume of fuel for the 2010-2025 scenarios, assuming the same
growth rate as for the RTK as follows:
Volume of fuel year n+1 = Volume of fuel year n x (1 + RTK growth)
Such methodology is equivalent to apply the following formula:
Volume of fuel year n+1= efficiency factor year n* RTK year n+1
To estimate CO2 emissions expressed in Kg from fuel consumption expressed in L, a 0’8 Kg/L density
has been considered.
Then the expected results will be estimated though subtracting the fuel gains due to additional measures
to the projected fuel consumption.
On the following tables, the baseline calculation results for both international and total fuel and CO2
emissions are presented.ICAO GUIDANCE METHOD 3 BASELINE CALCULATION FOR UKRAINE:
INTERNATIONAL FUEL CONSUMPTION (L) AND EMISSIONS (Kg CO2)
INTERNATIONAL
TRAFFIC YEAR Efficiency Kg
l Fuel RTK
FORECAST factor CO2
1990 937589480,98 2367983857,79
1991 809579320,41 2044680322,48
1992 681569159,83 1721376787,17
1993 553558999,26 1398073251,86
1994 425548838,69 1074769716,55
1995 297538678,12 751466181,24
1996 169528517,54 428162645,93
1997 164471246,66 415389960,17
1998 157070458,28 396698466,96
1999 143894984,92 363422380,92
2000 142596898,65 169711000,00 0,84023 360143923,36
2001 143233302,30 179197000,00 0,79931 361751229,74
2002 161260007,82 176824000,00 0,91198 407279628,43
2003 188277627,95 266708000,00 0,70593 475515556,44
2004 228262656,79 538749000,00 0,42369 576502080,68
2005 252620569,70 772859000,00 0,32687 638020629,86
2006 298103052,02 894011000,00 0,33344 752891568,71
2007 338146812,07 1078059000,00 0,61920 854026424,99
2008 369670574,77 1203276000,00 0,58585 933643104,50
2009 324352159,57 1268003000,00 0,60690 819186534,93
5,30% 2010 353259388,59 659 728 283,00 0,53546 892191911,81
2011 314163830,28 941 321 646,00 0,33375 793452169,75
2012 289971227,70 1 002 460 838,00 0,28926 732351332,68
2013 204044379,25 705 402 743,00 515334484,23
2014 200167509,75 692 000 000,00 505543062,64
-58,00% 2015 84070354,10 290 640 000,00 212328086,31
-3,50% 2016 81127891,70 280 467 600,00 204896603,29
8,00% 2017 87618123,04 302 905 008,00 221288331,55
8,20% 2018 94802809,13 327 743 218,66 239433974,74
7,30% 2019 101723414,20 351 668 473,62 256912654,89
7,20% 2020 109047500,02 376 988 603,72 275410366,05
6,50% 2021 116135587,52 401 492 862,96 293312039,845,10% 2022 122058502,48 421 968 998,97 308270953,87
2023 128283486,11 443 489 417,92 323992772,52
2024 134825943,90 466 107 378,23 340516403,92
2025 141702067,04 489 878 854,52 357882740,52
TOTAL FUEL CONSUMPTION (L) AND EMISSIONS (Kg CO2)
TOTAL
TRAFFIC YEAR Efficiency Kg
l Fuel RTK
FORECAST factor CO2
1990 1.253.570.808,76 3.166.018.435
1991 1.051.050.179,16 2.654.532.332
1992 864.639.226,18 2.183.732.830
1993 691.682.537,23 1.746.913.416
1994 529.707.437,40 1.337.829.104
1995 376.684.391,49 951.354.099
1996 227.934.945,64 575.672.499
1997 210.781.075,04 532.348.683
1998 202.749.280,48 512.063.583
1999 186.582.480,61 471.232.713
2000 182.631.282,99 184.586.000,00 0,98941 461.253.568
2001 183.681.857,73 195.209.000,00 0,94095 463.906.900
2002 208.457.269,78 190.424.000,00 1,09470 526.479.681
2003 251.053.205,65 288.817.000,00 0,86925 634.059.976
2004 301.762.175,29 588.180.000,00 0,51304 762.130.550
2005 322.528.267,45 827.229.360,00 0,38989 814.577.392
2006 376.429.744,44 935.686.000,00 0,40230 950.710.963
2007 422.689.385,69 581 105 187,00 0,72739 1.067.544.313
2008 452.939.714,20 655 000 000,00 0,69151 1.143.944.542
2009 381.370.433,69 596 000 000,00 0,63988 963.189.167
5,30% 2010 409 338 031,36 703 000 000,00 0,58227 1 033 824 132
2011 401 418 072,97 992 000 000,00 0,40466 1 013 821 485
2012 376 636 412,20 1 062 000 000,00 0,35465 951 232 923
2013 272 015 186,59 767 000 000,00 687 001 555
2014 254 637 423,69 718 000 000,00 643 112 277
-58,00% 2015 106 947 717,95 301 560 000,00 270 107 156
-3,50% 2016 103 204 547,82 291 005 400,00 260 653 406
8,00% 2017 111 460 911,65 314 285 832,00 281 505 678
8,20% 2018 120 600 706,40 340 057 270,22 304 589 144
7,30% 2019 129 404 557,97 364 881 450,95 326 824 1527,20% 2020 138 721 686,15 391 152 915,42 350 355 491
6,50% 2021 147 738 595,74 416 577 854,92 373 128 597
5,10% 2022 155 273 264,13 437 823 325,52 392 158 156
2023 163 192 200,60 460 152 315,12 412 158 222
2024 171 515 002,83 483 620 083,19 433 178 291
2025 180 262 267,97 508 284 707,44 455 270 384ECAC/EU
ECAC BASELINE SCENARIO AND ESTIMATED BENEFITS
OF IMPLEMENTED MEASURES
1. ECAC Baseline Scenario
The baseline scenario is intended to serve as a reference scenario for CO 2 emissions of
European aviation in the absence of any of the mitigation actions described later in this
document. The following sets of data (2010, 2016) and forecasts (for 2020, 2030 and 2040)
were provided by EUROCONTROL for this purpose:
European air traffic (includes all commercial and international flights departing from
ECAC airports, in number of flights, revenue passenger kilometres (RPK) and revenue
tonne-kilometres (RTK)),
its associated aggregated fuel consumption,
its associated CO2 emissions.
The sets of forecasts correspond to projected traffic volumes in a scenario of “Regulation and
Growth”, while corresponding fuel consumption and CO2 emissions assume the technology
level of the year 2010 (i.e. without considering reductions of emissions by further aircraft
related technology improvements, improved ATM and operations, alternative fuels or market
based measures).ECAC/EU
Traffic Scenario “Regulation and Growth”
As in all forecasts produced by EUROCONTROL, various scenarios are built with a specific
storyline and a mix of characteristics. The aim is to improve the understanding of factors that
will influence future traffic growth and the risks that lie ahead. In the 20 year forecasts
published by EUROCONTROL the scenario called ‘Regulation and Growth’ is constructed as
the ‘most likely’ or ‘baseline’ scenario for traffic, most closely following the current trends. It
considers a moderate economic growth, with some regulation particularly regarding the social
and economic demands.
Amongst the models applied by EUROCONTROL for the forecast the passenger traffic sub-
model is the most developed and is structured around five main group of factors that are taken
into account:
Global economy factors represent the key economic developments driving the
demand for air transport.
Factors characterizing the passengers and their travel preferences change patterns in
travel demand and travel destinations.
Price of tickets set by the airlines to cover their operating costs influences passengers’
travel decisions and their choice of transport.
More hub-and-spoke or point-to-point networks may alter the number of connections
and flights needed to travel from origin to destination.
Market structure describes size of aircraft used to satisfy the passenger demand
(modelled via the Aircraft Assignment Tool).
Table 1 presents a summary of the social, economic and air traffic related characteristics of
three different scenarios developed by EUROCONTROL. The year 2016 serves as the
baseline year of the 20-year forecast results2 updated in 2018 by EUROCONTROL and
presented here. Historical data for the year 2010 are also shown later for reference.
2 Challenges of Growth 2018: Flight forecast, EUROCONTROL September 2018 (to be published)ECAC/EU
Table 1. Summary characteristics of EUROCONTROL scenarios:
Global Growth Regulation and Fragmenting World
Growth
2023 traffic growth High Base Low
Passenger
Aging Aging Aging
Demographics
UN Medium-fertility UN Medium-fertility UN Zero-migration
(Population)
variant variant variant
Routes and
Long-haul No Change Long-haul
Destinations
EU enlargement later EU enlargement EU enlargement
Open Skies
+Far & Middle-East Earliest Latest
High-speed rail 20 city-pairs
20 city-pairs 20 city-pairs
(new & improved faster
later implementation.
connections) implementation
Economic
conditions Stronger Moderate Weaker
GDP growth
EU Enlargement +5 States, Later +5 States, Earliest +5 States, Latest
Free Trade
Global, faster Limited, later None
Price of travel
Operating cost Decreasing Decreasing No change
Price of CO2 in
Emission Trading Moderate Lowest Highest
Scheme
Price of oil/barrel Low Lowest High
Change in other Noise: Noise: Noise:
charges Security: Security: Security:
Structure Hubs: Mid-East
Hubs: Mid-East No change
Network Europe Turkey
Europe&Turkey
Pt-to-pt: N-
Pt-to-pt: N-Atlant.
Atlant.
Industry fleet Industry fleet Industry fleet forecast
Market Structure forecast + forecast + + STATFOR
STATFOR STATFOR assumptions
assumptions assumptionsECAC/EU
Further assumptions and results for the baseline scenario
The ECAC baseline scenario was generated by EUROCONTROL for all ECAC States. It
covers all commercial international passenger flights departing from ECAC airports, as
forecasted in the aforementioned traffic scenario. The number of passengers per flight is
derived from Eurostat data.
EUROCONTROL also generates a number of all-cargo flights in its baseline scenario.
However, no information about the freight tonnes carried is available. Hence, historical and
forecasted cargo traffic have been extracted from another source (ICAO 3). This data, which is
presented below, includes both belly cargo transported on passenger flights and freight
transported on dedicated all-cargo flights.
Historical fuel burn and emission calculations are based on the actual flight plans from the
PRISME data warehouse used by EUROCONTROL, including the actual flight distance and
the cruise altitude by airport pair. These calculations were made for 98% of the passenger
flights; the remaining flights in the flight plans had information missing. Determination of the
fuel burn and CO2 emissions for historical years is built up as the aggregation of fuel burn and
emissions for each aircraft of the associated traffic sample. Fuel burn and CO 2 emission
results consider each aircraft’s fuel burn in its ground and airborne phases of flight and are
obtained by use of the EUROCONTROL IMPACT environmental model. While historical
traffic data is used for the year 2016, the baseline fuel burn and emissions in 2016 and the
forecast years (until 2040) are modelled in a simplified approach on the basis of the
historical/forecasted traffic and assume the technology level of the year 2010.
The following tables and figures show the results for this baseline scenario, which is intended
to serve as a reference case by approximating fuel consumption and CO2 emissions of
European aviation in the absence of mitigation actions.
Table 2. Baseline forecast for international traffic departing from ECAC airports
Passenger Revenue Freight Tonne Total Revenue
Passenger All-Cargo Kilometres Tonne
Traffic
Traffic (IFR
Year (IFR Kilometres4 movements) transported5 Kilometres14,6
movements) RPK FTKT RTK
(million)
(million) (billion) (billion) (billion)
2010 4.6 1,218 0.20 45.4 167.2
2016 5.2 1,601 0.21 45.3 205.4
2020 5.6 1,825 0.25 49.4 231.9
2030 7.0 2,406 0.35 63.8 304.4
2040 8.4 2,919 0.45 79.4 371.2
Table 3. Fuel burn and CO2 emissions forecast for the baseline scenario
3 ICAO Long-Term Traffic Forecasts, Passenger and Cargo, July 2016.
4 Calculated based on 98% of the passenger traffic.
5 Includes passenger and freight transport (on all-cargo and passenger flights).
6 A value of 100 kg has been used as the average mass of a passenger incl. baggage (ref: ICAO).ECAC/EU
Fuel
CO2 emissions Fuel efficiency Fuel efficiency
Year Consumption
(109 kg) (kg/RPK) (kg/RTK)
(109 kg)
2010 37.98 120.00 0.0310 0.310
2016 46.28 146.26 0.0287 0.287
2020 49.95 157.85 0.0274 0.274
2030 61.75 195.13 0.0256 0.256
2040 75.44 238.38 0.0259 0.259
For reasons of data availability, results shown in this table do not include
cargo/freight traffic.
Figure 2. Forecasted traffic until 2040 (assumed both for the baseline and implemented
measures scenarios)ECAC/EU Figure 3. Fuel consumption forecast for the baseline and implemented measures scenarios (international passenger flights departing from ECAC airports) 2. ECAC Scenario with Implemented Measures, Estimated Benefits of Measures In order to improve fuel efficiency and to reduce future air traffic emissions beyond the projections in the baseline scenario, ECAC States have taken further action. Assumptions for a top-down assessment of effects of mitigation actions are presented here, based on modelling results by EUROCONTROL and EASA. Measures to reduce aviation’s fuel consumption and emissions will be described in the following chapters. For reasons of simplicity, the scenario with implemented measures is based on the same traffic volumes as the baseline case, i.e. EUROCONTROL’s ‘Regulation and Growth’ scenario described earlier. Unlike in the baseline scenario, the effects of aircraft related technology development, improvements in ATM/operations and alternative fuels are considered here for a projection of fuel consumption and CO2 emissions up to the year 2040. Effects of improved aircraft technology are captured by simulating fleet roll-over and considering the fuel efficiency improvements of new aircraft types of the latest generation (e.g. Airbus A320NEO, Boeing 737MAX, Airbus A350XWB etc.). The simulated future fleet of aircraft has been generated using the Aircraft Assignment Tool (AAT) developed collaboratively by EUROCONTROL, EASA and the European Commission. The retirement process of the Aircraft Assignment Tool is performed year by year, allowing the determination of the amount of new aircraft required each year. In addition to the fleet rollover, a constant annual improvement of fuel efficiency of 0.96% per annum is assumed to aircraft deliveries during the last 10 years of the forecast (2030-2040). This rate of
ECAC/EU

improvement corresponds to the ‘medium’ fuel technology scenario used by CAEP to
generate the fuel trends for the Assembly.
The effects of improved ATM efficiency are captured in the Implemented Measures
Scenario on the basis of efficiency analyses from the SESAR project. Regarding SESAR
effects, baseline deployment improvements of 0.2% in terms of fuel efficiency are assumed to
be included in the base year fuel consumption for 2010. This improvement is assumed to rise
to 0.3% in 2016 while additional improvements of 2.06% are targeted for the time period
from 2025 onwards 7. Further non-SESAR related fuel savings have been estimated to amount
to 1.2% until the year 2010, and are already included in the baseline calculations 8.
Regarding the introduction of sustainable alternative fuels, the European ACARE roadmap
targets described in section B chapter 2.1 of this document are assumed for the implemented
measures case. These targets include an increase of alternative fuel quantities to 2% of
aviation’s total fuel consumption in the year 2020, rising linearly to 25% in 2035 and 40% in
2050. An average 60% reduction of lifecycle CO2 emissions compared to crude-oil based JET
fuel was assumed for sustainable aviation fuels, which is in line with requirements from
Article 17 of the EU’s Renewable Energy Directive (Directive 2009/28/EC)9. The resulting
emission savings are shown in Table 6 and Figure 4 in units of equivalent CO 2 emissions on a
well-to-wake basis. Well-to-wake emissions include all GHG emissions throughout the fuel
lifecycle, including emissions from feedstock extraction or cultivation (including land-use
change), feedstock processing and transportation, fuel production at conversion facilities as
well as distribution and combustion10.
For simplicity, effects of market-based measures including the EU Emissions Trading
Scheme (ETS) and ICAO’s Carbon Offsetting and Reduction Scheme for International
Aviation (CORSIA) on aviation’s CO2 emissions have not been modelled explicitly in the
top-down assessment of the implemented measures scenario presented here. CORSIA aims
for carbon-neutral growth (CNG) of aviation, and this target is therefore shown in Figure 4 11.

Tables 4-6 and Figures 3-4 summarize the results for the scenario with implemented
measures. It should be noted that Table 4 shows direct combustion emissions of CO2
(assuming 3.16 kg CO2 per kg fuel), whereas Table 6 and Figure 4 present equivalent CO2
emissions on a well-to-wake basis. More detailed tabulated results are found in Appendix A.

Table 4. Fuel burn and CO2 emissions forecast for the Implemented Measures Scenario (new
aircraft technology and ATM improvements only)

7   See SESAR1 D72 “Updated Performance Assessment in 2016” document, November 2016, project
    B05, project manager: ENAIRE.
8   See SESAR1 D107 “Updated Step 1 validation targets – aligned with dataset 13”, project B.04.01,
    December 2014, project manager: NATS.
9   According to article 17 of the EU RED (Directive 2009/28/EC), GHG emission savings of at least 60%
    are required for biofuels produced in new installations in which production started on or after 1
    January 2017.
10   Well-to-wake CO2e emissions of fossil-based JET fuel are calculated by assuming an emission index
    of 3.88 kg CO2e per kg fuel (see DIN e.V., "Methodology for calculation and declaration of energy
    consumption and GHG emissions of transport services (freight and passengers)", German version EN
    16258:2012), which is in accordance with 89 g CO2e per MJ suggested by ICAO CAEP AFTF.
11   Note that in a strict sense the CORSIA target of CNG is aimed to be achieved globally (and hence not
    necessarily in each world region).
ECAC/EU
Fuel
CO2 emissions Fuel efficiency Fuel efficiency
Year Consumption
(109 kg) (kg/RPK) (kg/RTK)
(109 kg)
2010 37.98 120.00 0.0310 0.310
2016 46.24 146.11 0.0286 0.286
2020 49.03 154.93 0.0245 0.245
2030 57.38 181.33 0.0242 0.242
2040 67.50 213.30 0.0237 0.237
For reasons of data availability, results shown in this table do not include
cargo/freight traffic.
Table 5. Average annual fuel efficiency improvement for the Implemented Measures
Scenario (new aircraft technology and ATM improvements only)
Average annual fuel
Period
efficiency improvement (%)
2010-
-1.36%
2016
2016-
-1.40%
2020
2020-
-1.11%
2030
2030-
-0.21%
2040
Table 6. Equivalent (well-to-wake) CO2e emissions forecasts for the scenarios described in
this chapter
Well-to-wake CO2e emissions (109 kg)
%
Implemented Measures Scenario improvement
by
Year
Baseline Aircraft Acft. techn. and Implemented
Aircraft techn.
Scenario techn. ATM Measures
and ATM
improvements improvements + (full scope)
improvements
only alternative fuels
2010 147.3 NA
2016 179.6 179.6 179.4 179.4 -0.1%
2020 193.8 190.4 190.2 187.9 -3.0%ECAC/EU
2030 239.6 227.6 222.6 199.5 -16.7%
2040 292.7 267.7 261.9 214.8 -26.6%
For reasons of data availability, results shown in this table do not include cargo/freight traffic.
Note that fuel consumption is assumed to be unaffected by the use of alternative fuels.
Figure 4. Equivalent (well-to-wake) CO2 emissions forecast for the baseline and
implemented measures scenarios
As shown in Figures 3-4, the impact of improved aircraft technology indicates an overall
8.5% reduction of fuel consumption and CO2 emissions in 2040 compared to the baseline
scenario. Whilst the data to model the benefits of ATM improvements and sustainable
alternative fuels shown in Figure 4 may be less robust, they are nevertheless valuable
contributions to reduce emissions further. Overall fuel efficiency, including the effects of new
aircraft types and ATM-related measures, is projected to improve by 24% between 2010 and
2040.
Under the currently assumed aircraft and ATM improvement scenarios, the rate of fuel
efficiency improvement is expected to slow down progressively until 2040. Aircraft
technology and ATM improvements alone will not be sufficient to meet the post-2020 carbon
neutral growth objective of aviation, nor will the use of alternative fuels even if Europe’s
ambitious targets for alternative fuels are met. This confirms that additional action,
particularly market-based measures, are required to fill the gap.ECAC/EU
B. ACTIONS TAKEN COLLECTIVELY THROUGHOUT
EUROPE
1. AIRCRAFT-RELATED TECHNOLOGY DEVELOPMENT
2. ALTERNATIVE FUELS
3. IMPROVED AIR TRAFFIC MANAGEMENT AND
INRASTRUCTURE USE
4. ECONOMIC/MARKET-BASED MEASURES
5. EU INITIATIVES IN THIRD COUNTRIES
6. SUPPORT TO VOLUNTARY ACTIONSECAC/EU
1. AIRCRAFT-RELATED TECHNOLOGY DEVELOPMENT
1.1 Aircraft emissions standards (Europe's contribution to the development of the
aeroplane CO2 standard in CAEP)
European Member States fully supported the work achieved in ICAO’s Committee on
Aviation Environmental Protection (CAEP), which resulted in an agreement on the new
aeroplane CO2 Standard at CAEP/10 meeting in February 2016, applicable to new aeroplane
type designs from 2020 and to aeroplane type designs that are already in-production in 2023.
Europe significantly contributed to this task, notably through the European Aviation Safety
Agency (EASA) which co-led the CO2 Task Group within CAEP’s Working Group 3, and
which provided extensive technical and analytical support.
The assessment of the benefits provided by this measure in terms of reduction in European
emissions is not provided in this action plan. Nonetheless, elements of assessment of the
overall contribution of the CO2 standard towards the global aspirational goals are available in
CAEP.ECAC/EU
1.2 Research and development
Clean Sky is an EU Joint Technology Initiative (JTI) that aims to develop and mature
breakthrough “clean technologies” for air transport globally. By accelerating their
deployment, the JTI will contribute to Europe’s strategic environmental and social priorities,
and simultaneously promote competitiveness and sustainable economic growth.
Joint Technology Initiatives are specific large-scale EU research projects created by the
European Commission within the 7th Framework Programme (FP7) and continued within the
Horizon 2020 Framework Programme. Set up as a Public Private Partnership between the
European Commission and the European aeronautical industry, Clean Sky pulls together the
research and technology resources of the European Union in a coherent programme that
contributes significantly to the ’greening’ of global aviation.
The first Clean Sky programme (Clean Sky 1 - 2011-2017) has a budget of €1.6 billion,
equally shared between the European Commission and the aeronautics industry. It aims to
develop environmental friendly technologies impacting all flying-segments of commercial
aviation. The objectives are to reduce aircraft CO2 emissions by 20-40%, NOx by around 60%
and noise by up to 10dB compared to year 2000 aircraft.
What has the current JTI achieved so far?
It is estimated that Clean Sky resulted in a reduction of
aviation CO2 emissions by more than 32% with respect to
baseline levels (in 2000), which represents an aggregate of
up to 6 billion tonnes of CO2 over the next 35 years
This was followed up with a second programme (Clean Sky 2 – 2014-2024) with the
objective to reduce aircraft emissions and noise by 20 to 30% with respect to the latest
technologies entering into service in 2014. The current budget for the programme is
approximately €4 billion.
The two Interim Evaluations of Clean Sky in 2011 and 2013 acknowledged that the
programme is successfully stimulating developments towards environmental targets. These
preliminary assessments confirm the capability of achieving the overall targets at completion
of the programme.
Main remaining areas for RTD efforts under Clean Sky 2 are:
Large Passenger Aircraft: demonstration of best technologies to achieve the
environmental goals whilst fulfilling future market needs and improving the
competitiveness of future products.
Regional Aircraft: demonstrating and validating key technologies that will enable a
90-seat class turboprop aircraft to deliver economic and environmental performance
and a superior passenger experience.
Fast Rotorcraft: demonstrating new rotorcraft concepts (tilt-rotor and compound
helicopters) technologies to deliver superior vehicle versatility and performance.
Airframe: demonstrating the benefits of advanced and innovative airframe structures
(like a more efficient wing with natural laminar flow, optimised control surfaces,
control systems and embedded systems, highly integrated in metallic and advancedYou can also read