High Arctic aircraft measurements characterising black carbon vertical variability in spring and summer - Atmos. Chem. Phys
←
→
Page content transcription
If your browser does not render page correctly, please read the page content below
Atmos. Chem. Phys., 19, 2361–2384, 2019
https://doi.org/10.5194/acp-19-2361-2019
© Author(s) 2019. This work is distributed under
the Creative Commons Attribution 4.0 License.

High Arctic aircraft measurements characterising black carbon
vertical variability in spring and summer
Hannes Schulz1 , Marco Zanatta1 , Heiko Bozem2 , W. Richard Leaitch3 , Andreas B. Herber1 , Julia Burkart4,a ,
Megan D. Willis4,b , Daniel Kunkel2 , Peter M. Hoor2 , Jonathan P. D. Abbatt4 , and Rüdiger Gerdes1,5
1 AlfredWegener  Institute, Helmholtz Center for Polar and Marine Research, Bremerhaven, Germany
2 Instituteof Atmospheric Physics, Johannes Gutenberg-University, Mainz, Germany
3 Environment and Climate Change Canada, Toronto, Ontario, Canada
4 Department of Chemistry, University of Toronto, Toronto, Ontario, Canada
5 Physics & Earth Sciences, Jacobs University, Bremen, Germany
a now at: Aerosol Physics and Environmental Physics, University of Vienna, Vienna, Austria
b now at: Lawrence Berkeley National Laboratory, Chemical Sciences Division, Berkeley, CA, USA

Correspondence: Andreas B. Herber (andreas.herber@awi.de)

Received: 11 June 2018 – Discussion started: 14 June 2018
Revised: 3 January 2019 – Accepted: 18 January 2019 – Published: 22 February 2019

Abstract. The vertical distribution of black carbon (BC) par-      within specific levels of the cold and stably stratified, dome-
ticles in the Arctic atmosphere is one of the key parameters       like, atmosphere over the polar region. The associated his-
controlling their radiative forcing and thus role in Arctic cli-   tory of transport trajectories into each of these levels showed
mate change. This work investigates the presence and prop-         that the variability was induced by changing rates and effi-
erties of these light-absorbing aerosols over the High Cana-       ciencies of rBC import. Generally, the source areas affecting
dian Arctic ( > 70◦ N). Airborne campaigns were performed          the polar dome extended southward with increasing potential
as part of the NETCARE project (Network on Climate and             temperature (i.e. altitude) level in the dome. While the lower
Aerosols: Addressing Key Uncertainties in Remote Canadian          dome was mostly only influenced by low-level transport from
Environments) and provided insights into the variability of        sources within the cold central and marginal Arctic, for the
the vertical distributions of BC particles in summer 2014 and      mid-dome and upper dome during spring it was found that
spring 2015. The observation periods covered evolutions of         a cold air outbreak over eastern Europe caused intensified
cyclonic disturbances at the polar front, which favoured the       northward transport of air from a corridor over western Rus-
transport of air pollution into the High Canadian Arctic, as       sia to central Asia. This sector was affected by emissions
otherwise this boundary between the air masses largely im-         from gas flaring, industrial activity and wildfires. The devel-
pedes entrainment of pollution from lower latitudes. A total       opment of transport caused rBC concentrations in the second
of 48 vertical profiles of refractory BC (rBC) mass concen-        lowest level to gradually increase from 32 to 49 ng m−3 . In
tration and particle size, extending from 0.1 to 5.5 km altitude   the third level this caused the initially low rBC concentra-
were obtained with a Single-Particle Soot Photometer (SP2).        tion to increase from < 15 to 150 ng m−3 . A shift in rBC
   Generally, the rBC mass concentration decreased from            mass-mean diameter, from above 200 nm in the lower po-
spring to summer by a factor of 10. Such depletion was as-         lar dome dominated by low-level transport to < 190 nm at
sociated with a decrease in the mean rBC particle diameter,        higher levels, may indicate that rBC was affected by wet
from approximately 200 to 130 nm at low altitude. Due to the       removal mechanisms preferential to larger particle diame-
very low number fraction, rBC particles did not substantially      ters when lifting processes were involved during transport.
contribute to the total aerosol population in summer.              The summer polar dome had limited exchange with the mid-
   The analysis of profiles with potential temperature as ver-     latitudes. Air pollution was supplied from sources within the
tical coordinate revealed characteristic variability patterns      marginal Arctic as well as by long-range transport, but in

Published by Copernicus Publications on behalf of the European Geosciences Union.
2362                                                     H. Schulz et al.: Black carbon vertical variability in the polar dome

both cases rBC was largely depleted in absolute and relative       a dimming effect on the solar radiation reaching the surface.
concentrations. Near the surface, rBC concentrations were          The energy absorbed at higher levels is inefficiently mixed
< 2 ng m−3 , while concentrations increased to < 10 ng m−3         downward and atmospheric stability is even increased; thus
towards the upper boundary of the polar dome. The mass             BC-containing aerosol can cause a net cooling effect at the
mean particle diameter of 132 nm was smaller than in spring;       surface (MacCracken et al., 1986). On the other hand, ther-
nonetheless the summer mean mass size distribution resem-          mal radiation from absorbed solar light in the lower parts of
bled the spring distribution from higher levels, with depletion    the atmosphere can actually contribute efficiently to surface
of particles > 300 nm.                                             warming. Reflections from the bright, high-albedo ice and
   Our work provides vertical, spatial and seasonal informa-       snow surfaces in the Arctic increase the amount of energy
tion of rBC characteristics in the polar dome over the High        absorbed by aerosols like BC. Aerosol particles are removed
Canadian Arctic, offering a more extensive dataset for evalu-      from the atmosphere by sedimentation as well as nucleation,
ation of chemical transport models and for radiative forcing       impaction and below-cloud scavenging (e.g. Kondo et al.,
assessments than those obtained before by other Arctic air-        2016). The result within the Arctic is likely a deposition of
craft campaigns.                                                   BC in ice and snow that can darken the otherwise highly
                                                                   reflective surfaces (Flanner et al., 2009; Tuzet et al., 2017,
                                                                   and references therein). Studies (e.g. Hansen and Nazarenko,
                                                                   2004; Flanner et al., 2007) suggest that an albedo decrease
1   Introduction                                                   due to deposition can offset the cooling effect through dim-
                                                                   ming by higher atmospheric aerosol, but the balance of these
Climate change in the Arctic is more rapid than on global          effects in the Arctic can only be estimated in models as ac-
scale and a significant loss of the summertime sea-ice extent      curately as vertical distributions of BC are known. However,
has been observed over recent decades (e.g. Lindsay et al.,        profiles of BC concentration show a spread of more than 1 or-
2009). The fast progression of change is largely a result of the   der of magnitude amongst different state-of-the-art models as
ice-albedo and temperature feedback (Screen and Simmonds,          well as between models and observations (AMAP, 2015).
2010; Pithan and Mauritsen, 2014). The driving agents of              Consequently, in order to provide accurate radiative forc-
Arctic warming, however, still remain unclear. Recent stud-        ing estimation in the Arctic region, it is necessary to un-
ies suggest that next to CO2 , short-lived climate forcers con-    derstand what controls the vertical distribution of BC par-
tribute significantly to the observed warming, but their com-      ticles in the Arctic atmosphere. Import of polluted air from
plex interactions with the Arctic climate system cause high        lower latitudes is controlled by the cold air mass that lies
uncertainties (Quinn et al., 2008; Shindell et al., 2012; Yang     over the Arctic like a dome with sloping isentropes, the iso-
et al., 2014; AMAP, 2015; Sand et al., 2015). Black car-           lines of potential temperature (Barrie, 1986; Klonecki et al.,
bon (BC) particles, emitted during incomplete combustion           2003). The polar dome’s vertical temperature structure forces
of fossil fuels and biomass, are the major light-absorbing         warmer air from lower latitudes to ascend along those isen-
component of atmospheric aerosol. Bond et al. (2013) con-          tropic surfaces when transported into the colder high-latitude
cluded that atmospheric BC’s interaction with solar radiation      polar region, reaching it in layers in the middle and upper
induces a global radiative forcing of +0.71 W m−2 , with an        troposphere (Stohl, 2006). The polar front between the cold
uncertainty range of +0.08 up to +1.27 W m−2 . BC may also         polar and the warmer mid-latitude air masses, a strong hor-
affect the distribution, lifetime, and microphysical properties    izontal temperature gradient, acts as transport barrier that is
of clouds when particles act as cloud condensation nuclei          controlling the intrusion of polluted air from southern source
(e.g. Chen et al., 2010) or, in BC-loaded atmospheric layers,      regions into the Arctic (see Bozem et al., 2019). Emissions
cloud properties can change as adjustment to increased tem-        from sources within the cold polar air are transported through
perature and stability (e.g. Lohmann and Feichter, 2001). The      the Arctic at lower altitudes. BC emitted from continental
aerosol–cloud interaction is suspected to significantly impact     areas in the Northern Hemisphere is mainly carried pole-
climate (IPCC, 2013), but the overall level of scientific un-      ward by mid-latitude low-pressure systems and is eventually
derstanding is still low (Bond et al., 2013). The aerosol in-      mixed across the polar front in the systems’ warm and cold
teractions with solar radiation and clouds not only depend on      fronts. These frontal systems, with lifetimes of 1–2 weeks,
concentrations, but also on microphysical properties of BC         are frequently generated and poleward mass transport is con-
particles, namely the size distribution and mixing state (Ko-      tinuously induced (Stohl, 2006; Sato et al., 2016). The po-
dros et al., 2018).                                                lar front retreats northward in the summer and leaves many
   Model studies of the Arctic climate system by Flanner           pollution sources south of this transport barrier. Increased
(2013) and Samset et al. (2013) emphasise that Arctic sur-         wet removal (scavenging) of aerosol particles is thought to
face temperatures have different sensitivities to BC’s ra-         help maintain much more pristine conditions throughout the
diative forcing, depending on the altitude at which absorb-        Arctic in summer, compared to winter and spring (Barrie,
ing aerosols are distributed. When absorption and scatter-         1986; Shaw, 1995; Garrett et al., 2011; Tunved et al., 2013;
ing through aerosols occur higher in the atmosphere, it has        Raut et al., 2017). This pronounced seasonal variability of

Atmos. Chem. Phys., 19, 2361–2384, 2019                                             www.atmos-chem-phys.net/19/2361/2019/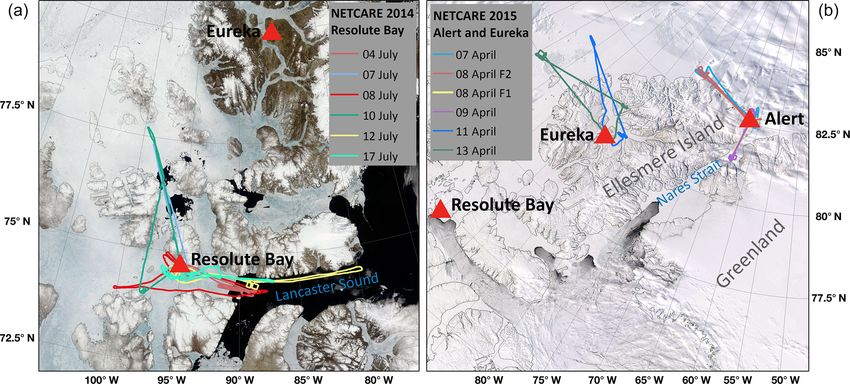
H. Schulz et al.: Black carbon vertical variability in the polar dome                                                         2363

BC concentration was observed at ground-based High Arctic           changes in the meteorological conditions and transport path-
measurement sites (e.g. Eleftheriadis et al., 2009; Massling        ways for air pollution in spring and summer.
et al., 2015; Sharma et al., 2017); however, the near-surface
air is decoupled from the middle and upper troposphere due
to the high stability of the atmosphere (Brock et al., 2011)        2     Methods and material
and these measurements cannot represent variability in the
vertical (Stohl, 2006). The concentrations of BC particles in       2.1     Spatial and temporal coverage of research flights
the lower atmosphere might be affected by increasing num-
                                                                    Aerosol observations were carried out with the Alfred We-
bers of local emissions. In fact, as the sea-ice retreat makes
                                                                    gener Institute’s (AWI) research aircraft Polar 6, a DC-3
the Arctic region more accessible, commercial activities in
                                                                    fuselage converted to a turboprop Basler BT-67 (see Herber
the marginal Arctic (the sea-ice boundary and boreal forest
                                                                    et al., 2008). This aircraft was specifically modified for polar
region), associated with flaring of gas in connection with oil
                                                                    research and allows flights at relatively low speeds and within
extraction (Stohl et al., 2013; Evans et al., 2017) and ship-
                                                                    an altitude range of 60–8000 m above mean sea level. A con-
ping (e.g. Corbett et al., 2010; Aliabadi et al., 2015), are in-
                                                                    stant survey speed of approximately 120 knots and ascent or
creasing. The possible consequences are an area of current
                                                                    descent rates of 150 m min−1 were maintained for vertical
research demand (Law et al., 2017). Models aiming to assess
                                                                    profiles.
the radiative forcing impact of Arctic aerosol have shortcom-
                                                                       The vertical atmospheric profile measurements were per-
ings in the representation of concentrations and size distri-
                                                                    formed during the aircraft campaigns of the NETCARE
butions as well as their vertical variability, which was partly
                                                                    project in summer 2014 and spring 2015 (Abbatt et al.,
attributed to incorrect treatment of scavenging processes in
                                                                    2018). The summer measurements took place from 4 to
parametrisations (Schwarz et al., 2010b; Liu et al., 2011).
                                                                    21 July 2014 and the aircraft was based in Resolute Bay
Therefore, vertically resolved observations of aerosol mass
                                                                    (74.7◦ N, 94.9◦ W), Nunavut, at the northern shores of Lan-
and size distributions are an important benchmark for chem-
                                                                    caster Sound in the Canadian Arctic Archipelago. During
ical transport models.
                                                                    spring, measurements on a total of 10 flights took place from
   Despite their important implications, measurements of the
                                                                    5 to 21 April 2015 as a traverse through the western Arctic
vertical distribution of BC and its variability in the Arctic
                                                                    with four stations: Longyearbyen (78.2◦ N, 15.6◦ E), Sval-
atmosphere are very sparse (AMAP, 2015). Aircraft cam-
                                                                    bard; Alert (82.5◦ N, 62.3◦ W), Nunavut, Canada; Eureka
paigns like ARCPAC, ARCTAS and POLARCAT (Spack-
                                                                    (80.0◦ N, 85.9◦ W), Nunavut, Canada; and Inuvik (68.4◦ N,
man et al., 2010; Brock et al., 2011; Kondo et al., 2011a;
                                                                    133.7◦ W), Northwest Territories, Canada. The map in Fig. 1
Matsui et al., 2011; Wang et al., 2011); PAMARCMIP (Stone
                                                                    details all flight tracks from both campaigns analysed in this
et al., 2010); HIPPO (Schwarz et al., 2010b; Schwarz et al.,
                                                                    study, which is a subset of research flights that took place
2013) and ACCESS (Law et al., 2017; Raut et al., 2017) de-
                                                                    north of the Arctic front and thus within or above the polar
livered limited numbers of BC vertical profiles from within
                                                                    dome. This selection is based on the extent of the polar dome
the cold High Arctic air mass. To increase the validity and re-
                                                                    defined in Bozem et al. (2019). Table 1 gives a list of the
duce biases of the vertical information on the presence of BC
                                                                    flights selected for this study.
in the Arctic, which is the basis of our system understanding,
high-latitude observations at better spatial and temporal res-      2.2     Measurements
olution are required. Such observations may resolve the in-
ternal variability due to weather changes as well as regional       2.2.1    Single-particle aerosol measurements
characteristics due to the prevailing atmospheric transport
pathways with respect to differences between the seasons.           A Single-Particle Soot Photometer (SP2; 8-channel) by
   This paper will discuss a set of measurements from the           Droplet Measurement Technologies Inc. (DMT, Longmont,
spring and summer aircraft campaigns in the NETCARE                 CO, USA) was used to detect BC particles. The opera-
project (Network on Climate and Aerosols: Addressing                tion principle and evaluations of the method are given by
Key Uncertainties in Remote Canadian Environments, http:            Stephens et al. (2003), Schwarz et al. (2006) and Moteki
//www.netcare-project.ca, last access: 10 February 2019).           and Kondo (2010). Briefly, the SP2 is based on the laser-
Motivated by the high sensitivity of the mechanisms of BC’s         induced-incandescence method: a concentric-nozzle jet sys-
radiative forcing in the Arctic climate system on its vertical      tem directs the aerosol sample flow through a high-intensity
distribution, the main goal of this study is to characterise the    continuous-wave intra-cavity laser beam at a wavelength of
vertical variability of BC concentrations and particle proper-      1064 nm, in which highly absorbing particles, such as BC,
ties in the polar dome, contrasting spring and summer. The          are heated to their vaporisation temperature and emit ther-
campaigns yielded a unique and detailed dataset from within         mal radiation (incandescence). Particles containing a suffi-
the polar dome at high latitudes, and covered timescales that       cient amount of BC (∼ 0.5 fg) can absorb enough energy to
give insight into the variability of aerosol distributions due to   reach incandescence, which excludes sensitivity to other, less
                                                                    absorptive material, such as organic carbon, brown carbon

www.atmos-chem-phys.net/19/2361/2019/                                                 Atmos. Chem. Phys., 19, 2361–2384, 2019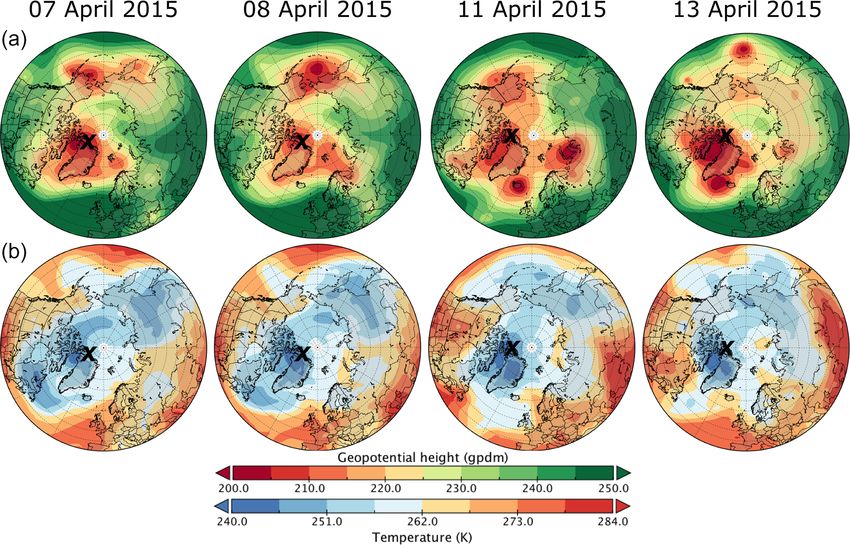
2364                                                          H. Schulz et al.: Black carbon vertical variability in the polar dome

Figure 1. Maps of all flight tracks evaluated in this study. The summer measurement flights were operated out of Resolute Bay on the northern
shore of Lancaster Sound, southern Canadian Arctic Archipelago (a). The spring campaign operated from Alert and Eureka on Ellesmere
Island (b). MODIS satellite true-colour images were obtained from https://worldview.earthdata.nasa.gov (last access: 10 February 2019).

Table 1. An overview of all measurement flights of the NETCARE summer campaign 2014 and the spring campaign 2015 that are evaluated
in this study. The stations are the Arctic airfields the plane started from and returned to (see Fig. 1). Two flights took place on 8 April 2015,
which are referred to with the shorthand notations F1 and F2.

   Campaign                Date             Station          Number of      Campaign               Date                Station    Number of
                                                               profiles                                                             profiles
   NETCARE summer          4 July 2014      Resolute Bay               4    NETCARE spring         7 April 2015        Alert                3
   NETCARE summer          7 July 2014      Resolute Bay               5    NETCARE spring         8 April 2015_F1     Alert                4
   NETCARE summer          8 July 2014      Resolute Bay               5    NETCARE spring         8 April 2015_F2     Alert                3
   NETCARE summer          10 July 2014     Resolute Bay               5    NETCARE spring         9 April 2015        Alert                4
   NETCARE summer          12 July 2014     Resolute Bay               4    NETCARE spring         11 April 2015       Eureka               4
   NETCARE summer          17 July 2014     Resolute Bay               5    NETCARE spring         13 April 2015       Eureka               2
                                            Total                     28                                               Total               20

or inorganic aerosol components. The peak intensity of the                 2010a; Laborde et al., 2012). The mass of these mono-
emitted thermal radiation, which occurs when the boiling-                  disperse particles was empirically calculated using the rela-
point temperature of BC is reached, is proportional to the BC              tionship between mobility diameter and the effective density
mass contained in the particle. Following the terminology de-              of fullerene soot (Gysel et al., 2011). The fullerene soot cal-
fined by Petzold et al. (2013), the refractory, essentially pure           ibrations used for the datasets of the two NETCARE cam-
carbon, material detected with the SP2 is hereafter referred to            paigns agreed to within ±10 % with each other, ensuring a
as refractory black carbon (rBC). All other particulates that              good degree of comparability between the two campaigns in
may be internally mixed with a BC core evaporate at temper-                agreement with the reproducibility of SP2 rBC mass mea-
atures below the boiling point of BC (∼ 4000 ◦ C) such that                surements evaluated by Laborde et al. (2012). After calibra-
no interference occurs in the quantification of the rBC mass               tion, the SP2 allowed 100 % detection efficiency of particles
(Moteki and Kondo, 2007).                                                  with mass in the range 0.6–328.8 fg, which is equal to 85–
   The incandescence light detector, a photomultiplier tube                704 nm mass equivalent diameter (DrBC ), assuming a void-
with a 350–800 nm band-pass filter, used two gain stages. It               free bulk material density of 1.8 g cm−3 . The SP2 was pre-
was calibrated with a fullerene soot standard from Alfa Ae-                pared for the research flights following the recommendations
sar (stock no. 40971, lot no. FS12S011) by selecting a nar-                given in Laborde et al. (2012). Stability of the optical sys-
row size distribution of particles with a differential mobil-              tem and laser power was confirmed during the campaign by
ity analyser upstream of the SP2 (following Schwarz et al.,                measuring mono-disperse polystyrene latex (PSL) spheres.

Atmos. Chem. Phys., 19, 2361–2384, 2019                                                       www.atmos-chem-phys.net/19/2361/2019/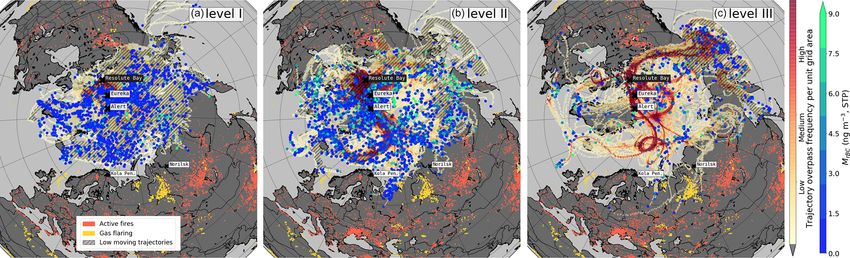
H. Schulz et al.: Black carbon vertical variability in the polar dome                                                         2365

An estimated total uncertainty of rBC mass concentrations            tained during the research flights and the non-pressurised
is 15 %, including reproducibility and calibration uncertainty       cabin of Polar 6 compared to the NOAA WP-3D aircraft
(Laborde et al., 2012) and uncertainties of airborne in situ         used for the measurements reported by Brock et al. (2011). In
measurements (e.g. precision of the sample flow measure-             the present work, the number ratio of rBC over TA particles,
ment). The SP2 was used to obtain rBC mass concentrations            RnumTA , was used to identify atmospheric layers influenced
(MrBC ), rBC number size distribution weighted by particle           by combustion-generated aerosol. It must be noted that, due
mass (mass size distributions, MSDs) and mass mean diam-             to the limited detection range of the UHSAS, the TA number
eters (MMDs) of rBC particles.                                       is biased low and RnumTA must therefore be considered as an
   The measured MrBC was not corrected for the mass of par-          upper estimate of the number fraction of rBC particles.
ticles outside the detection range and are thus only valid for          The air inlet for aerosol sampling was a shrouded inlet dif-
the range 85–704 nm. The contribution of small Aitken mode           fuser (diameter 0.35 cm at intake point) on a stainless steel
particles as well as particles larger than 704 nm to the to-         tube (outer diameter of 2.5 cm, inner diameter of 2.3 cm)
tal PM1 rBC mass (mass of particles smaller than 1000 nm)            mounted to the top of the cockpit and ahead of the engines to
may be significant and the measurements presented here can           exclude contamination. In-flight air was pushed through the
underestimate the total PM1 mass by variable degrees. Ap-            line with a regulated flow rate of approximately 55 L min−1 ,
proaches as used by Sharma et al. (2017), to estimate the            which was estimated to meet nearly isokinetic sampling cri-
total PM1 rBC mass by fitting a lognormal distribution to a          teria at survey speed. The transmission efficiency of particles
measured particle MSD, cannot be applied to aircraft mea-            with diameters between 20 and 1000 nm through the main
surements since MSDs vary with location and altitude and             inlet was approximately unity. The inlet is further discussed
statistics are insufficient to derive multivariate correction fac-   by Leaitch et al. (2016). The SP2 and UHSAS shared one
tors. The underestimation of the total PM1 mass due to the           bypass line off the main aerosol inlet and sampled with con-
contribution of particles smaller than 85 nm were calculated         stant 120 cm3 min−1 (volumetric) and 50 cm3 min−1 (at stan-
for selected cases to be an additional 4.5 % (between 2 %            dard temperature and pressure, STP), respectively. A higher
and 7 %) rBC mass in the summer polar dome, 7.5 % (be-               flow was maintained in the bypass using a critical orifice and
tween 4.5 % and 8.5 %) in the lower spring polar dome and            a vacuum pump at its end. The rBC mass and number con-
up to 10 % (7.8 %–12 %) within high-concentration pollu-             centrations presented in this study refer to standard tempera-
tion plumes. Assuming the SP2 was likely able to count               ture and pressure of 273.15 K and 1013.25 hPa, respectively,
(but not size) all particles between 700 and 1000 nm, an in-         as the volumetric flow was converted using temperature and
frequent (< 30 particles per flight) underestimation of the          pressure readings from the instrument’s measurement cham-
PM1 mass due to large particles occurred in spring in high-          ber.
concentration plumes as well as in the lower atmosphere. No
influence of particles larger than 700 nm was apparent for           2.2.2   Trace gases
summer conditions.
   The particle number size distributions and number concen-         Carbon monoxide (CO) was measured with an Aerolaser ul-
tration of the total aerosol (TA) were measured with a DMT           tra fast CO monitor model AL 5002 based on vacuum ul-
Ultra-High Sensitivity Aerosol Spectrometer (UHSAS). As              traviolet fluorimetry, using the excitation of CO at a wave-
described in Cai et al. (2008), the UHSAS measures the               length of 150 nm. The instrument was modified for apply-
scattered light intensity of individual particles crossing an        ing in situ calibrations during in-flight operations. Calibra-
intra-cavity solid-state laser (Nd3+ : Y LiF4 ), operating at a      tions were performed on a 15–30 min time interval during
wavelength of 1054 nm, to evaluate the particle size (under          the measurement flights, using a NIST traceable calibration
the assumption of the refractive index of PSL particles and          gas. The total uncertainty relative to the working standard of
spherical shape). The UHSAS can detect scattering particles          4.7 ppbv (summer) or 2.3 ppbv (spring) can be regarded as
over the range 85–1000 nm with 95 % counting efficiency              an upper limit. Further details of calibrations and corrections
below concentrations of 3000 cm−3 compared to a conden-              are presented by Bozem et al. (2019). Trace gases were sam-
sation particle counter (CPC) (Cai et al., 2008). Thus, the          pled through a separate inlet made of a 0.4 cm (outer diam-
instrument covers a size range comparable to the SP2’s rBC           eter) Teflon tubing entering the aircraft at the main inlet and
particle detection range. Fast changes in the aircraft’s verti-      exiting through a rear-facing 0.95 cm exhaust line that pro-
cal speed can cause a pressure difference between inlet and          vided a lower line pressure. An inlet flow of approximately
exhaust of the instrument and may affect the sample flow             12 L min−1 was continuously monitored.
measurements, and thus concentrations reported by standard              Atmospheric BC and CO are often co-emitted from the
UHSAS (Brock et al., 2011). Instrument modifications were            same combustion sources (Streets et al., 2003), but the rel-
recommended by Kupc et al. (2018). Cross-comparisons of              ative ratio of the species depends on the combustion type,
data from the non-modified UHSAS used in this study with             i.e. fuel types such as biomass or fossil fuel, and combustion
other aerosol counters (SP2, CPC) have, however, shown no            conditions, such as flaming, smouldering or (engine) internal
effects. This is likely due to the slow vertical speed main-         combustion. As opposed to aerosol, which is affected by dry

www.atmos-chem-phys.net/19/2361/2019/                                                 Atmos. Chem. Phys., 19, 2361–2384, 2019
2366                                                     H. Schulz et al.: Black carbon vertical variability in the polar dome

and wet removal mechanisms, CO can be used as a nearly             2.3    Model weather data and transport pathway
inert combustion tracer within timescales of a few weeks.                 analysis
This assumption is neglecting possible sources of CO due
to biogenic production or by means of oxidation of other           The ERA-Interim re-analysis data (Dee et al., 2011) from
trace gases (Gaubert et al., 2016). The ratio of rBC to CO         the European Centre of Medium-Range Weather Forecasts
relative to their background levels (RCO ) can be used as an       (ECMWF) are analysed at certain pressure levels in the form
indicator for when rBC particles were depleted by removal          of classical weather maps in order to understand the meteo-
processes (Oshima et al., 2012; Stohl et al., 2013). Based         rological situation in the Arctic during the period of our mea-
on the measured rBC and CO concentrations, the ratio is            surement flights. ECMWF operational data are further used
calculated as RCO = 1rBC/1CO = MrBC /1CO (with units               to drive the Lagrangian analysis tool (LAGRANTO: Wernli
ng m−3 ppbv−1 ). A background completely depleted of rBC           and Davies, 1997; Sprenger and Wernli, 2015) and its kine-
is assumed throughout the column as in previous studies (e.g.      matic back-trajectories are analysed to estimate the regions
Moteki et al., 2012; Kondo et al., 2016) due to the short          of origin for polluted air encountered during the research
atmospheric lifetime of BC of the order of days to weeks           flights. The model’s input data have a horizontal grid spacing
(Bond et al., 2013). The CO background value is altitude de-       of 0.5◦ with 137 hybrid sigma–pressure levels in the vertical
pendent (Supplement Fig. S1) and hence defined as the fifth        from the surface up to 0.01 hPa. Trajectories were initialised
percentile value of all CO mixing ratios observed within de-       every 10 s from coordinates along the research flight tracks
fined altitude intervals, following Kondo et al. (2016). RCO       and calculated 10 days back in time. The time series of tra-
is only calculated when 1CO exceeded the measurement un-           jectories along the track of the aircraft were correlated with
certainty.                                                         in situ measurement values, in order to relate individual fea-
                                                                   tures in the vertical profiles to an ensemble of trajectories
2.2.3   Meteorological parameters                                  (see Sect. 3.4). Due to the potential influence of wildfires
                                                                   and gas flaring on BC presence in the Arctic region, the spa-
The meteorological state parameters pressure, humidity and         tial distribution of gas flaring sites from the ECLIPSE (Eval-
temperature were recorded at 1 Hz resolution with the ba-          uating the Climate and Air Quality Impacts of Short-Lived
sic meteorological sensor suite and data acquisition of Po-        Pollutants) emission inventory (Stohl et al., 2015; Klimont
lar 6. The ambient air temperature was measured with a             et al., 2017) and active fires from the MODIS level 2 satel-
PT100-type sensor mounted to the aircraft fuselage in a            lite product (Giglio et al., 2003) were also considered for the
Goodrich/Rosemount 102 EK 1BB housing with de-icing fa-            interpretation of trajectory pathways.
cility. Corrections for the de-icing heat and adiabatic temper-
ature increase due to pressurisation of the airflow inside the
sensor housing (RAM raise and recovery factor) were ap-
                                                                   3     Results
plied to the temperature readings (following Stickney et al.,
1994). The relative humidity (RH) was measured with a              3.1    Meteorological overview
Vaisala humidity sensor HMT333 mounted inside a Rose-
mount housing Model 102 BX, which is also de-iced and              With the focus on the polar dome and the vertical distribu-
similar in its flow characteristics to the housing of the tem-     tion of rBC therein, subsets of the flights in spring 2015 and
perature probe. The saturation vapour pressure and RH are          summer 2014 were selected for this analysis. The subset se-
corrected with the actual ambient temperature from corrected       lections are based on the variability of the polar dome’s po-
PT100 readings. The potential temperature was calculated           sition and southern border. The structure and extent of the
from ambient temperature and the ambient pressure from a           polar dome in both seasons has been evaluated by Bozem
static pressure probe.                                             et al. (2019), who defined the polar dome based on trace gas
   A Forward Scattering Spectrometer Probe (FSSP), model           gradients measured during the NETCARE campaigns. They
100, by Particle Measuring Systems (PMS Inc., Boulder,             found that the polar dome boundary was, on average over
CO) was used for the measurement of cloud particles. Data          the course of the campaigns, located between 66 and 68.5◦ N
from the probe, which was mounted in a canister on a wing          in April 2015 and further north, at 73.5◦ N, in July 2014. The
pylon, were analysed in more detail in Leaitch et al. (2016).      upper boundary of the dome was found in a potential temper-
It contributes to the following analysis as an indicator of vis-   ature range between 283.5 and 287.5 K in spring and between
ible and invisible clouds by an empirically chosen threshold       299 and 303.5 K in summer. An operational estimation of the
above instrument noise level to the measured cloud particle        atmospheric circulation patterns confining the polar dome’s
concentrations (droplets and ice crystals). Aerosol data have      horizontal extent in the mid-troposphere can also be made by
been masked when the aircraft was in clouds.                       locating the maximum latitudinal gradients in geopotential
                                                                   height and temperature, as they indicate the position of the
                                                                   jet stream in the upper troposphere and pressure-driven wind
                                                                   systems in the lower troposphere, which surround and sta-

Atmos. Chem. Phys., 19, 2361–2384, 2019                                             www.atmos-chem-phys.net/19/2361/2019/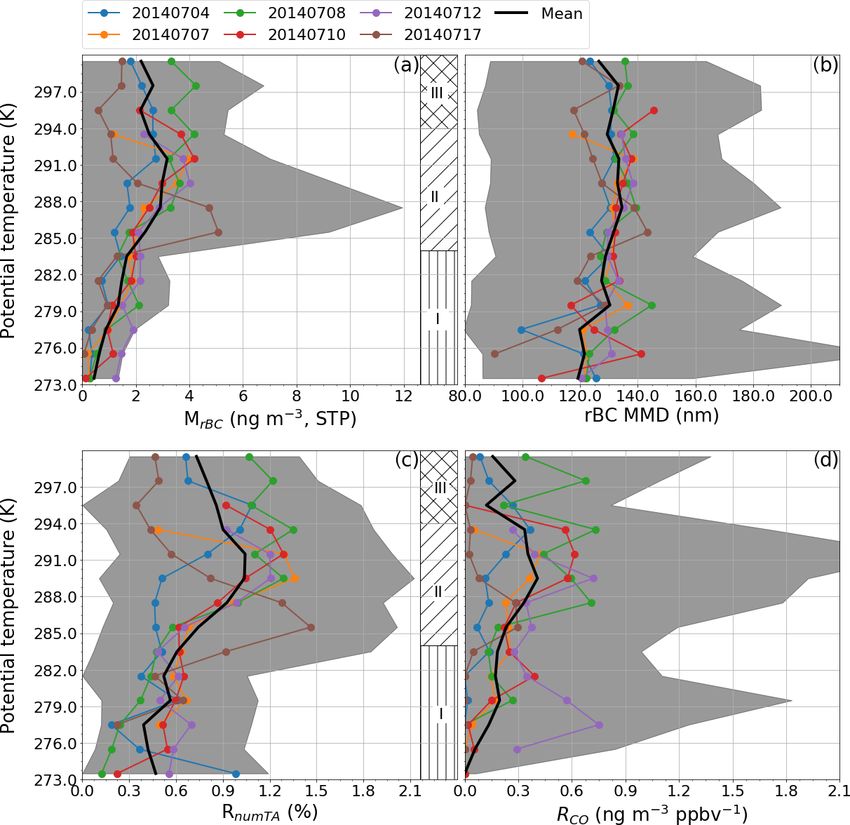
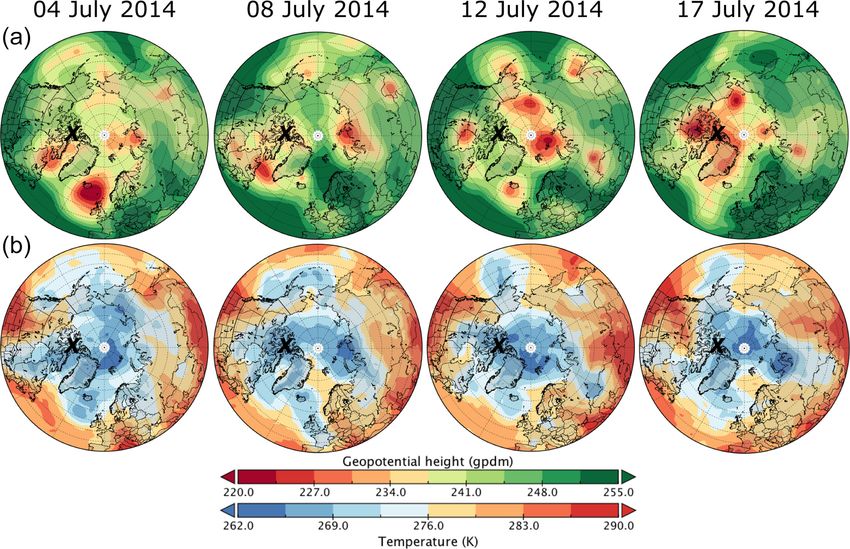
H. Schulz et al.: Black carbon vertical variability in the polar dome                                                            2367

Figure 2. Weather charts for the NETCARE spring campaign in April 2015 showing the 750 hPa geopotential height (a) and tempera-
ture (b) evolution over the duration of the campaign. The stations Alert or Eureka are marked with a black cross for the maps from 7 to
8 April and 11 to 13 April, respectively.

bilise centres of coldest air (Jiao and Flanner, 2016). Maps of       The atmosphere featured a low boundary layer height capped
these properties (Figs. 2 and 3 for spring and summer, respec-        by a distinctive temperature inversion leading to a very sta-
tively) are shown in this section in order to give an overview        ble stratification of the lower troposphere. Prevailing con-
of the measurement locations relative to synoptic features of         ditions for the research flights were clear skies, only a few
the atmosphere.                                                       or scattered clouds, and low wind speeds (Burkart et al.,
   The meteorological situation in April 2015 was dominated           2017). These conditions gave the opportunity to characterise
by a pool of very cold air centred over the Canadian Arctic           the summer polar dome in undisturbed conditions, when 6
Archipelago that surrounded the stations Alert and Eureka             flights with a total of 28 vertical profiles were conducted in
on Ellesmere Island. The cyclonic flow surrounding the cold           the study area around Resolute Bay on Lancaster Sound (see
air stabilised this system by blocking perturbations of low-          map in Fig. 1). Starting from 13 July 2014, the weather pat-
pressure systems (Fig. 2). The polar vortex was in a weak             tern changed and Resolute Bay got into the transition zone
state and not well defined. Cold air masses in the Russian            between polar and mid-latitudinal air, as a consequence of a
Arctic were cut off from the dome over the Canadian Arc-              low-pressure system coming from the north-western Beau-
tic Archipelago. Near the beginning of the measurement pe-            fort Sea and passing south of Lancaster Sound. Bad visibility
riod, a strong low-pressure system caused an outbreak of cold         due to fog, clouds and precipitation impeded flights until 17
air over eastern Europe, while warm mid-latitude air moved            July, on which day the study area shifted back into the cold
poleward further west. This synoptic feature affected Alert           air mass and a westerly air movement (Fig. 3).
strongest on 8 April, and its influence was diminishing dur-
ing the measurements around Eureka 11–13 April (Fig. 2).              3.2   Seasonal characteristics of rBC vertical
Conditions during all flights were low wind speeds and clear                distribution in the polar dome
sky with only a few, mostly thin clouds (Libois et al., 2016).
   The NETCARE summer campaign 2014 operated in an                    In this section, the vertical distribution of rBC is examined
area of the high Canadian Arctic that was situated within             with a focus on changes from spring to summer. For each
the summer polar dome. The first half of the campaign (4–             ascent or descent of the flights listed in Table 1, data points
12 July) was characterised by a northern influence (Fig. 3).          within fixed pressure–altitude intervals were averaged. These

www.atmos-chem-phys.net/19/2361/2019/                                                  Atmos. Chem. Phys., 19, 2361–2384, 2019
2368                                                   H. Schulz et al.: Black carbon vertical variability in the polar dome

Figure 3. Weather charts for the NETCARE summer campaign in July 2014 showing the 750 hPa geopotential height (a) and tempera-
ture (b) evolution over the duration of the campaign. Resolute Bay is marked with a black cross.

profiles were then successively averaged to mean flight pro-     Alaska), where pollution supply and removal not necessarily
files and mean regional profiles, thus avoiding sampling bi-     are in the same balance as within the polar dome. The balance
ases due to varying sampling times in each altitude interval.    between supply and removal (during transport or within the
Figure 4 shows that there are substantial differences between    Arctic) of rBC at high latitudes appears to have a pronounced
the average spring and summer profiles of rBC mass concen-       seasonality.
tration (MrBC ), mass mean diameter and rBC-to-TA-number            During spring, mean profiles from the Alert and Eureka re-
ratio (RnumTA ).                                                 gions showed a similar MrBC range; however, vertical trends
   The absolute and relative presence of rBC was generally       in MrBC showed certain differences between the two regions.
reduced during summer. Ground-based observations at High         At Eureka, the maxima of the mean profiles occurred be-
Arctic sites like Alert show a pronounced seasonal cycle in      tween 900 and 800 hPa with averaged MrBC of 55 ng m−3
rBC concentrations (e.g. Leaitch et al., 2013; Stone et al.,     and an interquartile range (IQR) of 11–120 ng m−3 . At a no-
2014; Sharma et al., 2017), which is well matched by the dif-    tably higher pressure–altitude of 730 hPa, the mean profile
ference in mean MrBC of observations in the lower part of the    from the Alert region reached up to 69 ng m−3 with an IQR
atmosphere (> 920 hPa) presented here. During spring, aver-      between 4 and 157 ng m−3 (Fig. 4a). Furthermore, high vari-
aged MrBC of 31.5 and 30.1 ng m−3 were present in the Alert      ability in MrBC occurred above 4000 m in the Eureka region.
and Eureka region, respectively, while summertime observa-       The fact that maxima occur at different, i.e. shifted, pressure–
tions showed a mean MrBC 1 order of magnitude lower at           altitudes may be due to the fact that profiles were flown at dif-
1.4 ng m−3 . Figure 4a shows that this seasonal difference was   ferent positions relative to the three-dimensional structure of
present throughout the vertical extent of the polar dome. A      the dome, thus finding the same isentropic surfaces at differ-
difference of 1 order of magnitude in MrBC between the sea-      ent altitudes. Given that both stations were within the same
sons was also found during the ARCTAS spring and summer          synoptic system (Sect. 3.1), transport patterns affecting both
campaigns in 2008 reported by Matsui et al. (2011). How-         regions are expected to be similar. These hypotheses are in-
ever, their observed MrBC were a factor of 2 higher compared     vestigated in Sect. 3.3 and 3.4. The overall range of rBC con-
to the NETCARE observations. This might be due to the fact       centrations is comparable with previous spring observations
that their observations were from a subarctic region (northern   reported for the European Arctic (Liu et al., 2015) and to

Atmos. Chem. Phys., 19, 2361–2384, 2019                                           www.atmos-chem-phys.net/19/2361/2019/
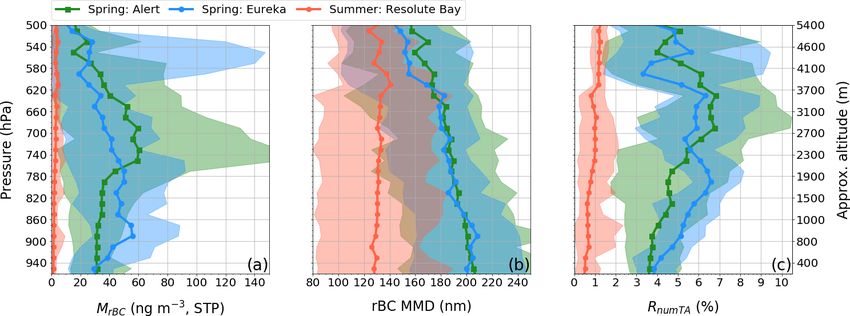
H. Schulz et al.: Black carbon vertical variability in the polar dome 2369
Figure 4. Mean regional vertical profiles of (a) rBC mass concentration, (b) mass mean diameter of rBC particles and (c) ratio of rBC to
TA particle number. Shaded areas indicate the minimum 25th and maximum 75th percentiles of all individual profiles included in the mean
profile. The altitude scale may only be used as a guide as it indicates the mean altitude above sea level of each pressure interval for the spring
atmosphere.
measurements from the mixed boundary layer over Europe cal structure of the polar dome with its core of cold, dense
(McMeeking et al., 2010). air at ground level and successive dome-shaped layers of
The spring profiles of MMD show a nearly steady decrease warmer air above. Stohl (2006) showed that the transport of
with altitude from 206 to 162 nm for Alert and 202 to 140 nm air parcels along isentropic surfaces supplies pollutants from
for Eureka (Fig. 4b). In contrast, the relative contribution of lower latitudes to certain levels of the polar dome. The alti-
rBC particles to the total aerosol particle number, RnumTA , tude of these surfaces depends on the depth of colder air be-
increased with altitude from around 4 % near the surface to neath and varies with the spatial extent of the polar dome in-
6 %–7 % on average aloft. RnumTA is particularly variable duced by synoptic conditions and orographic features. Sam-
within altitudes with increased MrBC (Fig. 4c). In general, the pling in different positions relative to the structure of the
rBC mass appeared to be distributed among higher numbers polar dome has induced variability to the profiles averaged
of smaller-sized rBC particles with increasing altitude. Max- over pressure–altitude intervals. Levels affected by different
ima in RnumTA were shifted upwards relative to the nearest transport patterns might be unveiled by adopting potential
maximum in MrBC . In contrast to the spring, summer-time temperature as a vertical coordinate, which is monotonically
MMD show a slight increase with altitude from the surface increasing in the stable polar atmosphere.
(129 nm) to about 600 hPa (140 nm; Fig. 4b). As pointed out The measurement periods in both seasons each covered an
in Bond and Bergstrom (2006), the mass absorption cross evolution cycle of a low-pressure system, causing a distur-
section of BC particles depends on, amongst other factors, bance of the polar dome’s structure (see Sect. 3.1). Those
the particles’ diameter. As a consequence, a concentration disturbances have altered existing transport pathways and fa-
of rBC mass in small particles could potentially contribute cilitated new ones, thereby affecting the vertical distribution
to an enhancement of the absorption coefficient of the to- of rBC. This variability in the vertical profiles is evaluated in
tal aerosol. However, the summer polar dome showed low Sect. 3.3.1 for spring and in Sect. 3.3.2 for summer.
values of MrBC (average of 2 ng m−3 with IQR 0–12 ng m−3
throughout the column) and low RnumTA (average of 0.75 %), 3.3.1 Vertical distribution of rBC in the spring polar
which rendered rBC a minor contributor to the total aerosol dome
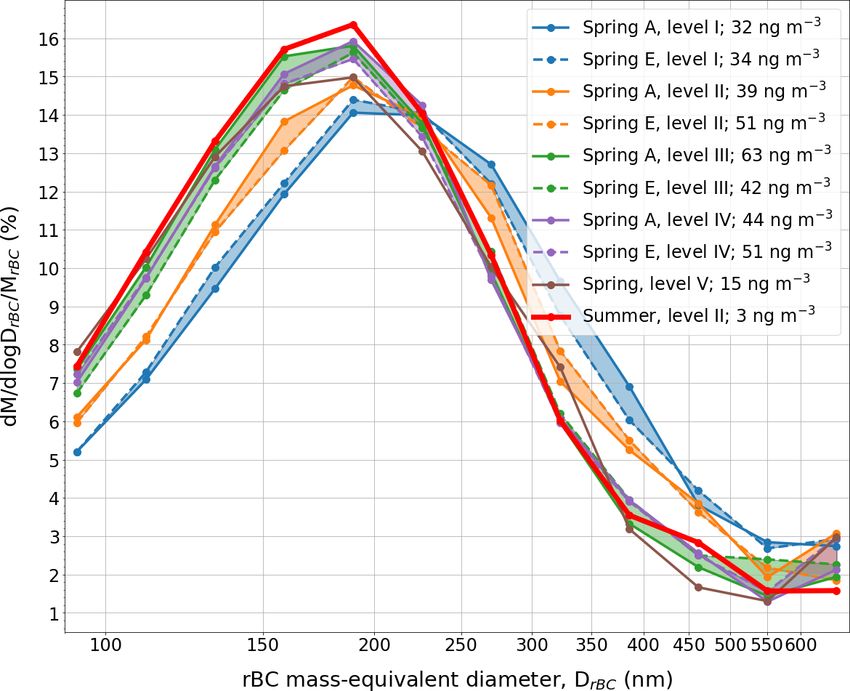
light extinction. A more detailed description of seasonal and
vertical variability of rBC particle diameters will be provided The spring mean flight profiles from Alert and Eureka av-
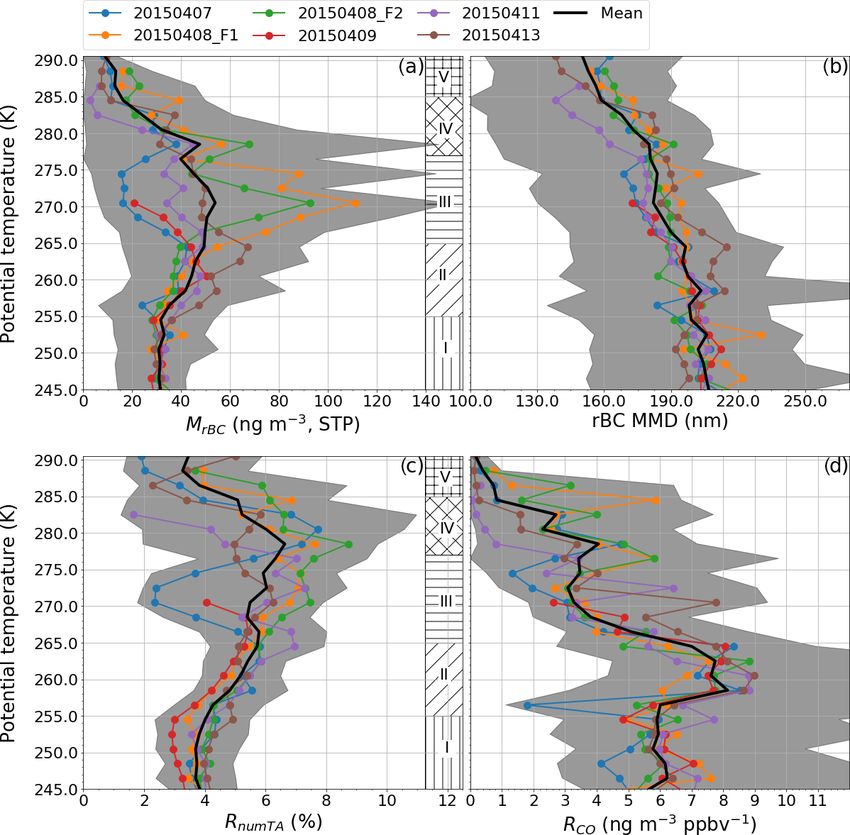
in Sect. 3.5. eraged over intervals of potential temperature are shown in
Fig. 5. Five different levels can be identified according to
3.3 Vertical distribution of rBC relative to potential vertical trends and variability patterns in MrBC , MMD and
temperature RnumTA as well as RCO (the ratio of enhancement over back-
ground level of rBC mass relative to CO mixing ratio, as
In order to fully understand the vertical variability of the defined in Sect. 2.2). The following analysis describes and
aerosol distribution, it is important to consider the verti- links patterns in the individual profiles of these properties,
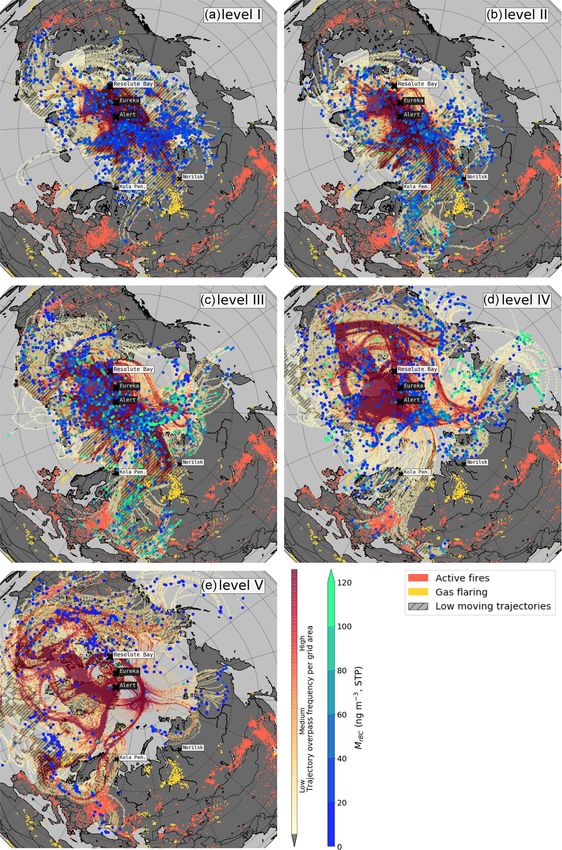
www.atmos-chem-phys.net/19/2361/2019/ Atmos. Chem. Phys., 19, 2361–2384, 20192370 H. Schulz et al.: Black carbon vertical variability in the polar dome Figure 5. Flight profiles averaged over intervals of potential temperature from the spring polar dome of (a) MrBC , (b) MMD, (c) RnumTA and (d) RCO . The grey shading around the mean over all profiles (black line) indicates the minimum 25th and maximum 75th percentiles of the flight profiles included in the mean. Five levels with different variability patterns as discussed in the text are marked with hatch patterns. aiming to identify possible implications for mechanisms af- seasons of the years 2011–2013 with 30±26 ng m−3 (Sharma fecting the aerosol, before source regions and transport pat- et al., 2017). Moreover, level I showed the highest average terns for these levels are investigated by means of a kinematic MMD of 204 nm (IQR: 153–250 nm). Such large mean rBC back-trajectory analysis in Sect. 3.4. The vertical boundaries particle diameters were already observed at the surface in the of the five levels are confined within strong temperature gra- European Arctic in spring (Raatikainen et al., 2015; Zanatta dients, which can be found in all profiles, but with slight et al., 2018) and are distinctly different from freshly emit- variation in strength and potential temperature range. How- ted rBC (MMD of ∼ 100 nm) in urban areas (Laborde et al., ever, the vertical location of the gradients varies in relation 2013). to pressure–altitude by up to 1000 m between individual pro- Although rBC represented a minor component of the to- files (Fig. S1a). tal aerosol in the respective size range by number, with The profiles in Fig. 5 show a homogeneous distribution of an averaged RnumTA of 3.8 % that was low with respect to rBC with a mean MrBC of 32 ng m−3 (IQR: 13–48 ng m−3 ) higher levels, rBC mass was comparably high relative to co- that was present in a temperature gradient capped surface emitted CO with a mean RCO of 5.7 ng m−3 ppbv−1 (IQR: layer (level I), which was the coldest air encountered with 2.7–10.5 ng m−3 ppbv−1 ). This ratio is difficult to compare temperatures of 255 down to 245 K. The observed MrBC to observations from the literature, because, although ranges across the lowest flight sections matches well with the mean of values have been attributed to specific combustion source ground-based rBC observations performed in Alert for spring types, all air masses sampled for these studies were subject Atmos. Chem. Phys., 19, 2361–2384, 2019 www.atmos-chem-phys.net/19/2361/2019/
H. Schulz et al.: Black carbon vertical variability in the polar dome                                                          2371

to different ageing timescales. This led to significant vari-        all average concentration of rBC in level III was 49 ng m−3 .
ations in reported RCO (Liu et al., 2015). Besides particle          The enhancement of rBC mass concentration, together with
removal altering RCO , air pollution from different sources          a decrease in the mean RCO and MMD potentially suggests
may become mixed in the source region or within the po-              different transport or removal regimes compared to the lower
lar dome, thus blending the ratio of rBC to CO. RCO around           atmospheric levels. The ratios RnumTA and RCO as well as
4–9 ng m−3 ppbv−1 were observed by Stohl et al. (2013) at            MMD were significantly below average on 7 April, while
Mt. Zeppelin on Svalbard, in the European Arctic, in an              supply of polluted air set in on 8 April and lasted over
air mass influenced by transport from northern Russian gas           the course of the observation period with variable intensity.
flaring sites. A similar range was observed by Liu et al.            The Arctic-haze-like polluted layers with highest MrBC were
(2015), who profiled between northern Norway and Svalbard            not connected to high RCO . Compared to the lower polar
in spring during transport influence from Europe and Asia.           dome, only half as much rBC as CO is transmitted with
Moreover, different combustion processes lead to a wide              the pollution plumes in level III, leading to a mean RCO of
range of RCO values: While fossil fuel combustion induces            3.9 ng m−3 ppbv−1 (1.5–8.0 ng m−3 ppbv−1 ).
RCO values of approximately 6±1.0 ng m−3 ppbv−1 (Spack-                 The potential temperature range 277–285 K (level IV) was
man et al., 2008; Kondo et al., 2016), Mikhailov et al. (2017)       in the transition zone to the air mass above the dome (Bozem
observed RCO values of 1.2–5.0 and 10–20 ng m−3 ppbv−1               et al., 2019). Within a temperature gradient zone marking the
in conjunction with boreal forest and grassland fires, respec-       upper boundary of the dome, all profiles peak before sharply
tively. Due to this large spread of values, it is neither possible   decreasing in the air mass above. This transition is also ap-
to identify rBC depletion by wet removal, nor to discriminate        parent in a gradient of trace gas concentrations (Bozem et al.,
source types based on absolute values for remote regions like        2019) and occurs at slightly varying temperature. The maxi-
the Arctic. However, deviations of RCO from the mean of              mum MrBC on 8 April was comparable to that in the level be-
each atmospheric level might help in identifying the dom-            low, but high RCO around 6 ng m−3 ppbv−1 suggest a differ-
inant factor controlling the rBC mass concentration and its          ent, more efficient transport to this level. MrBC on the higher
particle size distribution.                                          end of the IQR in level IV (145 ng m−3 ) was encountered by
   Concentrations and mixing ratios of rBC increased from            one out of three profile flights on 11 April. The other two
the surface to level II, which was in the potential temperature      profiles included in the mean of that day encountered air de-
range of about 255–265 K. The mean MrBC was 44 ng m−3                pleted in rBC, where low MMD as well as RCO suggest sub-
(IQR: 15–79 ng m−3 ) and mean MMD was 198 nm (IQR:                   stantial removal of rBC from the air mass by precipitation.
143–251 nm). The Eureka profiles (11 and 13 April) show              However, rBC reached its maximum contribution to the TA
higher MrBC at this level than observed around Alert. The            by number with mean RnumTA of 6.2 % in level IV.
highest overall RCO occurred within this level with a mean              Bozem et al. (2019) defined the region of potential tem-
of 7.4 ng m−3 ppbv−1 (IQR: 3.8–12.0 ng m−3 ppbv−1 ). Pro-            peratures higher than about 287 K (level V) to be in the tran-
files from the Eureka region, especially those of 13 April,          sition zone to the troposphere above the polar dome with a
showed above-average MrBC together with maxima in RCO                strong negative gradient in CO concentrations and stronger
(8–9 ng m−3 ppbv−1 ) and MMD (215 nm), which suggests                connection of transport trajectories to mid-latitudes. At the
that either removal along the transport pathway was lower            highest altitudes of the profiling flights, low MrBC (average of
or pollution from a different mix of sources was entrained           13 ng m−3 with IQR: 0–34 ng m−3 ) and a decrease in MMD
into the air mass, or a combination of both took place. rBC          (average of 155 nm with IQR: 106–191 nm) combined with
mass size distributions, and therefore also MMDs, are known          a low RCO (0.7 ng m−3 ppbv−1 ) suggest that polluted air was
to exhibit systematic differences between biomass burning            transported to this level, but lost much of the BC by wet scav-
and fossil fuel combustion (Kondo et al., 2011b; Sahu et al.,        enging induced during lifting of the air parcels.
2012). While the measured RCO in this level were compa-                 Different transport pathways between the described levels
rable to the above-mentioned literature values from fossil-          as well as the temporal variability of transport to each layer
fuel-combustion-influenced air masses, the range of observed         are investigated in Sect. 3.4.1 by means of an air parcel back-
MMD is more similar to biomass burning plumes. This sug-             trajectory analysis.
gests that a complex mixture of rBC from different sources
as well as less efficient wet removal occurred during trans-         3.3.2   Vertical distribution of rBC in the summer polar
port, since wet removal will decrease the MMD (e.g. Browse                   dome
et al., 2012; Taylor et al., 2014; Kondo et al., 2016).
   The highest variability in rBC abundance and its properties       The variability of aerosol properties was also investigated for
was present between 265 and 277 K (level III). At the begin-         summer as a function of the potential temperature within the
ning of the observation period (7 April), low mean MrBC of           polar dome over the area of Resolute Bay (Fig. 6). As al-
17 ng m−3 (IQR: 4–22 ng m−3 ) was measured, while the two            ready introduced in Sect. 3.2, the general concentration of
flights on 8 April encountered significantly higher concen-          rBC particles was almost 1 order of magnitude lower and the
trations up to 111 ng m−3 (IQR: 65–151 ng m−3 ). The over-           variability in the distributions had a lower absolute magni-

www.atmos-chem-phys.net/19/2361/2019/                                                 Atmos. Chem. Phys., 19, 2361–2384, 2019
2372                                                         H. Schulz et al.: Black carbon vertical variability in the polar dome

Figure 6. Flight profiles averaged over intervals of potential temperature from the summer polar dome of (a) MrBC , (b) MMD, (c) RnumTA
and (d) RCO . The grey shading around the mean over all profiles (black line) indicates the minimum 25th and maximum 75th percentiles
of the flight profiles included in the mean. Three levels with different variability patterns, as discussed in the text, are marked with hatch
patterns.

tude than the spring observations. Two strong temperature                   A weakly stable to neutral atmospheric level was present
gradients (Fig. S1b) structured the atmosphere below 5 km                above the stable near-surface level and up to a strong tem-
into three levels in which similar vertical tendencies of rBC            perature gradient aloft (level II). MrBC was relatively con-
concentration and mixing ratios were observed.                           stant within the lower part of level II, but increased within
   Close to the surface, within air at potential temperatures            the temperature gradient zone in its upper part. This zone
between 273 and 284 K (level I), the 75th percentile MrBC did            lay around 288–294 K (Fig. S1b) in the period before the
not exceed 3.3 ng m−3 . Concentrations in the same order of              weather change (4–12 July) and lower, around 284–290 K,
magnitude (1 ng m−3 ) were already observed over the Arctic              on 17 July after the perturbation of the polar dome by a low
ocean (Taketani et al., 2016). rBC represented a minor com-              pressure system (see Sect. 3). The altitude of the gradient
ponent of the TA throughout the vertical column; however,                zone was changing amongst individual profiles flown in dif-
the lowest values were recorded at low altitude, where mean              ferent regions and was likely affected by orography and the
RnumTA was 0.5 %. The RCO well below 1 ng m−3 ppbv−1                     variable sea-ice cover (see map in Fig. 1). High humidity was
suggested, combined with the low particle diameter (aver-                frequently observed in the neutral or weakly stable zone be-
age MMD of 125 nm), that particles in the summer polar                   low the temperature gradient. The highest MrBC values up
dome were subject to strong wet removal. The MMD val-                    to 12 ng m−3 were encountered around 286 K on 17 July,
ues show a larger variance amongst the different profiles due            while in the earlier measurement period, the mean profiles
to a scarcity of particles in the statistics.                            of MrBC peak at only around 4 ng m−3 , which is, however,

Atmos. Chem. Phys., 19, 2361–2384, 2019                                                     www.atmos-chem-phys.net/19/2361/2019/
H. Schulz et al.: Black carbon vertical variability in the polar dome                                                        2373

still a factor-of-2 increase over the concentrations within the    were 10 days prior to release are marked by dots colour coded
less stable lower part of this level. Also the relative presence   with the rBC concentrations measured during the flights at
of rBC showed a significant difference between the two parts.      the trajectory initialisation position.
RnumTA reached a mean of 1.3 % (1.7 %) within the concen-
tration peaks in the first (second) period, while the back-
                                                                   3.4.1   rBC source areas for the spring polar dome
ground in the lower part was around 0.6 %. Similarly, RCO
was 0.2 ng m−3 ppbv−1 in the background and mean profiles
reached 0.6 ng m−3 ppbv−1 within concentration peaks in the        The aerosol over Alert and Eureka in the period 7–13 April
first period. Although the highest rBC concentrations were         was influenced by air transport from eastern Europe, central
encountered on 17 July, RCO of 0.0–0.3 ng m−3 ppbv−1 indi-         Asia and Siberia as well as North America (Fig. 7). In those
cates that rBC aerosol was strongly depleted relative to co-       regions lobes of cold polar air reached south due to cyclonic
emitted CO, which featured elevated concentrations through-        perturbations of the polar front (Fig. 2).
out the column compared to the first weather period of stable         Confined by the cyclonic winds around the polar dome
northern influence (Fig. S1b).                                     and due to the lower wind speed within it (Sect. 3.1), the
   The highest investigated level (III) of the atmosphere was      back-trajectories initiated in the lowest level (potential tem-
characterised by potential temperatures above 294 K, and           perature 245–255 K) showed a long residence time within the
most probably represented a strong temperature gradient sep-       Arctic region at low altitude (Fig. 7a). The majority of trajec-
arating the polar dome from free tropospheric conditions. In       tories was not leaving the cold polar air mass at all (compare
fact, Bozem et al. (2019) identified the upper boundary of         Fig. 2). Despite that, the limited horizontal extent of the po-
the summer polar dome in the potential temperature range           lar dome (Bozem et al., 2019) largely prevented the intrusion
of 299–303.5 K. Three flights reached this potential temper-       of combustion-generated aerosol from lower latitudes, and
ature level at higher altitudes and show relatively large vari-    background rBC mass concentrations of around 30 ng m−3
ability of rBC absolute and relative concentrations, which are     were maintained over the whole measurement period. Higher
within the range of background and elevated concentrations         MrBC values (> 60 ng m−3 ) were measured when trajectory
found in the lower levels. Generally, MrBC was higher than         paths suggest that pollution supply by low-level transport
at the surface with an IQR of 0.0–6.7 ng m−3 .                     was possible from northern Siberia. This region is associ-
   Air parcel back-trajectories were analysed for Sect. 3.4.2      ated with intense natural resource exploitation activities. Po-
below to identify transport patterns and source areas of the       tentially accessible for the trajectories to pick up pollutants
summer polar dome for (1) the near-surface layer, (2) the          were the regions of the nickel mines and smelters in Norilsk
mixed atmosphere and strong temperature gradient zone with         (Siberia) and on Kola Peninsula (Fig. 7), which are known to
increased MrBC , and (3) the outer polar dome up to its bound-     be high-emitting sources of gases and particulates together
ary.                                                               with their associated marine traffic (Arctic Council, 2009;
                                                                   Stohl et al., 2013; Law et al., 2017; Roiger et al., 2015, and
3.4   Transport patterns and source areas                          references therein). Also potentially accessible for poleward
                                                                   transport was the oil-rich region of Khanty-Mansy south-
Kinematic back-trajectories were calculated in order to dis-       west of Norilsk where gas flaring emits BC (Evans et al.,
cern different contributions of potential source regions to        2017; Winiger et al., 2017), as indicated by the ECLIPSE
the changing characteristics of aerosol properties observed        BC emission inventory data in Fig. 7. On the other hand, air
within the potential temperature levels identified above in        masses originating over North America were associated with
Sect. 3.3. For their analysis, gridded overpass frequencies        low rBC mass concentration.
were calculated based on the hourly positions of trajectories         Compared to the surface, the mass concentration of rBC
initiated every 10 s along the flight paths, weighted with the     significantly increased in the two levels between 255–
0.5◦ × 0.5◦ grid area and normalised by the total number of        265 K (II) and 265–277 K (III). In fact, the highest MrBC val-
back-trajectories for each case. Figures 7 and 8 in the follow-    ues observed in these layers were associated with low-level
ing subsections show the overpass frequencies displayed as         transport pathways originating at mid-latitudes over western
heat map overlays. A hatching highlights grids where trajec-       Russia and central Asia (Fig. 7b, c). Moving from level II to
tories travelled at atmospheric pressures > 920 hPa, which         III, the cyclonic perturbations at the polar front favoured ad-
is equal to less than about 0.5 km. Climatological boundary        ditional entrainment of rBC from over the Russian far east.
layer heights over Europe are typically < 1 km during day-         Although transport from North America took place into the
time (Seidel et al., 2012); thus pollution uptake from surface     western Arctic, it did not cause any substantial increase in the
sources may be possible in a well-mixed atmosphere in the          observed MrBC . The frontal and orographic lifting, to which
hatched areas in contrast to trajectories moving in the up-        air parcels originating from North America are often sub-
per atmosphere or being already lifted well above the bound-       jected on the way into the Arctic (e.g. Stohl, 2006; Quinn
ary layer due to vertical motion in synoptic-scale systems.        et al., 2011), was likely accompanied by precipitation events
Trajectory end points with the location where the air parcels      and subsequent aerosol removal (Pozzoli et al., 2017), thus

www.atmos-chem-phys.net/19/2361/2019/                                               Atmos. Chem. Phys., 19, 2361–2384, 2019
You can also read